kinetic modeling of simultaneous saccharification and ... · kinetic modeling of simultaneous...
TRANSCRIPT
Regular paper
Kinetic modeling of simultaneous saccharification and fermentation of corn starch for ethanol production*Wojciech Białas*, Adrian Czerniak and Daria Szymanowska-PowałowskaDepartment of Biotechnology and Food Microbiology, Poznan University of Life Sciences, Poznań, Poland
Fuel ethanol production, using a simultaneous sacchari-fication and fermentation process (SSF) of native starch from corn flour, has been performed using Saccharomy-ces cerevisiae and a granular starch hydrolyzing enzyme. The quantitative effects of mash concentration, enzyme dose and pH were investigated with the use of a Box-Wilson central composite design protocol. Proceeding from results obtained in optimal fermentation condi-tions, a kinetics model relating the utilization rates of starch and glucose as well as the production rates of ethanol and biomass was tested. Moreover, scanning electron microscopy (SEM) was applied to investigate corn starch granule surface after the SFF process. A maximum ethanol concentration of 110.36 g/l was ob-tained for native corn starch using a mash concentration of 25%, which resulted in ethanol yield of 85.71%. The optimal conditions for the above yield were found with an enzyme dose of 2.05 ml/kg and pH of 5.0. These re-sults indicate that by using a central composite design, it is possible to determine optimal values of the fermen-tation parameters for maximum ethanol production. The investigated kinetics model can be used to describe SSF process conducted with granular starch hydrolyzing en-zymes. The SEM micrographs reveal randomly distribut-ed holes on the surface of granules.
Key words: native starch; optimization, modeling, kinetics, simulta-neous saccharification and fermentation
INTRODUCTION
Ethanol, a chemical alternative to petroleum-derived fuel, is produced from fermentation of carbohydrates such as starches, which are present in plants. Ethanol provides a renewable energy source that produces a number of additional benefits, including limited green-house gas emissions and creation of new employment opportunities by enhancing economic benefits in rural areas (Wyman, 2003).
It is well known that fermentation of starch is more complex than fermentation of sugars such as glucose or sucrose, because starch must first be converted into fermentable sugars and then into ethanol. To reach an almost total degradation of starch, two main groups of amylolytical enzymes are required: one comprised of liq-uefying thermostable α-amylases, and the other of sac-charifying glucoamylases (Senn & Pieper, 2001). In con-ventional ethanol technology, a starchy feedstock such as corn flour, is first slurried with water containing a heat-
stable α-amylase. The preliminary addition of α-amylase is required in order to decrease the viscosity of the mash and to facilitate the cooking operation. This slurry is then cooked at high temperatures (90–95oC) to gelati-nize and liquefy the starch. During the mashing process, starch polymer is hydrolyzed by α-amylase to produce shorter chains, namely dextrins, maltose and maltotriose. The resulting mash is then cooled to 60oC and a glucoa-mylase is added which converts dextrins to fermentable sugars, these being mainly glucose and maltose (Power, 2003). In the final step of the process, yeast are added and incubated at temperatures below 35oC for 48–72 h to ferment the sugars to ethanol. Due to the high energy consumption during the mashing process, the current production cost of traditional starch substrate processing for ethanol are high. According to Lim et al. (2003) the energy demand of the conventional cooking process is equivalent to 30–40% of the fuel value of ethanol pro-duced. Hence to compete with the existing fossil fuel in-dustry and become commercially viable, the cost must be reduced.
There are several possible ways to approach this prob-lem. The most straightforward is to design new amylases capable of raw starch digestion (GSHE — the granular starch hydrolyzing enzymes). It is well known that amyl-ases from cereals are capable of hydrolyzing raw starch, which is essential in the breakdown of stored carbohy-drates. In addition to green plant sources, enzymes re-ported to have the ability to digest raw starch were also found in microbial sources. Recently, seven highly active enzyme systems with raw starch hydrolytic capabilities were created by using biological combinatorial processes, using naturally occurring amylases. According to Rob-ertson et al. (2006) these systems have the potential to overcome limitations of a natural set of enzymes utilized currently. Application of tailored GSH enzymes elimi-nates the cost-intensive liquefaction cooking step, and thus reduces the energy input per unit of ethanol pro-duced. In addition to the advantages already mentioned, another attractive feature of this enzymatic complex is that it can be used to break down starch molecules in very concentrated mashes, in which the dry solid content *e-mail: [email protected]*Presented at the 3-rd Workshop on Microbiology „MIKROBIOT 2013” in Łódź, Poland.Abbreviations: St, starch concentration (kg/m3); Glu, glucose con-centration (kg/m3); X, biomass concentration (kg/m3); Et, ethanol concentration (kg/m3); Enz, enzyme concentration (U/m3); kSt, rate constant (kg/U.h); K, inhibition and saturation constants (kg/m3); Km, Michaelis’ constant (kg/m3); Qp, specific ethanol production rate (1/h); R, starch utilization rate (kg/m3/h); RGlu formation, glu-cose formation rate (kg/m3/h); RGlu utilization, glucose utilization rate (kg/m3/h); Yp/s, yield coefficient of product (kg/kg); Yx/s, yield coefficient of cell growth (kg/kg); T, time (h); µ, specific growth rate (1/h). Subscripts: 0, initial; max, maximum
Received: 30 October, 2013; revised: 25 February, 2014; accepted: 27 February, 2014; available on-line: 20 March, 2014
Vol. 61, No 1/2014153–162
on-line at: www.actabp.pl
154 2014W. Białas and others
oscillates in the range of 12–38% wt. Possible drawbacks of this technology include the cost and the amount of enzyme required for the process, and the increased chance of microbial contamination and corresponding loss of yield because partial pasteurization of the mash during the heating process does not occur. The heat ap-plied during standard ethanol process also helps to re-lease the starch that is bound to a fiber or proteins, and inactivates some toxins that may be present in the grain (Nichols et al., 2006).
Great attention is being paid to optimization of the fermentation processes. It is well known that when starch is used as a raw material, amylases are strongly inhibited by hydrolysis products, such as glucose. This inconvenience can be overcome by a simultaneous sac-charification and fermentation process (SSF), which combines enzymatic hydrolysis with fermentation. Fur-thermore, the SSF process also reduces osmotic stress since the yeast cells are exposed to a relatively lower sug-ar concentration, thereby offering a possibility of higher production rates. An additional advantage of SSF is that a multistage process for the conversion of starch into ethanol is carried out in one bioreactor, which provides not only a reduction in the overall fermentation time but also a reduction in the investment and operational costs (Kobayashi et al., 1998). However, in spite of these ad-vantages, there are some drawbacks of using SSF, such as different optimal temperatures for the action of α- and glucoamylase and the growth of yeast, which means that conditions used in SSF cannot be optimal for both, the enzymes and the yeast (Öhgren et al., 2007). Thus, the SSF temperature, which is usually around 35oC, is a compromise between optimal temperatures for hy-drolysis and fermentation. According to Philippidis & Smith (1995), hydrolysis is the main rate-limiting process in SSF, hence in recent years thermotolerant yeast and bacteria have been used to raise the process tempera-ture close to the optimal hydrolysis temperature. Ward et al. (1995) found that a thermotolerant yeast Kluveromyces marxianus in a mixed culture with thermophilic filamen-tous fungi Taloromyces emersonii, produced ethanol with a high yield at 45oC, using a starch-containing media as a substrate.
Since 1970 the SSF process has been used and men-tioned in general reports (Verma et al, 2000; Öhgren et al., 2006) but little has been cited on the SSF optimi-zation of raw corn flour with a combination of GSHE amyloglucosidase and yeast Saccharomyces cerevisiae. There-fore the present work was carried out to identify optimal process conditions for the simultaneous saccharification and fermentation of granular corn starch using GSHE amyloglucosidase and Saccharomyces cerevisieae Ethanol Red yeast through a response surface methodology. Addition-ally, an unstructured kinetic model describing the rate of change in the starch, glucose and ethanol, as well as the biomass concentration, has also been tested.
MATERIALS AND METHODS
Raw material. Commercially available corn flour (BIO CORN, Ziebice, Poland) was used as a raw mate-rial for fermentation. It had a median diameter of 250 μm, and contained 12.8% water, 90.05% starch, and 0.1% ash.
Yeast. A freeze dried distiller’s yeast, Ethanol Red (Saccharomyces cerevisiae), obtained from Lesaffre Company (Marcq en Baroeul, France) was used in this study for production of ethanol from the corn mashes. The num-
ber of living cells at packing was above 2.0 × 10¹⁰/g, as defined by the manufacturer.
Enzymes. A mixture of granular starch hydrolyz-ing enzymes, containing Aspergillus kawachi α-amylase expressed in Trichoderma reesei, and a glucoamylase from Aspergillus niger were employed in this study (STARGEN 001, Genencore International, USA). The enzymatic ac-tivity of this set of enzymes was ≥456 GSHU/g (Granu-lar Starch Hydrolyzing Units), as defined by Genencore International. In addition, fungal acid protease GC 106 (Aspergillus niger), also obtained from Genencore Interna-tional, was added to the mashes. The enzymatic activ-ity of GC 106 was ≥1000 SAPU/g (Spectrophotometric Acid Protease Units), as defined by the manufacturer.
Other chemicals. All other chemicals used in this study, purchased from various commercial suppliers, were of analytical grade purity.
Experimental design and statistics. The SSF opti-mization, by the classical method of a single-dimension-al search involving changing of one variable while fix-ing the others at a certain level, is laborious and time-consuming, especially when the number of variables is large. Furthermore, the other significant disadvantage of the one-factor-at-a-time strategy is that it fails to con-sider any possible interactions between factors. In fact, if interactions are present and the factorial experimental strategy is not used, incorrect or misleading results may be obtained (Montgomery, 2001). An alternative and more efficient approach to the investigation of a fermen-tation systems is the use of statistical methods. Many statistical experimental design methods are currently be-ing employed in bioprocess optimization. Among these, response surface methodology (RSM), which employs a combination of mathematical and statistical techniques, is the one most suitable for identifying the effect of in-dividual independent variables and their interactions, and for seeking optimal conditions for a multivariable system efficiently (Montgomery & Runger, 2003). A three-factor (k = 3), five-level central composite design (CCD) was used in this study. The effects of corn flour concentra-tion in the mash (X1), the dose of GSHE (X2) and the mash pH (X3), were selected as process (independent) variables. Ethanol concentration (Y1, g/l), and the overall process yield (Y2, % of theoretical ethanol yield) were the responses (dependent variables). As shown in Table 1 the variable levels Xi were coded as xi according to the following equation (1):
where xi is the dimensionless value of an independent variable, Xi the real value of an independent variable and X(min)i, X(max)i are the lower and the upper limit of the in-dependent variable, respectively. The set points were se-lected according to the results obtained during a prelimi-nary study. This design was chosen for its ability to esti-mate second-order effects, to detect the interrelationship between the factors, and to identify the response optima according to the experimenter formulated criteria. This experimental plan was divided into three blocks, com-prised of 20 actual experiments and including 6 repli-cates. Replication allowed determination of experimental error and increased precision of the estimates. The order in which experiments were performed was randomised, according to the requirement for observations to be dis-tributed independently and randomly which, in addition, helps to avoid the influence of unknown nuisance vari-
Vol. 61 155Kinetic modeling of simultaneous saccharification and fermentation of corn starch
ables. The design matrix of the central composite design (CCD) for k = 3 is shown in Table 2.
A multiple regression analysis of the data was carried out in order to obtain empirical models that define the response (Yi) in terms of the independent variables:
Coefficients of the polynomial, represented by b0 (constant term), bk (linear effects), bkk (quadratic effects), and bk-1.k (interaction effects) were correlated to the re-sponses (Yi). Statistical analysis was carried out in coded data sets in order to simplify interpretation of the re-sults. The accuracy and general ability of the above poly-nomial model was evaluated by an adjusted coefficient of determination Adj-R2, the significance of total regress F-value and the non-significance of lack of fit F-value. The commercial software STATISTICA, version 6.0 PL from StatSoft, Inc., was used for regression and graphi-cal analyses of the data obtained.
Simultaneous saccharification and fermentation. The SSF ex-periments were performed in 250 ml Erlenmeyer flasks, each con-taining 200 ml of fermentation me-dium formulated according to the experimental design (Table 1). A weighed amount of corn flour was suspended in sterilized water. The pH of the fermentation broth was measured at each sampling and
adjusted by addition of either 10% wt. H2SO4 or 20% wt. NaOH. In all cases, the medium was supplement-ed with acid protease GC 106 (40 μl/kg corn flour dry matter) and chloramphenicol (50 μg/L of the fermenta-tion medium). Fermentation was initiated with addition of freeze-dried distiller’s yeast Ethanol Red (0.5 g/L of fermentation medium). The number of living cells in the medium was 1.0 × 10⁷ cells/ml after inoculation. Flasks were incubated in a rotary shaker (200 rpm) at 35oC for 72 h. Samples were taken and analyzed for yeast cell viability as well as for the starch, glucose and ethanol concentration after fermentation. Average results of trip-licate experiments are shown.
Model validation. In order to validate the regression model, a new series of fermentation trials was carried out in triplicate. Using the point prediction capability of the software, values of dependent variables were predict-ed, together with the 95% confidence intervals, and then compared with the experimental results.
Kinetics studies. The SSF kinetics of mashes con-taining native corn starch were described in a modified unstructured kinetic model developed by Kroumov et al. (2006). Kinetics experiments were carried out in a 5 L
Table 1. Factor variation intervals
FactorsVariation levels
–1.4 –1.0 0 +1.0 +1.4
X1 — mash concentration [% wt.] 23.0 25.0 30.0 35.0 37.0
X2 — dose of GSHE [ml/kg flour dry matter] 0.30 0.75 1.875 3.00 3.45
X3 — mash pH 3.20 3.50 4.25 5.00 5.30
Table 2. Central composite design: 23+(2 x 3)+6 = 20. X1 — corn flour concentration (% wt.), X2 — GSHE dose (ml/kg of dry matter), X3 — mash pH
Run BlockActual values Xi Coded values xi
X1 X2 X3 x1 x2 x3
1 1 25.00 3.000 5.00 –1.0 1.0 1.0
2 1 30.00 1.875 4.25 0.0 0.0 0.0
3 1 35.00 3.000 3.50 1.0 1.0 –1.0
4 1 30.00 1.875 4.25 0.0 0.0 0.0
5 1 25.00 0.750 3.50 –1.0 –1.0 –1.0
6 1 35.00 0.750 5.00 1.0 –1.0 1.0
7 2 35.00 3.000 5.00 1.0 1.0 1.0
8 2 35.00 0.750 3.50 1.0 –1.0 –1.0
9 2 25.00 3.000 3.50 –1.0 1.0 –1.0
10 2 25.00 0.750 5.00 –1.0 –1.0 1.0
11 2 30.00 1.875 4.25 0.0 0.0 0.0
12 2 30.00 1.875 4.25 0.0 0.0 0.0
13 3 30.00 0.300 4.25 0.0 –1.4 0.0
14 3 37.00 1.875 4.25 1.4 0.0 0.0
15 3 30.00 1.875 4.25 0.0 0.0 0.0
16 3 23.00 1.875 4.25 –1.4 0.0 0.0
17 3 30.00 1.875 4.25 0.0 0.0 0.0
18 3 30.00 1.875 3.20 0.0 0.0 –1.4
19 3 30.00 1.875 5.30 0.0 0.0 1.4
20 3 30.00 3.450 4.25 0.0 1.4 0.0
156 2014W. Białas and others
batch bioreactor (BIOFLO III, New Brunswick Scien-tific, New Brunswick, NJ) with 3.0 L working volume, at 35oC, 100 rpm and an initial biomass concentration of 1.0 × 10⁷ cells/ml. All computations were performed using the Matlab and Simulink Release 2013 (The Math-Works, Inc., Natick, Massachusetts, United States).
Analysis. Samples for the analysis of glucose and ethanol concentrations were first centrifuged at 4000 × g for 10 min at 4oC (Multifuge 3SR, Germany), filtered through a 0.22 μm membrane filter (Millex-GS, Mil-lipore, USA), and then analyzed with an HPLC system (Merck Hitachi, Germany). Glucose and ethanol were separated on Aminex HPX-87P (Bio-Rad, USA) at 30oC using 5 mM H2SO4 solution as the mobile phase at a flow rate of 0.6 ml/min, and then detected with a refrac-tive index detector (Model L-7490, Merck Hitachi, Ger-many). Starch content was analyzed according to the en-zymatic method developed by Holm et al. (1986). Yeast cell populations were determined by a direct microscopic count in a counting chamber after staining with methyl-ene blue. Yeast cell number was recalculated to express the biomass concentration as kg/m3, according to the data presented by Haddad & Lindegren (1953).
Isolation and scanning electron microscopy of starch granules from fermented mash. A sample (5 g) of the fermented mash was first centrifuged at 4000 × g for 10 min at 25oC (Multifuge 3SR, Germany) and then suspended with 45 ml of sterilized water and shaken for 5 minutes. Then, the sample was centrifuged, and the
supernatant was discarded. The sediment was mixed with 50 ml of 0.02 M sodium hydroxide and stirred for 15 min at room temperature. The mixture was centrifuged at 4000 × g for 10 min at 25oC. The supernatant was discarded along with the first layer on top of the starch, which was carefully removed by scraping. The starch was washed with water (6 × 50 ml), collected by centrif-ugation and dried in lab-scale freeze-dryer (Christ, Ger-many). The granules were placed on specimen stubs cov-ered with double sided adhesive tapes and sprayed with gold particles (99.9%) in sputter coater Bal–Tec SCD050 (Balzers, Lichtenstein). The granules were observed and photographed using Scanning Electron Microscope (SEM) Zeiss EVO40 (Carl Zeiss AG, Oberkochen, Ger-many) with accelerating voltage of 10 kV.
RESULTS AND DISCUSSION
The response surface model developed for the ethanol concentration (Y1)
New strategy to minimize ethanol production cost is to run simultaneous saccharification and fermentation (SSF) by using the GSH enzymes. In SSF, due to the fact that yeast consume glucose, an inhibition of α- and glucoamylase is almost completely eliminated which en-sures that all reactions proceed at a high rate. However, because of the system’s complexity and interactions be-tween the system components, several process param-eters must be optimized: the substrate concentration, the dose of active components (α-amylase and glucoamylase) in the enzymatic mixture, and the pH of the fermenta-tion slurry.
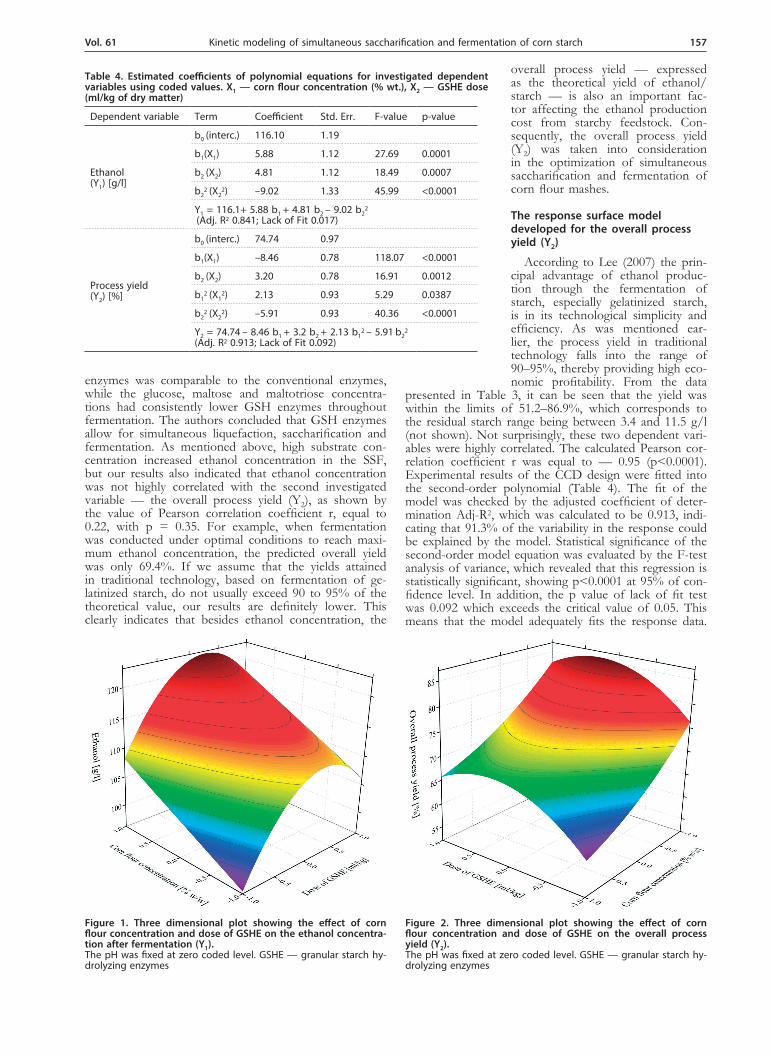
As shown in Table 3 the maximum predicted ethanol concentration reached approximately 121.8 g/L. Analysis of the variance indicated that the response surface model developed for ethanol concentration (Y1) was statistically significant, with the probability of the F test being at a level below 0.0001. Furthermore, the probability value of the lack-of-fit test was 0.117, indicating that the re-gression model is a good predictor of the experimental results. In addition, as was mentioned above, the preci-sion of a model can be checked by the adjusted coef-ficient of determination Adj-R2. In the case of response Y1, the value of Adj-R2 was equal to 0.841, indicating good agreement between the experimental results and the theoretical values predicted by the model equation presented in Table 4. According to this polynomial equa-tion, the ethanol concentration (Y1) was linearly related to the corn flour concentration in the mash (X1), while the quadratic term was not found to be significant, re-sulting in a linear increase in Y1 with X1 for all doses of GSHE (X2) (Fig. 1). The pH effect was regarded as not significant (p>0.05), hence it was removed from the model by the ANOVA backward elimination procedure. Furthermore, it was found that the dose of GSHE (X2) was highly significant (p<0.0001) in linear and quadratic terms, giving an overall curvilinear effect (Figure 1). The optimal concentrations for the two factors, as obtained from the maximum point of the model, were calculated by the Statistica software to be 34.8% and 2.08 ml/kg for the corn flour concentration (X1) and the dose of GSHE (X2), respectively. Similar results were presented by Wang et al. (2007), who compared the amount of ethanol and the profile of fermentable sugars during fer-mentation conducted according to traditional and novel technology, based on the granular starch hydrolyzing en-zymes. They found that the final ethanol yield with GSH
Table 3. Results of central composite design: 23+(2 x 3)+6 = 20
Run
Ethanol(Y1) [g/l]
Overall process yield(Y2) [%]
Actual Predicted Actual Predicted
1 112.43 108.25 62.426 59.263
2 113.30 116.20 73.394 74.708
3 116.78 117.85 64.841 65.667
4 117.19 116.20 75.908 74.708
5 94.58 96.49 73.519 76.184
6 106.82 106.10 83.031 82.589
7 119.43 121.20 77.364 78.187
8 115.81 113.25 64.299 62.742
9 118.47 121.20 76.744 78.187
10 120.02 122.85 66.636 69.147
11 107.55 101.49 83.602 79.664
12 109.80 111.10 85.351 86.068
13 79.09 86.22 51.233 55.273
14 103.53 99.67 67.065 64.240
15 102.86 102.40 86.910 87.381
16 115.39 110.63 74.745 71.345
17 112.77 110.63 73.046 71.345
18 119.85 118.86 62.946 63.691
19 106.47 110.63 68.967 71.345
20 109.69 110.63 71.052 71.345
Vol. 61 157Kinetic modeling of simultaneous saccharification and fermentation of corn starch
enzymes was comparable to the conventional enzymes, while the glucose, maltose and maltotriose concentra-tions had consistently lower GSH enzymes throughout fermentation. The authors concluded that GSH enzymes allow for simultaneous liquefaction, saccharification and fermentation. As mentioned above, high substrate con-centration increased ethanol concentration in the SSF, but our results also indicated that ethanol concentration was not highly correlated with the second investigated variable — the overall process yield (Y2), as shown by the value of Pearson correlation coefficient r, equal to 0.22, with p = 0.35. For example, when fermentation was conducted under optimal conditions to reach maxi-mum ethanol concentration, the predicted overall yield was only 69.4%. If we assume that the yields attained in traditional technology, based on fermentation of ge-latinized starch, do not usually exceed 90 to 95% of the theoretical value, our results are definitely lower. This clearly indicates that besides ethanol concentration, the
overall process yield — expressed as the theoretical yield of ethanol/starch — is also an important fac-tor affecting the ethanol production cost from starchy feedstock. Con-sequently, the overall process yield (Y2) was taken into consideration in the optimization of simultaneous saccharification and fermentation of corn flour mashes.
The response surface model developed for the overall process yield (Y2)
According to Lee (2007) the prin-cipal advantage of ethanol produc-tion through the fermentation of starch, especially gelatinized starch, is in its technological simplicity and efficiency. As was mentioned ear-lier, the process yield in traditional technology falls into the range of 90–95%, thereby providing high eco-nomic profitability. From the data
presented in Table 3, it can be seen that the yield was within the limits of 51.2–86.9%, which corresponds to the residual starch range being between 3.4 and 11.5 g/l (not shown). Not surprisingly, these two dependent vari-ables were highly correlated. The calculated Pearson cor-relation coefficient r was equal to — 0.95 (p<0.0001). Experimental results of the CCD design were fitted into the second-order polynomial (Table 4). The fit of the model was checked by the adjusted coefficient of deter-mination Adj-R2, which was calculated to be 0.913, indi-cating that 91.3% of the variability in the response could be explained by the model. Statistical significance of the second-order model equation was evaluated by the F-test analysis of variance, which revealed that this regression is statistically significant, showing p<0.0001 at 95% of con-fidence level. In addition, the p value of lack of fit test was 0.092 which exceeds the critical value of 0.05. This means that the model adequately fits the response data.
Table 4. Estimated coefficients of polynomial equations for investigated dependent variables using coded values. X1 — corn flour concentration (% wt.), X2 — GSHE dose (ml/kg of dry matter)
Dependent variable Term Coefficient Std. Err. F-value p-value
Ethanol(Y1) [g/l]
b0 (interc.) 116.10 1.19
b1(X1) 5.88 1.12 27.69 0.0001
b2 (X2) 4.81 1.12 18.49 0.0007
b22 (X2
2) –9.02 1.33 45.99 <0.0001
Y1 = 116.1+ 5.88 b1 + 4.81 b2 – 9.02 b22
(Adj. R2 0.841; Lack of Fit 0.017)
Process yield(Y2) [%]
b0 (interc.) 74.74 0.97
b1(X1) –8.46 0.78 118.07 <0.0001
b2 (X2) 3.20 0.78 16.91 0.0012
b12 (X1
2) 2.13 0.93 5.29 0.0387
b22 (X2
2) –5.91 0.93 40.36 <0.0001
Y2 = 74.74 – 8.46 b1 + 3.2 b2 + 2.13 b12 – 5.91 b2
2
(Adj. R2 0.913; Lack of Fit 0.092)
Figure 1. Three dimensional plot showing the effect of corn flour concentration and dose of GSHE on the ethanol concentra-tion after fermentation (Y1). The pH was fixed at zero coded level. GSHE — granular starch hy-drolyzing enzymes
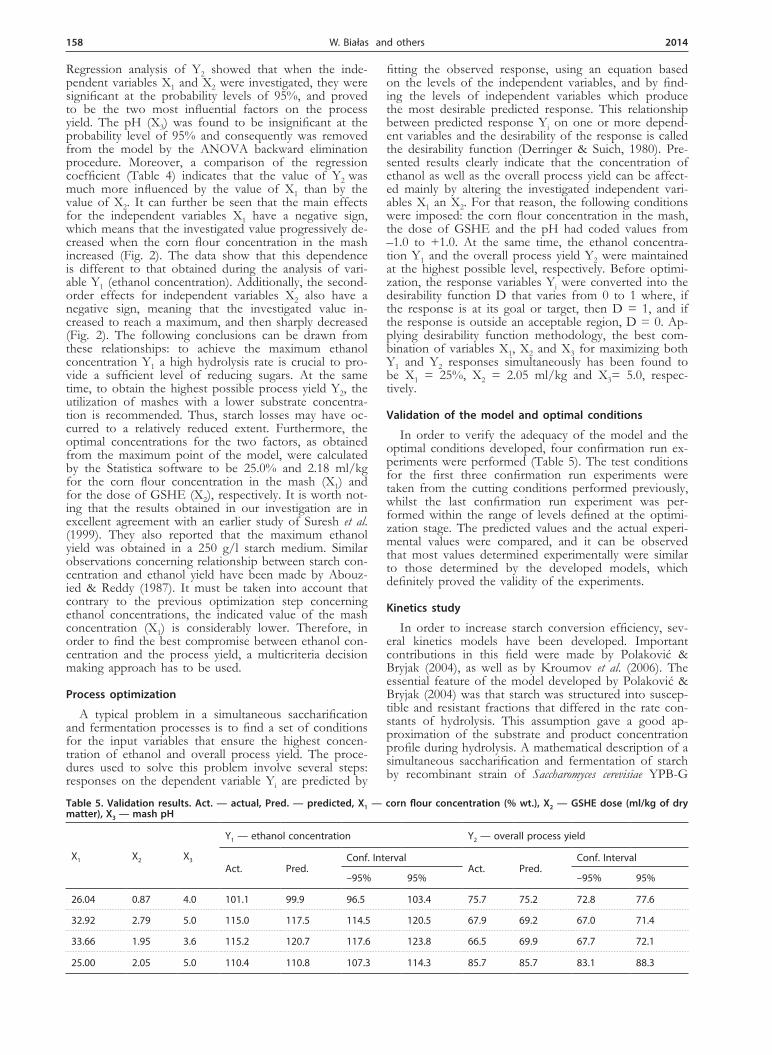
Figure 2. Three dimensional plot showing the effect of corn flour concentration and dose of GSHE on the overall process yield (Y2). The pH was fixed at zero coded level. GSHE — granular starch hy-drolyzing enzymes
158 2014W. Białas and others
Regression analysis of Y2 showed that when the inde-pendent variables X1 and X2 were investigated, they were significant at the probability levels of 95%, and proved to be the two most influential factors on the process yield. The pH (X3) was found to be insignificant at the probability level of 95% and consequently was removed from the model by the ANOVA backward elimination procedure. Moreover, a comparison of the regression coefficient (Table 4) indicates that the value of Y2 was much more influenced by the value of X1 than by the value of X2. It can further be seen that the main effects for the independent variables X1 have a negative sign, which means that the investigated value progressively de-creased when the corn flour concentration in the mash increased (Fig. 2). The data show that this dependence is different to that obtained during the analysis of vari-able Y1 (ethanol concentration). Additionally, the second-order effects for independent variables X2 also have a negative sign, meaning that the investigated value in-creased to reach a maximum, and then sharply decreased (Fig. 2). The following conclusions can be drawn from these relationships: to achieve the maximum ethanol concentration Y1 a high hydrolysis rate is crucial to pro-vide a sufficient level of reducing sugars. At the same time, to obtain the highest possible process yield Y2, the utilization of mashes with a lower substrate concentra-tion is recommended. Thus, starch losses may have oc-curred to a relatively reduced extent. Furthermore, the optimal concentrations for the two factors, as obtained from the maximum point of the model, were calculated by the Statistica software to be 25.0% and 2.18 ml/kg for the corn flour concentration in the mash (X1) and for the dose of GSHE (X2), respectively. It is worth not-ing that the results obtained in our investigation are in excellent agreement with an earlier study of Suresh et al. (1999). They also reported that the maximum ethanol yield was obtained in a 250 g/l starch medium. Similar observations concerning relationship between starch con-centration and ethanol yield have been made by Abouz-ied & Reddy (1987). It must be taken into account that contrary to the previous optimization step concerning ethanol concentrations, the indicated value of the mash concentration (X1) is considerably lower. Therefore, in order to find the best compromise between ethanol con-centration and the process yield, a multicriteria decision making approach has to be used.
Process optimization
A typical problem in a simultaneous saccharification and fermentation processes is to find a set of conditions for the input variables that ensure the highest concen-tration of ethanol and overall process yield. The proce-dures used to solve this problem involve several steps: responses on the dependent variable Yi are predicted by
fitting the observed response, using an equation based on the levels of the independent variables, and by find-ing the levels of independent variables which produce the most desirable predicted response. This relationship between predicted response Yi on one or more depend-ent variables and the desirability of the response is called the desirability function (Derringer & Suich, 1980). Pre-sented results clearly indicate that the concentration of ethanol as well as the overall process yield can be affect-ed mainly by altering the investigated independent vari-ables X1 an X2. For that reason, the following conditions were imposed: the corn flour concentration in the mash, the dose of GSHE and the pH had coded values from –1.0 to +1.0. At the same time, the ethanol concentra-tion Y1 and the overall process yield Y2 were maintained at the highest possible level, respectively. Before optimi-zation, the response variables Yi were converted into the desirability function D that varies from 0 to 1 where, if the response is at its goal or target, then D = 1, and if the response is outside an acceptable region, D = 0. Ap-plying desirability function methodology, the best com-bination of variables X1, X2 and X3 for maximizing both Y1 and Y2 responses simultaneously has been found to be X1 = 25%, X2 = 2.05 ml/kg and X3= 5.0, respec-tively.
Validation of the model and optimal conditions
In order to verify the adequacy of the model and the optimal conditions developed, four confirmation run ex-periments were performed (Table 5). The test conditions for the first three confirmation run experiments were taken from the cutting conditions performed previously, whilst the last confirmation run experiment was per-formed within the range of levels defined at the optimi-zation stage. The predicted values and the actual experi-mental values were compared, and it can be observed that most values determined experimentally were similar to those determined by the developed models, which definitely proved the validity of the experiments.
Kinetics study
In order to increase starch conversion efficiency, sev-eral kinetics models have been developed. Important contributions in this field were made by Polaković & Bryjak (2004), as well as by Kroumov et al. (2006). The essential feature of the model developed by Polaković & Bryjak (2004) was that starch was structured into suscep-tible and resistant fractions that differed in the rate con-stants of hydrolysis. This assumption gave a good ap-proximation of the substrate and product concentration profile during hydrolysis. A mathematical description of a simultaneous saccharification and fermentation of starch by recombinant strain of Saccharomyces cerevisiae YPB-G
Table 5. Validation results. Act. — actual, Pred. — predicted, X1 — corn flour concentration (% wt.), X2 — GSHE dose (ml/kg of dry matter), X3 — mash pH
X1 X2 X3
Y1 — ethanol concentration Y2 — overall process yield
Act. Pred.Conf. Interval
Act. Pred.Conf. Interval
–95% 95% –95% 95%
26.04 0.87 4.0 101.1 99.9 96.5 103.4 75.7 75.2 72.8 77.6
32.92 2.79 5.0 115.0 117.5 114.5 120.5 67.9 69.2 67.0 71.4
33.66 1.95 3.6 115.2 120.7 117.6 123.8 66.5 69.9 67.7 72.1
25.00 2.05 5.0 110.4 110.8 107.3 114.3 85.7 85.7 83.1 88.3
Vol. 61 159Kinetic modeling of simultaneous saccharification and fermentation of corn starch
was developed and described in detail by Kroumov et al. (2006). In this work, the concept of starch being struc-tured into susceptible and resistant fractions was also ap-plied. Furthermore, the authors assumed that the specific growth rate of the recombinant strain was influenced by glucose, and by initial and total starch concentrations. The specific ethanol production rate was described as a function of glucose, initial starch and ethanol concentra-tions. According to the data presented by Kroumov et al. (2006) the proposed model showed excellent flexibility for different operational conditions of the SSF process, and could be used successfully to describe microbial physiology of the genetically modified yeast Saccharomy-ces cerevisiae, secreting enzymes for starch degradation. In the present work, however, an attempt has been made to apply this knowledge to the modeling of saccharifica-
tion and fermentation of mashes containing native corn starch, using enzymes of hydrolyzing granular starch and the distiller’s yeast Ethanol Red (Saccharomyces cerevisiae). It is well known that most starches are triphasic with alternating concentric growth rings or lamella of amor-phous and semi-crystalline character, as well as lipid am-ylase inclusion complexes (Oostergetel & van Bruggen, 1993; Morgan et al., 1995). Moreover, scanning electron microscopy has shown that there are randomly distrib-uted depressions on the surface of wet starch granules. These depressions are suspected architecturally of being enzyme-susceptible regions (Robertson et al., 2006). This suggests that the biphasic kinetic model developed by Polaković & Bryjak (2004) could also be useful for de-scribing the digestion of raw starch by α- and glucoamyl-ase. However, according to Robertson et al. (2006), an uncritical extrapolation of the laboratory observations to technical processes has to consider that starch prepara-tion for the enzymatic studies may, for instance, include a solvent extraction in order to eliminate lipid effects. Sample preparation may introduce artefacts, through de-hydratation and/or physical abrasion. Thus, contrary to the data presented by Polaković & Bryjak (2004) as well as that of Kroumov et al. (2006), granular starch in the corn flour was considered to be a homogenous material containing only one fraction. In our opinion, based on limited available information concerning the proportion of potentially susceptible and resistant fractions in raw starch, it is difficult or impossible to formulate correct estimate of the rate constants. Consequently, if it is as-sumed that only a single substrate containing starch with some percentage of glucose is added, then the model equations are written as follows:
Enzymatic rate of starch degradation:
Mass balance of starch degradation:
Balance of glucose produced during starch degrada-tion:
Biomass balance:
and the specific growth rate model:
Product balance:
and the production rate model:
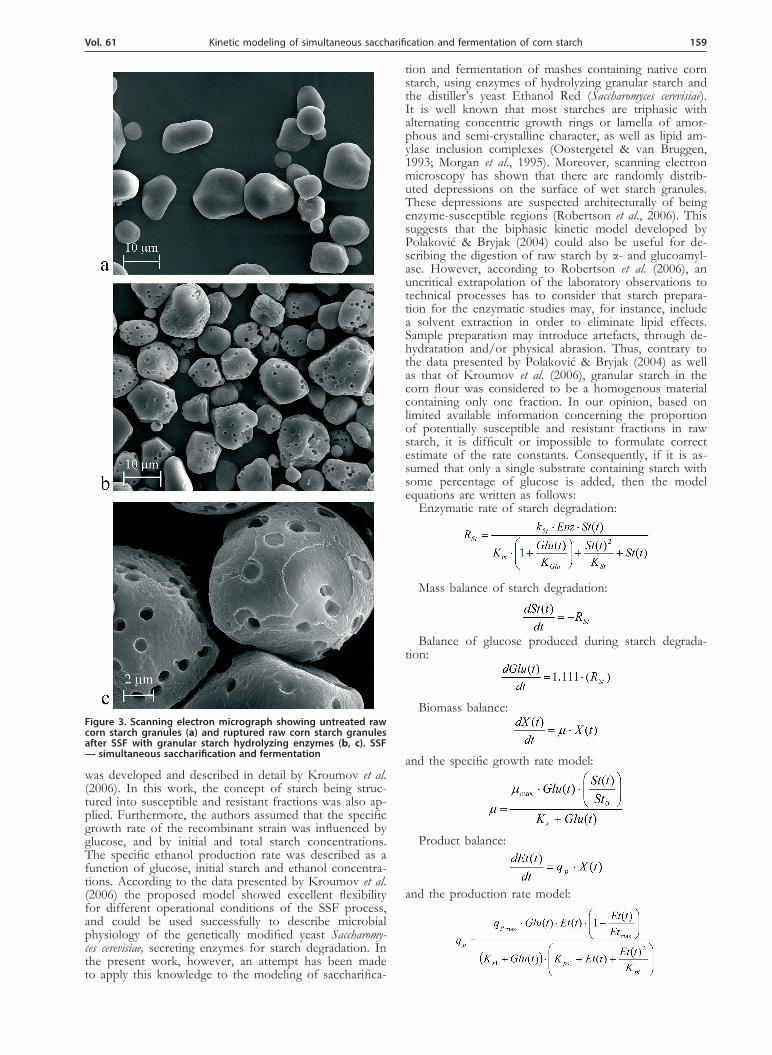
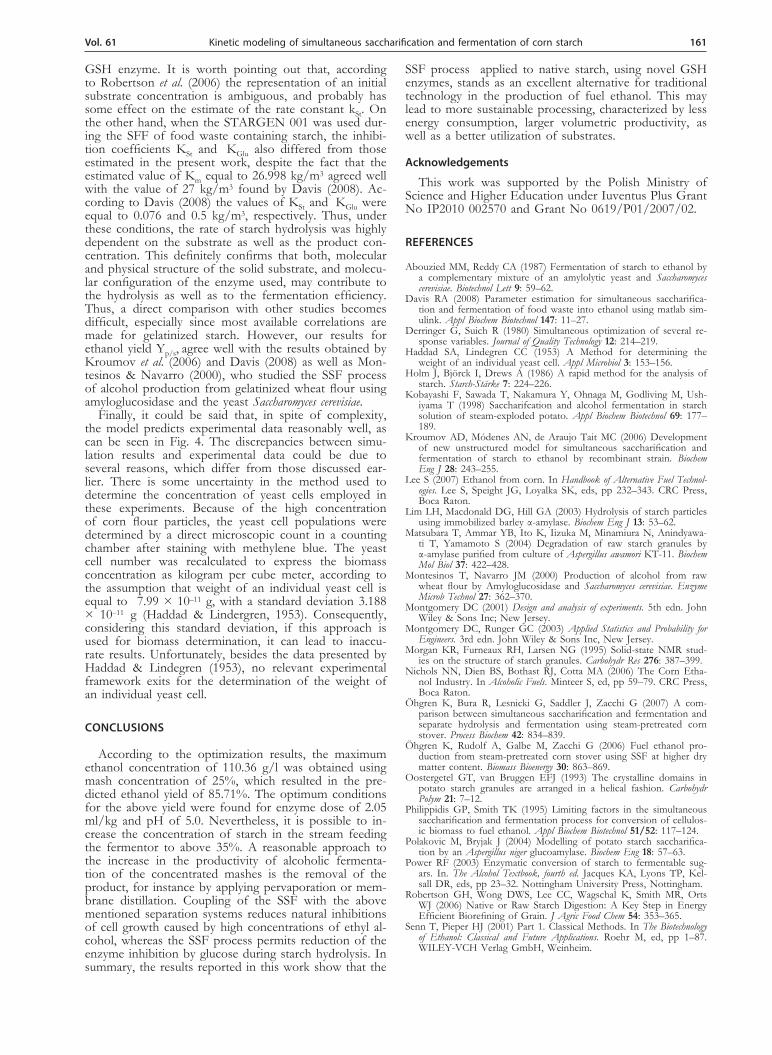
Figure 3. Scanning electron micrograph showing untreated raw corn starch granules (a) and ruptured raw corn starch granules after SSF with granular starch hydrolyzing enzymes (b, c). SSF — simultaneous saccharification and fermentation
160 2014W. Białas and others
Glucose balance:
where:
The reaction rate for hydrolysis of the starch is a Michaelis-Menten kinetic model, which considers the substrate inhibition of starch KSt as well as the com-petitive product inhibition of glucose KGlu. It should be noted that the model considers only one enzyme activ-ity involved in starch degradation to glucose by the syn-ergetic action of α- and glucoamylases. In the present study, similar to the works of Kroumov et al. (2006) and Davis (2008), we have assumed that this two-enzyme action can be simplified and represented as a sum of individual enzyme activities. As shown in Table 6, esti-mated values of the kinetic parameters concerning starch hydrolysis indicate that the enzyme complex investigated is greatly inhibited by glucose (KGlu = 0.0857), whereas the substrate inhibition of starch should be regarded as an insignificant factor (KSt = 999.98). Similar conclusions were drawn by Polaković & Bryjak (2004) as well as by Kroumov et al. (2006). However, a striking discrepancy between their results was observed concerning KSt and KGlu and the present data. Respectively, the inhibition constant KSt value exceeded 60 kg/m3, whereas the KGlu value was 1.1 kg/m3. It might therefore contribute to the use of the raw starch as a substrate and a different en-zyme system. In addition, the estimated value of the rate constant kSt was almost 100 times lower than the rate constant obtained by Kroumov et al. (2006). It is prob-able that the rate of soluble starch digestion was much faster, because α-1.4-bonds for α-amylase and α-1.4-bonds at nonreducing ends for glucoamylases were read-ily susceptible to an enzyme attack, whereas in the case of the digestion of native starch granules, polysaccharide backbones were concentrated in the solid-phase portion
of the reaction mixture. Several different suggestions have been put forward concerning the routes of raw starch granules digestion. These include: local or distrib-uted digestion at the surface pores, centripetal digestion along the starch polymer chains, digestion at the cracks, or diffusion through the starch structure to susceptible sites (Robertson et al., 2006). However, the most prob-able explanation has been deduced by Matsubara et al. (2004), from the microscopic observation of corn starch
granules hydrolyzed with a mixture of α- and glucoamylase. They claim that glucoamylase initially acted on the starch granule surface, forming small holes, whereas α-amylase was adsorbed around the hole and re-leased oligosaccharides, which were further decomposed to glucose by the action of glucoamylase. Further-more, when the above-mentioned enzymes were used together, they created more holes per unit area, and the size of the holes was expanded further. Thus, when the substrate was digested, additional sites for the reaction were exposed. Scanning electron microscopy of the starch granules isolated from fermented mash supports the efficient action of enzyme preparation used in this study towards raw corn starch. Fig-ure 3a shows that the surface of un-treated starch granules was smooth, whereas Figs 3b and 3c shows that the pores of the hydrolyzed starch were randomly distributed due to the breakdown of granules by the
Table 6. The SSF initial and estimated kinetic parameters
No. Parameters Value Unit
Initial
1 St0 202.34 kg/m3
2 Glu0 23.03 kg/m3
3 X0 0.5 kg/m3
4 Et0 0.0 kg/m3
5 Enz 262612.5 U/m3
Estimated
1 Km 26.998 kg/m3
2 kSt 0.000333 kg/U.h
3 KSt 999.98 kg/m3
4 KGlu 0.0857 kg/m3
5 μmax 0.6057 h–1
6 Ks 7.0237 kg/m3
7 qpmax 4.9951 h–1
8 Etmax 90.007 kg/m3
9 Ks1 0.00633 kg/m3
10 Kps1 0.00046 kg/m3
11 Kpi 14.687 kg/m3
12 Yp/s 0.4759 kg/kg
13 Yx/s 0.8133 kg/kg
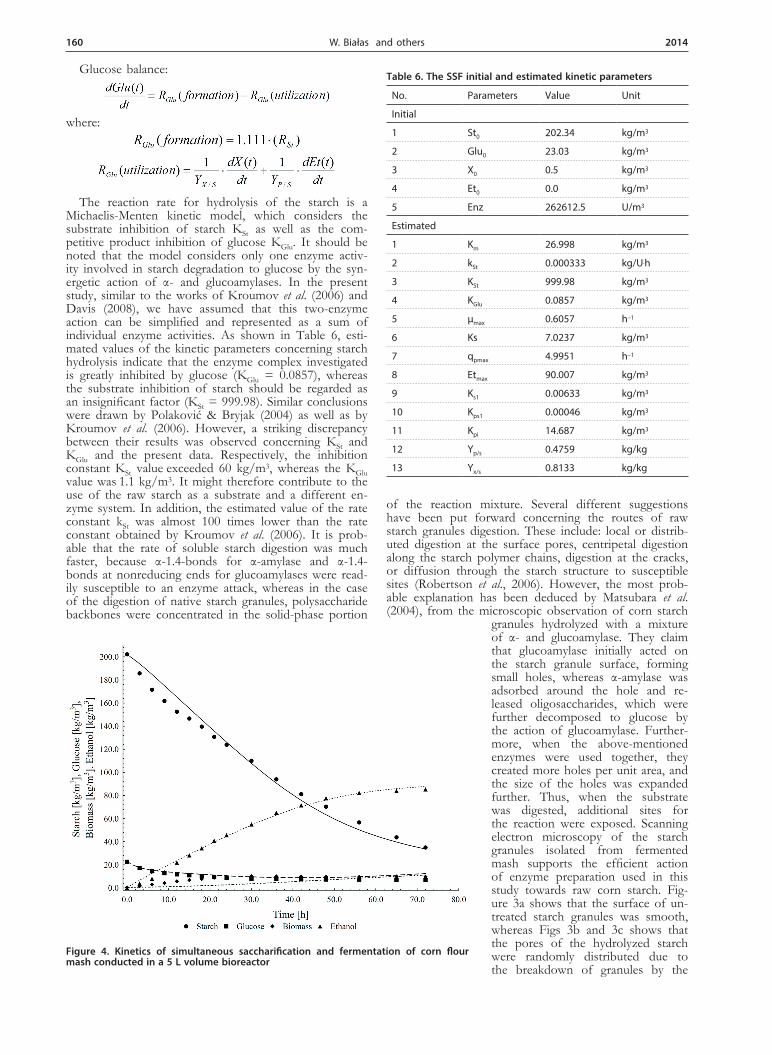
Figure 4. Kinetics of simultaneous saccharification and fermentation of corn flour mash conducted in a 5 L volume bioreactor
Vol. 61 161Kinetic modeling of simultaneous saccharification and fermentation of corn starch
GSH enzyme. It is worth pointing out that, according to Robertson et al. (2006) the representation of an initial substrate concentration is ambiguous, and probably has some effect on the estimate of the rate constant kSt. On the other hand, when the STARGEN 001 was used dur-ing the SFF of food waste containing starch, the inhibi-tion coefficients KSt and KGlu also differed from those estimated in the present work, despite the fact that the estimated value of Km equal to 26.998 kg/m3 agreed well with the value of 27 kg/m3 found by Davis (2008). Ac-cording to Davis (2008) the values of KSt and KGlu were equal to 0.076 and 0.5 kg/m3, respectively. Thus, under these conditions, the rate of starch hydrolysis was highly dependent on the substrate as well as the product con-centration. This definitely confirms that both, molecular and physical structure of the solid substrate, and molecu-lar configuration of the enzyme used, may contribute to the hydrolysis as well as to the fermentation efficiency. Thus, a direct comparison with other studies becomes difficult, especially since most available correlations are made for gelatinized starch. However, our results for ethanol yield Yp/s, agree well with the results obtained by Kroumov et al. (2006) and Davis (2008) as well as Mon-tesinos & Navarro (2000), who studied the SSF process of alcohol production from gelatinized wheat flour using amyloglucosidase and the yeast Saccharomyces cerevisiae.
Finally, it could be said that, in spite of complexity, the model predicts experimental data reasonably well, as can be seen in Fig. 4. The discrepancies between simu-lation results and experimental data could be due to several reasons, which differ from those discussed ear-lier. There is some uncertainty in the method used to determine the concentration of yeast cells employed in these experiments. Because of the high concentration of corn flour particles, the yeast cell populations were determined by a direct microscopic count in a counting chamber after staining with methylene blue. The yeast cell number was recalculated to express the biomass concentration as kilogram per cube meter, according to the assumption that weight of an individual yeast cell is equal to 7.99 × 10⁻¹¹ g, with a standard deviation 3.188 × 10⁻¹¹ g (Haddad & Lindergren, 1953). Consequently, considering this standard deviation, if this approach is used for biomass determination, it can lead to inaccu-rate results. Unfortunately, besides the data presented by Haddad & Lindegren (1953), no relevant experimental framework exits for the determination of the weight of an individual yeast cell.
CONCLUSIONS
According to the optimization results, the maximum ethanol concentration of 110.36 g/l was obtained using mash concentration of 25%, which resulted in the pre-dicted ethanol yield of 85.71%. The optimum conditions for the above yield were found for enzyme dose of 2.05 ml/kg and pH of 5.0. Nevertheless, it is possible to in-crease the concentration of starch in the stream feeding the fermentor to above 35%. A reasonable approach to the increase in the productivity of alcoholic fermenta-tion of the concentrated mashes is the removal of the product, for instance by applying pervaporation or mem-brane distillation. Coupling of the SSF with the above mentioned separation systems reduces natural inhibitions of cell growth caused by high concentrations of ethyl al-cohol, whereas the SSF process permits reduction of the enzyme inhibition by glucose during starch hydrolysis. In summary, the results reported in this work show that the
SSF process applied to native starch, using novel GSH enzymes, stands as an excellent alternative for traditional technology in the production of fuel ethanol. This may lead to more sustainable processing, characterized by less energy consumption, larger volumetric productivity, as well as a better utilization of substrates.
Acknowledgements
This work was supported by the Polish Ministry of Science and Higher Education under Iuventus Plus Grant No IP2010 002570 and Grant No 0619/P01/2007/02.
REFERENCES
Abouzied MM, Reddy CA (1987) Fermentation of starch to ethanol by a complementary mixture of an amylolytic yeast and Saccharomyces cerevisiae. Biotechnol Lett 9: 59–62.
Davis RA (2008) Parameter estimation for simultaneous saccharifica-tion and fermentation of food waste into ethanol using matlab sim-ulink. Appl Biochem Biotechnol 147: 11–27.
Derringer G, Suich R (1980) Simultaneous optimization of several re-sponse variables. Journal of Quality Technology 12: 214–219.
Haddad SA, Lindegren CC (1953) A Method for determining the weight of an individual yeast cell. Appl Microbiol 3: 153–156.
Holm J, Björck I, Drews A (1986) A rapid method for the analysis of starch. Starch-Stärke 7: 224–226.
Kobayashi F, Sawada T, Nakamura Y, Ohnaga M, Godliving M, Ush-iyama T (1998) Saccharifcation and alcohol fermentation in starch solution of steam-exploded potato. Appl Biochem Biotechnol 69: 177–189.
Kroumov AD, Módenes AN, de Araujo Tait MC (2006) Development of new unstructured model for simultaneous saccharification and fermentation of starch to ethanol by recombinant strain. Biochem Eng J 28: 243–255.
Lee S (2007) Ethanol from corn. In Handbook of Alternative Fuel Technol-ogies. Lee S, Speight JG, Loyalka SK, eds, pp 232–343. CRC Press, Boca Raton.
Lim LH, Macdonald DG, Hill GA (2003) Hydrolysis of starch particles using immobilized barley α-amylase. Biochem Eng J 13: 53–62.
Matsubara T, Ammar YB, Ito K, Iizuka M, Minamiura N, Anindyawa-ti T, Yamamoto S (2004) Degradation of raw starch granules by α-amylase purified from culture of Aspergillus awamori KT-11. Biochem Mol Biol 37: 422–428.
Montesinos T, Navarro JM (2000) Production of alcohol from raw wheat flour by Amyloglucosidase and Saccharomyces cerevisiae. Enzyme Microb Technol 27: 362–370.
Montgomery DC (2001) Design and analysis of experiments. 5th edn. John Wiley & Sons Inc; New Jersey.
Montgomery DC, Runger GC (2003) Applied Statistics and Probability for Engineers. 3rd edn. John Wiley & Sons Inc, New Jersey.
Morgan KR, Furneaux RH, Larsen NG (1995) Solid-state NMR stud-ies on the structure of starch granules. Carbohydr Res 276: 387–399.
Nichols NN, Dien BS, Bothast RJ, Cotta MA (2006) The Corn Etha-nol Industry. In Alcoholic Fuels. Minteer S, ed, pp 59–79. CRC Press, Boca Raton.
Öhgren K, Bura R, Lesnicki G, Saddler J, Zacchi G (2007) A com-parison between simultaneous saccharification and fermentation and separate hydrolysis and fermentation using steam-pretreated corn stover. Process Biochem 42: 834–839.
Öhgren K, Rudolf A, Galbe M, Zacchi G (2006) Fuel ethanol pro-duction from steam-pretreated corn stover using SSF at higher dry matter content. Biomass Bioenergy 30: 863–869.
Oostergetel GT, van Bruggen EFJ (1993) The crystalline domains in potato starch granules are arranged in a helical fashion. Carbohydr Polym 21: 7–12.
Philippidis GP, Smith TK (1995) Limiting factors in the simultaneous saccharification and fermentation process for conversion of cellulos-ic biomass to fuel ethanol. Appl Biochem Biotechnol 51/52: 117–124.
Polakovic M, Bryjak J (2004) Modelling of potato starch saccharifica-tion by an Aspergillus niger glucoamylase. Biochem Eng 18: 57–63.
Power RF (2003) Enzymatic conversion of starch to fermentable sug-ars. In. The Alcohol Textbook, fourth ed. Jacques KA, Lyons TP, Kel-sall DR, eds, pp 23–32. Nottingham University Press, Nottingham.
Robertson GH, Wong DWS, Lee CC, Wagschal K, Smith MR, Orts WJ (2006) Native or Raw Starch Digestion: A Key Step in Energy Efficient Biorefining of Grain. J Agric Food Chem 54: 353–365.
Senn T, Pieper HJ (2001) Part 1. Classical Methods. In The Biotechnology of Ethanol: Classical and Future Applications. Roehr M, ed, pp 1–87. WILEY-VCH Verlag GmbH, Weinheim.

162 2014W. Białas and others
Suresh K, Kiran Sree N, Venkateswar Rao L (1999) Production of eth-anol by raw starch hydrolysis and fermentation of damaged grains of wheat and sorghum. Bioprocess Eng 21: 165–168.
Verma G, Nigam P, Singh D, Chaudhary K (2000) Bioconversion of starch to ethanol in a single-step process by coculture of amylolytic yeasts and Saccharomyces cerevisiae 21. Bioresour Technol 72: 261–266.
Wang P, Singh V, Hue X, Johnston DB, Rausch KD, Tumbleson ME (2007) Comparison of raw starch hydrolyzing enzyme with conven-tional liquefaction and saccharification enzymes in dry-grind corn processing. Cereal Chem 84: 10–14.
Ward C, Nolan AM, O`Hanlon K, McAree T, Barron N, McHale L, McHale AP (1995) Production of ethanol at 45°C on starch con-taining media by a mixed culture of thermotolerant, ethanol pro-ducing yeast Kluveromyces marxianus CBS 814.70 and a thermophilic filamentous fungus Taloromyces emersonii. Appl Microbiol Biotechnol 43: 408–411.
Wyman CE (2003) Applications of corn stover and fiber. In Corn Chemistry and Technology, second ed. White PJ, Johnson LA, eds, pp 723–750. American Association of Cereal Chemists, St. Paul MN.