equity income: a niche asset class neil margolis, portfolio manager may 2007
TRANSCRIPT

Equity income: a niche asset class
Neil Margolis, Portfolio Manager
May 2007
3
Disclaimer
The information contained in this presentation is current as at 22 May 2007 unless otherwise specified and is provided by Challenger
Managed Investments Limited ABN 94 002 835 592, AFSL 234 668 (Challenger) and is intended solely for holders of an Australian financial
services licence or other wholesale clients (as defined in the Corporations Act 2001 (Cth). It must not be passed on to a retail client except
where it is included as part of the financial adviser’s own advice to their client and is not accredited to Challenger. It should be regarded as
general information only, rather than as advice. It has been prepared without taking account of any person’s objectives, financial situation or
needs. Because of that, each person should, before acting on any such information, consider its appropriateness, having regard to their
objectives, financial situation and needs. Challenger is the issuer of the Challenger Australian Share Fund ARSN 092 999 301 (Fund).
Offers of interests in the Fund are contained in the current relevant product disclosure statement (PDS) issued by Challenger which is
available on our website www.challenger.com.au. The relevant PDS should be considered before making any decision whether to acquire
or continue to hold units in the Fund. Past performance is not a reliable indicator of future performance. In preparing this presentation,
Challenger has relied on publicly available information and sources believed to be reliable. However, the information has not been
independently verified by Challenger. While due care and attention has been exercised in the preparation of the presentation, Challenger
gives no representation, warranty (express or implied) as to the accuracy, completeness or reliability of the information. The information in
this presentation is also not intended to be a complete statement or summary of the industry, markets, securities or developments referred
to in the presentation. Any opinions expressed in this presentation, including as to future matters, may be subject to change. Opinions as to
future matters are predictive in nature and may be affected by inaccurate assumptions or by known or unknown risks and uncertainties and
may differ materially from results ultimately achieved.
4
Agenda
Agenda:
• Part 1. An introduction to equity income
• Part 2. The paradox of longer timeframes
• Part 3. Using equity income to diversify an income portfolio
• Part 4. Investing in equity income
5
1. Introduction to equity incomeWhat is it?
Equity income• A niche asset class• Cash generative• Potential tax effectiveness• Typically lower volatility relative to equities• Long term real capital growth potential
6
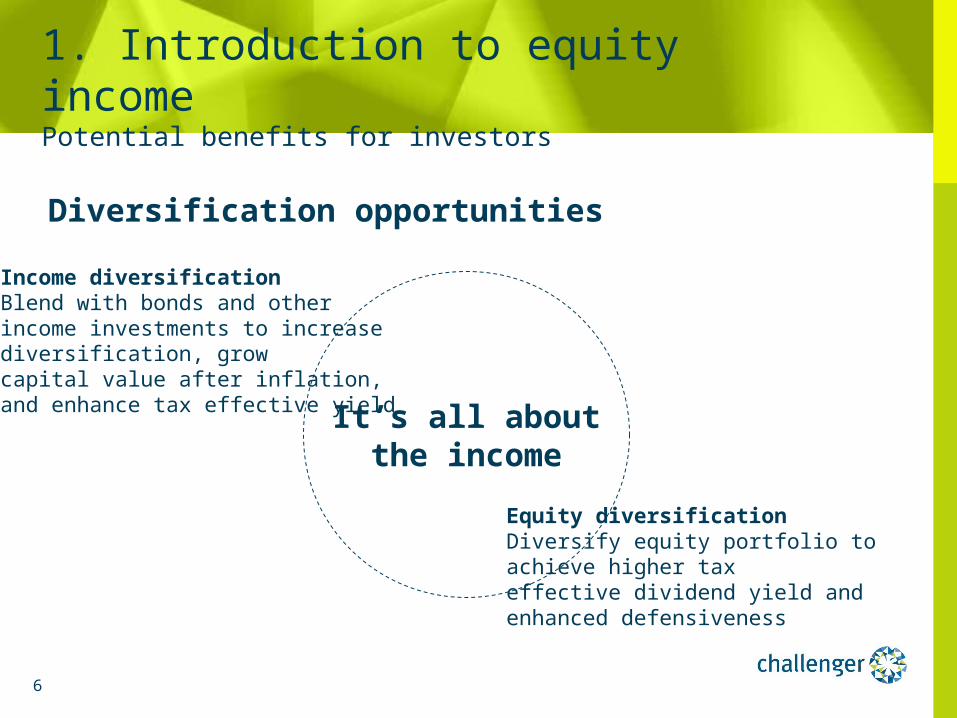
1. Introduction to equity incomePotential benefits for investors
It’s all aboutthe income
Equity diversificationDiversify equity portfolio toachieve higher taxeffective dividend yield andenhanced defensiveness
Income diversificationBlend with bonds and otherincome investments to increasediversification, growcapital value after inflation,and enhance tax effective yield
Diversification opportunities
7
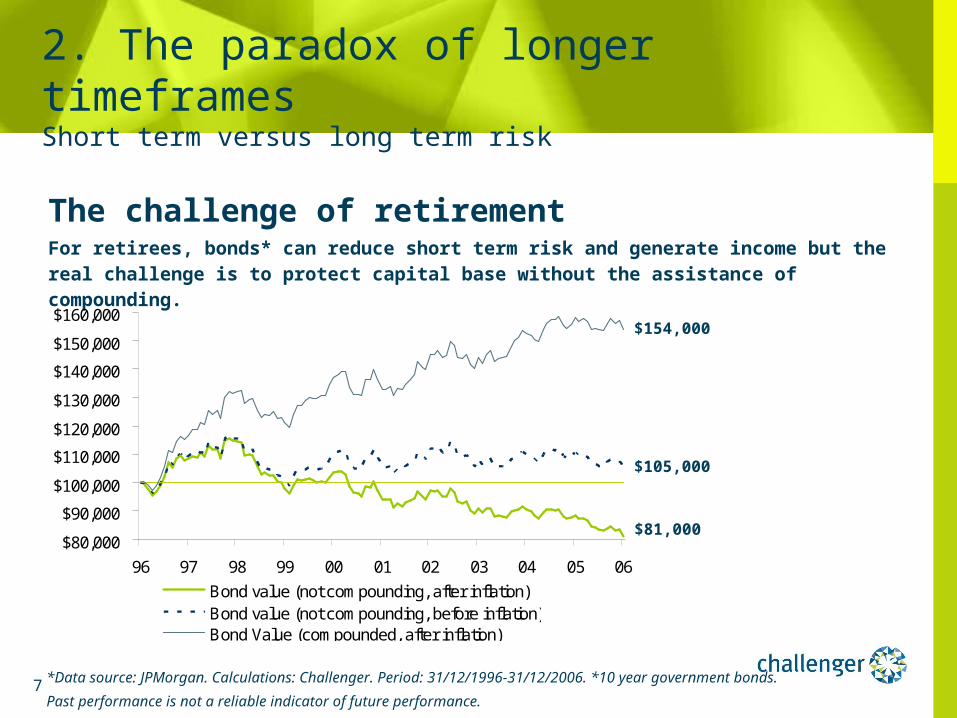
The challenge of retirementFor retirees, bonds* can reduce short term risk and generate income but the real challenge is to protect capital base without the assistance of compounding.
$154,000
$105,000
$81,000
2. The paradox of longer timeframesShort term versus long term risk
$80,000
$90,000
$100,000
$110,000
$120,000
$130,000
$140,000
$150,000
$160,000
96 97 98 99 00 01 02 03 04 05 06
Bond value (not compounding, after inflation)Bond value (not compounding, before inflation)Bond Value (compounded, after inflation)
*Data source: JPMorgan. Calculations: Challenger. Period: 31/12/1996-31/12/2006. *10 year government bonds.
Past performance is not a reliable indicator of future performance.
8
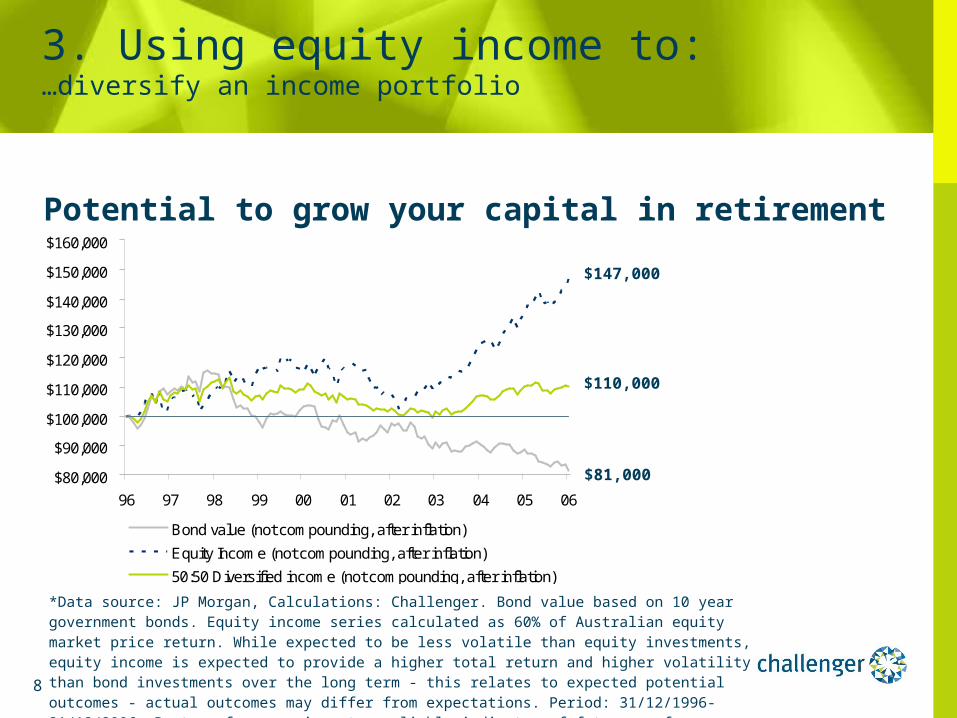
Potential to grow your capital in retirement
3. Using equity income to:…diversify an income portfolio
$80,000
$90,000
$100,000
$110,000
$120,000
$130,000
$140,000
$150,000
$160,000
96 97 98 99 00 01 02 03 04 05 06
Bond value (not compounding, after inflation)
Equity Income (not compounding, after inflation)
50:50 Diversified income (not compounding, after inflation)
*Data source: JP Morgan, Calculations: Challenger. Bond value based on 10 year government bonds. Equity income series calculated as 60% of Australian equity market price return. While expected to be less volatile than equity investments, equity income is expected to provide a higher total return and higher volatility than bond investments over the long term - this relates to expected potential outcomes - actual outcomes may differ from expectations. Period: 31/12/1996-31/12/2006. Past performance is not a reliable indicator of future performance.
$147,000
$110,000
$81,000
9
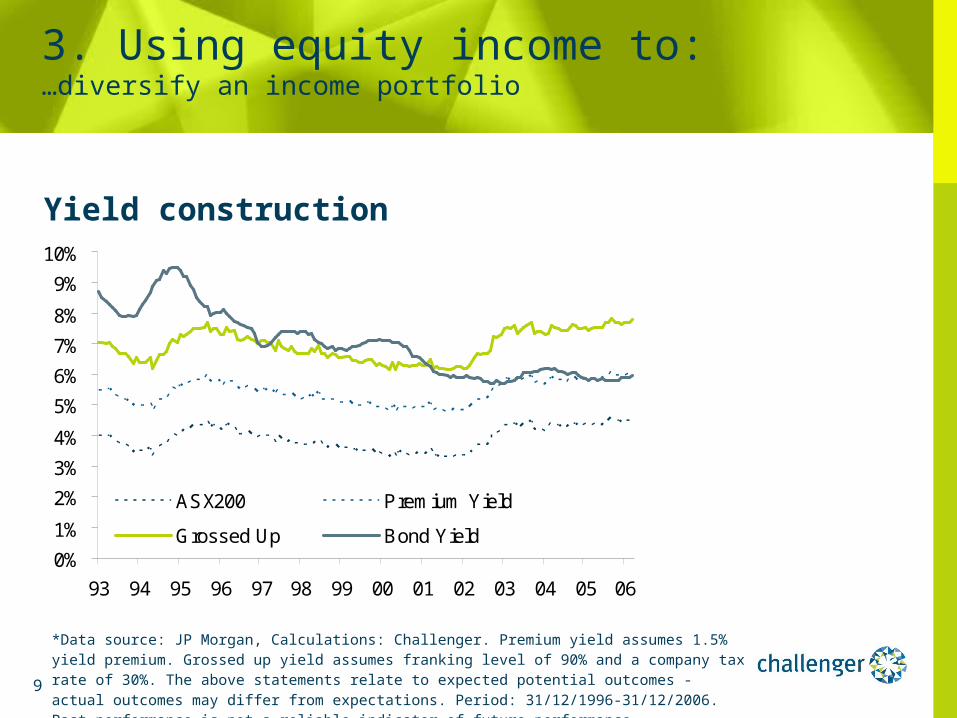
Yield construction
3. Using equity income to:…diversify an income portfolio
*Data source: JP Morgan, Calculations: Challenger. Premium yield assumes 1.5% yield premium. Grossed up yield assumes franking level of 90% and a company tax rate of 30%. The above statements relate to expected potential outcomes - actual outcomes may differ from expectations. Period: 31/12/1996-31/12/2006. Past performance is not a reliable indicator of future performance.
0%
1%
2%
3%
4%
5%
6%
7%
8%
9%
10%
93 94 95 96 97 98 99 00 01 02 03 04 05 06
ASX200 Premium Yield
Grossed Up Bond Yield
10
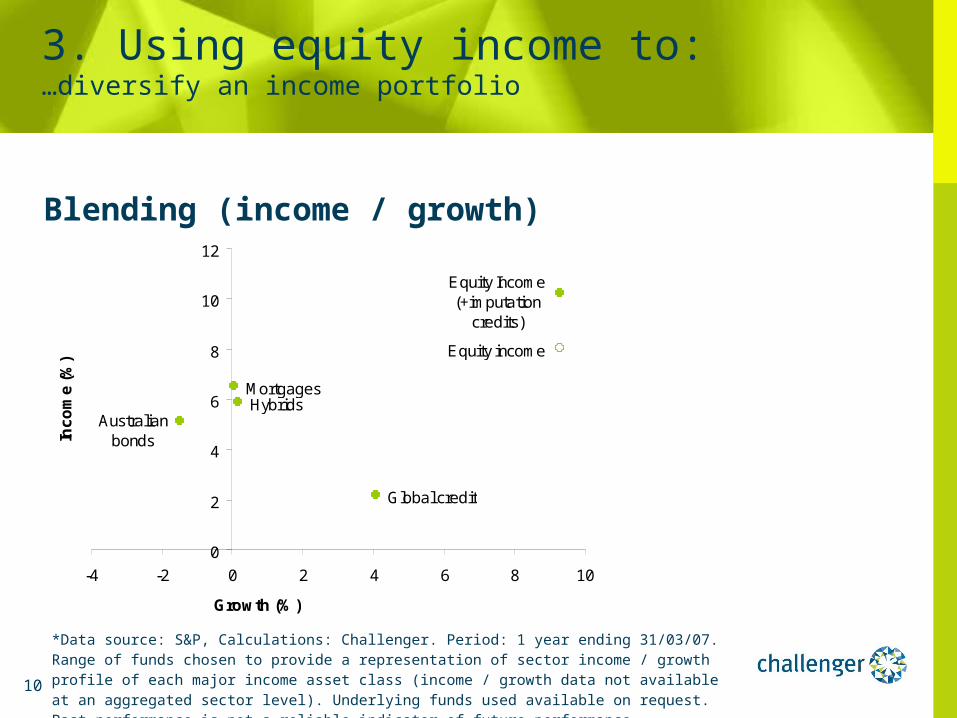
Blending (income / growth)
3. Using equity income to:…diversify an income portfolio
*Data source: S&P, Calculations: Challenger. Period: 1 year ending 31/03/07. Range of funds chosen to provide a representation of sector income / growth profile of each major income asset class (income / growth data not available at an aggregated sector level). Underlying funds used available on request. Past performance is not a reliable indicator of future performance.
HybridsMortgages
Global credit
Australian bonds
Equity income
Equity Income (+imputation
credits)
0
2
4
6
8
10
12
-4 -2 0 2 4 6 8 10
Growth (%)
Inc
om
e (
%)
11
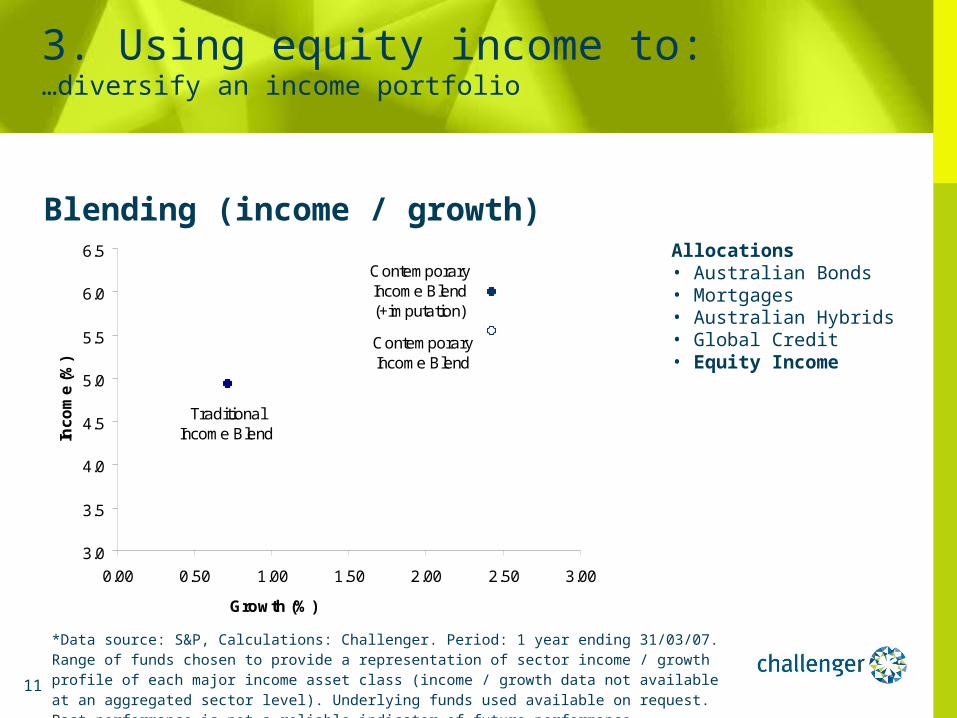
Blending (income / growth)
3. Using equity income to:…diversify an income portfolio
*Data source: S&P, Calculations: Challenger. Period: 1 year ending 31/03/07. Range of funds chosen to provide a representation of sector income / growth profile of each major income asset class (income / growth data not available at an aggregated sector level). Underlying funds used available on request. Past performance is not a reliable indicator of future performance.
Allocations• Australian Bonds• Mortgages• Australian Hybrids• Global Credit• Equity Income
Traditional Income Blend
Contemporary Income Blend
Contemporary Income Blend (+imputation)
3.0
3.5
4.0
4.5
5.0
5.5
6.0
6.5
0.00 0.50 1.00 1.50 2.00 2.50 3.00
Growth (%)
Inc
om
e (
%)
12
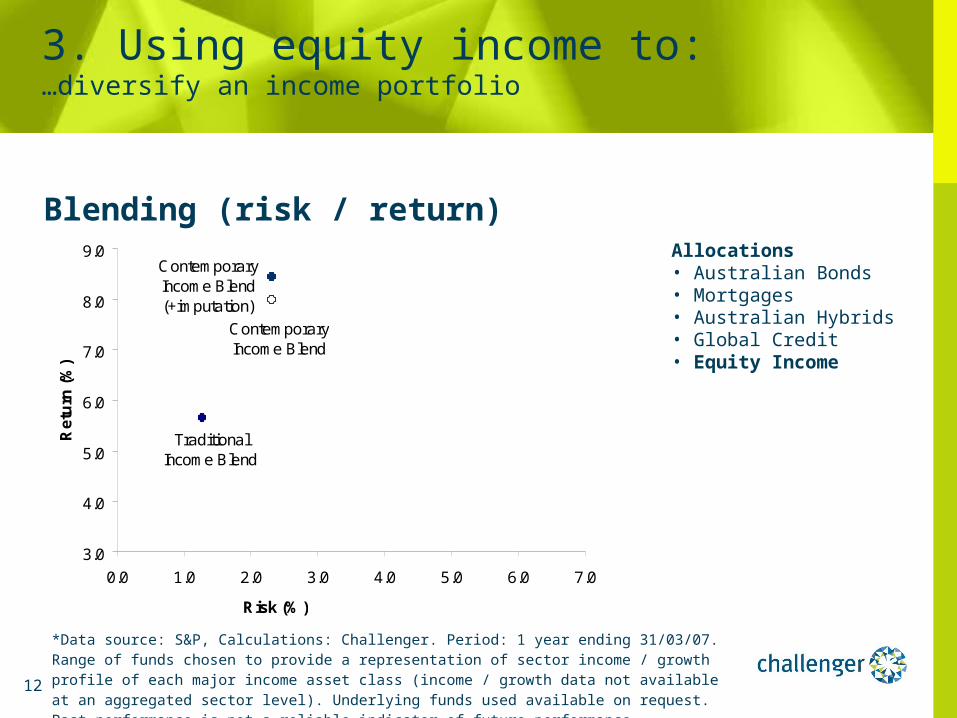
Blending (risk / return)
3. Using equity income to:…diversify an income portfolio
*Data source: S&P, Calculations: Challenger. Period: 1 year ending 31/03/07. Range of funds chosen to provide a representation of sector income / growth profile of each major income asset class (income / growth data not available at an aggregated sector level). Underlying funds used available on request. Past performance is not a reliable indicator of future performance.
Traditional Income Blend
Contemporary Income Blend
Contemporary Income Blend (+imputation)
3.0
4.0
5.0
6.0
7.0
8.0
9.0
0.0 1.0 2.0 3.0 4.0 5.0 6.0 7.0
Risk (%)
Re
turn
(%
)
Allocations• Australian Bonds• Mortgages• Australian Hybrids• Global Credit• Equity Income
13
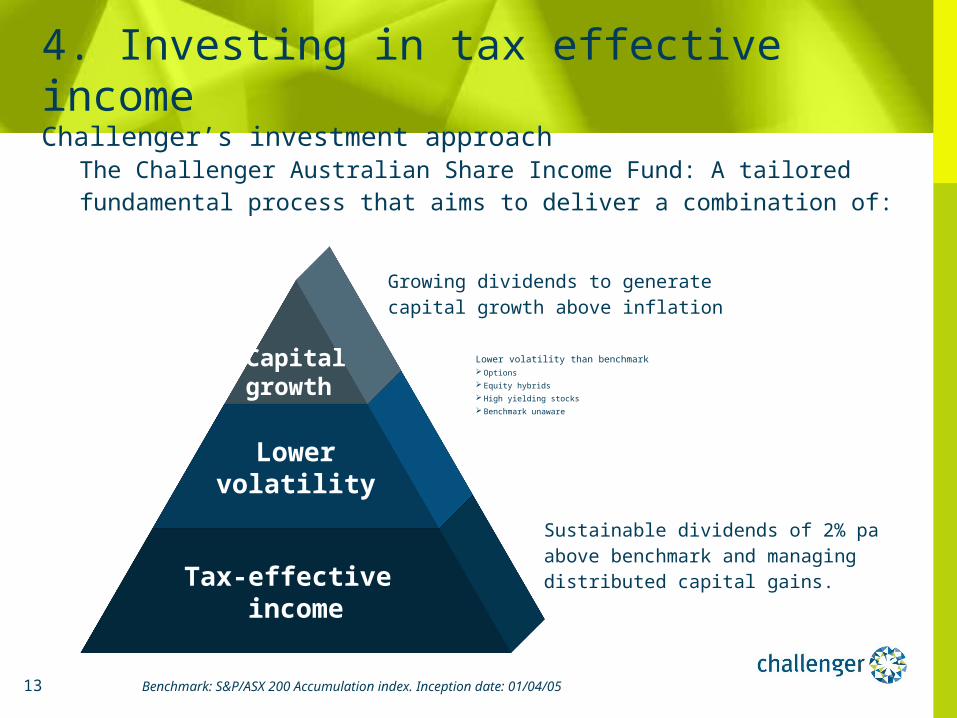
Tax-effective income
Lowervolatility
Capitalgrowth
Lower volatility than benchmark Options
Equity hybrids
High yielding stocks
Benchmark unaware
The Challenger Australian Share Income Fund: A tailored fundamental process that aims to deliver a combination of:
Growing dividends to generate capital growth above inflation
Sustainable dividends of 2% pa above benchmark and managing distributed capital gains.
Benchmark: S&P/ASX 200 Accumulation index. Inception date: 01/04/05
4. Investing in tax effective incomeChallenger’s investment approach
14
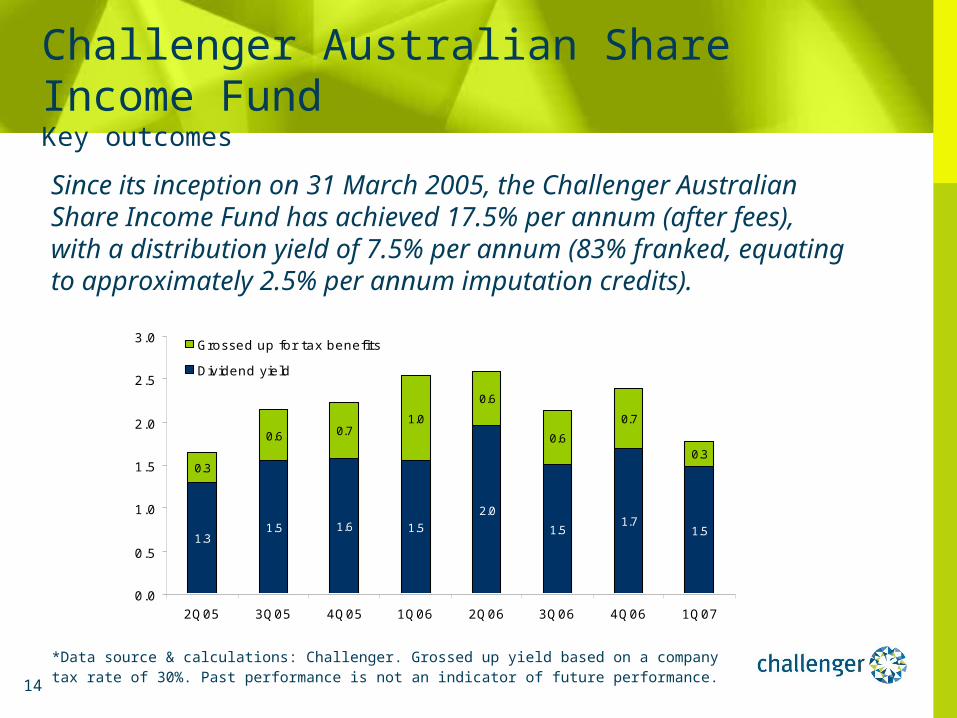
Since its inception on 31 March 2005, the Challenger Australian Share Income Fund has achieved 17.5% per annum (after fees), with a distribution yield of 7.5% per annum (83% franked, equating to approximately 2.5% per annum imputation credits).
Challenger Australian Share Income FundKey outcomes
*Data source & calculations: Challenger. Grossed up yield based on a company tax rate of 30%. Past performance is not an indicator of future performance.
1.31.5 1.6 1.5
2.0
1.51.7
1.5
0.3
0.6 0.71.0
0.6
0.6
0.7
0.3
0.0
0.5
1.0
1.5
2.0
2.5
3.0
2Q05 3Q05 4Q05 1Q06 2Q06 3Q06 4Q06 1Q07
Grossed up for tax benefits
Dividend yield
15
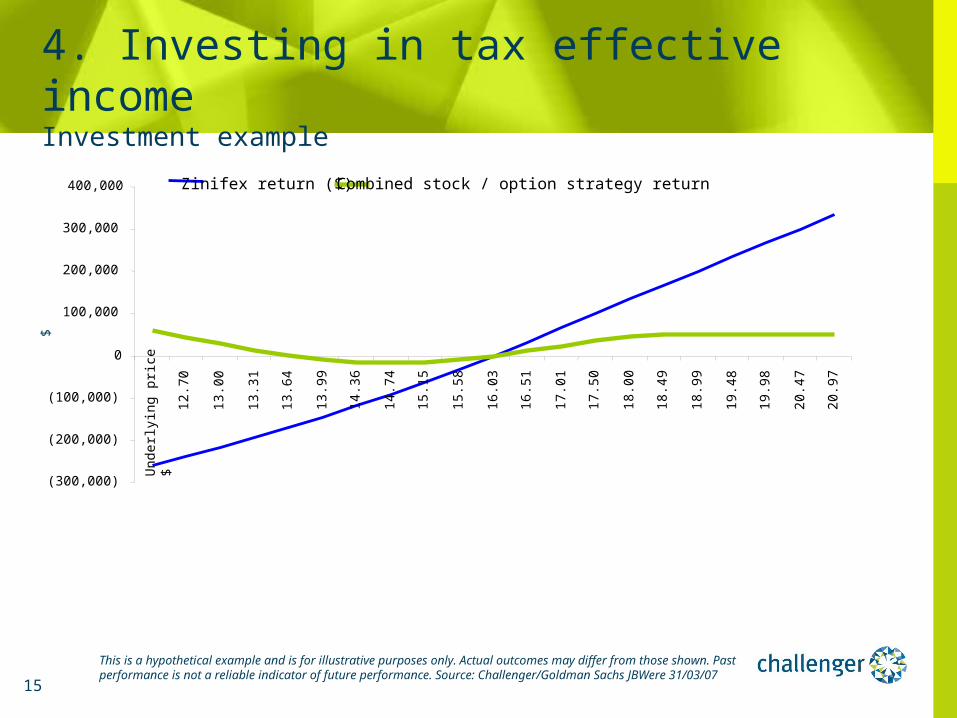
This is a hypothetical example and is for illustrative purposes only. Actual outcomes may differ from those shown. Past performance is not a reliable indicator of future performance. Source: Challenger/Goldman Sachs JBWere 31/03/07
4. Investing in tax effective incomeInvestment example
(300,000)
(200,000)
(100,000)
0
100,000
200,000
300,000
400,000
Und
erly
ing
pric
e $
12.7
0
13.0
0
13.3
1
13.6
4
13.9
9
14.3
6
14.7
4
15.1
5
15.5
8
16.0
3
16.5
1
17.0
1
17.5
0
18.0
0
18.4
9
18.9
9
19.4
8
19.9
8
20.4
7
20.9
7
Zinifex return ($) Combined stock / option strategy return
$
16
Disclaimer
The information contained in this presentation is current as at 22 May 2007 unless otherwise specified and is provided by Challenger
Managed Investments Limited ABN 94 002 835 592, AFSL 234 668 (Challenger) and is intended solely for holders of an Australian financial
services licence or other wholesale clients (as defined in the Corporations Act 2001 (Cth). It must not be passed on to a retail client except
where it is included as part of the financial adviser’s own advice to their client and is not accredited to Challenger. It should be regarded as
general information only, rather than as advice. It has been prepared without taking account of any person’s objectives, financial situation or
needs. Because of that, each person should, before acting on any such information, consider its appropriateness, having regard to their
objectives, financial situation and needs. Challenger is the issuer of the Challenger Australian Share Fund ARSN 092 999 301 (Fund).
Offers of interests in the Fund are contained in the current relevant product disclosure statement (PDS) issued by Challenger which is
available on our website www.challenger.com.au. The relevant PDS should be considered before making any decision whether to acquire
or continue to hold units in the Fund. Past performance is not a reliable indicator of future performance. In preparing this presentation,
Challenger has relied on publicly available information and sources believed to be reliable. However, the information has not been
independently verified by Challenger. While due care and attention has been exercised in the preparation of the presentation, Challenger
gives no representation, warranty (express or implied) as to the accuracy, completeness or reliability of the information. The information in
this presentation is also not intended to be a complete statement or summary of the industry, markets, securities or developments referred
to in the presentation. Any opinions expressed in this presentation, including as to future matters, may be subject to change. Opinions as to
future matters are predictive in nature and may be affected by inaccurate assumptions or by known or unknown risks and uncertainties and
may differ materially from results ultimately achieved.