equity story - dnb · 2017-12-15 · average equity (lhs) roe roe ambition roe using peer average...
TRANSCRIPT
December 2017
Equity story
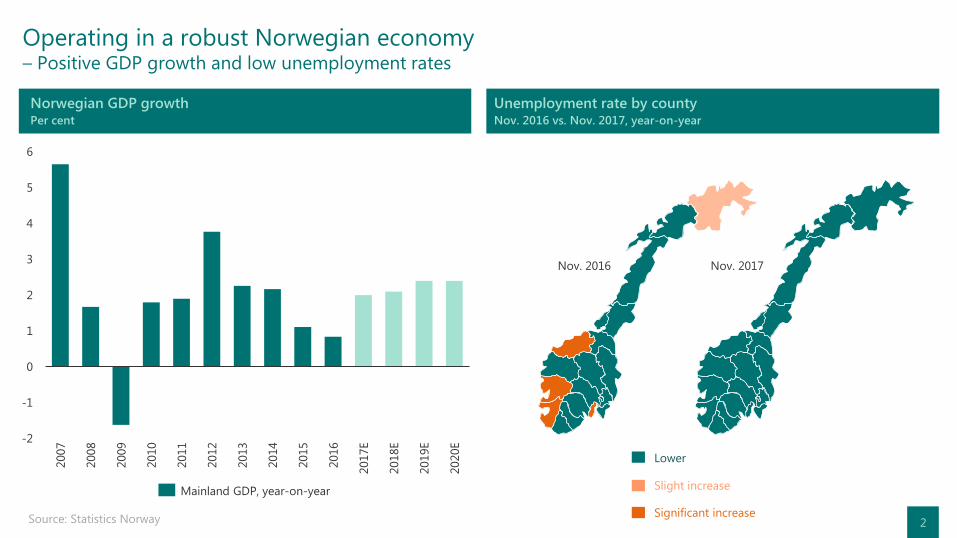
Operating in a robust Norwegian economy – Positive GDP growth and low unemployment rates
2 Source: Statistics Norway
Norwegian GDP growth Per cent
Unemployment rate by county Nov. 2016 vs. Nov. 2017, year-on-year
Significant increase
Slight increase
Lower
-2
-1
0
1
2
3
4
5
6
2007
2010
2014
2012
2011
2008
2009
2013
2015
2016
2017E
2018E
2019E
2020E
Mainland GDP, year-on-year
Nov. 2016 Nov. 2017
-200
0
200
400
600
800
1,000
1,200
1,400
0
1,000
2,000
3,000
4,000
5,000
6,000
7,000
8,000
9,000
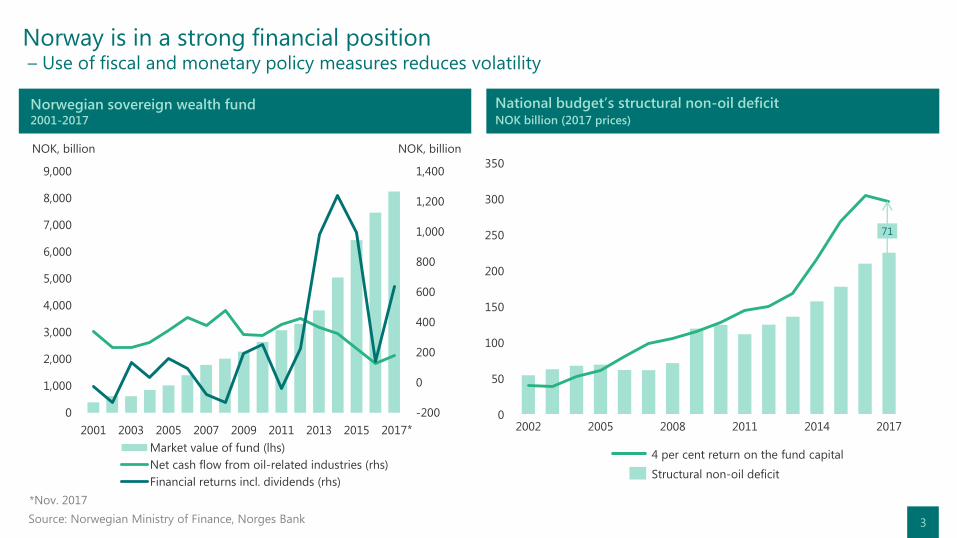
2001 2003 2005 2007 2009 2011 2013 2015 2017
Market value of fund (lhs)
Net cash flow from oil-related industries (rhs)
Financial returns incl. dividends (rhs)
Norway is in a strong financial position – Use of fiscal and monetary policy measures reduces volatility
Source: Norwegian Ministry of Finance, Norges Bank
Norwegian sovereign wealth fund 2001-2017
National budget’s structural non-oil deficit NOK billion (2017 prices)
*
*Nov. 2017
NOK, billion NOK, billion
0
50
100
150
200
250
300
350
2017 2002 2014 2005 2008 2011
4 per cent return on the fund capital
Structural non-oil deficit
71
3
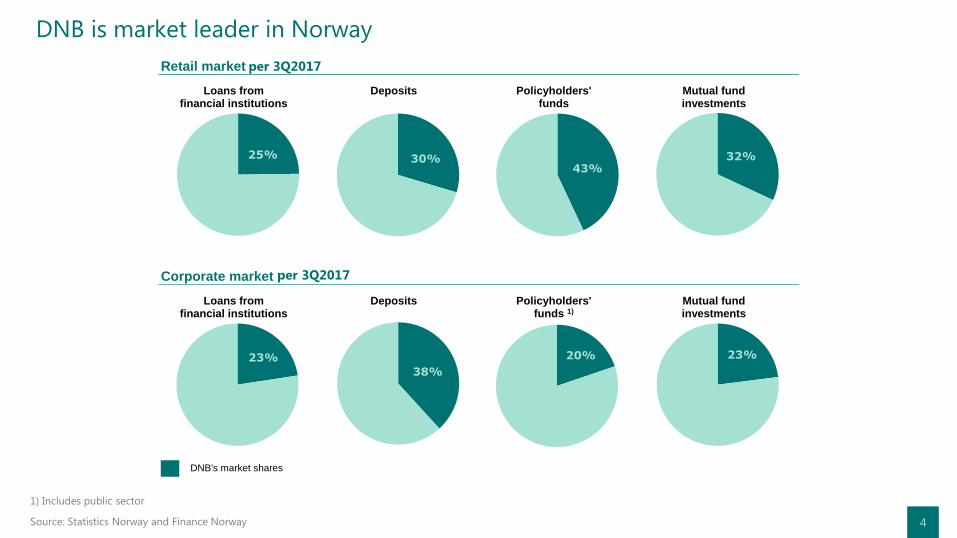
DNB is market leader in Norway Oppdatert
22.10 Retail market
Corporate market
DNB's market shares
1) Includes the public sector.
Source: Statistics Norway and Finance Norway
Loans fromfinancial institutions
25%
Deposits
30%
Policyholders'funds
43%
Mutual fundinvestments
32%
Loans fromfinancial institutions
23%
Deposits
38%
Policyholders'funds 1)
20%
Mutual fundinvestments
23%
per 3Q2017
per 3Q2017
1) Includes public sector
Source: Statistics Norway and Finance Norway 4
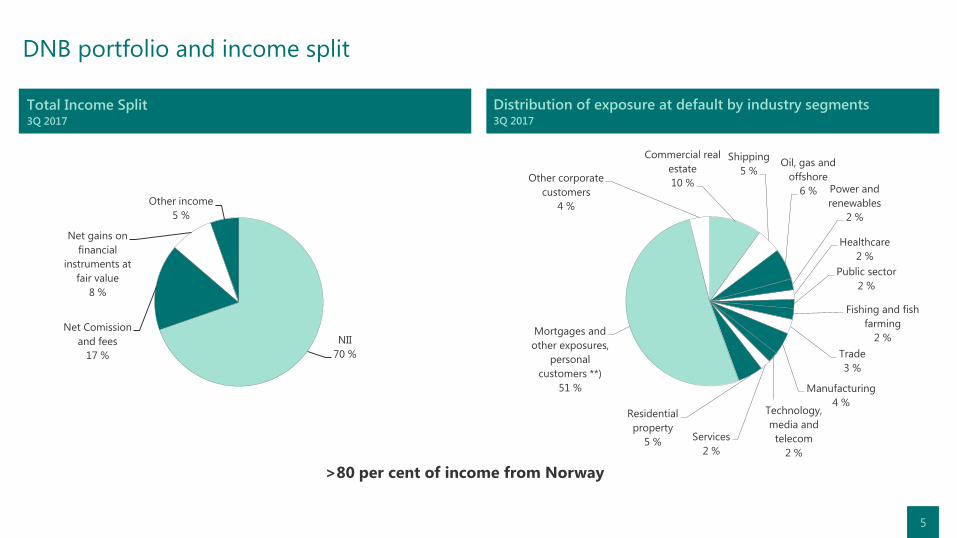
DNB portfolio and income split
5
Distribution of exposure at default by industry segments 3Q 2017
Total Income Split 3Q 2017
Commercial real
estate
10 %
Shipping
5 % Oil, gas and
offshore
6 % Power and
renewables
2 %
Healthcare
2 %
Public sector
2 %
Fishing and fish
farming
2 %
Trade
3 %
Manufacturing
4 % Technology,
media and
telecom
2 %
Services
2 %
Residential
property
5 %
Mortgages and
other exposures,
personal
customers **)
51 %
Other corporate
customers
4 %
NII
70 %
Net Comission
and fees
17 %
Net gains on
financial
instruments at
fair value
8 %
Other income
5 %
>80 per cent of income from Norway
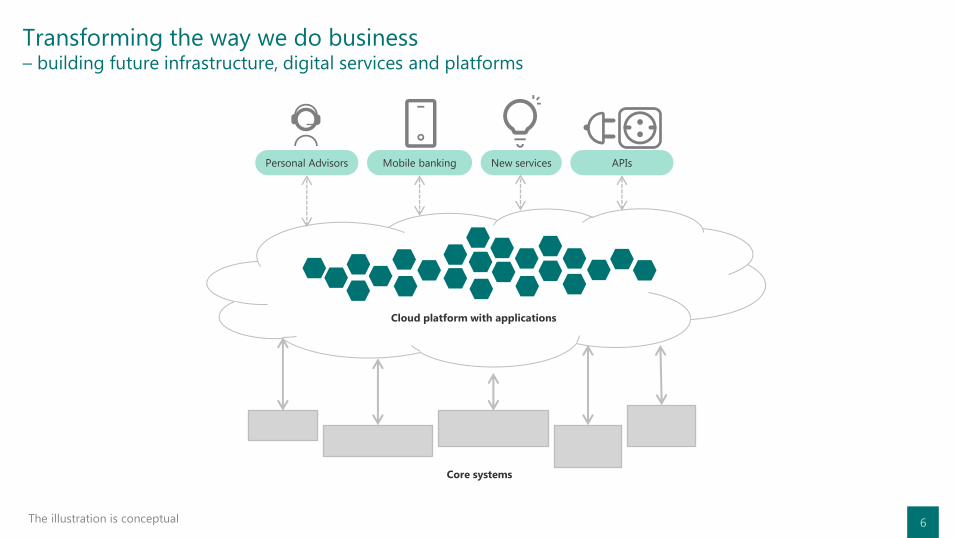
Transforming the way we do business – building future infrastructure, digital services and platforms
6 The illustration is conceptual
Core systems
Cloud platform with applications
Personal Advisors Mobile banking New services APIs
7
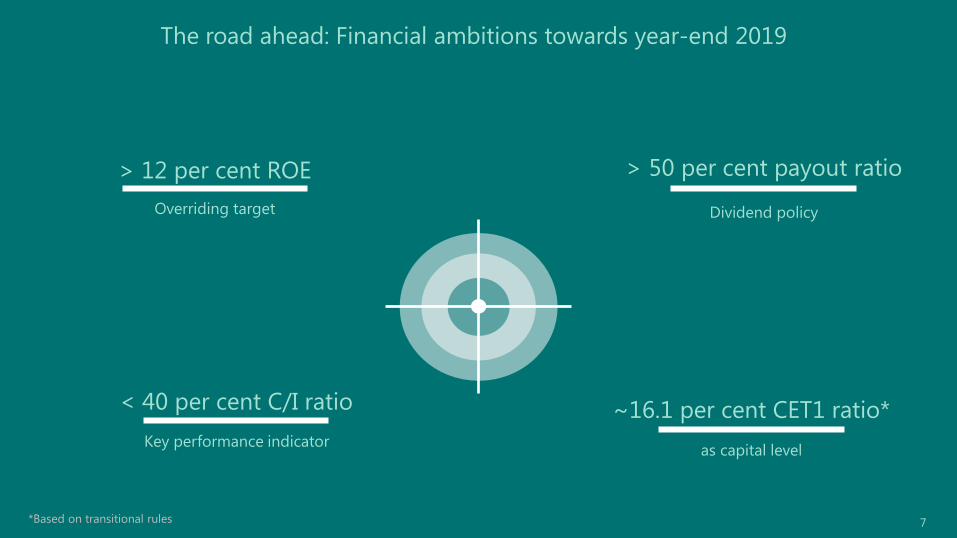
The road ahead: Financial ambitions towards year-end 2019
*Based on transitional rules
~16.1 per cent CET1 ratio*
as capital level
> 50 per cent payout ratio
Dividend policy
> 12 per cent ROE
Overriding target
< 40 per cent C/I ratio
Key performance indicator
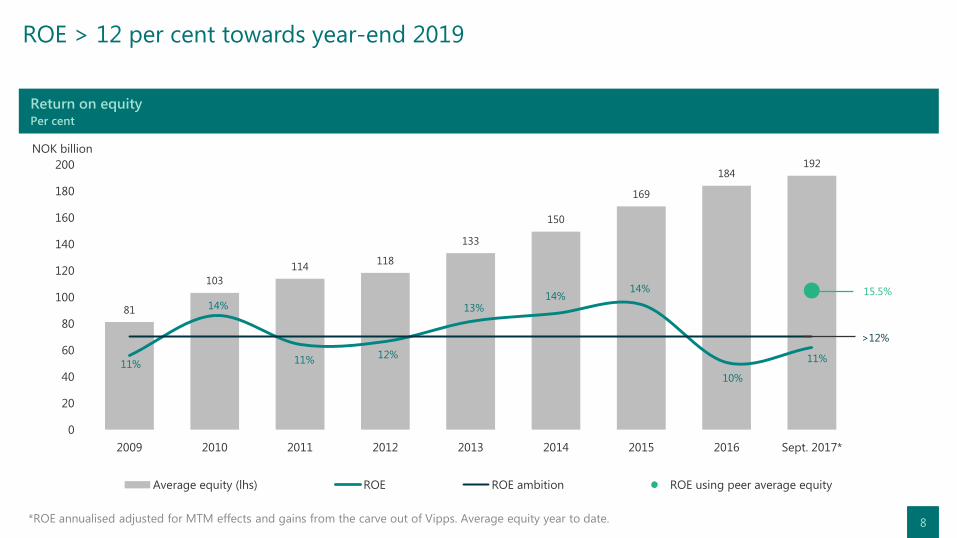
81
103
114 118
133
150
169
184 192
>12%
15.5%
0
20
40
60
80
100
120
140
160
180
200
2009 2010 2011 2012 2013 2014 2015 2016 Sept. 2017*
Average equity (lhs) ROE ROE ambition ROE using peer average equity
ROE > 12 per cent towards year-end 2019
*ROE annualised adjusted for MTM effects and gains from the carve out of Vipps. Average equity year to date. 8
Return on equity Per cent
11%
14% 14%
14%
11% 12%
13%
10%
11%
NOK billion
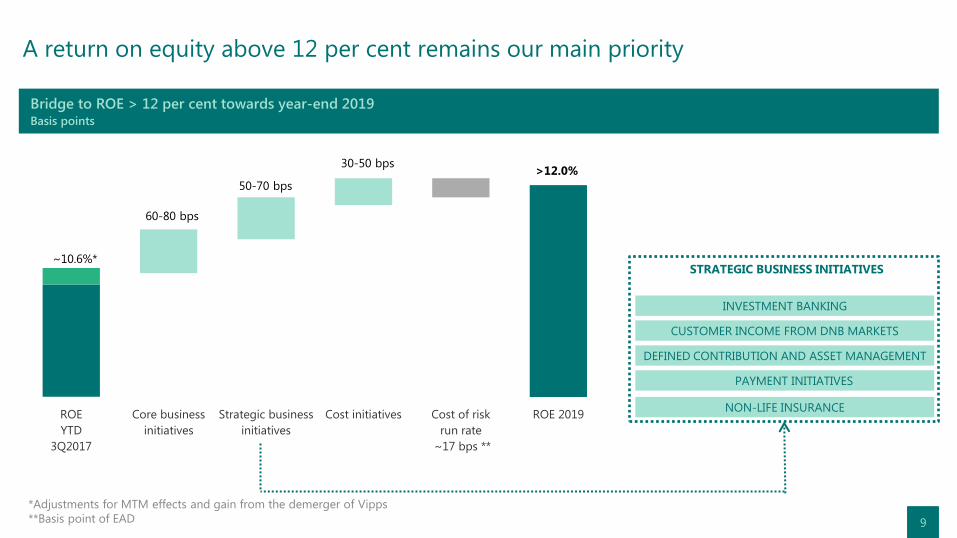
ROE
YTD
3Q2017
Core business
initiatives
Strategic business
initiatives
Cost initiatives Cost of risk
run rate
~17 bps **
ROE 2019
~10.6%*
>12.0%
60-80 bps
30-50 bps
50-70 bps
A return on equity above 12 per cent remains our main priority
*Adjustments for MTM effects and gain from the demerger of Vipps
**Basis point of EAD
INVESTMENT BANKING
CUSTOMER INCOME FROM DNB MARKETS
DEFINED CONTRIBUTION AND ASSET MANAGEMENT
PAYMENT INITIATIVES
STRATEGIC BUSINESS INITIATIVES
Bridge to ROE > 12 per cent towards year-end 2019 Basis points
NON-LIFE INSURANCE
9
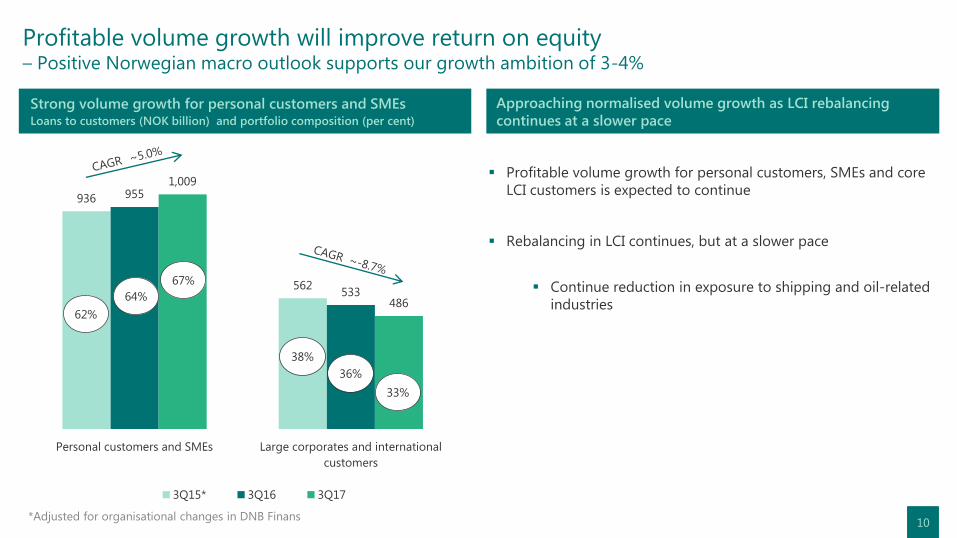
936
562
955
533
1,009
486
Personal customers and SMEs Large corporates and international
customers
3Q15* 3Q16 3Q17
Profitable volume growth will improve return on equity – Positive Norwegian macro outlook supports our growth ambition of 3-4%
*Adjusted for organisational changes in DNB Finans
Strong volume growth for personal customers and SMEs Loans to customers (NOK billion) and portfolio composition (per cent)
Approaching normalised volume growth as LCI rebalancing
continues at a slower pace
Profitable volume growth for personal customers, SMEs and core
LCI customers is expected to continue
Rebalancing in LCI continues, but at a slower pace
Continue reduction in exposure to shipping and oil-related
industries
62%
64%
67%
38%
36%
33%
10
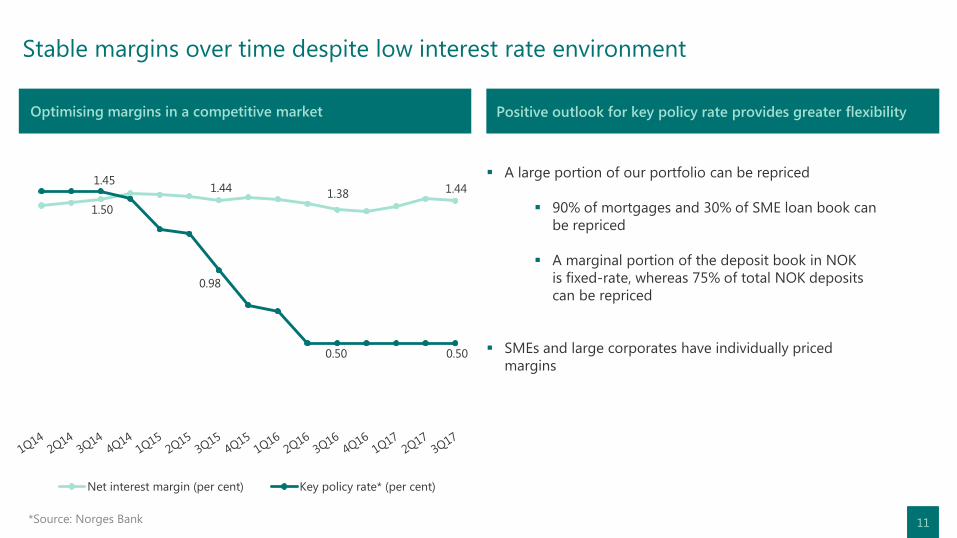
Stable margins over time despite low interest rate environment
Optimising margins in a competitive market Positive outlook for key policy rate provides greater flexibility
A large portion of our portfolio can be repriced
90% of mortgages and 30% of SME loan book can
be repriced
A marginal portion of the deposit book in NOK
is fixed-rate, whereas 75% of total NOK deposits
can be repriced
SMEs and large corporates have individually priced
margins
1.44 1.38 1.44
1.45
0.50 0.50
0.98
1.50
Net interest margin (per cent) Key policy rate* (per cent)
*Source: Norges Bank 11
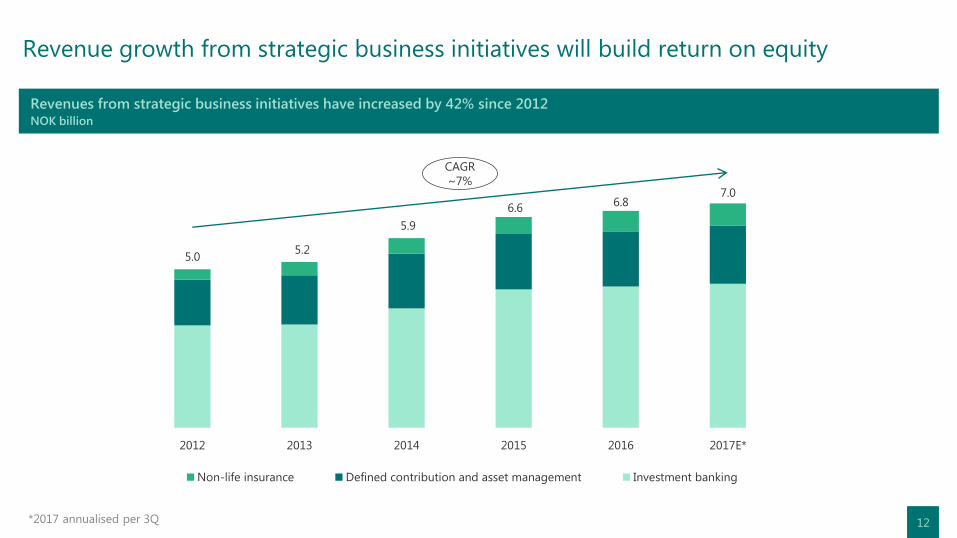
Revenue growth from strategic business initiatives will build return on equity
*2017 annualised per 3Q
Revenues from strategic business initiatives have increased by 42% since 2012 NOK billion
5.0 5.2
5.9
6.6 6.8
7.0
2012 2013 2014 2015 2016 2017E*
Non-life insurance Defined contribution and asset management Investment banking
CAGR
~7%
12
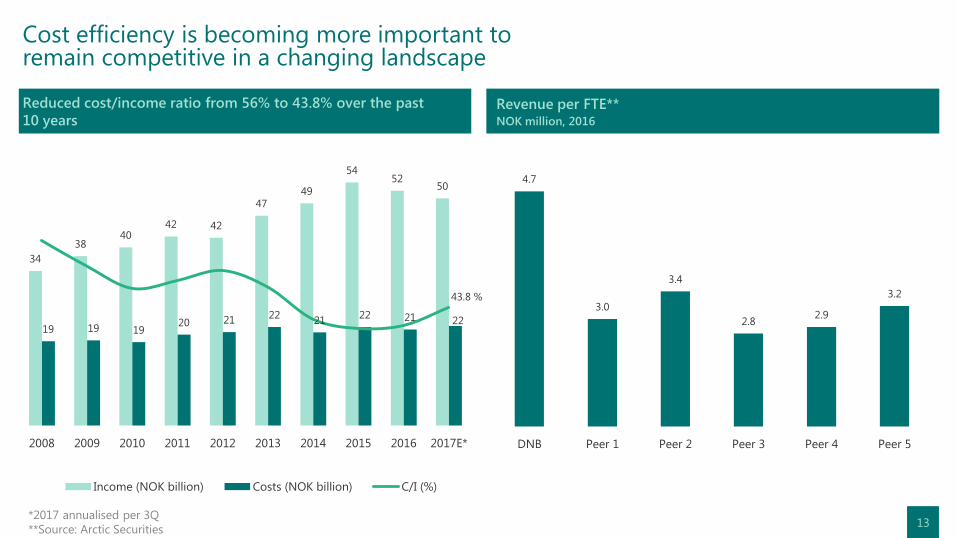
Cost efficiency is becoming more important to remain competitive in a changing landscape
*2017 annualised per 3Q
**Source: Arctic Securities
Reduced cost/income ratio from 56% to 43.8% over the past
10 years Revenue per FTE** NOK million, 2016
4.7
3.0
3.4
2.8 2.9
3.2
DNB Peer 1 Peer 2 Peer 3 Peer 4 Peer 5
34
38 40
42 42
47 49
54 52
50
19 19 19 20 21 22
21 22 21 22
43.8 %
2008 2009 2010 2011 2012 2013 2014 2015 2016 2017E*
Income (NOK billion) Costs (NOK billion) C/I (%)
13
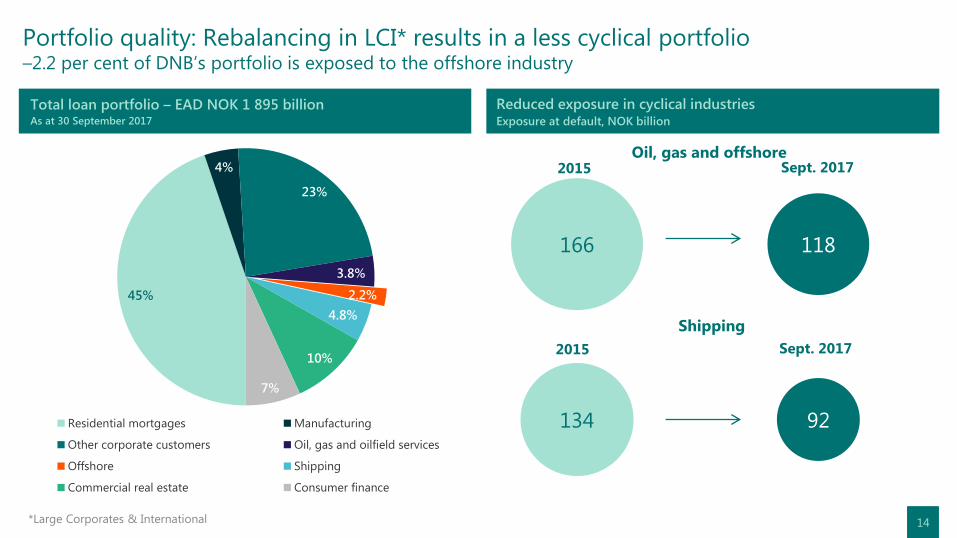
Portfolio quality: Rebalancing in LCI* results in a less cyclical portfolio –2.2 per cent of DNB’s portfolio is exposed to the offshore industry
*Large Corporates & International
Total loan portfolio – EAD NOK 1 895 billion As at 30 September 2017
Reduced exposure in cyclical industries Exposure at default, NOK billion
166
134
118
92
Oil, gas and offshore
Shipping
2015 Sept. 2017
2015 Sept. 2017
45%
4%
23%
3.8%
2.2%
4.8%
10%
7%
Residential mortgages Manufacturing
Other corporate customers Oil, gas and oilfield services
Offshore Shipping
Commercial real estate Consumer finance
14
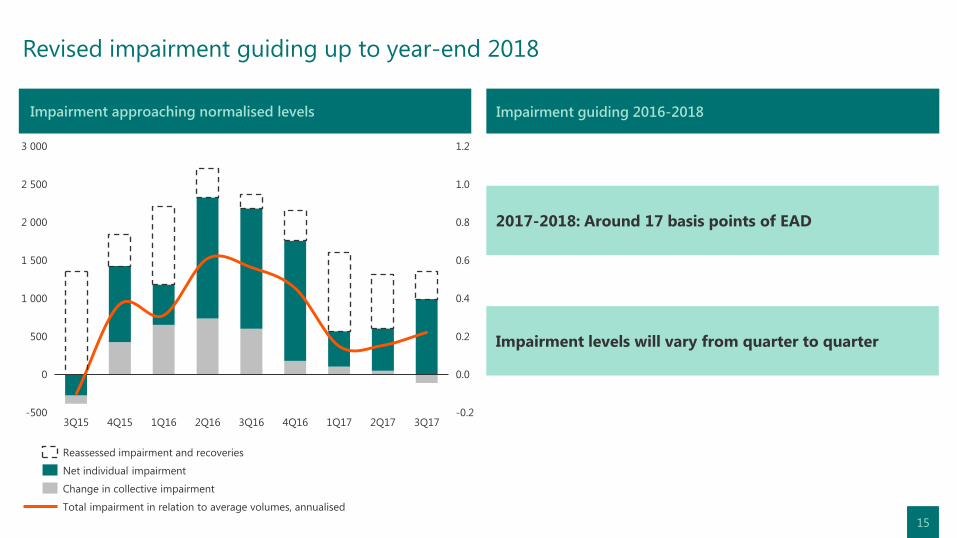
Revised impairment guiding up to year-end 2018
Impairment approaching normalised levels Impairment guiding 2016-2018
2 500
-500
1 500
1.0
0
1 000
2 000
0.6
1.2
500
0.8
3 000
-0.2
0.0
0.2
0.4
1Q17 1Q16 4Q16 3Q15 4Q15 2Q16 3Q16 3Q17 2Q17
Total impairment in relation to average volumes, annualised
Reassessed impairment and recoveries
Net individual impairment
Change in collective impairment
2017-2018: Around 17 basis points of EAD
Impairment levels will vary from quarter to quarter
15
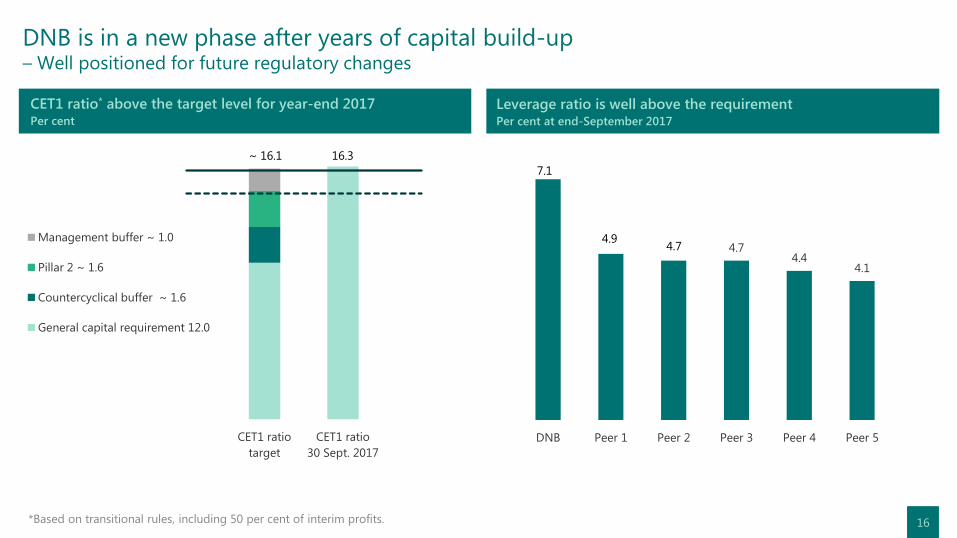
DNB is in a new phase after years of capital build-up – Well positioned for future regulatory changes
*Based on transitional rules, including 50 per cent of interim profits.
16
CET1 ratio* above the target level for year-end 2017 Per cent
Leverage ratio is well above the requirement Per cent at end-September 2017
CET1 ratio
target
CET1 ratio
30 Sept. 2017
Management buffer ~ 1.0
Pillar 2 ~ 1.6
Countercyclical buffer ~ 1.6
General capital requirement 12.0
16.3 ~ 16.1
4.7 4.4
4.1
DNB Peer 1 Peer 2 Peer 3 Peer 4 Peer 5
7.1
4.7 4.9
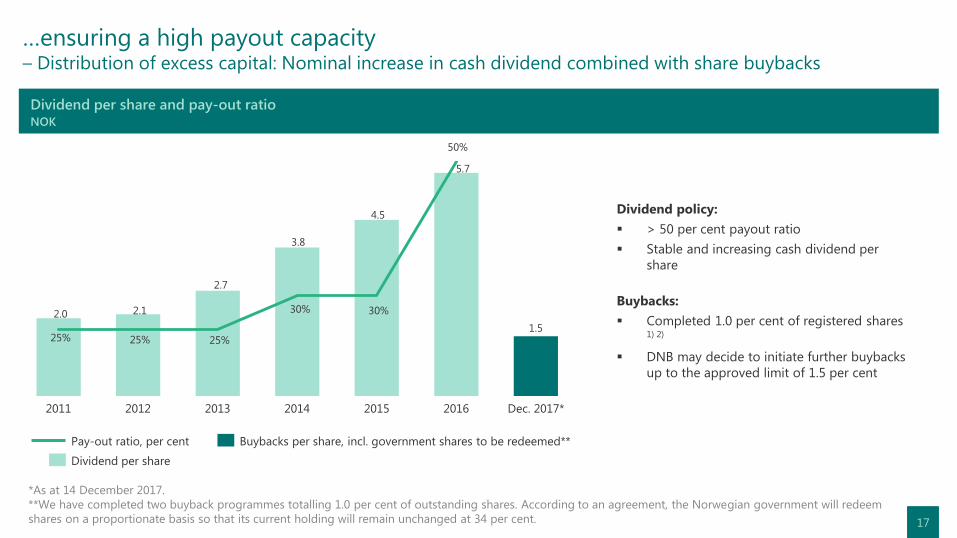
…ensuring a high payout capacity – Distribution of excess capital: Nominal increase in cash dividend combined with share buybacks
*As at 14 December 2017.
**We have completed two buyback programmes totalling 1.0 per cent of outstanding shares. According to an agreement, the Norwegian government will redeem
shares on a proportionate basis so that its current holding will remain unchanged at 34 per cent.
17
Dividend per share and pay-out ratio NOK
1.5
2011 Dec. 2017* 2014 2012 2013 2015 2016
Dividend per share
Pay-out ratio, per cent Buybacks per share, incl. government shares to be redeemed**
25% 25% 25%
30% 30%
50%
2.0 2.1
2.7
3.8
4.5
5.7
Dividend policy:
> 50 per cent payout ratio
Stable and increasing cash dividend per
share
Buybacks:
Completed 1.0 per cent of registered shares 1) 2)
DNB may decide to initiate further buybacks
up to the approved limit of 1.5 per cent

DISCLAIMER - CAUTIONARY NOTE REGARDING FORWARD-LOOKING STATEMENTS
The statements contained in this presentation may include forward-looking statements such as statements of future
expectations. These statements are based on the management’s current views and assumptions and involve both known and
unknown risks and uncertainties.
Although DNB believes that the expectations reflected in any such forward-looking statements are reasonable, no assurance
can be given that such expectations will prove to have been correct.
Actual results, performance or events may differ materially from those set out or implied in the forward-looking statements.
Important factors that may cause such a difference include, but are not limited to: (i) general economic conditions, (ii)
performance of financial markets, including market volatility and liquidity (iii) the extent of credit defaults, (iv) interest rate
levels, (v) currency exchange rates, (vi) changes in the competitive climate, (vii) changes in laws and regulations, (viii)
changes in the policies of central banks and/ or foreign governments, or supra-national entities.
DNB assumes no obligation to update any forward-looking statement.
19