erass report 2005
TRANSCRIPT
participation in exercise recreation and sport
Funded by the Australian Sports Commission and the state and territory agencies responsible for sport and recreation through the Standing Committee on Recreation and Sport
ANNUAL REPORT 2005
participation in exercise, recreation and sport survey 2005 Annual Report 1 © standing committee on recreation and sport 2006
Contents
1 introduction 0
2 Main findings 0 2.1 overall participation 0 2.2 organised participation 0 2.3 organised versus non-organised participation 0
3 comparisons over time 0 3.1 overall participation 0 3.2 organised participation 0
List of tables
national tables — 2005 0 state/territory–specific tables — 2005 0
4 explanatory notes 0 4.1 introduction 0 4.2 scope 0 4.3 Methodology 0 4.4 Questionnaire 0 4.5 comparability of the data 0 4.6 standard errors and relative standard errors 0 4.7 significance testing 0
5 exercise, recreation and sport survey questionnaire 0
6 Glossary 0
7 references 0
8 contacts 0
List of figures
Figure 1: Weekly frequency of overall participation 0
Figure 2: overall participation (three times a week or more) by age and sex 0
Figure 3: duration of overall participation in the two weeks prior to interview by age and sex — participants only 0
Figure 4: overall participation (three times a week or more) by region and sex 0
Figure 5: overall participation (three times a week or more) by indigenous status and sex 0
Figure 6: overall participation (three times a week or more) by indigenous status and region 0
Figure 7: overall participation (three times a week or more) by language spoken at home and sex 0
Figure 8: Weekly frequency of participation — overall and organised 0
Figure 9: participation rates (three times a week or more) by age and sex — organised activities 0
Figure 10: non-participation in organised activity by age and sex 0
Figure 11: organised participation (three times a week or more) by language spoken at home 0
Figure 12: participation in organised activity by type of organisation 0
Figure 13: organised participation (three times a week or more) by language spoken at home and type of organisation 0
Figure 14: overall participation (three times a week or more) — 2001 to 2005 0
Figure 15: Weekly frequency of overall participation (median) from 2001–05, by sex — all person 0
Figure 16: overall and organised participation (three times a week or more) from 2001–05, by sex 0
Figure 17: Weekly frequency of organised participation (median) from 2001–05, by sex — participants only 0
participation in exercise, recreation and sport survey 2005 Annual Report 2 © standing committee on recreation and sport 2006
1 Introduction
the exercise, recreation and sport survey (erass) is a joint initiative of the australian sports commission and the state and territory government agencies responsible for sport and recreation, and was first conducted in 2001. this publication presents results from the fifth annual erass collection, which was conducted in 2005.
erass collects information on the frequency, duration, nature and type of activities that are participated in by persons aged 15 years and over for exercise, recreation and sport during the 12 months prior to interview. participation means active ‘playing’ participation, and does not include coaching, refereeing and being a spectator or activities related to work or household chores.
the total participation rate in physical activity for exercise, recreation and sport does not reflect the number of persons who are physically active on a regular basis; it refers to the number of persons who have undertaken exercise, recreation and sport during the previous 12 months. the frequency and duration data provide an indication of the number of persons who are regularly active.
the survey is conducted quarterly throughout australia. in 2005, acnielsen research completed the fieldwork and supplied the data tables provided in this report. the report was then prepared by the australian sports commission in consultation with the states and territories.
this publication presents information regarding the:
• frequency of participation in organised and non-organised physical activity for exercise, recreation and sport
• duration of participation in organised and non-organised physical activity for exercise, recreation and sport (this information was collected for the first time in 2005)
• type of participation in physical activity for exercise, recreation and sport
• trends in participation over time.
information is available for both organised and non-organised exercise, recreation and sport, for all states and territories and for a variety of demographic variables.
this year’s erass annual report is presented differently from that of previous years. in the past, erass commentary has focused on participation statistics, namely persons who had participated in exercise, recreation and sport at least once in the 12 months prior to interview. this year, the report focuses on exploring the characteristics of persons who participated in exercise, recreation and sport at least three times a week or more on average over the 12 months prior to interview. new data tables presenting these participation statistics (that is, participating at least three times a week or more) have been included as well. all data tables provided in previous erass reports are presented at the end of this report.
participation in exercise, recreation and sport survey 2005 Annual Report 3 © standing committee on recreation and sport 2006
2 Main findings
2.1 Overall participation
Overview
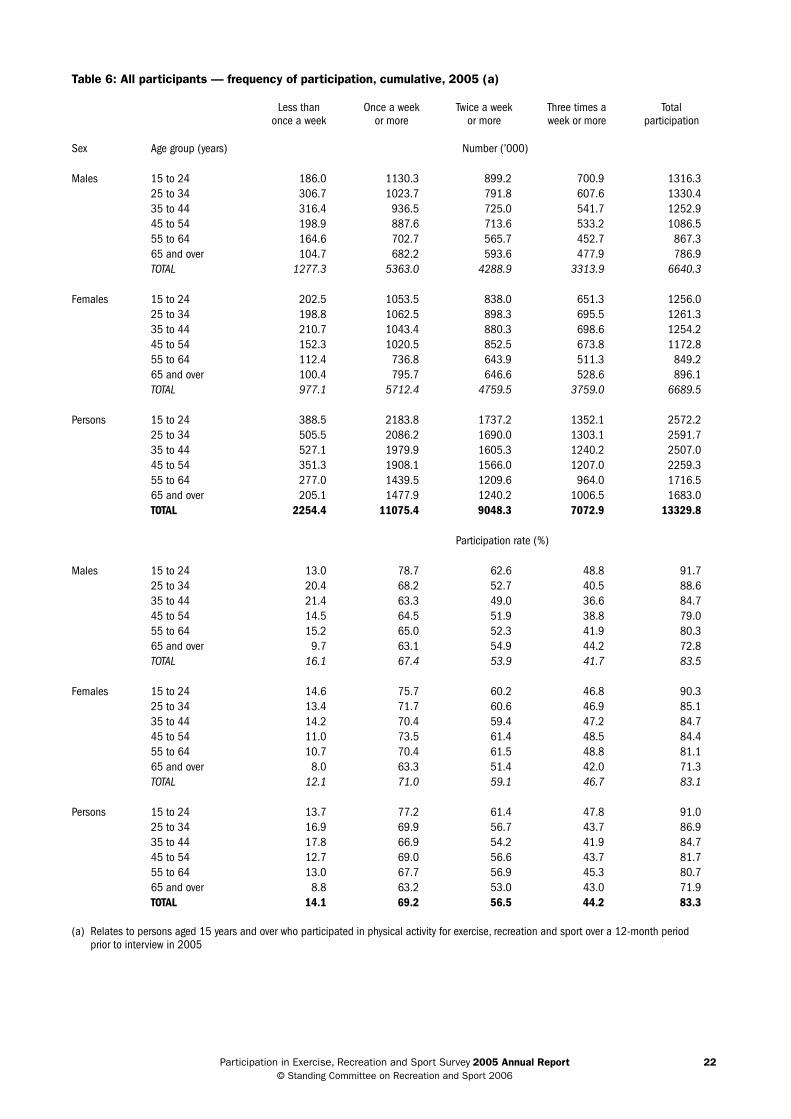
during the 12 months prior to interview in 2005, an estimated 11.1 million persons aged 15 years and over participated at least once per week1 in physical activity for exercise, recreation and sport, a participation rate of 69.2% (table 6). Household or garden chores, or activities that were part of work were not included.
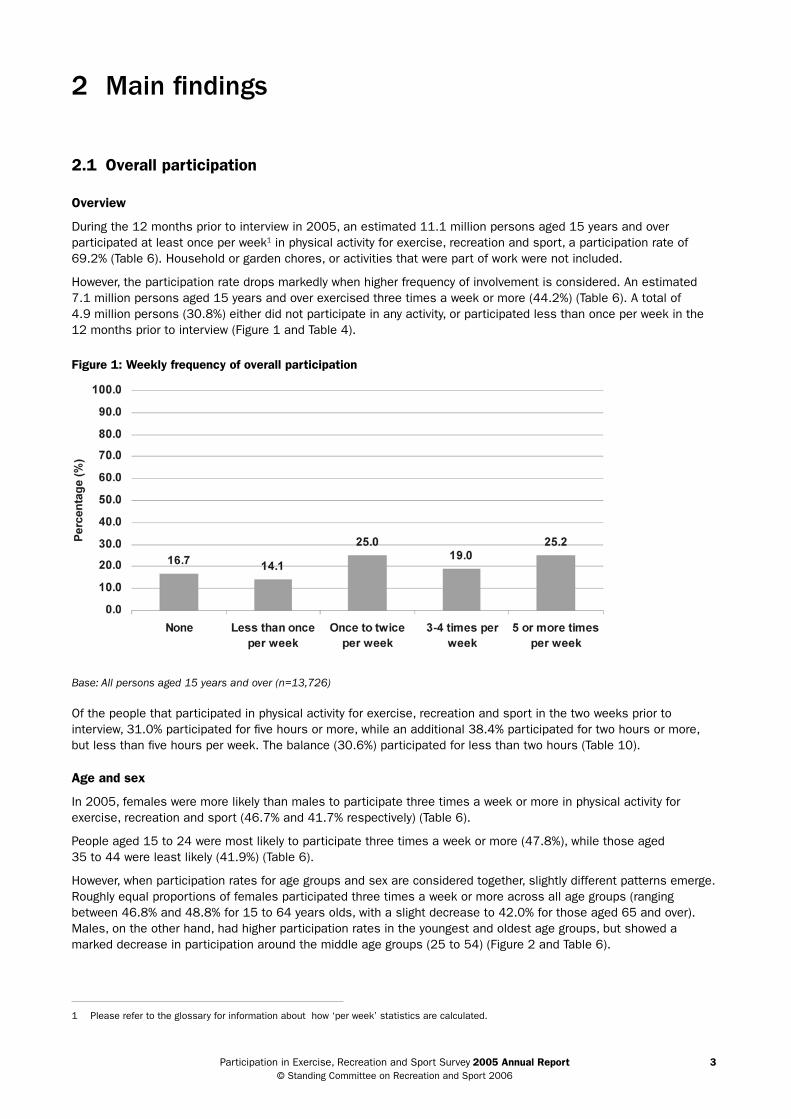
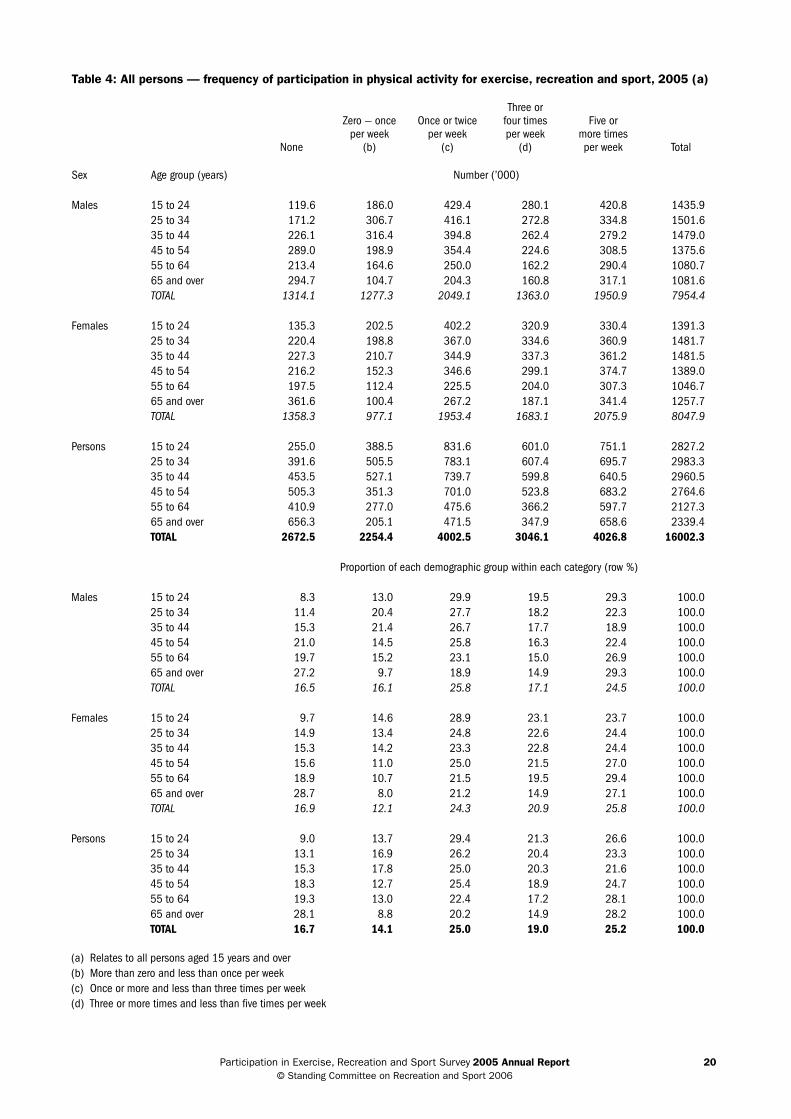
However, the participation rate drops markedly when higher frequency of involvement is considered. an estimated 7.1 million persons aged 15 years and over exercised three times a week or more (44.2%) (table 6). a total of 4.9 million persons (30.8%) either did not participate in any activity, or participated less than once per week in the 12 months prior to interview (Figure 1 and table 4).
Figure 1: Weekly frequency of overall participation
Base: All persons aged 15 years and over (n=13,726)
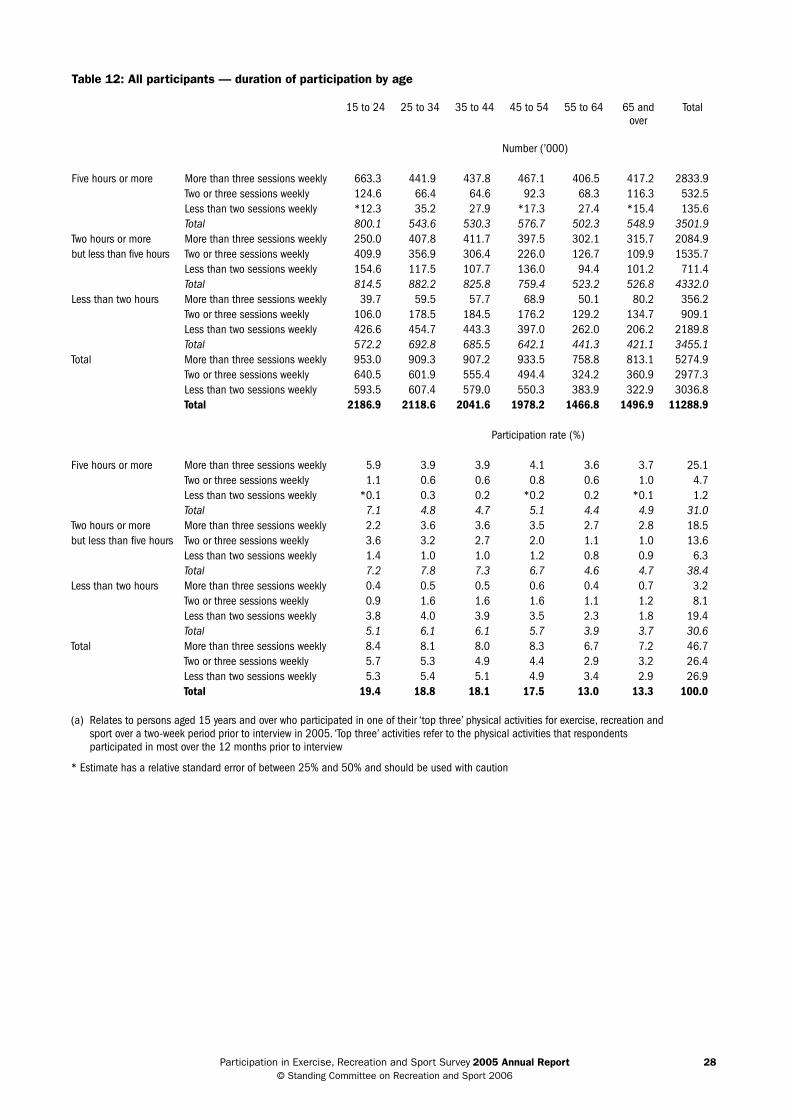
of the people that participated in physical activity for exercise, recreation and sport in the two weeks prior to interview, 31.0% participated for five hours or more, while an additional 38.4% participated for two hours or more, but less than five hours per week. the balance (30.6%) participated for less than two hours (table 10).
Age and sex
in 2005, females were more likely than males to participate three times a week or more in physical activity for exercise, recreation and sport (46.7% and 41.7% respectively) (table 6).
people aged 15 to 24 were most likely to participate three times a week or more (47.8%), while those aged 35 to 44 were least likely (41.9%) (table 6).
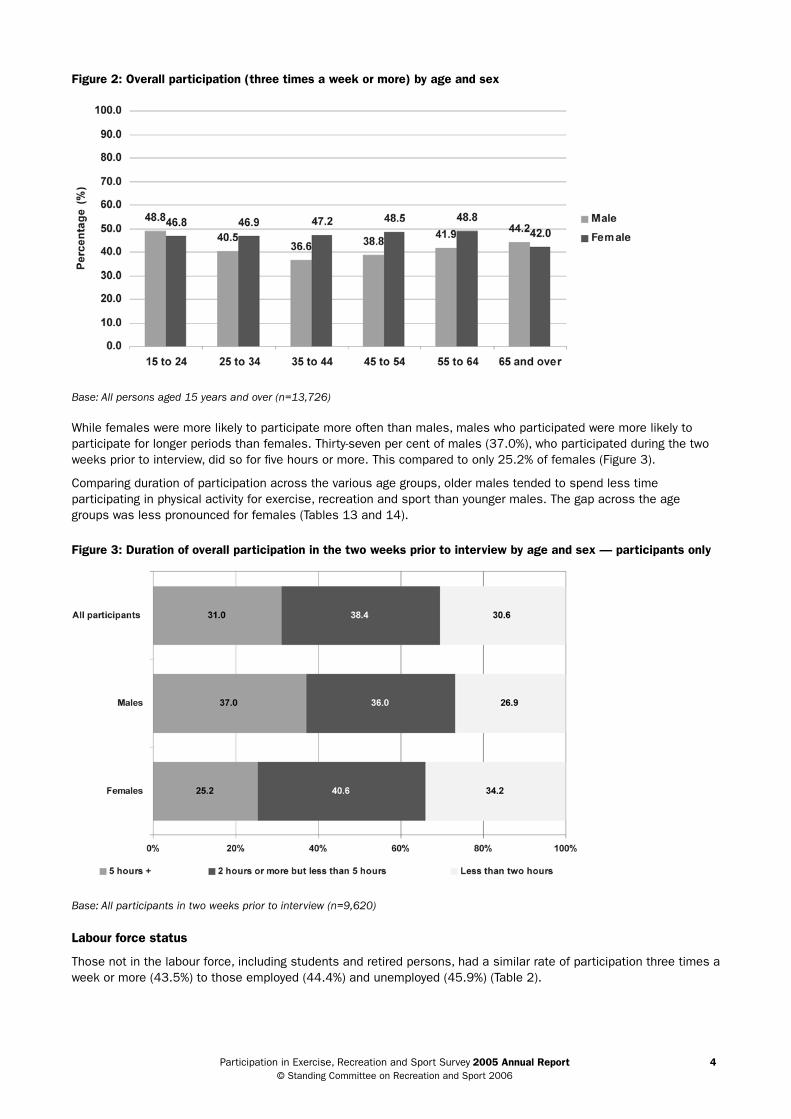
However, when participation rates for age groups and sex are considered together, slightly different patterns emerge. roughly equal proportions of females participated three times a week or more across all age groups (ranging between 46.8% and 48.8% for 15 to 64 years olds, with a slight decrease to 42.0% for those aged 65 and over). Males, on the other hand, had higher participation rates in the youngest and oldest age groups, but showed a marked decrease in participation around the middle age groups (25 to 54) (Figure 2 and table 6).
1 please refer to the glossary for information about how ‘per week’ statistics are calculated.
participation in exercise, recreation and sport survey 2005 Annual Report 4 © standing committee on recreation and sport 2006
Figure 2: Overall participation (three times a week or more) by age and sex
Base: All persons aged 15 years and over (n=13,726)
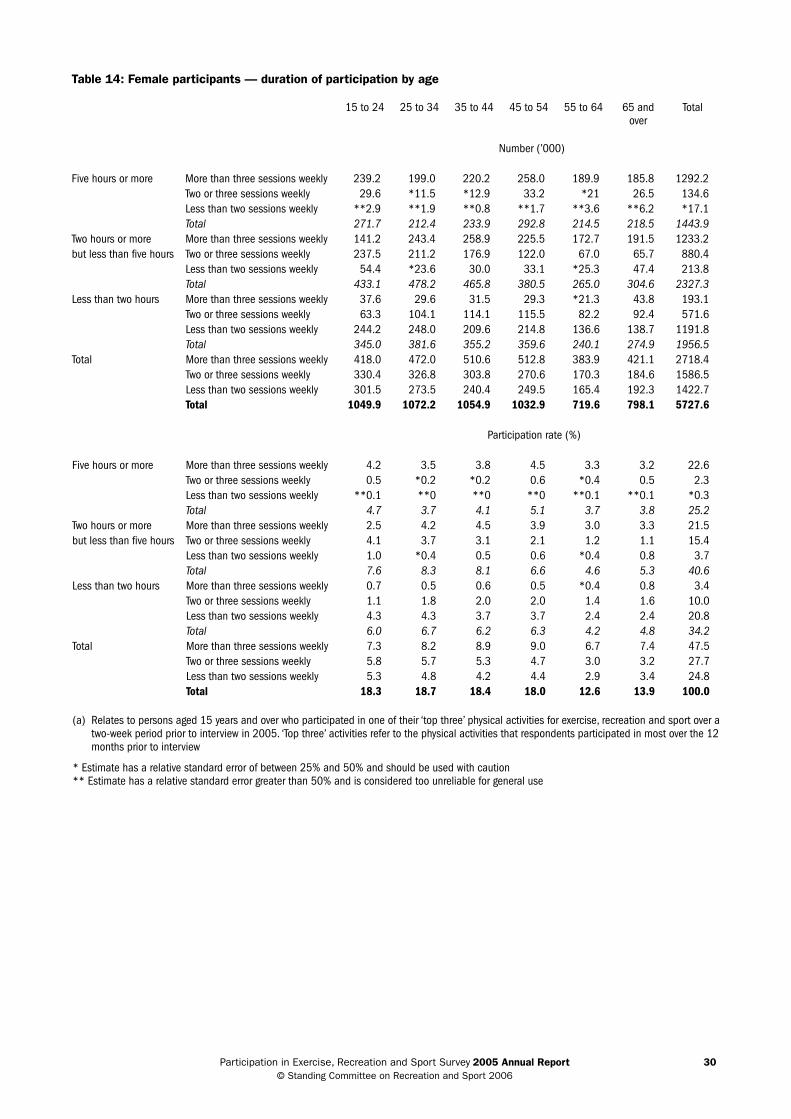
While females were more likely to participate more often than males, males who participated were more likely to participate for longer periods than females. thirty-seven per cent of males (37.0%), who participated during the two weeks prior to interview, did so for five hours or more. this compared to only 25.2% of females (Figure 3).
comparing duration of participation across the various age groups, older males tended to spend less time participating in physical activity for exercise, recreation and sport than younger males. the gap across the age groups was less pronounced for females (tables 13 and 14).
Figure 3: Duration of overall participation in the two weeks prior to interview by age and sex — participants only
Base: All participants in two weeks prior to interview (n=9,620)
Labour force status
those not in the labour force, including students and retired persons, had a similar rate of participation three times a week or more (43.5%) to those employed (44.4%) and unemployed (45.9%) (table 2).

participation in exercise, recreation and sport survey 2005 Annual Report 5 © standing committee on recreation and sport 2006
Regional status
persons living in capital cities participated slightly more in physical activity for exercise, recreation and sport three times a week or more than those living in the rest of the state (45.4% and 42.1% respectively) (table 2). in both areas, however, the level of participation three times a week or more was higher for females than for males, reflecting the national pattern (Figure 4).
Figure 4: Overall participation (three times a week or more) by region and sex
Base: All persons aged 15 years and over (n=13,726)
Education
the level of participation three times a week or more increased with the level of educational attainment, from 35.7%2 for those that never went to school to 50.2% for those with a university degree (table 2). However, the highest participation rate was for those persons still at secondary school (53.4%).
Indigenous status
this part of the report presents statistics regarding the participation of aboriginal and torres strait islander peoples in exercise, recreation and sport. in 2005, erass collected information about the indigenous status of participants for the first time. these statistics are presented in this report merely as a first step to building our understanding of the indigenous population’s participation in exercise, recreation and sport. However, it is important to note that they must be considered indicative only, and given the limitations of these statistics (described below), they should not be used as an information source to guide policy funding or development.
statistics on the indigenous population are subject to a range of data quality issues. in addition to cultural considerations in relation to statistical matters, data quality issues arise from the relatively small size of the indigenous population in comparison with the total population of australia, the high level of dispersion of the indigenous population, particularly across remote areas of australia, and the way in which indigenous persons are identified in statistical collections (aBs 2006a).
in addition, erass collects information via telephone interviews targeted at occupied dwellings. Given that the indigenous population is less likely to have access to a working home telephone3, it is difficult to establish if this survey adequately represents the true participation of the indigenous population in exercise, recreation and sport. therefore, rather than considering these statistics as absolute, readers should consider the general patterns they illustrate as approximations of the indigenous population’s participation in exercise, recreation and sport.
2 this estimate has a relative standard error of between 25% and 50% and should be used with caution. see ‘standard errors and relative standard errors’ on page xx for more information.
3 approximately 97% of the australian population have access to a working telephone in their home (acnielsen 2006). this compares to just 71% of the indigenous population. indigenous persons living in remote areas were considerably less likely than those living in non-remote areas to have access to a working telephone in their home (43% compared to 82%) (aBs 2002).

participation in exercise, recreation and sport survey 2005 Annual Report 6 © standing committee on recreation and sport 2006
a slightly lower proportion of indigenous persons (40.9%) participated in exercise, recreation and sport in 2005 three times a week or more, compared to non-indigenous persons (44.3%) (table 2).
overall, indigenous females were less likely than indigenous males to participate three times a week or more (38.5% and 43.1% respectively). interestingly, this is the opposite pattern to the non-indigenous population where non-indigenous females were more likely to participate three times a week or more than males (46.8% and 41.6% respectively) (table 2).
additionally, while equal proportions of indigenous and non-indigenous males participated in exercise, recreation and sport three times a week or more, far fewer indigenous females did so, when compared to their non-indigenous counterparts (Figure 5).
Figure 5: Overall participation (three times a week or more) by Indigenous status and sex
Base: Non-Indigenous persons (n=13,445); Indigenous persons (n=281)
Fewer indigenous persons who live in capital cities participated three times a week or more in physical activity for exercise, recreation and sport than those who live in the rest of the state (37.5% and 43.6% respectively). the opposite pattern was seen for non-indigenous persons (Figure 6).
Figure 6: Overall participation (three times a week or more) by Indigenous status and region
Base: Non-Indigenous persons (n=13,445); Indigenous persons (n=281)
participation in exercise, recreation and sport survey 2005 Annual Report 7 © standing committee on recreation and sport 2006
Language spoken at home
this part of the report presents statistics regarding participation in exercise, recreation and sport among persons who speak languages other than english at home. Given that erass collects information via telephone, persons who do not speak english well may have been less likely to participate in this survey. However, given that a large majority of persons who speak a language other than english at home speak english well4, it is reasonable to assume that these statistics represent an accurate estimation of their participation in exercise, recreation and sport.
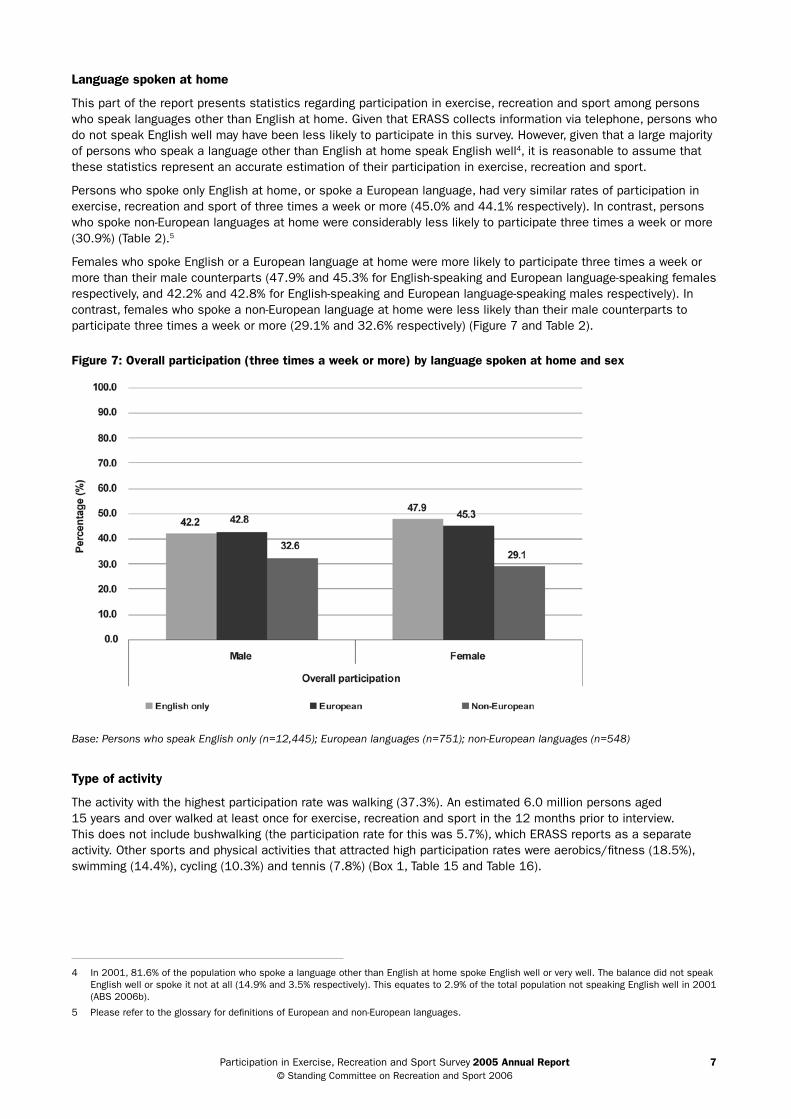
persons who spoke only english at home, or spoke a european language, had very similar rates of participation in exercise, recreation and sport of three times a week or more (45.0% and 44.1% respectively). in contrast, persons who spoke non-european languages at home were considerably less likely to participate three times a week or more (30.9%) (table 2).5
Females who spoke english or a european language at home were more likely to participate three times a week or more than their male counterparts (47.9% and 45.3% for english-speaking and european language-speaking females respectively, and 42.2% and 42.8% for english-speaking and european language-speaking males respectively). in contrast, females who spoke a non-european language at home were less likely than their male counterparts to participate three times a week or more (29.1% and 32.6% respectively) (Figure 7 and table 2).
Figure 7: Overall participation (three times a week or more) by language spoken at home and sex
Base: Persons who speak English only (n=12,445); European languages (n=751); non-European languages (n=548)
Type of activity
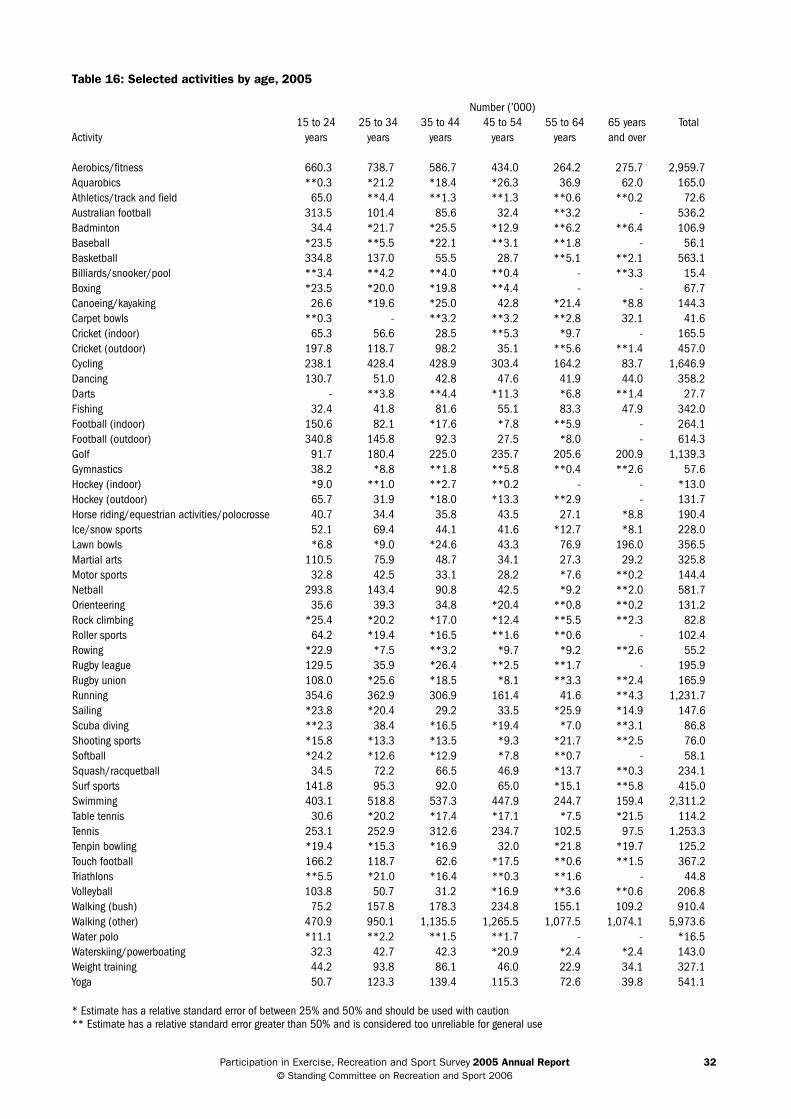
the activity with the highest participation rate was walking (37.3%). an estimated 6.0 million persons aged 15 years and over walked at least once for exercise, recreation and sport in the 12 months prior to interview. this does not include bushwalking (the participation rate for this was 5.7%), which erass reports as a separate activity. other sports and physical activities that attracted high participation rates were aerobics/fitness (18.5%), swimming (14.4%), cycling (10.3%) and tennis (7.8%) (Box 1, table 15 and table 16).
4 in 2001, 81.6% of the population who spoke a language other than english at home spoke english well or very well. the balance did not speak english well or spoke it not at all (14.9% and 3.5% respectively). this equates to 2.9% of the total population not speaking english well in 2001 (aBs 2006b).
5 please refer to the glossary for definitions of european and non-european languages.
participation in exercise, recreation and sport survey 2005 Annual Report 8 © standing committee on recreation and sport 2006
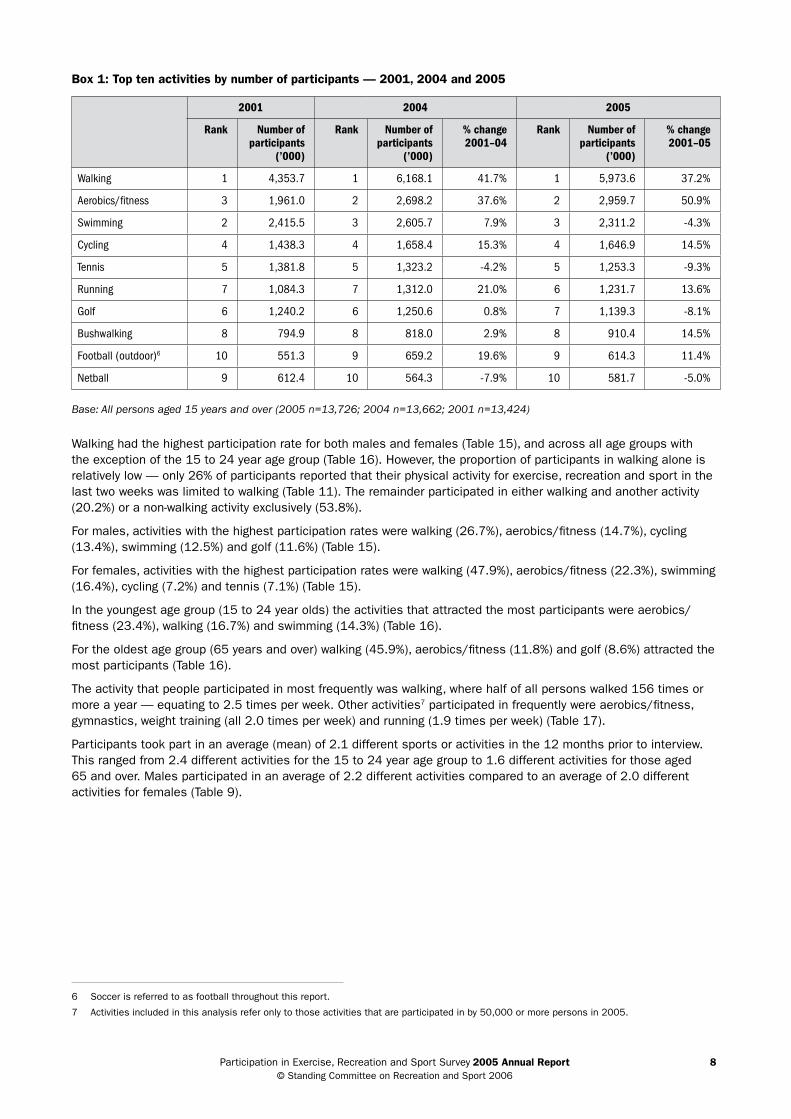
Box 1: Top ten activities by number of participants — 2001, 2004 and 2005
2001 2004 2005
Rank Number of participants
(’000)
Rank Number of participants
(’000)
% change2001–04
Rank Number of participants
(’000)
% change2001–05
Walking 1 4,353.7 1 6,168.1 41.7% 1 5,973.6 37.2%
Aerobics/fitness 3 1,961.0 2 2,698.2 37.6% 2 2,959.7 50.9%
Swimming 2 2,415.5 3 2,605.7 7.9% 3 2,311.2 -4.3%
Cycling 4 1,438.3 4 1,658.4 15.3% 4 1,646.9 14.5%
Tennis 5 1,381.8 5 1,323.2 -4.2% 5 1,253.3 -9.3%
Running 7 1,084.3 7 1,312.0 21.0% 6 1,231.7 13.6%
Golf 6 1,240.2 6 1,250.6 0.8% 7 1,139.3 -8.1%
Bushwalking 8 794.9 8 818.0 2.9% 8 910.4 14.5%
Football (outdoor)6 10 551.3 9 659.2 19.6% 9 614.3 11.4%
Netball 9 612.4 10 564.3 -7.9% 10 581.7 -5.0%
Base: All persons aged 15 years and over (2005 n=13,726; 2004 n=13,662; 2001 n=13,424)
Walking had the highest participation rate for both males and females (table 15), and across all age groups with the exception of the 15 to 24 year age group (table 16). However, the proportion of participants in walking alone is relatively low — only 26% of participants reported that their physical activity for exercise, recreation and sport in the last two weeks was limited to walking (table 11). the remainder participated in either walking and another activity (20.2%) or a non-walking activity exclusively (53.8%).
For males, activities with the highest participation rates were walking (26.7%), aerobics/fitness (14.7%), cycling (13.4%), swimming (12.5%) and golf (11.6%) (table 15).
For females, activities with the highest participation rates were walking (47.9%), aerobics/fitness (22.3%), swimming (16.4%), cycling (7.2%) and tennis (7.1%) (table 15).
in the youngest age group (15 to 24 year olds) the activities that attracted the most participants were aerobics/fitness (23.4%), walking (16.7%) and swimming (14.3%) (table 16).
For the oldest age group (65 years and over) walking (45.9%), aerobics/fitness (11.8%) and golf (8.6%) attracted the most participants (table 16).
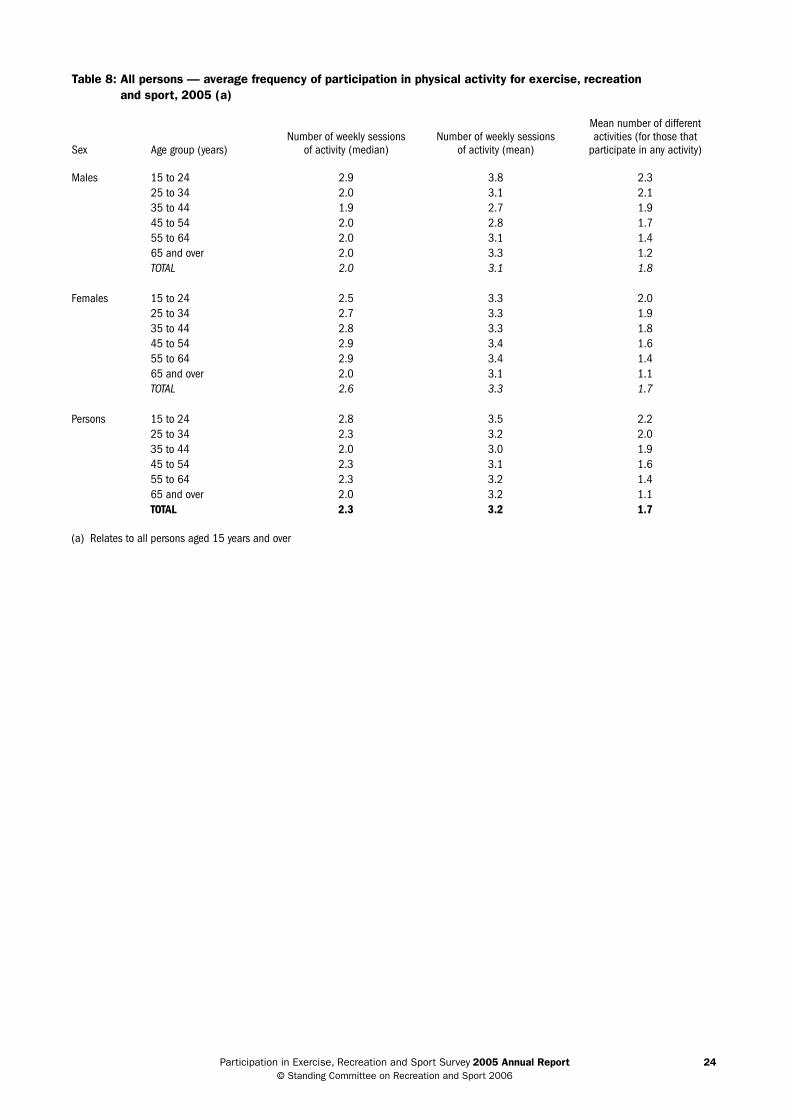
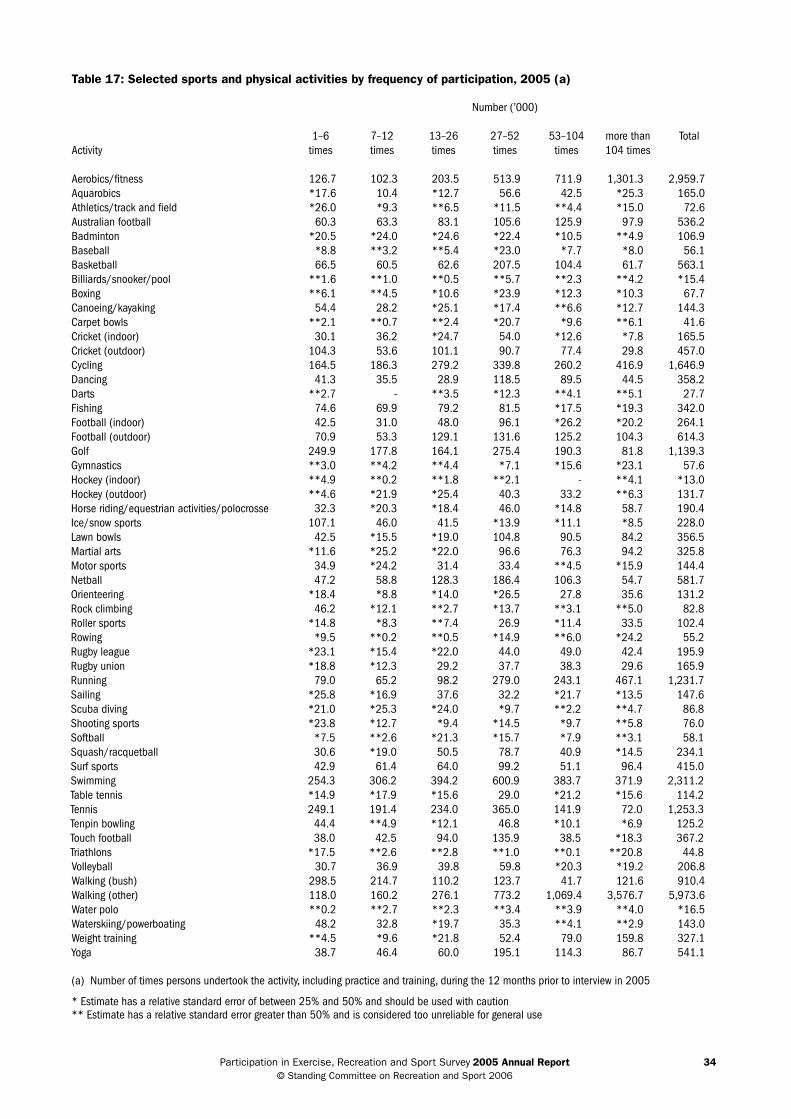
the activity that people participated in most frequently was walking, where half of all persons walked 156 times or more a year — equating to 2.5 times per week. other activities7 participated in frequently were aerobics/fitness, gymnastics, weight training (all 2.0 times per week) and running (1.9 times per week) (table 17).
participants took part in an average (mean) of 2.1 different sports or activities in the 12 months prior to interview. this ranged from 2.4 different activities for the 15 to 24 year age group to 1.6 different activities for those aged 65 and over. Males participated in an average of 2.2 different activities compared to an average of 2.0 different activities for females (table 9).
6 soccer is referred to as football throughout this report.
7 activities included in this analysis refer only to those activities that are participated in by 50,000 or more persons in 2005.
participation in exercise, recreation and sport survey 2005 Annual Report 9 © standing committee on recreation and sport 2006
2.2 Organised participation
Overview
during the 12 months prior to interview in 2005, an estimated 4.5 million persons aged 15 years and over participated at least once per week in a physical activity for exercise, recreation and sport that was organised by a club, association, fitness centre or other type of organisation. this represents a participation rate of 28.4% (table 7). it also represents 41% of the 11.1 million persons who participated at least once per week in a physical activity for exercise, recreation and sport.
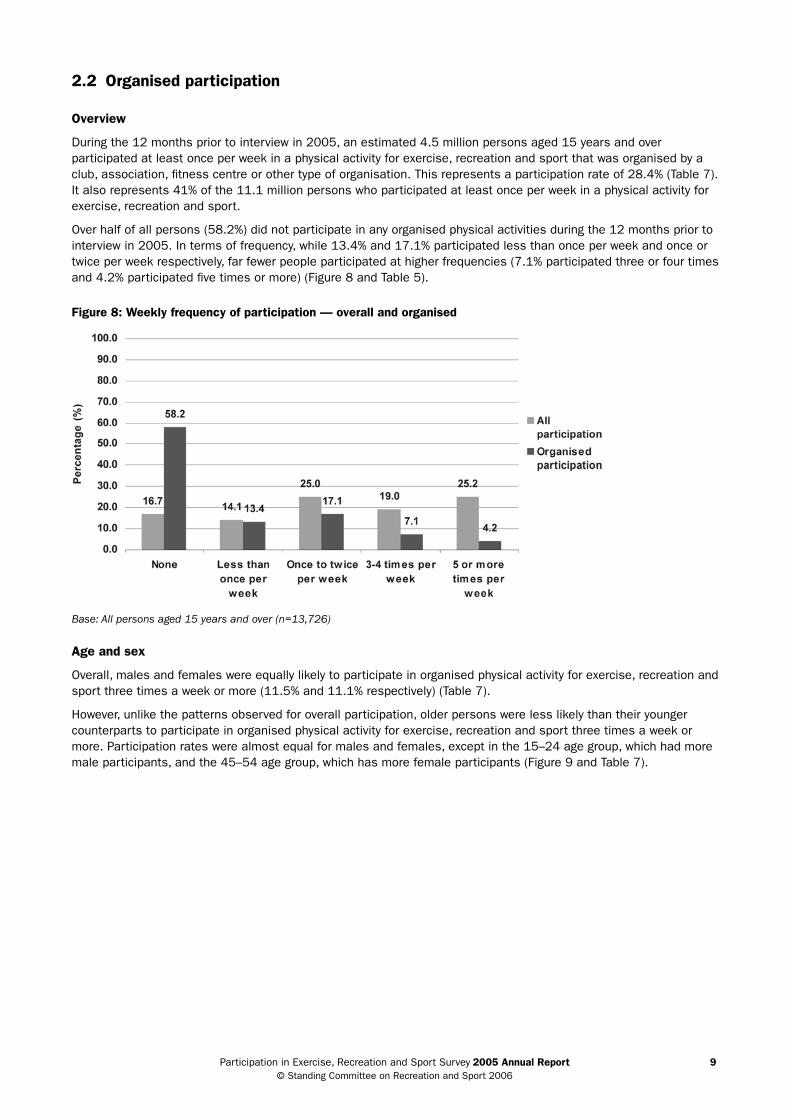
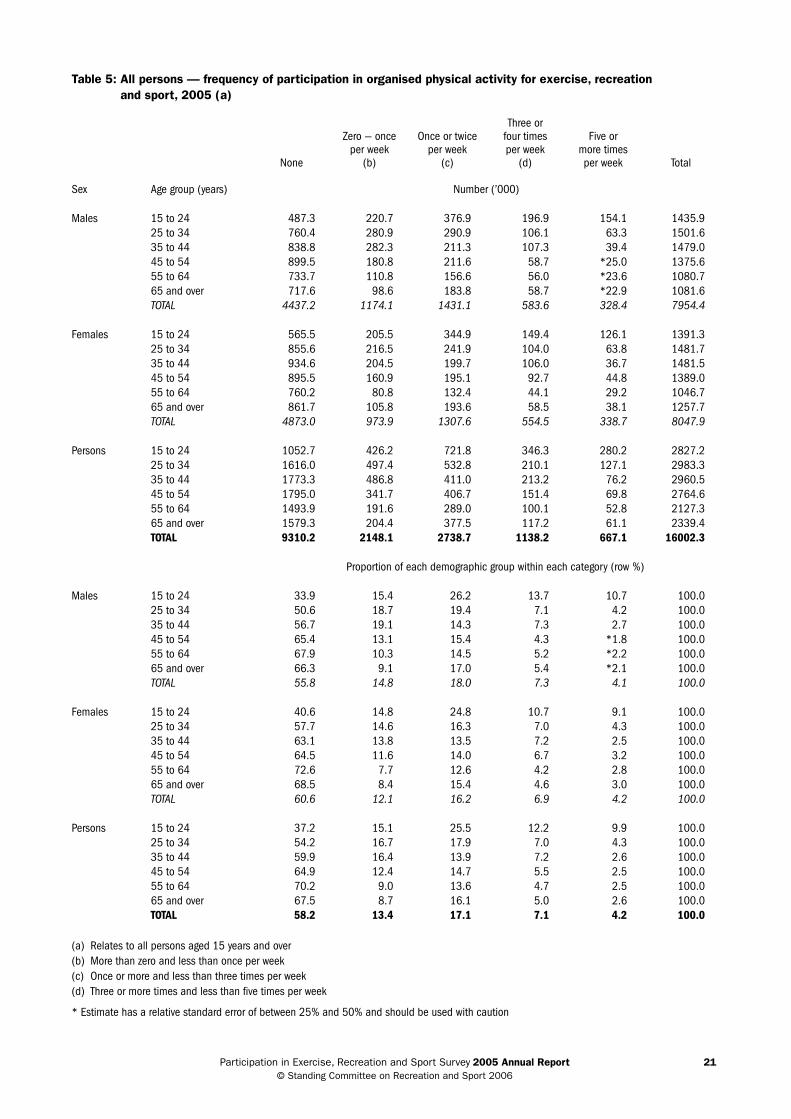
over half of all persons (58.2%) did not participate in any organised physical activities during the 12 months prior to interview in 2005. in terms of frequency, while 13.4% and 17.1% participated less than once per week and once or twice per week respectively, far fewer people participated at higher frequencies (7.1% participated three or four times and 4.2% participated five times or more) (Figure 8 and table 5).
Figure 8: Weekly frequency of participation — overall and organised
Base: All persons aged 15 years and over (n=13,726)
Age and sex
overall, males and females were equally likely to participate in organised physical activity for exercise, recreation and sport three times a week or more (11.5% and 11.1% respectively) (table 7).
However, unlike the patterns observed for overall participation, older persons were less likely than their younger counterparts to participate in organised physical activity for exercise, recreation and sport three times a week or more. participation rates were almost equal for males and females, except in the 15–24 age group, which had more male participants, and the 45–54 age group, which has more female participants (Figure 9 and table 7).
participation in exercise, recreation and sport survey 2005 Annual Report 10 © standing committee on recreation and sport 2006
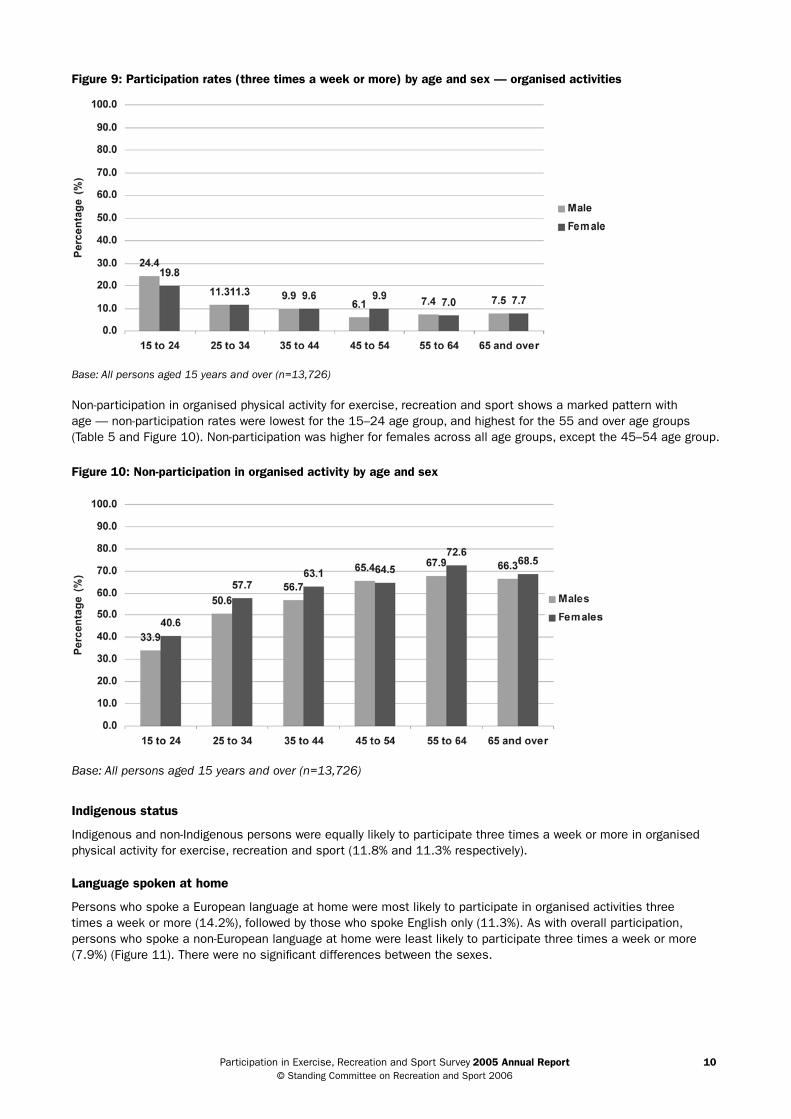
Figure 9: Participation rates (three times a week or more) by age and sex — organised activities
Base: All persons aged 15 years and over (n=13,726)
non-participation in organised physical activity for exercise, recreation and sport shows a marked pattern with age — non-participation rates were lowest for the 15–24 age group, and highest for the 55 and over age groups (table 5 and Figure 10). non-participation was higher for females across all age groups, except the 45–54 age group.
Figure 10: Non-participation in organised activity by age and sex
Base: All persons aged 15 years and over (n=13,726)
Indigenous status
indigenous and non-indigenous persons were equally likely to participate three times a week or more in organised physical activity for exercise, recreation and sport (11.8% and 11.3% respectively).
Language spoken at home
persons who spoke a european language at home were most likely to participate in organised activities three times a week or more (14.2%), followed by those who spoke english only (11.3%). as with overall participation, persons who spoke a non-european language at home were least likely to participate three times a week or more (7.9%) (Figure 11). there were no significant differences between the sexes.

participation in exercise, recreation and sport survey 2005 Annual Report 11 © standing committee on recreation and sport 2006
Figure 11: Organised participation (three times a week or more) by language spoken at home
Base: Persons who speak English only (n=12,445); European languages (n=751); non-European languages (n=548)
Organisation of the activity
an estimated 4.5 million persons participated at least once in activities that were organised by a ‘sport or recreation club or association’. an estimated 2.2 million persons participated in activities that were organised by a ‘fitness, leisure or indoor sports centre’. in comparison, relatively few people participated in activities that were organised by school or work (529,000 and 186,000 respectively) (table 22).
it is worthwhile noting that while activities organised by schools involve relatively small numbers of persons, school-organised activities are a significant source for organised physical activity for 15 to 19 year olds. twenty-nine per cent (29.0%) of 15 to 19 year olds participated in activities that were organised by a school in the 12 months prior to interview. Meanwhile, 48.5% participated through a sport or recreation club or association.
Females participating in organised physical activity were more likely than men to choose activities organised by a fitness, leisure or indoor sports centre (16.5% and 11.4% respectively). Meanwhile, far more males participated in activities organised by a sport or recreation club or association than females (33.5% and 23.4% respectively) (Figure 12 and table 22).
Figure 12: Participation in organised activity by type of organisation
Base: All persons aged 15 years and over (n=13,726)
participation in exercise, recreation and sport survey 2005 Annual Report 12 © standing committee on recreation and sport 2006
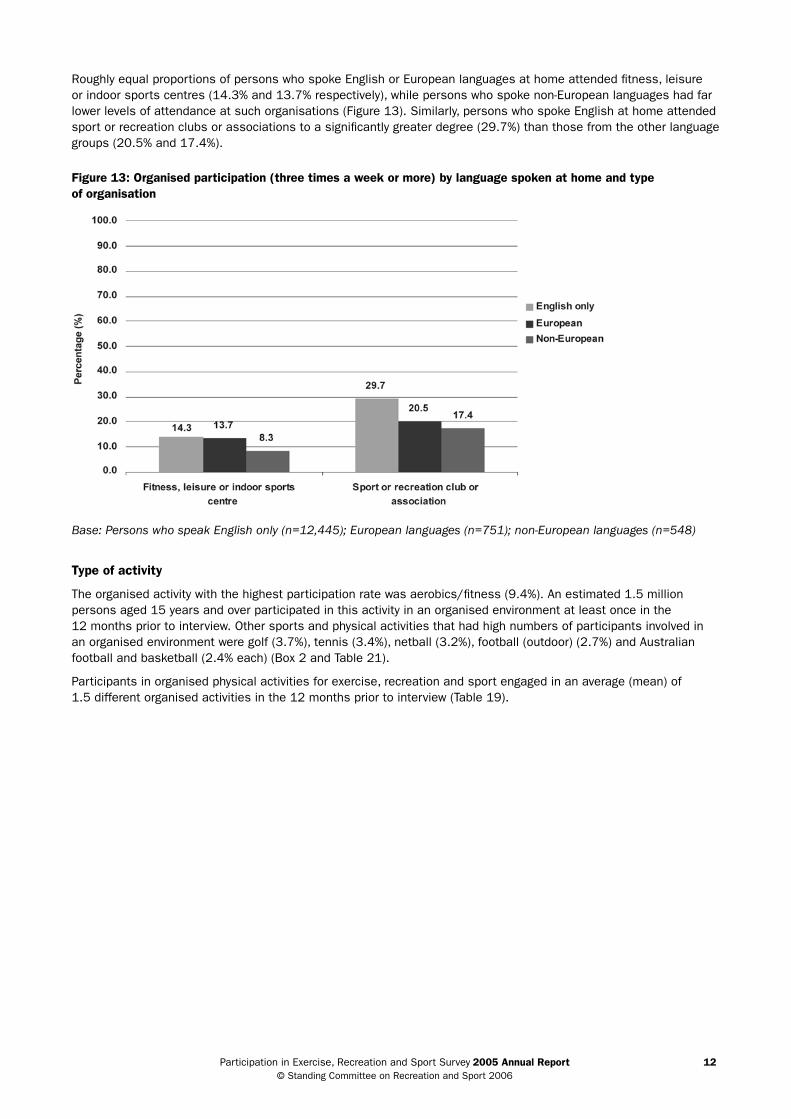
roughly equal proportions of persons who spoke english or european languages at home attended fitness, leisure or indoor sports centres (14.3% and 13.7% respectively), while persons who spoke non-european languages had far lower levels of attendance at such organisations (Figure 13). similarly, persons who spoke english at home attended sport or recreation clubs or associations to a significantly greater degree (29.7%) than those from the other language groups (20.5% and 17.4%).
Figure 13: Organised participation (three times a week or more) by language spoken at home and type of organisation
Base: Persons who speak English only (n=12,445); European languages (n=751); non-European languages (n=548)
Type of activity
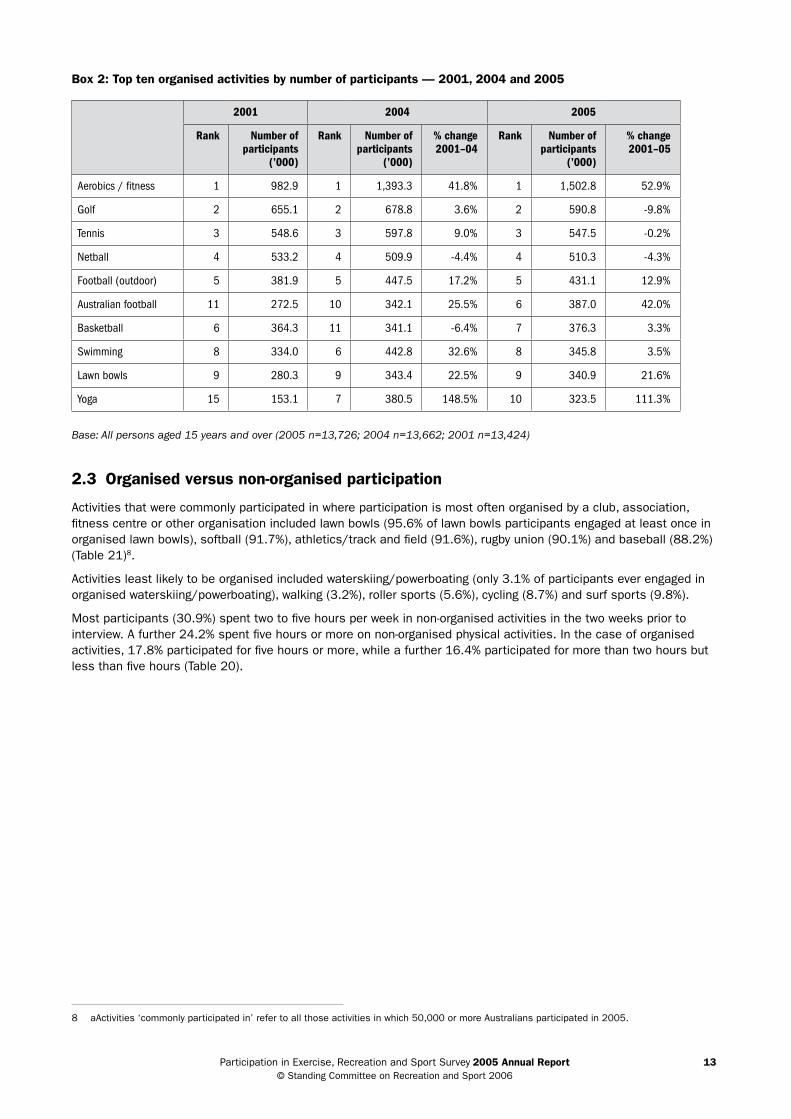
the organised activity with the highest participation rate was aerobics/fitness (9.4%). an estimated 1.5 million persons aged 15 years and over participated in this activity in an organised environment at least once in the 12 months prior to interview. other sports and physical activities that had high numbers of participants involved in an organised environment were golf (3.7%), tennis (3.4%), netball (3.2%), football (outdoor) (2.7%) and australian football and basketball (2.4% each) (Box 2 and table 21).
participants in organised physical activities for exercise, recreation and sport engaged in an average (mean) of 1.5 different organised activities in the 12 months prior to interview (table 19).
participation in exercise, recreation and sport survey 2005 Annual Report 13 © standing committee on recreation and sport 2006
Box 2: Top ten organised activities by number of participants — 2001, 2004 and 2005
2001 2004 2005
Rank Number of participants
(’000)
Rank Number of participants
(’000)
% change2001–04
Rank Number of participants
(’000)
% change2001–05
Aerobics / fitness 1 982.9 1 1,393.3 41.8% 1 1,502.8 52.9%
Golf 2 655.1 2 678.8 3.6% 2 590.8 -9.8%
Tennis 3 548.6 3 597.8 9.0% 3 547.5 -0.2%
Netball 4 533.2 4 509.9 -4.4% 4 510.3 -4.3%
Football (outdoor) 5 381.9 5 447.5 17.2% 5 431.1 12.9%
Australian football 11 272.5 10 342.1 25.5% 6 387.0 42.0%
Basketball 6 364.3 11 341.1 -6.4% 7 376.3 3.3%
Swimming 8 334.0 6 442.8 32.6% 8 345.8 3.5%
Lawn bowls 9 280.3 9 343.4 22.5% 9 340.9 21.6%
Yoga 15 153.1 7 380.5 148.5% 10 323.5 111.3%
Base: All persons aged 15 years and over (2005 n=13,726; 2004 n=13,662; 2001 n=13,424)
2.3 Organised versus non-organised participation
activities that were commonly participated in where participation is most often organised by a club, association, fitness centre or other organisation included lawn bowls (95.6% of lawn bowls participants engaged at least once in organised lawn bowls), softball (91.7%), athletics/track and field (91.6%), rugby union (90.1%) and baseball (88.2%) (table 21)8.
activities least likely to be organised included waterskiing/powerboating (only 3.1% of participants ever engaged in organised waterskiing/powerboating), walking (3.2%), roller sports (5.6%), cycling (8.7%) and surf sports (9.8%).
Most participants (30.9%) spent two to five hours per week in non-organised activities in the two weeks prior to interview. a further 24.2% spent five hours or more on non-organised physical activities. in the case of organised activities, 17.8% participated for five hours or more, while a further 16.4% participated for more than two hours but less than five hours (table 20).
8 aactivities ‘commonly participated in’ refer to all those activities in which 50,000 or more australians participated in 2005.
participation in exercise, recreation and sport survey 2005 Annual Report 14 © standing committee on recreation and sport 2006
3 Comparisons over time
3.1 Overall participation
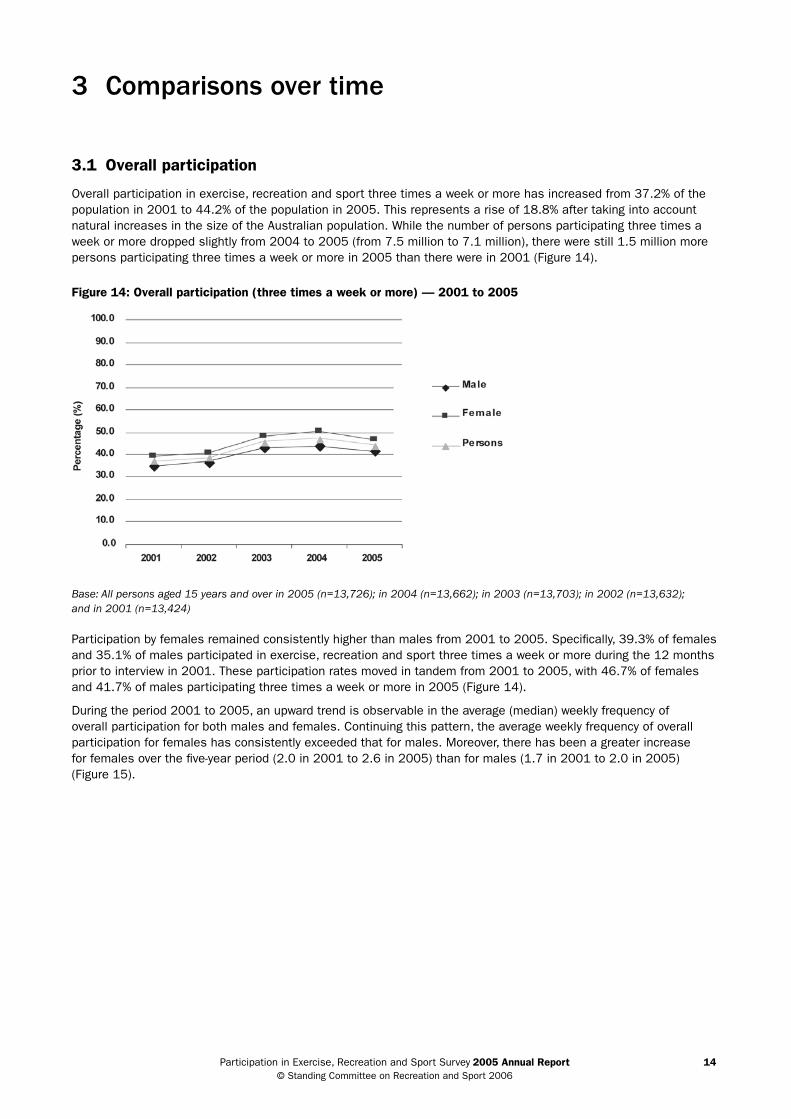
overall participation in exercise, recreation and sport three times a week or more has increased from 37.2% of the population in 2001 to 44.2% of the population in 2005. this represents a rise of 18.8% after taking into account natural increases in the size of the australian population. While the number of persons participating three times a week or more dropped slightly from 2004 to 2005 (from 7.5 million to 7.1 million), there were still 1.5 million more persons participating three times a week or more in 2005 than there were in 2001 (Figure 14).
Figure 14: Overall participation (three times a week or more) — 2001 to 2005
Base: All persons aged 15 years and over in 2005 (n=13,726); in 2004 (n=13,662); in 2003 (n=13,703); in 2002 (n=13,632); and in 2001 (n=13,424)
participation by females remained consistently higher than males from 2001 to 2005. specifically, 39.3% of females and 35.1% of males participated in exercise, recreation and sport three times a week or more during the 12 months prior to interview in 2001. these participation rates moved in tandem from 2001 to 2005, with 46.7% of females and 41.7% of males participating three times a week or more in 2005 (Figure 14).
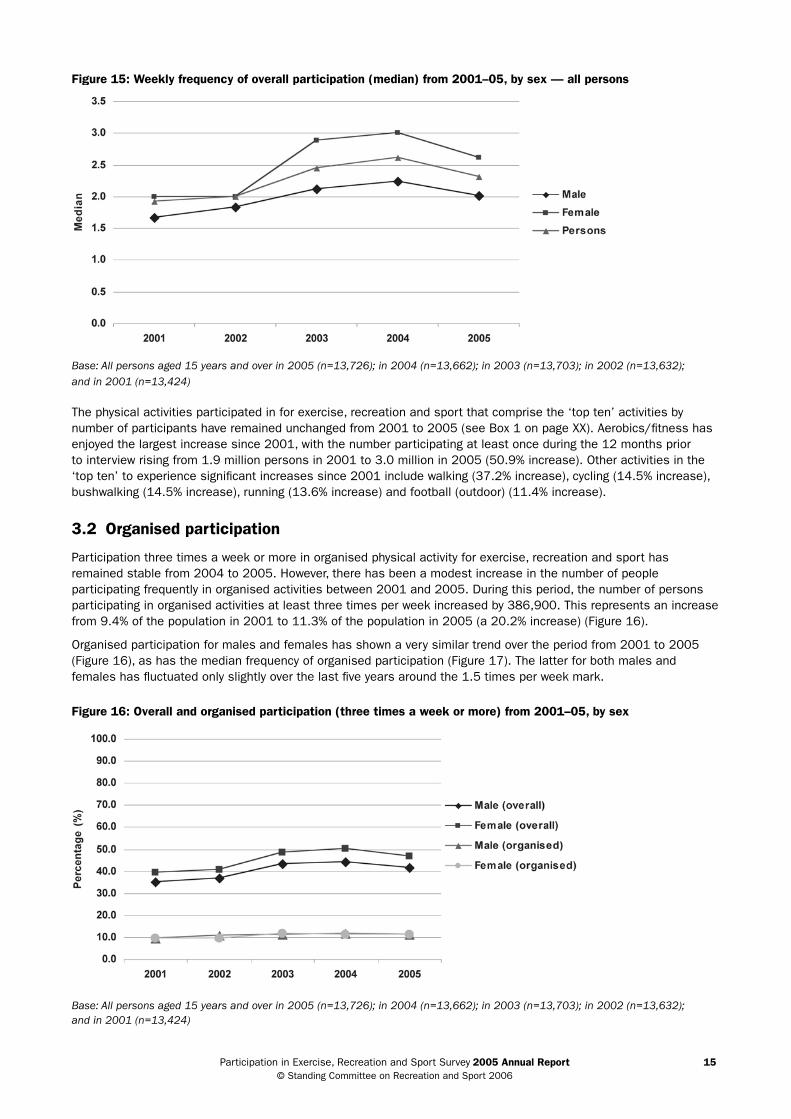
during the period 2001 to 2005, an upward trend is observable in the average (median) weekly frequency of overall participation for both males and females. continuing this pattern, the average weekly frequency of overall participation for females has consistently exceeded that for males. Moreover, there has been a greater increase for females over the five-year period (2.0 in 2001 to 2.6 in 2005) than for males (1.7 in 2001 to 2.0 in 2005) (Figure 15).
participation in exercise, recreation and sport survey 2005 Annual Report 15 © standing committee on recreation and sport 2006
Figure 15: Weekly frequency of overall participation (median) from 2001–05, by sex — all persons
Base: All persons aged 15 years and over in 2005 (n=13,726); in 2004 (n=13,662); in 2003 (n=13,703); in 2002 (n=13,632); and in 2001 (n=13,424)
the physical activities participated in for exercise, recreation and sport that comprise the ‘top ten’ activities by number of participants have remained unchanged from 2001 to 2005 (see Box 1 on page xx). aerobics/fitness has enjoyed the largest increase since 2001, with the number participating at least once during the 12 months prior to interview rising from 1.9 million persons in 2001 to 3.0 million in 2005 (50.9% increase). other activities in the ‘top ten’ to experience significant increases since 2001 include walking (37.2% increase), cycling (14.5% increase), bushwalking (14.5% increase), running (13.6% increase) and football (outdoor) (11.4% increase).
3.2 Organised participation
participation three times a week or more in organised physical activity for exercise, recreation and sport has remained stable from 2004 to 2005. However, there has been a modest increase in the number of people participating frequently in organised activities between 2001 and 2005. during this period, the number of persons participating in organised activities at least three times per week increased by 386,900. this represents an increase from 9.4% of the population in 2001 to 11.3% of the population in 2005 (a 20.2% increase) (Figure 16).
organised participation for males and females has shown a very similar trend over the period from 2001 to 2005 (Figure 16), as has the median frequency of organised participation (Figure 17). the latter for both males and females has fluctuated only slightly over the last five years around the 1.5 times per week mark.
Figure 16: Overall and organised participation (three times a week or more) from 2001–05, by sex
Base: All persons aged 15 years and over in 2005 (n=13,726); in 2004 (n=13,662); in 2003 (n=13,703); in 2002 (n=13,632); and in 2001 (n=13,424)

participation in exercise, recreation and sport survey 2005 Annual Report 16 © standing committee on recreation and sport 2006
Figure 17: Weekly frequency of organised participation (median) from 2001–05, by sex — participants only
Base: All persons aged 15 years and over in 2005 (n=13,726); in 2004 (n=13,662); in 2003 (n=13,703); in 2002 (n=13,632); and in 2001 (n=13,424)
the composition of the ‘top ten’ organised activities participated in by the australian population at least once for exercise, recreation and sport has changed slightly from 2004 to 2005 (see Box 2 on page xx). after dropping out of the ‘top ten’ in 2004, basketball has risen to seventh place with 376,300 participants in 2005 (increasing from 364,300 participants in 2001, which represents a modest increase of 3.3%). cricket (outdoor) has left the top ten for the first time since 2001 (with an 8.4% decrease from 2004).
compared to 2004, there was a statistically significant drop of 15% in the number of people participating in yoga (380,500 participants in 2004 to 323,500 participants in 2005), which has now dropped to tenth position. statistically significant decreases were also observed in organised golf (678,800 participants in 2004 to 590,800 participants in 2005; a 13% drop), and swimming (422,800 participants in 2004 to 345,800 participants in 2005; a 21.9% drop). in spite of the recent decline in participation, yoga has nevertheless experienced the largest increase of the current ‘top ten’ organised activities (up from 153,100 participants in 2001 to 323,500 participants in 2005, representing a 111.3% increase since 2001).
participation in exercise, recreation and sport survey 2005 Annual Report 17 © standing committee on recreation and sport 2006
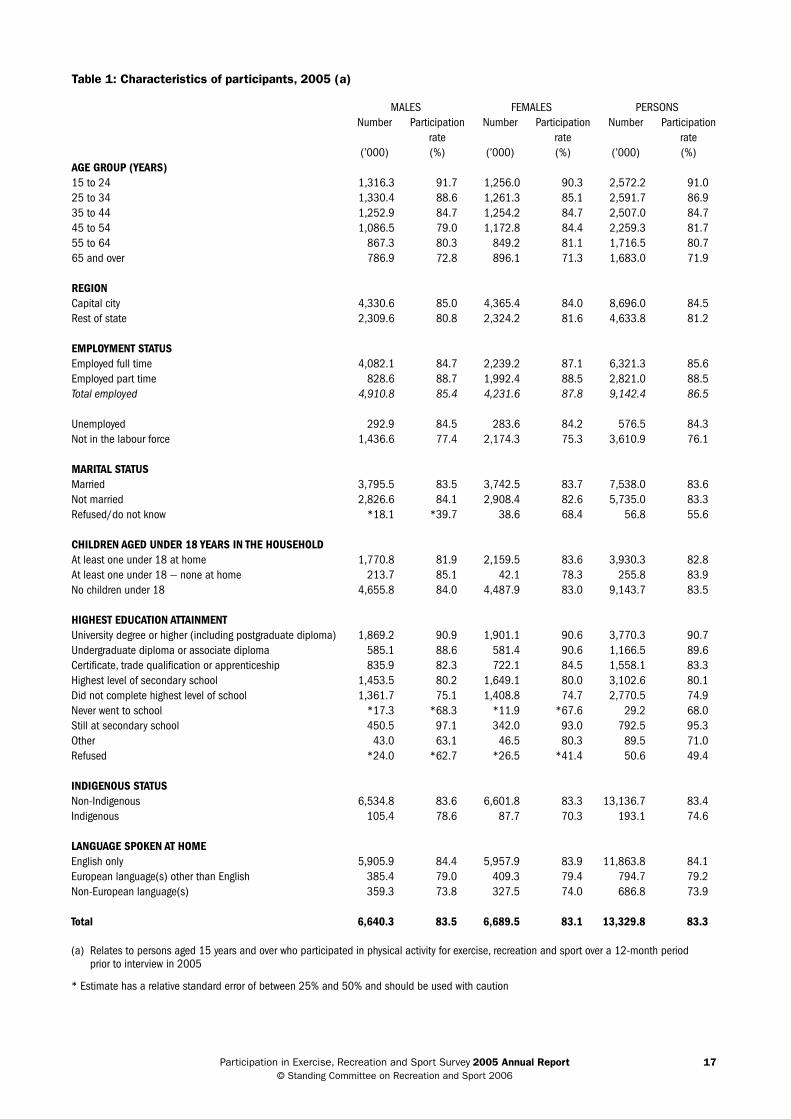
Table 1: Characteristics of participants, 2005 (a)
MALES FEMALES PERSONSNumber Participation Number Participation Number Participation
rate rate rate(’000) (%) (’000) (%) (’000) (%)
AGE GROUP (YEARS)15 to 24 1,316.3 91.7 1,256.0 90.3 2,572.2 91.0 25 to 34 1,330.4 88.6 1,261.3 85.1 2,591.7 86.9 35 to 44 1,252.9 84.7 1,254.2 84.7 2,507.0 84.7 45 to 54 1,086.5 79.0 1,172.8 84.4 2,259.3 81.7 55 to 64 867.3 80.3 849.2 81.1 1,716.5 80.7 65 and over 786.9 72.8 896.1 71.3 1,683.0 71.9
REGIONCapital city 4,330.6 85.0 4,365.4 84.0 8,696.0 84.5 Rest of state 2,309.6 80.8 2,324.2 81.6 4,633.8 81.2
EMPLOYMENT STATUSEmployed full time 4,082.1 84.7 2,239.2 87.1 6,321.3 85.6 Employed part time 828.6 88.7 1,992.4 88.5 2,821.0 88.5 Total employed 4,910.8 85.4 4,231.6 87.8 9,142.4 86.5
Unemployed 292.9 84.5 283.6 84.2 576.5 84.3 Not in the labour force 1,436.6 77.4 2,174.3 75.3 3,610.9 76.1
MARITAL STATUSMarried 3,795.5 83.5 3,742.5 83.7 7,538.0 83.6 Not married 2,826.6 84.1 2,908.4 82.6 5,735.0 83.3 Refused/do not know *18.1 *39.7 38.6 68.4 56.8 55.6
CHILDREN AGED UNDER 18 YEARS IN THE HOUSEHOLDAt least one under 18 at home 1,770.8 81.9 2,159.5 83.6 3,930.3 82.8 At least one under 18 — none at home 213.7 85.1 42.1 78.3 255.8 83.9 No children under 18 4,655.8 84.0 4,487.9 83.0 9,143.7 83.5
HIGHEST EDUCATION ATTAINMENTUniversity degree or higher (including postgraduate diploma) 1,869.2 90.9 1,901.1 90.6 3,770.3 90.7 Undergraduate diploma or associate diploma 585.1 88.6 581.4 90.6 1,166.5 89.6 Certificate, trade qualification or apprenticeship 835.9 82.3 722.1 84.5 1,558.1 83.3 Highest level of secondary school 1,453.5 80.2 1,649.1 80.0 3,102.6 80.1 Did not complete highest level of school 1,361.7 75.1 1,408.8 74.7 2,770.5 74.9 Never went to school *17.3 *68.3 *11.9 *67.6 29.2 68.0 Still at secondary school 450.5 97.1 342.0 93.0 792.5 95.3 Other 43.0 63.1 46.5 80.3 89.5 71.0 Refused *24.0 *62.7 *26.5 *41.4 50.6 49.4
INDIGENOUS STATUSNon-Indigenous 6,534.8 83.6 6,601.8 83.3 13,136.7 83.4 Indigenous 105.4 78.6 87.7 70.3 193.1 74.6
LANGUAGE SPOKEN AT HOMEEnglish only 5,905.9 84.4 5,957.9 83.9 11,863.8 84.1 European language(s) other than English 385.4 79.0 409.3 79.4 794.7 79.2 Non-European language(s) 359.3 73.8 327.5 74.0 686.8 73.9
Total 6,640.3 83.5 6,689.5 83.1 13,329.8 83.3
(a) Relates to persons aged 15 years and over who participated in physical activity for exercise, recreation and sport over a 12-month period prior to interview in 2005
* Estimate has a relative standard error of between 25% and 50% and should be used with caution
participation in exercise, recreation and sport survey 2005 Annual Report 18 © standing committee on recreation and sport 2006
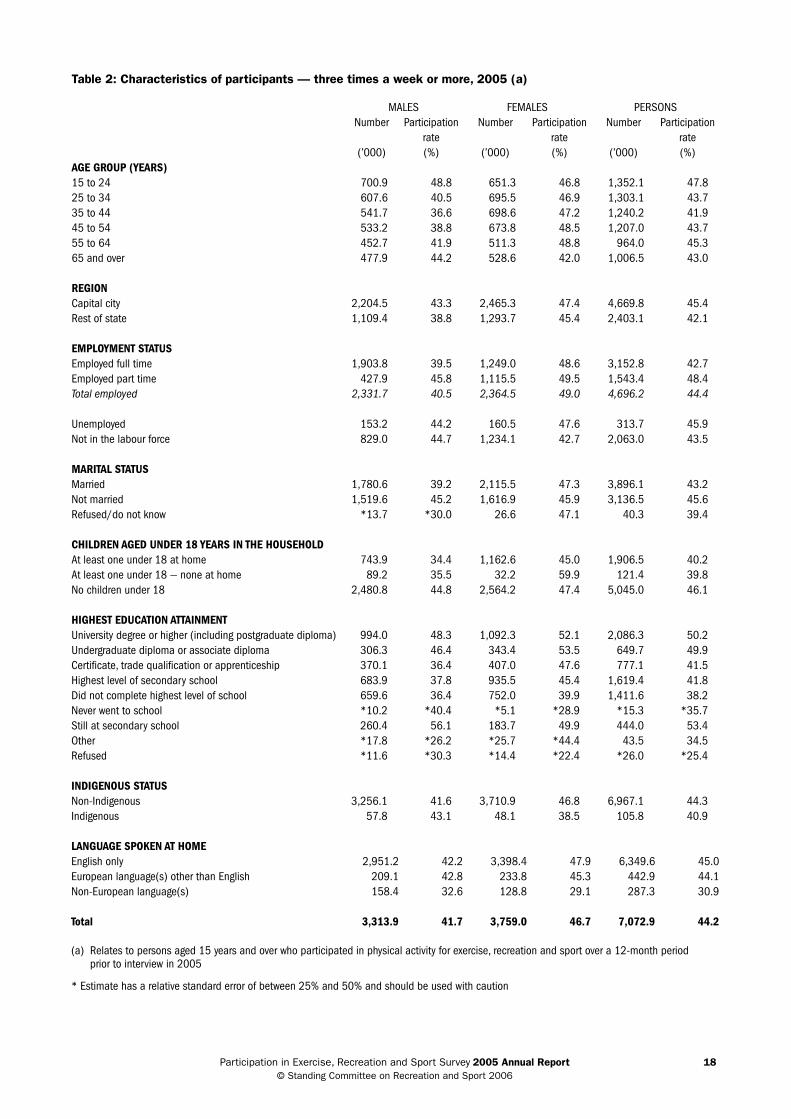
Table 2: Characteristics of participants — three times a week or more, 2005 (a)
MALES FEMALES PERSONSNumber Participation Number Participation Number Participation
rate rate rate(’000) (%) (’000) (%) (’000) (%)
AGE GROUP (YEARS)15 to 24 700.9 48.8 651.3 46.8 1,352.1 47.8 25 to 34 607.6 40.5 695.5 46.9 1,303.1 43.7 35 to 44 541.7 36.6 698.6 47.2 1,240.2 41.9 45 to 54 533.2 38.8 673.8 48.5 1,207.0 43.7 55 to 64 452.7 41.9 511.3 48.8 964.0 45.3 65 and over 477.9 44.2 528.6 42.0 1,006.5 43.0
REGIONCapital city 2,204.5 43.3 2,465.3 47.4 4,669.8 45.4 Rest of state 1,109.4 38.8 1,293.7 45.4 2,403.1 42.1
EMPLOYMENT STATUSEmployed full time 1,903.8 39.5 1,249.0 48.6 3,152.8 42.7 Employed part time 427.9 45.8 1,115.5 49.5 1,543.4 48.4 Total employed 2,331.7 40.5 2,364.5 49.0 4,696.2 44.4
Unemployed 153.2 44.2 160.5 47.6 313.7 45.9 Not in the labour force 829.0 44.7 1,234.1 42.7 2,063.0 43.5
MARITAL STATUSMarried 1,780.6 39.2 2,115.5 47.3 3,896.1 43.2 Not married 1,519.6 45.2 1,616.9 45.9 3,136.5 45.6 Refused/do not know *13.7 *30.0 26.6 47.1 40.3 39.4
CHILDREN AGED UNDER 18 YEARS IN THE HOUSEHOLDAt least one under 18 at home 743.9 34.4 1,162.6 45.0 1,906.5 40.2 At least one under 18 — none at home 89.2 35.5 32.2 59.9 121.4 39.8 No children under 18 2,480.8 44.8 2,564.2 47.4 5,045.0 46.1
HIGHEST EDUCATION ATTAINMENTUniversity degree or higher (including postgraduate diploma) 994.0 48.3 1,092.3 52.1 2,086.3 50.2 Undergraduate diploma or associate diploma 306.3 46.4 343.4 53.5 649.7 49.9 Certificate, trade qualification or apprenticeship 370.1 36.4 407.0 47.6 777.1 41.5 Highest level of secondary school 683.9 37.8 935.5 45.4 1,619.4 41.8 Did not complete highest level of school 659.6 36.4 752.0 39.9 1,411.6 38.2 Never went to school *10.2 *40.4 *5.1 *28.9 *15.3 *35.7 Still at secondary school 260.4 56.1 183.7 49.9 444.0 53.4 Other *17.8 *26.2 *25.7 *44.4 43.5 34.5 Refused *11.6 *30.3 *14.4 *22.4 *26.0 *25.4
INDIGENOUS STATUSNon-Indigenous 3,256.1 41.6 3,710.9 46.8 6,967.1 44.3 Indigenous 57.8 43.1 48.1 38.5 105.8 40.9
LANGUAGE SPOKEN AT HOMEEnglish only 2,951.2 42.2 3,398.4 47.9 6,349.6 45.0 European language(s) other than English 209.1 42.8 233.8 45.3 442.9 44.1 Non-European language(s) 158.4 32.6 128.8 29.1 287.3 30.9
Total 3,313.9 41.7 3,759.0 46.7 7,072.9 44.2
(a) Relates to persons aged 15 years and over who participated in physical activity for exercise, recreation and sport over a 12-month period prior to interview in 2005
* Estimate has a relative standard error of between 25% and 50% and should be used with caution
participation in exercise, recreation and sport survey 2005 Annual Report 19 © standing committee on recreation and sport 2006
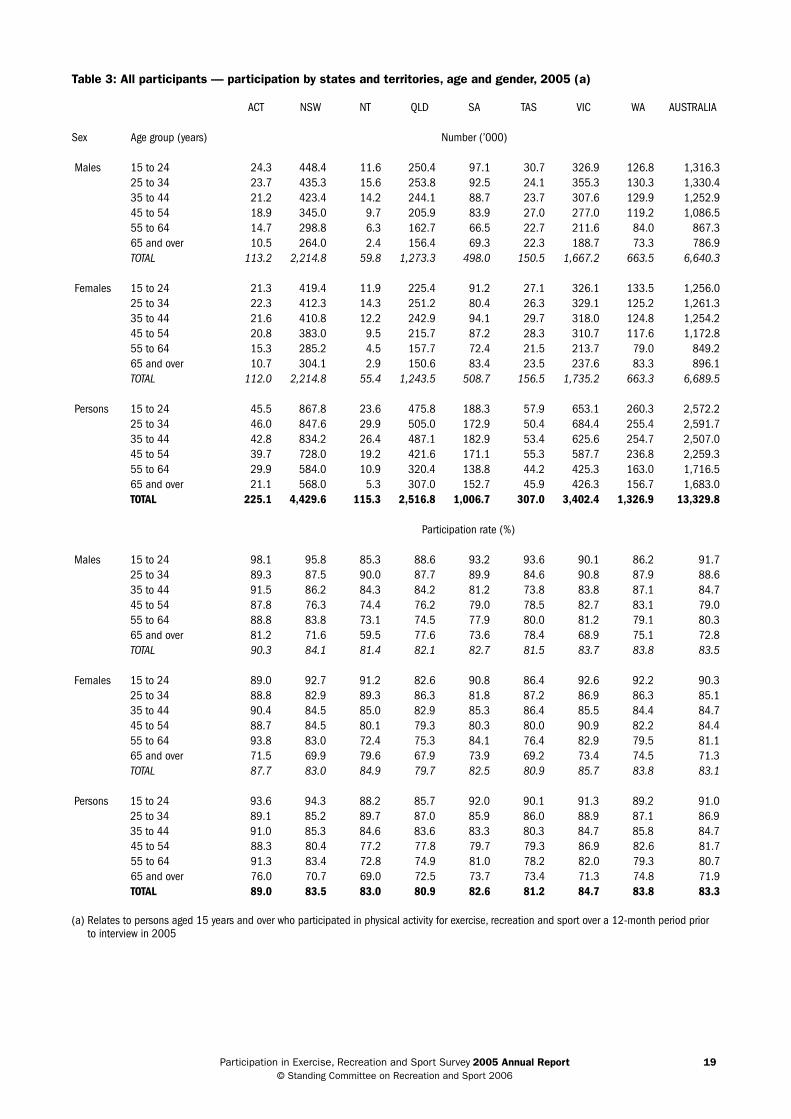
Table 3: All participants — participation by states and territories, age and gender, 2005 (a)
ACT NSW NT QLD SA TAS VIC WA AUSTRALIA
Sex Age group (years) Number (’000)
Males 15 to 24 24.3 448.4 11.6 250.4 97.1 30.7 326.9 126.8 1,316.3 25 to 34 23.7 435.3 15.6 253.8 92.5 24.1 355.3 130.3 1,330.4 35 to 44 21.2 423.4 14.2 244.1 88.7 23.7 307.6 129.9 1,252.9 45 to 54 18.9 345.0 9.7 205.9 83.9 27.0 277.0 119.2 1,086.5 55 to 64 14.7 298.8 6.3 162.7 66.5 22.7 211.6 84.0 867.3 65 and over 10.5 264.0 2.4 156.4 69.3 22.3 188.7 73.3 786.9 TOTAL 113.2 2,214.8 59.8 1,273.3 498.0 150.5 1,667.2 663.5 6,640.3
Females 15 to 24 21.3 419.4 11.9 225.4 91.2 27.1 326.1 133.5 1,256.0 25 to 34 22.3 412.3 14.3 251.2 80.4 26.3 329.1 125.2 1,261.3 35 to 44 21.6 410.8 12.2 242.9 94.1 29.7 318.0 124.8 1,254.2 45 to 54 20.8 383.0 9.5 215.7 87.2 28.3 310.7 117.6 1,172.8 55 to 64 15.3 285.2 4.5 157.7 72.4 21.5 213.7 79.0 849.2 65 and over 10.7 304.1 2.9 150.6 83.4 23.5 237.6 83.3 896.1 TOTAL 112.0 2,214.8 55.4 1,243.5 508.7 156.5 1,735.2 663.3 6,689.5
Persons 15 to 24 45.5 867.8 23.6 475.8 188.3 57.9 653.1 260.3 2,572.2 25 to 34 46.0 847.6 29.9 505.0 172.9 50.4 684.4 255.4 2,591.7 35 to 44 42.8 834.2 26.4 487.1 182.9 53.4 625.6 254.7 2,507.0 45 to 54 39.7 728.0 19.2 421.6 171.1 55.3 587.7 236.8 2,259.3 55 to 64 29.9 584.0 10.9 320.4 138.8 44.2 425.3 163.0 1,716.5 65 and over 21.1 568.0 5.3 307.0 152.7 45.9 426.3 156.7 1,683.0 TOTAL 225.1 4,429.6 115.3 2,516.8 1,006.7 307.0 3,402.4 1,326.9 13,329.8
Participation rate (%)
Males 15 to 24 98.1 95.8 85.3 88.6 93.2 93.6 90.1 86.2 91.725 to 34 89.3 87.5 90.0 87.7 89.9 84.6 90.8 87.9 88.635 to 44 91.5 86.2 84.3 84.2 81.2 73.8 83.8 87.1 84.745 to 54 87.8 76.3 74.4 76.2 79.0 78.5 82.7 83.1 79.055 to 64 88.8 83.8 73.1 74.5 77.9 80.0 81.2 79.1 80.365 and over 81.2 71.6 59.5 77.6 73.6 78.4 68.9 75.1 72.8TOTAL 90.3 84.1 81.4 82.1 82.7 81.5 83.7 83.8 83.5
Females 15 to 24 89.0 92.7 91.2 82.6 90.8 86.4 92.6 92.2 90.325 to 34 88.8 82.9 89.3 86.3 81.8 87.2 86.9 86.3 85.135 to 44 90.4 84.5 85.0 82.9 85.3 86.4 85.5 84.4 84.745 to 54 88.7 84.5 80.1 79.3 80.3 80.0 90.9 82.2 84.455 to 64 93.8 83.0 72.4 75.3 84.1 76.4 82.9 79.5 81.165 and over 71.5 69.9 79.6 67.9 73.9 69.2 73.4 74.5 71.3TOTAL 87.7 83.0 84.9 79.7 82.5 80.9 85.7 83.8 83.1
Persons 15 to 24 93.6 94.3 88.2 85.7 92.0 90.1 91.3 89.2 91.025 to 34 89.1 85.2 89.7 87.0 85.9 86.0 88.9 87.1 86.935 to 44 91.0 85.3 84.6 83.6 83.3 80.3 84.7 85.8 84.745 to 54 88.3 80.4 77.2 77.8 79.7 79.3 86.9 82.6 81.755 to 64 91.3 83.4 72.8 74.9 81.0 78.2 82.0 79.3 80.765 and over 76.0 70.7 69.0 72.5 73.7 73.4 71.3 74.8 71.9TOTAL 89.0 83.5 83.0 80.9 82.6 81.2 84.7 83.8 83.3
(a) Relates to persons aged 15 years and over who participated in physical activity for exercise, recreation and sport over a 12-month period prior to interview in 2005
participation in exercise, recreation and sport survey 2005 Annual Report 20 © standing committee on recreation and sport 2006
Table 4: All persons — frequency of participation in physical activity for exercise, recreation and sport, 2005 (a)
None
Zero — once per week
(b)
Once or twice per week
(c)
Three or four times per week
(d)
Five or more times per week Total
Sex Age group (years) Number (’000)
Males 15 to 24 119.6 186.0 429.4 280.1 420.8 1435.925 to 34 171.2 306.7 416.1 272.8 334.8 1501.635 to 44 226.1 316.4 394.8 262.4 279.2 1479.045 to 54 289.0 198.9 354.4 224.6 308.5 1375.655 to 64 213.4 164.6 250.0 162.2 290.4 1080.765 and over 294.7 104.7 204.3 160.8 317.1 1081.6TOTAL 1314.1 1277.3 2049.1 1363.0 1950.9 7954.4
Females 15 to 24 135.3 202.5 402.2 320.9 330.4 1391.325 to 34 220.4 198.8 367.0 334.6 360.9 1481.735 to 44 227.3 210.7 344.9 337.3 361.2 1481.545 to 54 216.2 152.3 346.6 299.1 374.7 1389.055 to 64 197.5 112.4 225.5 204.0 307.3 1046.765 and over 361.6 100.4 267.2 187.1 341.4 1257.7TOTAL 1358.3 977.1 1953.4 1683.1 2075.9 8047.9
Persons 15 to 24 255.0 388.5 831.6 601.0 751.1 2827.225 to 34 391.6 505.5 783.1 607.4 695.7 2983.335 to 44 453.5 527.1 739.7 599.8 640.5 2960.545 to 54 505.3 351.3 701.0 523.8 683.2 2764.655 to 64 410.9 277.0 475.6 366.2 597.7 2127.365 and over 656.3 205.1 471.5 347.9 658.6 2339.4TOTAL 2672.5 2254.4 4002.5 3046.1 4026.8 16002.3
Proportion of each demographic group within each category (row %)
Males 15 to 24 8.3 13.0 29.9 19.5 29.3 100.025 to 34 11.4 20.4 27.7 18.2 22.3 100.035 to 44 15.3 21.4 26.7 17.7 18.9 100.045 to 54 21.0 14.5 25.8 16.3 22.4 100.055 to 64 19.7 15.2 23.1 15.0 26.9 100.065 and over 27.2 9.7 18.9 14.9 29.3 100.0TOTAL 16.5 16.1 25.8 17.1 24.5 100.0
Females 15 to 24 9.7 14.6 28.9 23.1 23.7 100.025 to 34 14.9 13.4 24.8 22.6 24.4 100.035 to 44 15.3 14.2 23.3 22.8 24.4 100.045 to 54 15.6 11.0 25.0 21.5 27.0 100.055 to 64 18.9 10.7 21.5 19.5 29.4 100.065 and over 28.7 8.0 21.2 14.9 27.1 100.0TOTAL 16.9 12.1 24.3 20.9 25.8 100.0
Persons 15 to 24 9.0 13.7 29.4 21.3 26.6 100.025 to 34 13.1 16.9 26.2 20.4 23.3 100.035 to 44 15.3 17.8 25.0 20.3 21.6 100.045 to 54 18.3 12.7 25.4 18.9 24.7 100.055 to 64 19.3 13.0 22.4 17.2 28.1 100.065 and over 28.1 8.8 20.2 14.9 28.2 100.0TOTAL 16.7 14.1 25.0 19.0 25.2 100.0
(a) Relates to all persons aged 15 years and over (b) More than zero and less than once per week (c) Once or more and less than three times per week (d) Three or more times and less than five times per week
participation in exercise, recreation and sport survey 2005 Annual Report 21 © standing committee on recreation and sport 2006
Table 5: All persons — frequency of participation in organised physical activity for exercise, recreation and sport, 2005 (a)
None
Zero — once per week
(b)
Once or twice per week
(c)
Three or four times per week
(d)
Five or more times per week Total
Sex Age group (years) Number (’000)
Males 15 to 24 487.3 220.7 376.9 196.9 154.1 1435.925 to 34 760.4 280.9 290.9 106.1 63.3 1501.635 to 44 838.8 282.3 211.3 107.3 39.4 1479.045 to 54 899.5 180.8 211.6 58.7 *25.0 1375.655 to 64 733.7 110.8 156.6 56.0 *23.6 1080.765 and over 717.6 98.6 183.8 58.7 *22.9 1081.6TOTAL 4437.2 1174.1 1431.1 583.6 328.4 7954.4
Females 15 to 24 565.5 205.5 344.9 149.4 126.1 1391.325 to 34 855.6 216.5 241.9 104.0 63.8 1481.735 to 44 934.6 204.5 199.7 106.0 36.7 1481.545 to 54 895.5 160.9 195.1 92.7 44.8 1389.055 to 64 760.2 80.8 132.4 44.1 29.2 1046.765 and over 861.7 105.8 193.6 58.5 38.1 1257.7TOTAL 4873.0 973.9 1307.6 554.5 338.7 8047.9
Persons 15 to 24 1052.7 426.2 721.8 346.3 280.2 2827.225 to 34 1616.0 497.4 532.8 210.1 127.1 2983.335 to 44 1773.3 486.8 411.0 213.2 76.2 2960.545 to 54 1795.0 341.7 406.7 151.4 69.8 2764.655 to 64 1493.9 191.6 289.0 100.1 52.8 2127.365 and over 1579.3 204.4 377.5 117.2 61.1 2339.4TOTAL 9310.2 2148.1 2738.7 1138.2 667.1 16002.3
Proportion of each demographic group within each category (row %)
Males 15 to 24 33.9 15.4 26.2 13.7 10.7 100.025 to 34 50.6 18.7 19.4 7.1 4.2 100.035 to 44 56.7 19.1 14.3 7.3 2.7 100.045 to 54 65.4 13.1 15.4 4.3 *1.8 100.055 to 64 67.9 10.3 14.5 5.2 *2.2 100.065 and over 66.3 9.1 17.0 5.4 *2.1 100.0TOTAL 55.8 14.8 18.0 7.3 4.1 100.0
Females 15 to 24 40.6 14.8 24.8 10.7 9.1 100.025 to 34 57.7 14.6 16.3 7.0 4.3 100.035 to 44 63.1 13.8 13.5 7.2 2.5 100.045 to 54 64.5 11.6 14.0 6.7 3.2 100.055 to 64 72.6 7.7 12.6 4.2 2.8 100.065 and over 68.5 8.4 15.4 4.6 3.0 100.0TOTAL 60.6 12.1 16.2 6.9 4.2 100.0
Persons 15 to 24 37.2 15.1 25.5 12.2 9.9 100.025 to 34 54.2 16.7 17.9 7.0 4.3 100.035 to 44 59.9 16.4 13.9 7.2 2.6 100.045 to 54 64.9 12.4 14.7 5.5 2.5 100.055 to 64 70.2 9.0 13.6 4.7 2.5 100.065 and over 67.5 8.7 16.1 5.0 2.6 100.0TOTAL 58.2 13.4 17.1 7.1 4.2 100.0
(a) Relates to all persons aged 15 years and over (b) More than zero and less than once per week (c) Once or more and less than three times per week (d) Three or more times and less than five times per week
* Estimate has a relative standard error of between 25% and 50% and should be used with caution
participation in exercise, recreation and sport survey 2005 Annual Report 22 © standing committee on recreation and sport 2006
Table 6: All participants — frequency of participation, cumulative, 2005 (a)
Less than once a week
Once a week or more
Twice a week or more
Three times a week or more
Total participation
Sex Age group (years) Number (’000)
Males 15 to 24 186.0 1130.3 899.2 700.9 1316.325 to 34 306.7 1023.7 791.8 607.6 1330.435 to 44 316.4 936.5 725.0 541.7 1252.945 to 54 198.9 887.6 713.6 533.2 1086.555 to 64 164.6 702.7 565.7 452.7 867.365 and over 104.7 682.2 593.6 477.9 786.9TOTAL 1277.3 5363.0 4288.9 3313.9 6640.3
Females 15 to 24 202.5 1053.5 838.0 651.3 1256.025 to 34 198.8 1062.5 898.3 695.5 1261.335 to 44 210.7 1043.4 880.3 698.6 1254.245 to 54 152.3 1020.5 852.5 673.8 1172.855 to 64 112.4 736.8 643.9 511.3 849.265 and over 100.4 795.7 646.6 528.6 896.1TOTAL 977.1 5712.4 4759.5 3759.0 6689.5
Persons 15 to 24 388.5 2183.8 1737.2 1352.1 2572.225 to 34 505.5 2086.2 1690.0 1303.1 2591.735 to 44 527.1 1979.9 1605.3 1240.2 2507.045 to 54 351.3 1908.1 1566.0 1207.0 2259.355 to 64 277.0 1439.5 1209.6 964.0 1716.565 and over 205.1 1477.9 1240.2 1006.5 1683.0TOTAL 2254.4 11075.4 9048.3 7072.9 13329.8
Participation rate (%)
Males 15 to 24 13.0 78.7 62.6 48.8 91.725 to 34 20.4 68.2 52.7 40.5 88.635 to 44 21.4 63.3 49.0 36.6 84.745 to 54 14.5 64.5 51.9 38.8 79.055 to 64 15.2 65.0 52.3 41.9 80.365 and over 9.7 63.1 54.9 44.2 72.8TOTAL 16.1 67.4 53.9 41.7 83.5
Females 15 to 24 14.6 75.7 60.2 46.8 90.325 to 34 13.4 71.7 60.6 46.9 85.135 to 44 14.2 70.4 59.4 47.2 84.745 to 54 11.0 73.5 61.4 48.5 84.455 to 64 10.7 70.4 61.5 48.8 81.165 and over 8.0 63.3 51.4 42.0 71.3TOTAL 12.1 71.0 59.1 46.7 83.1
Persons 15 to 24 13.7 77.2 61.4 47.8 91.025 to 34 16.9 69.9 56.7 43.7 86.935 to 44 17.8 66.9 54.2 41.9 84.745 to 54 12.7 69.0 56.6 43.7 81.755 to 64 13.0 67.7 56.9 45.3 80.765 and over 8.8 63.2 53.0 43.0 71.9TOTAL 14.1 69.2 56.5 44.2 83.3
(a) Relates to persons aged 15 years and over who participated in physical activity for exercise, recreation and sport over a 12-month period prior to interview in 2005

participation in exercise, recreation and sport survey 2005 Annual Report 23 © standing committee on recreation and sport 2006
Table 7: All participants — frequency of participation in organised activity, cumulative, 2005 (a)
Less than once a week
Once a week or more
Twice a week or more
Three times a week or more
Total participation
Sex Age group (years) Number (’000)
Males 15 to 24 220.7 727.9 493.8 351.0 948.625 to 34 280.9 460.3 278.4 169.4 741.235 to 44 282.3 358.0 218.0 146.7 640.345 to 54 180.8 295.3 171.2 83.7 476.155 to 64 110.8 236.2 135.0 79.6 347.065 and over 98.6 265.5 183.5 81.6 364.1TOTAL 1174.1 2343.1 1480.0 912.0 3517.2
Females 15 to 24 205.5 620.4 430.3 275.5 825.925 to 34 216.5 409.6 277.6 167.8 626.135 to 44 204.5 342.4 225.2 142.7 546.945 to 54 160.9 332.6 224.5 137.5 493.555 to 64 80.8 205.7 128.1 73.3 286.565 and over 105.8 290.2 173.1 96.6 396.0TOTAL 973.9 2200.9 1458.9 893.3 3174.8
Persons 15 to 24 426.2 1348.3 924.1 626.5 1774.525 to 34 497.4 870.0 556.0 337.2 1367.335 to 44 486.8 700.4 443.2 289.4 1187.245 to 54 341.7 627.9 395.8 221.2 969.655 to 64 191.6 441.8 263.1 152.8 633.465 and over 204.4 555.7 356.6 178.2 760.1TOTAL 2148.1 4544.0 2938.9 1805.3 6692.1
Participation rate (%)
Males 15 to 24 15.4 50.7 34.4 24.4 66.125 to 34 18.7 30.7 18.5 11.3 49.435 to 44 19.1 24.2 14.7 9.9 43.345 to 54 13.1 21.5 12.4 6.1 34.655 to 64 10.3 21.9 12.5 7.4 32.165 and over 9.1 24.5 17.0 7.5 33.7TOTAL 14.8 29.5 18.6 11.5 44.2
Females 15 to 24 14.8 44.6 30.9 19.8 59.425 to 34 14.6 27.6 18.7 11.3 42.335 to 44 13.8 23.1 15.2 9.6 36.945 to 54 11.6 23.9 16.2 9.9 35.555 to 64 7.7 19.6 12.2 7.0 27.465 and over 8.4 23.1 13.8 7.7 31.5TOTAL 12.1 27.3 18.1 11.1 39.4
Persons 15 to 24 15.1 47.7 32.7 22.2 62.825 to 34 16.7 29.2 18.6 11.3 45.835 to 44 16.4 23.7 15.0 9.8 40.145 to 54 12.4 22.7 14.3 8.0 35.155 to 64 9.0 20.8 12.4 7.2 29.865 and over 8.7 23.8 15.2 7.6 32.5TOTAL 13.4 28.4 18.4 11.3 41.8
(a) Relates to persons aged 15 years and over who participated in original physical activity for exercise, recreation and sport over a 12-month period prior to interview in 2005
participation in exercise, recreation and sport survey 2005 Annual Report 24 © standing committee on recreation and sport 2006
Table 8: All persons — average frequency of participation in physical activity for exercise, recreation and sport, 2005 (a)
Sex Age group (years)Number of weekly sessions
of activity (median)Number of weekly sessions
of activity (mean)
Mean number of different activities (for those that
participate in any activity)
Males 15 to 24 2.9 3.8 2.325 to 34 2.0 3.1 2.135 to 44 1.9 2.7 1.945 to 54 2.0 2.8 1.755 to 64 2.0 3.1 1.465 and over 2.0 3.3 1.2TOTAL 2.0 3.1 1.8
Females 15 to 24 2.5 3.3 2.025 to 34 2.7 3.3 1.935 to 44 2.8 3.3 1.845 to 54 2.9 3.4 1.655 to 64 2.9 3.4 1.465 and over 2.0 3.1 1.1TOTAL 2.6 3.3 1.7
Persons 15 to 24 2.8 3.5 2.225 to 34 2.3 3.2 2.035 to 44 2.0 3.0 1.945 to 54 2.3 3.1 1.655 to 64 2.3 3.2 1.465 and over 2.0 3.2 1.1TOTAL 2.3 3.2 1.7
(a) Relates to all persons aged 15 years and over

participation in exercise, recreation and sport survey 2005 Annual Report 25 © standing committee on recreation and sport 2006
Table 9: All participants — average frequency of participation, 2005 (a)
Sex Age group (years)Number of weekly sessions
of activity (median)Number of weekly sessions
of activity (mean)
Mean number of different activities (for those that
participate in any activity)
Males 15 to 24 3.0 4.1 2.625 to 34 2.6 3.5 2.435 to 44 2.4 3.2 2.245 to 54 2.9 3.6 2.155 to 64 3.0 3.9 1.865 and over 3.8 4.6 1.6TOTAL 3.0 3.8 2.2
Females 15 to 24 3.0 3.6 2.325 to 34 3.0 3.9 2.235 to 44 3.0 3.9 2.245 to 54 3.2 4.0 1.955 to 64 3.4 4.2 1.765 and over 3.8 4.3 1.6TOTAL 3.0 3.9 2.0
Persons 15 to 24 3.0 3.9 2.425 to 34 3.0 3.7 2.335 to 44 2.9 3.6 2.245 to 54 3.0 3.8 2.055 to 64 3.0 4.0 1.765 and over 3.8 4.4 1.6TOTAL 3.0 3.8 2.1
(a) Relates to persons aged 15 years and over who participated in physical activity for exercise, recreation and sport over a 12-month period
prior to interview in 2005

participation in exercise, recreation and sport survey 2005 Annual Report 26 © standing committee on recreation and sport 2006
Table 10: All participants — duration of participation (a)
One activity Two activities Three activities Total
Number (’000)
Five hours or more More than three sessions weekly 836.1 1247.8 750.0 2833.9Two or three sessions weekly 333.1 170.9 28.4 532.5Less than two sessions weekly 108.3 27.3 **0 135.6Total 1277.5 1446.0 778.4 3501.9
Two hours or more More than three sessions weekly 937.6 871.9 275.4 2084.9but less than five hours Two or three sessions weekly 886.8 543.6 105.2 1535.7
Less than two sessions weekly 560.5 150.9 **0 711.4Total 2384.8 1566.5 380.6 4332.0
Less than two hours More than three sessions weekly 268.8 75.4 *12 356.2Two or three sessions weekly 677.2 200.4 31.5 909.1Less than two sessions weekly 1974.3 208.1 *7.4 2189.8Total 2920.3 483.9 50.8 3455.1
Total More than three sessions weekly 2042.4 2195.1 1037.4 5274.9Two or three sessions weekly 1897.1 915.0 165.2 2977.3Less than two sessions weekly 2643.1 386.3 *7.4 3036.8Total 6582.6 3496.4 1209.9 11288.9
Participation rate (%)
Five hours or more More than three sessions weekly 7.4 11.1 6.6 25.1Two or three sessions weekly 3.0 1.5 0.3 4.7Less than two sessions weekly 1.0 0.2 **0 1.2Total 11.3 12.8 6.9 31.0
Two hours or more More than three sessions weekly 8.3 7.7 2.4 18.5but less than five hours Two or three sessions weekly 7.9 4.8 0.9 13.6
Less than two sessions weekly 5.0 1.3 **0 6.3Total 21.1 13.9 3.4 38.4
Less than two hours More than three sessions weekly 2.4 0.7 *0.1 3.2Two or three sessions weekly 6.0 1.8 0.3 8.1Less than two sessions weekly 17.5 1.8 *0.1 19.4Total 25.9 4.3 0.5 30.6
Total More than three sessions weekly 18.1 19.4 9.2 46.7Two or three sessions weekly 16.8 8.1 1.5 26.4Less than two sessions weekly 23.4 3.4 *0.1 26.9Total 58.3 31.0 10.7 100.0
(a) Relates to persons aged 15 years and over who participated in one of their ‘top three’ physical activities for exercise, recreation and sport over a two-week period prior to interview in 2005. ‘Top three’ activities refer to the physical activities that respondents participated in most over the 12 months prior to interview
* Estimate has a relative standard error of between 25% and 50% and should be used with caution ** Estimate has a relative standard error greater than 50% and is considered too unreliable for general use

participation in exercise, recreation and sport survey 2005 Annual Report 27 © standing committee on recreation and sport 2006
Table 11: All participants — duration of participation, walkers compared to non-walkers (a)
Non-walking Walking and other Walking only All participants
Number (’000)
Five hours or more More than three sessions weekly 1374.1 983.6 476.2 2833.9Two or three sessions weekly 471.8 42.2 *18.5 532.5Less than two sessions weekly 131.1 **2.1 **2.3 135.6Total 1977.1 1027.9 497.0 3501.9
Two hours or more More than three sessions weekly 674.2 677.3 733.3 2084.9but less than five hours Two or three sessions weekly 967.2 279.6 288.9 1535.7
Less than two sessions weekly 643.3 35.3 32.8 711.4Total 2284.7 992.3 1054.9 4332.0
Less than two hours More than three sessions weekly 101.3 59.1 195.8 356.2Two or three sessions weekly 329.7 115.2 464.2 909.1Less than two sessions weekly 1382.8 86.4 720.5 2189.8Total 1813.8 260.7 1380.6 3455.1
Total More than three sessions weekly 2149.7 1720.0 1405.3 5274.9Two or three sessions weekly 1768.7 437.0 771.5 2977.3Less than two sessions weekly 2157.2 123.9 755.7 3036.8Total 6075.6 2280.9 2932.5 11288.9
Participation rate (%)
Five hours or more More than three sessions weekly 12.2 8.7 4.2 25.1Two or three sessions weekly 4.2 0.4 *0.2 4.7Less than two sessions weekly 1.2 **0 **0 1.2Total 17.5 9.1 4.4 31.0
Two hours or more More than three sessions weekly 6.0 6.0 6.5 18.5but less than five hours Two or three sessions weekly 8.6 2.5 2.6 13.6
Less than two sessions weekly 5.7 0.3 0.3 6.3Total 20.2 8.8 9.3 38.4
Less than two hours More than three sessions weekly 0.9 0.5 1.7 3.2Two or three sessions weekly 2.9 1.0 4.1 8.1Less than two sessions weekly 12.2 0.8 6.4 19.4Total 16.1 2.3 12.2 30.6
Total More than three sessions weekly 19.0 15.2 12.4 46.7Two or three sessions weekly 15.7 3.9 6.8 26.4Less than two sessions weekly 19.1 1.1 6.7 26.9Total 53.8 20.2 26.0 100.0
(a) Relates to persons aged 15 years and over who participated in one of their ‘top three’ physical activities for exercise, recreation and sport over a two-week period prior to interview in 2005. ‘Top three’ activities refer to the physical activities that respondents participated in most over the 12 months prior to interview
* Estimate has a relative standard error of between 25% and 50% and should be used with caution ** Estimate has a relative standard error greater than 50% and is considered too unreliable for general use
participation in exercise, recreation and sport survey 2005 Annual Report 28 © standing committee on recreation and sport 2006
Table 12: All participants — duration of participation by age
15 to 24 25 to 34 35 to 44 45 to 54 55 to 64 65 and over
Total
Number (’000)
Five hours or more More than three sessions weekly 663.3 441.9 437.8 467.1 406.5 417.2 2833.9Two or three sessions weekly 124.6 66.4 64.6 92.3 68.3 116.3 532.5Less than two sessions weekly *12.3 35.2 27.9 *17.3 27.4 *15.4 135.6Total 800.1 543.6 530.3 576.7 502.3 548.9 3501.9
Two hours or more More than three sessions weekly 250.0 407.8 411.7 397.5 302.1 315.7 2084.9but less than five hours Two or three sessions weekly 409.9 356.9 306.4 226.0 126.7 109.9 1535.7
Less than two sessions weekly 154.6 117.5 107.7 136.0 94.4 101.2 711.4Total 814.5 882.2 825.8 759.4 523.2 526.8 4332.0
Less than two hours More than three sessions weekly 39.7 59.5 57.7 68.9 50.1 80.2 356.2Two or three sessions weekly 106.0 178.5 184.5 176.2 129.2 134.7 909.1Less than two sessions weekly 426.6 454.7 443.3 397.0 262.0 206.2 2189.8Total 572.2 692.8 685.5 642.1 441.3 421.1 3455.1
Total More than three sessions weekly 953.0 909.3 907.2 933.5 758.8 813.1 5274.9Two or three sessions weekly 640.5 601.9 555.4 494.4 324.2 360.9 2977.3Less than two sessions weekly 593.5 607.4 579.0 550.3 383.9 322.9 3036.8Total 2186.9 2118.6 2041.6 1978.2 1466.8 1496.9 11288.9
Participation rate (%)
Five hours or more More than three sessions weekly 5.9 3.9 3.9 4.1 3.6 3.7 25.1Two or three sessions weekly 1.1 0.6 0.6 0.8 0.6 1.0 4.7Less than two sessions weekly *0.1 0.3 0.2 *0.2 0.2 *0.1 1.2Total 7.1 4.8 4.7 5.1 4.4 4.9 31.0
Two hours or more More than three sessions weekly 2.2 3.6 3.6 3.5 2.7 2.8 18.5but less than five hours Two or three sessions weekly 3.6 3.2 2.7 2.0 1.1 1.0 13.6
Less than two sessions weekly 1.4 1.0 1.0 1.2 0.8 0.9 6.3Total 7.2 7.8 7.3 6.7 4.6 4.7 38.4
Less than two hours More than three sessions weekly 0.4 0.5 0.5 0.6 0.4 0.7 3.2Two or three sessions weekly 0.9 1.6 1.6 1.6 1.1 1.2 8.1Less than two sessions weekly 3.8 4.0 3.9 3.5 2.3 1.8 19.4Total 5.1 6.1 6.1 5.7 3.9 3.7 30.6
Total More than three sessions weekly 8.4 8.1 8.0 8.3 6.7 7.2 46.7Two or three sessions weekly 5.7 5.3 4.9 4.4 2.9 3.2 26.4Less than two sessions weekly 5.3 5.4 5.1 4.9 3.4 2.9 26.9Total 19.4 18.8 18.1 17.5 13.0 13.3 100.0
(a) Relates to persons aged 15 years and over who participated in one of their ‘top three’ physical activities for exercise, recreation and sport over a two-week period prior to interview in 2005. ‘Top three’ activities refer to the physical activities that respondents participated in most over the 12 months prior to interview
* Estimate has a relative standard error of between 25% and 50% and should be used with caution

participation in exercise, recreation and sport survey 2005 Annual Report 29 © standing committee on recreation and sport 2006
Table 13: Male participants — duration of participation by age
15 to 24 25 to 34 35 to 44 45 to 54 55 to 64 65 and over
Total
Number (’000)
Five hours or more More than three sessions weekly 424.0 242.9 217.6 209.1 216.6 231.4 1541.7Two or three sessions weekly 95.0 55.0 51.7 59.1 47.3 89.8 397.9Less than two sessions weekly *9.4 33.3 27.1 *15.6 *23.8 *9.2 118.5Total 528.4 331.2 296.4 283.9 287.8 330.4 2058.0
Two hours or more More than three sessions weekly 108.8 164.5 152.8 172.0 129.5 124.2 851.7but less than five hours Two or three sessions weekly 172.4 145.7 129.5 104.0 59.7 44.2 655.3
Less than two sessions weekly 100.2 93.9 77.7 102.9 69.1 53.8 497.7Total 381.3 404.0 360.0 378.9 258.3 222.2 2004.7
Less than two hours More than three sessions weekly **2.1 30.0 *26.2 39.6 28.8 36.4 163.1Two or three sessions weekly 42.7 74.4 70.4 60.7 47.0 42.3 337.5Less than two sessions weekly 182.4 206.7 233.7 182.2 125.4 67.5 998.0Total 227.2 311.1 330.3 282.5 201.2 146.2 1498.6
Total More than three sessions weekly 534.9 437.3 396.6 420.7 374.9 392.0 2556.5Two or three sessions weekly 310.1 275.1 251.6 223.8 153.9 176.2 1390.7Less than two sessions weekly 291.9 333.9 338.6 300.8 218.4 130.5 1614.1Total 1137.0 1046.3 986.7 945.3 747.2 698.8 5561.3
Participation rate (%)
Five hours or more More than three sessions weekly 7.6 4.4 3.9 3.8 3.9 4.2 27.7Two or three sessions weekly 1.7 1.0 0.9 1.1 0.9 1.6 7.2Less than two sessions weekly *0.2 0.6 0.5 0.3 0.4 0.2 2.1Total 9.5 6.0 5.3 5.1 5.2 5.9 37.0
Two hours or more More than three sessions weekly 2.0 3.0 2.7 3.1 2.3 2.2 15.3but less than five hours Two or three sessions weekly 3.1 2.6 2.3 1.9 1.1 0.8 11.8
Less than two sessions weekly 1.8 1.7 1.4 1.9 1.2 1.0 8.9Total 6.9 7.3 6.5 6.8 4.6 4.0 36.0
Less than two hours More than three sessions weekly **0 0.5 *0.5 0.7 0.5 0.7 2.9Two or three sessions weekly 0.8 1.3 1.3 1.1 0.8 0.8 6.1Less than two sessions weekly 3.3 3.7 4.2 3.3 2.3 1.2 17.9Total 4.1 5.6 5.9 5.1 3.6 2.6 26.9
Total More than three sessions weekly 9.6 7.9 7.1 7.6 6.7 7.0 46.0Two or three sessions weekly 5.6 4.9 4.5 4.0 2.8 3.2 25.0Less than two sessions weekly 5.2 6.0 6.1 5.4 3.9 2.3 29.0Total 20.4 18.8 17.7 17.0 13.4 12.6 100.0
(a) Relates to persons aged 15 years and over who participated in one of their ‘top three’ physical activities for exercise, recreation and sport over a two-week period prior to interview in 2005. ‘Top three’ activities refer to the physical activities that respondents participated in most over the 12 months prior to interview
* Estimate has a relative standard error of between 25% and 50% and should be used with caution ** Estimate has a relative standard error greater than 50% and is considered too unreliable for general use
participation in exercise, recreation and sport survey 2005 Annual Report 30 © standing committee on recreation and sport 2006
Table 14: Female participants — duration of participation by age
15 to 24 25 to 34 35 to 44 45 to 54 55 to 64 65 and over
Total
Number (’000)
Five hours or more More than three sessions weekly 239.2 199.0 220.2 258.0 189.9 185.8 1292.2Two or three sessions weekly 29.6 *11.5 *12.9 33.2 *21 26.5 134.6Less than two sessions weekly **2.9 **1.9 **0.8 **1.7 **3.6 **6.2 *17.1Total 271.7 212.4 233.9 292.8 214.5 218.5 1443.9
Two hours or more More than three sessions weekly 141.2 243.4 258.9 225.5 172.7 191.5 1233.2but less than five hours Two or three sessions weekly 237.5 211.2 176.9 122.0 67.0 65.7 880.4
Less than two sessions weekly 54.4 *23.6 30.0 33.1 *25.3 47.4 213.8Total 433.1 478.2 465.8 380.5 265.0 304.6 2327.3
Less than two hours More than three sessions weekly 37.6 29.6 31.5 29.3 *21.3 43.8 193.1Two or three sessions weekly 63.3 104.1 114.1 115.5 82.2 92.4 571.6Less than two sessions weekly 244.2 248.0 209.6 214.8 136.6 138.7 1191.8Total 345.0 381.6 355.2 359.6 240.1 274.9 1956.5
Total More than three sessions weekly 418.0 472.0 510.6 512.8 383.9 421.1 2718.4Two or three sessions weekly 330.4 326.8 303.8 270.6 170.3 184.6 1586.5Less than two sessions weekly 301.5 273.5 240.4 249.5 165.4 192.3 1422.7Total 1049.9 1072.2 1054.9 1032.9 719.6 798.1 5727.6
Participation rate (%)
Five hours or more More than three sessions weekly 4.2 3.5 3.8 4.5 3.3 3.2 22.6Two or three sessions weekly 0.5 *0.2 *0.2 0.6 *0.4 0.5 2.3Less than two sessions weekly **0.1 **0 **0 **0 **0.1 **0.1 *0.3Total 4.7 3.7 4.1 5.1 3.7 3.8 25.2
Two hours or more More than three sessions weekly 2.5 4.2 4.5 3.9 3.0 3.3 21.5but less than five hours Two or three sessions weekly 4.1 3.7 3.1 2.1 1.2 1.1 15.4
Less than two sessions weekly 1.0 *0.4 0.5 0.6 *0.4 0.8 3.7Total 7.6 8.3 8.1 6.6 4.6 5.3 40.6
Less than two hours More than three sessions weekly 0.7 0.5 0.6 0.5 *0.4 0.8 3.4Two or three sessions weekly 1.1 1.8 2.0 2.0 1.4 1.6 10.0Less than two sessions weekly 4.3 4.3 3.7 3.7 2.4 2.4 20.8Total 6.0 6.7 6.2 6.3 4.2 4.8 34.2
Total More than three sessions weekly 7.3 8.2 8.9 9.0 6.7 7.4 47.5Two or three sessions weekly 5.8 5.7 5.3 4.7 3.0 3.2 27.7Less than two sessions weekly 5.3 4.8 4.2 4.4 2.9 3.4 24.8Total 18.3 18.7 18.4 18.0 12.6 13.9 100.0
(a) Relates to persons aged 15 years and over who participated in one of their ‘top three’ physical activities for exercise, recreation and sport over a two-week period prior to interview in 2005. ‘Top three’ activities refer to the physical activities that respondents participated in most over the 12 months prior to interview
* Estimate has a relative standard error of between 25% and 50% and should be used with caution ** Estimate has a relative standard error greater than 50% and is considered too unreliable for general use

participation in exercise, recreation and sport survey 2005 Annual Report 31 © standing committee on recreation and sport 2006
Table 15: Selected activities by sex, 2005
MALES FEMALES PERSONSNumber Participation Number Participation Number Participation
rate rate rateActivity (’000) (%) (’000) (%) (’000) (%)
Aerobics/fitness 1,167.8 14.7 1,791.9 22.3 2,959.7 18.5 Aquarobics *18.8 *0.2 146.2 1.8 165.0 1.0 Athletics/track and field 39.1 0.5 33.6 0.4 72.6 0.5 Australian football 488.3 6.1 47.9 0.6 536.2 3.4 Badminton 45.9 0.6 61.0 0.8 106.9 0.7 Baseball 46.0 0.6 *10.0 *0.1 56.1 0.4 Basketball 363.3 4.6 199.8 2.5 563.1 3.5 Billiards/snooker/pool *14.1 *0.2 **1.2 - *15.4 *0.1 Boxing 40.9 0.5 26.8 0.3 67.7 0.4 Canoeing/kayaking 91.9 1.2 52.4 0.7 144.3 0.9 Carpet bowls *9.5 *0.1 32.1 0.4 41.6 0.3 Cricket (indoor) 150.2 1.9 *15.2 *0.2 165.5 1.0 Cricket (outdoor) 402.6 5.1 54.4 0.7 457.0 2.9 Cycling 1,067.2 13.4 579.7 7.2 1,646.9 10.3 Dancing 41.9 0.5 316.3 3.9 358.2 2.2 Darts *15.3 *0.2 *12.4 *0.2 27.7 0.2 Fishing 293.2 3.7 48.8 0.6 342.0 2.1 Football (indoor) 219.4 2.8 44.7 0.6 264.1 1.7 Football (outdoor) 458.7 5.8 155.6 1.9 614.3 3.8 Golf 920.3 11.6 219.0 2.7 1,139.3 7.1 Gymnastics *11.9 *0.1 45.7 0.6 57.6 0.4 Hockey (indoor) *6.9 *0.1 **6.1 **0.1 *13.0 *0.1 Hockey (outdoor) 71.5 0.9 60.2 0.7 131.7 0.8 Horse riding/equestrian activities/polocrosse 63.7 0.8 126.7 1.6 190.4 1.2 Ice/snow sports 145.7 1.8 82.3 1.0 228.0 1.4 Lawn bowls 229.7 2.9 126.8 1.6 356.5 2.2 Martial arts 158.8 2.0 167.0 2.1 325.8 2.0 Motor sports 128.3 1.6 *16.1 *0.2 144.4 0.9 Netball 63.5 0.8 518.2 6.4 581.7 3.6 Orienteering 96.7 1.2 34.5 0.4 131.2 0.8 Rock climbing 52.7 0.7 30.1 0.4 82.8 0.5 Roller sports 75.0 0.9 27.4 0.3 102.4 0.6 Rowing 32.4 0.4 *22.8 *0.3 55.2 0.3 Rugby league 183.9 2.3 *12.0 *0.1 195.9 1.2 Rugby union 152.9 1.9 *13.0 *0.2 165.9 1.0 Running 744.0 9.4 487.6 6.1 1,231.7 7.7 Sailing 101.3 1.3 46.3 0.6 147.6 0.9 Scuba diving 69.0 0.9 *17.8 *0.2 86.8 0.5 Shooting sports 69.9 0.9 **6.1 **0.1 76.0 0.5 Softball *13.4 *0.2 44.8 0.6 58.1 0.4 Squash/racquetball 175.3 2.2 58.8 0.7 234.1 1.5 Surf sports 355.8 4.5 59.3 0.7 415.0 2.6 Swimming 994.1 12.5 1,317.1 16.4 2,311.2 14.4 Table tennis 83.1 1.0 31.1 0.4 114.2 0.7 Tennis 680.8 8.6 572.5 7.1 1,253.3 7.8 Tenpin bowling 70.5 0.9 54.7 0.7 125.2 0.8 Touch football 240.0 3.0 127.2 1.6 367.2 2.3 Triathlons 31.0 0.4 *13.8 *0.2 44.8 0.3 Volleyball 103.6 1.3 103.2 1.3 206.8 1.3 Walking (bush) 424.7 5.3 485.7 6.0 910.4 5.7 Walking (other) 2,120.5 26.7 3,853.2 47.9 5,973.6 37.3 Water polo *8.4 *0.1 *8.2 *0.1 *16.5 *0.1 Waterskiing/powerboating 97.3 1.2 45.7 0.6 143.0 0.9 Weight training 206.6 2.6 120.5 1.5 327.1 2.0 Yoga 82.9 1.0 458.2 5.7 541.1 3.4 * Estimate has a relative standard error of between 25% and 50% and should be used with caution ** Estimate has a relative standard error greater than 50% and is considered too unreliable for general use
participation in exercise, recreation and sport survey 2005 Annual Report 32 © standing committee on recreation and sport 2006
Table 16: Selected activities by age, 2005
Number (’000)15 to 24 25 to 34 35 to 44 45 to 54 55 to 64 65 years Total
Activity years years years years years and over
Aerobics/fitness 660.3 738.7 586.7 434.0 264.2 275.7 2,959.7 Aquarobics **0.3 *21.2 *18.4 *26.3 36.9 62.0 165.0 Athletics/track and field 65.0 **4.4 **1.3 **1.3 **0.6 **0.2 72.6 Australian football 313.5 101.4 85.6 32.4 **3.2 - 536.2 Badminton 34.4 *21.7 *25.5 *12.9 **6.2 **6.4 106.9 Baseball *23.5 **5.5 *22.1 **3.1 **1.8 - 56.1 Basketball 334.8 137.0 55.5 28.7 **5.1 **2.1 563.1 Billiards/snooker/pool **3.4 **4.2 **4.0 **0.4 - **3.3 15.4 Boxing *23.5 *20.0 *19.8 **4.4 - - 67.7 Canoeing/kayaking 26.6 *19.6 *25.0 42.8 *21.4 *8.8 144.3 Carpet bowls **0.3 - **3.2 **3.2 **2.8 32.1 41.6 Cricket (indoor) 65.3 56.6 28.5 **5.3 *9.7 - 165.5 Cricket (outdoor) 197.8 118.7 98.2 35.1 **5.6 **1.4 457.0 Cycling 238.1 428.4 428.9 303.4 164.2 83.7 1,646.9 Dancing 130.7 51.0 42.8 47.6 41.9 44.0 358.2 Darts - **3.8 **4.4 *11.3 *6.8 **1.4 27.7 Fishing 32.4 41.8 81.6 55.1 83.3 47.9 342.0 Football (indoor) 150.6 82.1 *17.6 *7.8 **5.9 - 264.1 Football (outdoor) 340.8 145.8 92.3 27.5 *8.0 - 614.3 Golf 91.7 180.4 225.0 235.7 205.6 200.9 1,139.3 Gymnastics 38.2 *8.8 **1.8 **5.8 **0.4 **2.6 57.6 Hockey (indoor) *9.0 **1.0 **2.7 **0.2 - - *13.0 Hockey (outdoor) 65.7 31.9 *18.0 *13.3 **2.9 - 131.7 Horse riding/equestrian activities/polocrosse 40.7 34.4 35.8 43.5 27.1 *8.8 190.4 Ice/snow sports 52.1 69.4 44.1 41.6 *12.7 *8.1 228.0 Lawn bowls *6.8 *9.0 *24.6 43.3 76.9 196.0 356.5 Martial arts 110.5 75.9 48.7 34.1 27.3 29.2 325.8 Motor sports 32.8 42.5 33.1 28.2 *7.6 **0.2 144.4 Netball 293.8 143.4 90.8 42.5 *9.2 **2.0 581.7 Orienteering 35.6 39.3 34.8 *20.4 **0.8 **0.2 131.2 Rock climbing *25.4 *20.2 *17.0 *12.4 **5.5 **2.3 82.8 Roller sports 64.2 *19.4 *16.5 **1.6 **0.6 - 102.4 Rowing *22.9 *7.5 **3.2 *9.7 *9.2 **2.6 55.2 Rugby league 129.5 35.9 *26.4 **2.5 **1.7 - 195.9 Rugby union 108.0 *25.6 *18.5 *8.1 **3.3 **2.4 165.9 Running 354.6 362.9 306.9 161.4 41.6 **4.3 1,231.7 Sailing *23.8 *20.4 29.2 33.5 *25.9 *14.9 147.6 Scuba diving **2.3 38.4 *16.5 *19.4 *7.0 **3.1 86.8 Shooting sports *15.8 *13.3 *13.5 *9.3 *21.7 **2.5 76.0 Softball *24.2 *12.6 *12.9 *7.8 **0.7 - 58.1 Squash/racquetball 34.5 72.2 66.5 46.9 *13.7 **0.3 234.1 Surf sports 141.8 95.3 92.0 65.0 *15.1 **5.8 415.0 Swimming 403.1 518.8 537.3 447.9 244.7 159.4 2,311.2 Table tennis 30.6 *20.2 *17.4 *17.1 *7.5 *21.5 114.2 Tennis 253.1 252.9 312.6 234.7 102.5 97.5 1,253.3 Tenpin bowling *19.4 *15.3 *16.9 32.0 *21.8 *19.7 125.2 Touch football 166.2 118.7 62.6 *17.5 **0.6 **1.5 367.2 Triathlons **5.5 *21.0 *16.4 **0.3 **1.6 - 44.8 Volleyball 103.8 50.7 31.2 *16.9 **3.6 **0.6 206.8 Walking (bush) 75.2 157.8 178.3 234.8 155.1 109.2 910.4 Walking (other) 470.9 950.1 1,135.5 1,265.5 1,077.5 1,074.1 5,973.6 Water polo *11.1 **2.2 **1.5 **1.7 - - *16.5 Waterskiing/powerboating 32.3 42.7 42.3 *20.9 *2.4 *2.4 143.0 Weight training 44.2 93.8 86.1 46.0 22.9 34.1 327.1 Yoga 50.7 123.3 139.4 115.3 72.6 39.8 541.1
* Estimate has a relative standard error of between 25% and 50% and should be used with caution ** Estimate has a relative standard error greater than 50% and is considered too unreliable for general use

participation in exercise, recreation and sport survey 2005 Annual Report 33 © standing committee on recreation and sport 2006
Table 16 continued: Selected activities by age, 2005
Participation rate (%)15 to 24 25 to 34 35 to 44 45 to 54 55 to 64 65 years Total
Activity years years years years years and over
Aerobics/fitness 23.4 24.8 19.8 15.7 12.4 11.8 18.5 Aquarobics - *0.7 *0.6 *1.0 1.7 2.6 1.0 Athletics/track and field 2.3 **0.1 - - - - 0.5 Australian football 11.1 3.4 2.9 1.2 **0.2 - 3.4 Badminton 1.2 *0.7 *0.9 *0.5 **0.3 **0.3 0.7 Baseball *0.8 **0.2 *0.7 **0.1 **0.1 - 0.4 Basketball 11.8 4.6 1.9 1.0 **0.2 **0.1 3.5 Billiards/snooker/pool **0.1 **0.1 **0.1 - - **0.1 0.1 Boxing *0.8 *0.7 *0.7 **0.2 - - 0.4 Canoeing/kayaking 0.9 *0.7 *0.8 1.5 *1.0 *0.4 0.9 Carpet bowls - - **0.1 **0.1 **0.1 1.4 0.3 Cricket (indoor) 2.3 1.9 1.0 **0.2 *0.5 - 1.0 Cricket (outdoor) 7.0 4.0 3.3 1.3 **0.3 **0.1 2.9 Cycling 8.4 14.4 14.5 11.0 7.7 3.6 10.3 Dancing 4.6 1.7 1.4 1.7 2.0 1.9 2.2 Darts - **0.1 **0.1 *0.4 *0.3 **0.1 0.2 Fishing 1.1 1.4 2.8 2.0 3.9 2.0 2.1 Football (indoor) 5.3 2.8 *0.6 *0.3 **0.3 - 1.7 Football (outdoor) 12.1 4.9 3.1 1.0 *0.4 - 3.8 Golf 3.2 6.0 7.6 8.5 9.7 8.6 7.1 Gymnastics 1.3 *0.3 **0.1 **0.2 - **0.1 0.4 Hockey (indoor) *0.3 - **0.1 - - - *0.1 Hockey (outdoor) 2.3 1.1 *0.6 *0.5 **0.1 - 0.8 Horse riding/equestrian activities/polocrosse 1.4 1.2 1.2 1.6 1.3 *0.4 1.2 Ice/snow sports 1.8 2.3 1.5 1.5 *0.6 *0.3 1.4 Lawn bowls *0.2 *0.3 *0.8 1.6 3.6 8.4 2.2 Martial arts 3.9 2.5 1.6 1.2 1.3 1.2 2.0 Motor sports 1.2 1.4 1.1 1.0 *0.4 - 0.9 Netball 10.4 4.8 3.1 1.5 *0.4 **0.1 3.6 Orienteering 1.3 1.3 1.2 *0.7 - - 0.8 Rock climbing *0.9 *0.7 *0.6 *0.4 **0.3 **0.1 0.5 Roller sports 2.3 *0.7 *0.6 **0.1 - - 0.6 Rowing *0.8 *0.3 **0.1 *0.4 *0.4 **0.1 0.3 Rugby league 4.6 1.2 *0.9 **0.1 **0.1 - 1.2 Rugby union 3.8 *0.9 *0.6 *0.3 **0.2 **0.1 1.0 Running 12.5 12.2 10.4 5.8 2.0 **0.2 7.7 Sailing *0.8 *0.7 1.0 1.2 *1.2 *0.6 0.9 Scuba diving **0.1 1.3 *0.6 *0.7 *0.3 **0.1 0.5 Shooting sports *0.6 *0.4 *0.5 *0.3 *1.0 **0.1 0.5 Softball *0.9 *0.4 *0.4 *0.3 - - 0.4 Squash/racquetball 1.2 2.4 2.2 1.7 *0.6 - 1.5 Surf sports 5.0 3.2 3.1 2.4 *0.7 **0.2 2.6 Swimming 14.3 17.4 18.2 16.2 11.5 6.8 14.4 Table tennis 1.1 *0.7 *0.6 *0.6 *0.4 *0.9 0.7 Tennis 9.0 8.5 10.6 8.5 4.8 4.2 7.8 Tenpin bowling *0.7 *0.5 *0.6 1.2 *1.0 *0.8 0.8 Touch football 5.9 4.0 2.1 *0.6 - **0.1 2.3 Triathlons **0.2 *0.7 *0.6 - **0.1 - 0.3 Volleyball 3.7 1.7 1.1 *0.6 **0.2 - 1.3 Walking (bush) 2.7 5.3 6.0 8.5 7.3 4.7 5.7 Walking (other) 16.7 31.8 38.4 45.8 50.7 45.9 37.3 Water polo *0.4 **0.1 **0.1 **0.1 - - *0.1 Waterskiing/powerboating 1.1 1.4 1.4 *0.8 *0.1 *0.1 0.9 Weight training 1.6 3.1 2.9 1.7 1.1 1.5 2.0 Yoga 1.8 4.1 4.7 4.2 3.4 1.7 3.4 * Estimate has a relative standard error of between 25% and 50% and should be used with caution ** Estimate has a relative standard error greater than 50% and is considered too unreliable for general use
participation in exercise, recreation and sport survey 2005 Annual Report 34 © standing committee on recreation and sport 2006
Table 17: Selected sports and physical activities by frequency of participation, 2005 (a)
Number (’000)
1–6 7–12 13–26 27–52 53–104 more than TotalActivity times times times times times 104 times
Aerobics/fitness 126.7 102.3 203.5 513.9 711.9 1,301.3 2,959.7 Aquarobics *17.6 10.4 *12.7 56.6 42.5 *25.3 165.0 Athletics/track and field *26.0 *9.3 **6.5 *11.5 **4.4 *15.0 72.6 Australian football 60.3 63.3 83.1 105.6 125.9 97.9 536.2 Badminton *20.5 *24.0 *24.6 *22.4 *10.5 **4.9 106.9 Baseball *8.8 **3.2 **5.4 *23.0 *7.7 *8.0 56.1 Basketball 66.5 60.5 62.6 207.5 104.4 61.7 563.1 Billiards/snooker/pool **1.6 **1.0 **0.5 **5.7 **2.3 **4.2 *15.4 Boxing **6.1 **4.5 *10.6 *23.9 *12.3 *10.3 67.7 Canoeing/kayaking 54.4 28.2 *25.1 *17.4 **6.6 *12.7 144.3 Carpet bowls **2.1 **0.7 **2.4 *20.7 *9.6 **6.1 41.6 Cricket (indoor) 30.1 36.2 *24.7 54.0 *12.6 *7.8 165.5 Cricket (outdoor) 104.3 53.6 101.1 90.7 77.4 29.8 457.0 Cycling 164.5 186.3 279.2 339.8 260.2 416.9 1,646.9 Dancing 41.3 35.5 28.9 118.5 89.5 44.5 358.2 Darts **2.7 - **3.5 *12.3 **4.1 **5.1 27.7 Fishing 74.6 69.9 79.2 81.5 *17.5 *19.3 342.0 Football (indoor) 42.5 31.0 48.0 96.1 *26.2 *20.2 264.1 Football (outdoor) 70.9 53.3 129.1 131.6 125.2 104.3 614.3 Golf 249.9 177.8 164.1 275.4 190.3 81.8 1,139.3 Gymnastics **3.0 **4.2 **4.4 *7.1 *15.6 *23.1 57.6 Hockey (indoor) **4.9 **0.2 **1.8 **2.1 - **4.1 *13.0 Hockey (outdoor) **4.6 *21.9 *25.4 40.3 33.2 **6.3 131.7 Horse riding/equestrian activities/polocrosse 32.3 *20.3 *18.4 46.0 *14.8 58.7 190.4 Ice/snow sports 107.1 46.0 41.5 *13.9 *11.1 *8.5 228.0 Lawn bowls 42.5 *15.5 *19.0 104.8 90.5 84.2 356.5 Martial arts *11.6 *25.2 *22.0 96.6 76.3 94.2 325.8 Motor sports 34.9 *24.2 31.4 33.4 **4.5 *15.9 144.4 Netball 47.2 58.8 128.3 186.4 106.3 54.7 581.7 Orienteering *18.4 *8.8 *14.0 *26.5 27.8 35.6 131.2 Rock climbing 46.2 *12.1 **2.7 *13.7 **3.1 **5.0 82.8 Roller sports *14.8 *8.3 **7.4 26.9 *11.4 33.5 102.4 Rowing *9.5 **0.2 **0.5 *14.9 **6.0 *24.2 55.2 Rugby league *23.1 *15.4 *22.0 44.0 49.0 42.4 195.9 Rugby union *18.8 *12.3 29.2 37.7 38.3 29.6 165.9 Running 79.0 65.2 98.2 279.0 243.1 467.1 1,231.7 Sailing *25.8 *16.9 37.6 32.2 *21.7 *13.5 147.6 Scuba diving *21.0 *25.3 *24.0 *9.7 **2.2 **4.7 86.8 Shooting sports *23.8 *12.7 *9.4 *14.5 *9.7 **5.8 76.0 Softball *7.5 **2.6 *21.3 *15.7 *7.9 **3.1 58.1 Squash/racquetball 30.6 *19.0 50.5 78.7 40.9 *14.5 234.1 Surf sports 42.9 61.4 64.0 99.2 51.1 96.4 415.0 Swimming 254.3 306.2 394.2 600.9 383.7 371.9 2,311.2 Table tennis *14.9 *17.9 *15.6 29.0 *21.2 *15.6 114.2 Tennis 249.1 191.4 234.0 365.0 141.9 72.0 1,253.3 Tenpin bowling 44.4 **4.9 *12.1 46.8 *10.1 *6.9 125.2 Touch football 38.0 42.5 94.0 135.9 38.5 *18.3 367.2 Triathlons *17.5 **2.6 **2.8 **1.0 **0.1 **20.8 44.8 Volleyball 30.7 36.9 39.8 59.8 *20.3 *19.2 206.8 Walking (bush) 298.5 214.7 110.2 123.7 41.7 121.6 910.4 Walking (other) 118.0 160.2 276.1 773.2 1,069.4 3,576.7 5,973.6 Water polo **0.2 **2.7 **2.3 **3.4 **3.9 **4.0 *16.5 Waterskiing/powerboating 48.2 32.8 *19.7 35.3 **4.1 **2.9 143.0 Weight training **4.5 *9.6 *21.8 52.4 79.0 159.8 327.1 Yoga 38.7 46.4 60.0 195.1 114.3 86.7 541.1
(a) Number of times persons undertook the activity, including practice and training, during the 12 months prior to interview in 2005
* Estimate has a relative standard error of between 25% and 50% and should be used with caution ** Estimate has a relative standard error greater than 50% and is considered too unreliable for general use
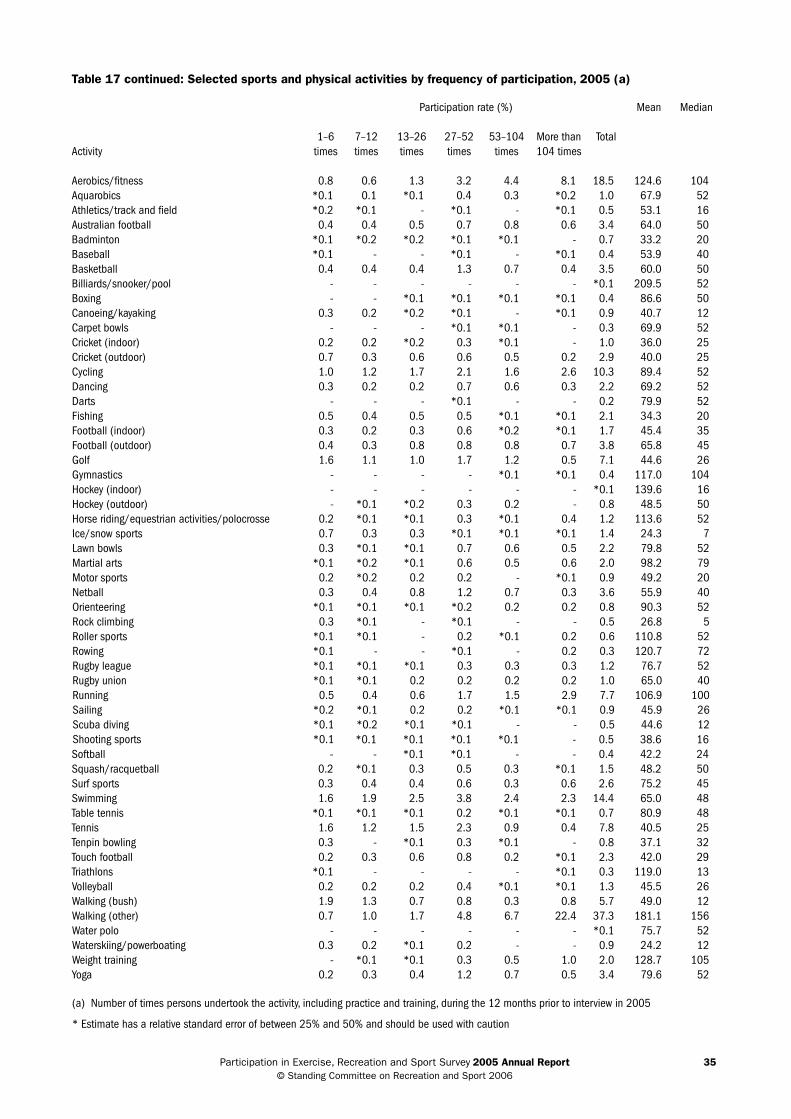
participation in exercise, recreation and sport survey 2005 Annual Report 35 © standing committee on recreation and sport 2006
Table 17 continued: Selected sports and physical activities by frequency of participation, 2005 (a)
Participation rate (%) Mean Median
1–6 7–12 13–26 27–52 53–104 More than TotalActivity times times times times times 104 times
Aerobics/fitness 0.8 0.6 1.3 3.2 4.4 8.1 18.5 124.6 104Aquarobics *0.1 0.1 *0.1 0.4 0.3 *0.2 1.0 67.9 52Athletics/track and field *0.2 *0.1 - *0.1 - *0.1 0.5 53.1 16Australian football 0.4 0.4 0.5 0.7 0.8 0.6 3.4 64.0 50Badminton *0.1 *0.2 *0.2 *0.1 *0.1 - 0.7 33.2 20Baseball *0.1 - - *0.1 - *0.1 0.4 53.9 40Basketball 0.4 0.4 0.4 1.3 0.7 0.4 3.5 60.0 50Billiards/snooker/pool - - - - - - *0.1 209.5 52Boxing - - *0.1 *0.1 *0.1 *0.1 0.4 86.6 50Canoeing/kayaking 0.3 0.2 *0.2 *0.1 - *0.1 0.9 40.7 12Carpet bowls - - - *0.1 *0.1 - 0.3 69.9 52Cricket (indoor) 0.2 0.2 *0.2 0.3 *0.1 - 1.0 36.0 25Cricket (outdoor) 0.7 0.3 0.6 0.6 0.5 0.2 2.9 40.0 25Cycling 1.0 1.2 1.7 2.1 1.6 2.6 10.3 89.4 52Dancing 0.3 0.2 0.2 0.7 0.6 0.3 2.2 69.2 52Darts - - - *0.1 - - 0.2 79.9 52Fishing 0.5 0.4 0.5 0.5 *0.1 *0.1 2.1 34.3 20Football (indoor) 0.3 0.2 0.3 0.6 *0.2 *0.1 1.7 45.4 35Football (outdoor) 0.4 0.3 0.8 0.8 0.8 0.7 3.8 65.8 45Golf 1.6 1.1 1.0 1.7 1.2 0.5 7.1 44.6 26Gymnastics - - - - *0.1 *0.1 0.4 117.0 104Hockey (indoor) - - - - - - *0.1 139.6 16Hockey (outdoor) - *0.1 *0.2 0.3 0.2 - 0.8 48.5 50Horse riding/equestrian activities/polocrosse 0.2 *0.1 *0.1 0.3 *0.1 0.4 1.2 113.6 52Ice/snow sports 0.7 0.3 0.3 *0.1 *0.1 *0.1 1.4 24.3 7Lawn bowls 0.3 *0.1 *0.1 0.7 0.6 0.5 2.2 79.8 52Martial arts *0.1 *0.2 *0.1 0.6 0.5 0.6 2.0 98.2 79Motor sports 0.2 *0.2 0.2 0.2 - *0.1 0.9 49.2 20Netball 0.3 0.4 0.8 1.2 0.7 0.3 3.6 55.9 40Orienteering *0.1 *0.1 *0.1 *0.2 0.2 0.2 0.8 90.3 52Rock climbing 0.3 *0.1 - *0.1 - - 0.5 26.8 5Roller sports *0.1 *0.1 - 0.2 *0.1 0.2 0.6 110.8 52Rowing *0.1 - - *0.1 - 0.2 0.3 120.7 72Rugby league *0.1 *0.1 *0.1 0.3 0.3 0.3 1.2 76.7 52Rugby union *0.1 *0.1 0.2 0.2 0.2 0.2 1.0 65.0 40Running 0.5 0.4 0.6 1.7 1.5 2.9 7.7 106.9 100Sailing *0.2 *0.1 0.2 0.2 *0.1 *0.1 0.9 45.9 26Scuba diving *0.1 *0.2 *0.1 *0.1 - - 0.5 44.6 12Shooting sports *0.1 *0.1 *0.1 *0.1 *0.1 - 0.5 38.6 16Softball - - *0.1 *0.1 - - 0.4 42.2 24Squash/racquetball 0.2 *0.1 0.3 0.5 0.3 *0.1 1.5 48.2 50Surf sports 0.3 0.4 0.4 0.6 0.3 0.6 2.6 75.2 45Swimming 1.6 1.9 2.5 3.8 2.4 2.3 14.4 65.0 48Table tennis *0.1 *0.1 *0.1 0.2 *0.1 *0.1 0.7 80.9 48Tennis 1.6 1.2 1.5 2.3 0.9 0.4 7.8 40.5 25Tenpin bowling 0.3 - *0.1 0.3 *0.1 - 0.8 37.1 32Touch football 0.2 0.3 0.6 0.8 0.2 *0.1 2.3 42.0 29Triathlons *0.1 - - - - *0.1 0.3 119.0 13Volleyball 0.2 0.2 0.2 0.4 *0.1 *0.1 1.3 45.5 26Walking (bush) 1.9 1.3 0.7 0.8 0.3 0.8 5.7 49.0 12Walking (other) 0.7 1.0 1.7 4.8 6.7 22.4 37.3 181.1 156Water polo - - - - - - *0.1 75.7 52Waterskiing/powerboating 0.3 0.2 *0.1 0.2 - - 0.9 24.2 12Weight training - *0.1 *0.1 0.3 0.5 1.0 2.0 128.7 105Yoga 0.2 0.3 0.4 1.2 0.7 0.5 3.4 79.6 52
(a) Number of times persons undertook the activity, including practice and training, during the 12 months prior to interview in 2005
* Estimate has a relative standard error of between 25% and 50% and should be used with caution
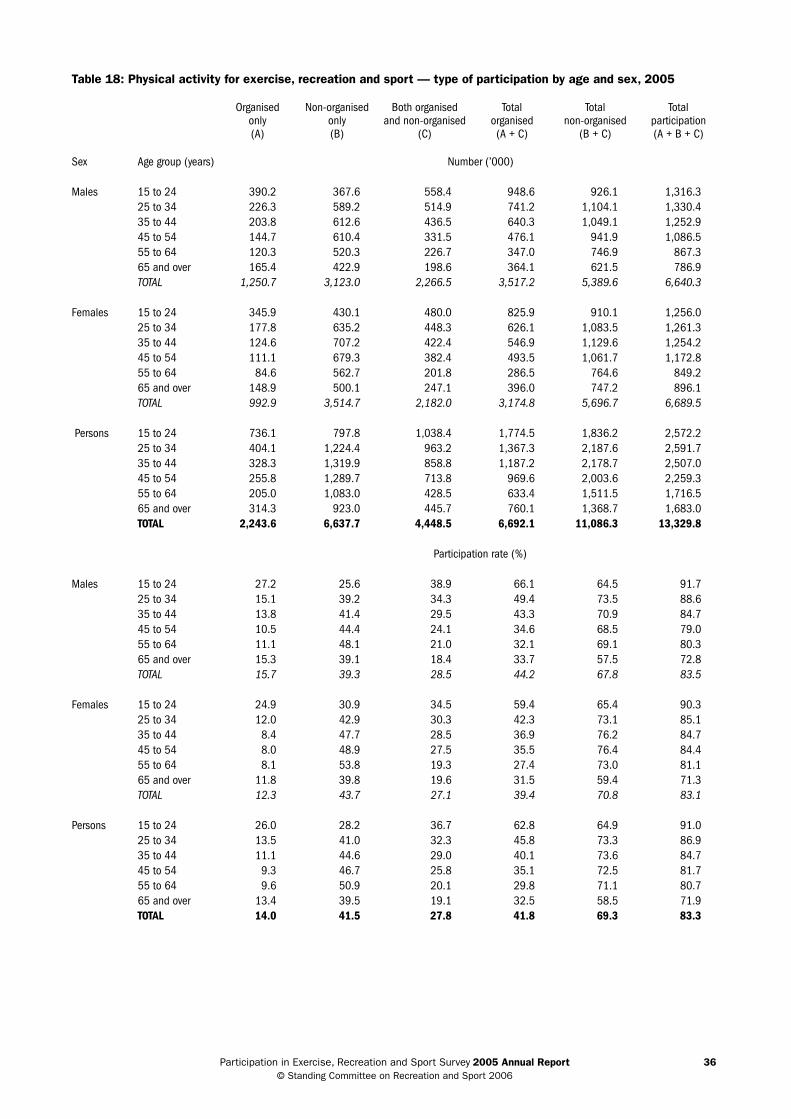
participation in exercise, recreation and sport survey 2005 Annual Report 36 © standing committee on recreation and sport 2006
Table 18: Physical activity for exercise, recreation and sport — type of participation by age and sex, 2005
Organisedonly(A)
Non-organisedonly(B)
Both organisedand non-organised
(C)
Totalorganised(A + C)
Totalnon-organised
(B + C)
Totalparticipation(A + B + C)
Sex Age group (years) Number (’000)
Males 15 to 24 390.2 367.6 558.4 948.6 926.1 1,316.3 25 to 34 226.3 589.2 514.9 741.2 1,104.1 1,330.4 35 to 44 203.8 612.6 436.5 640.3 1,049.1 1,252.9 45 to 54 144.7 610.4 331.5 476.1 941.9 1,086.5 55 to 64 120.3 520.3 226.7 347.0 746.9 867.3 65 and over 165.4 422.9 198.6 364.1 621.5 786.9 TOTAL 1,250.7 3,123.0 2,266.5 3,517.2 5,389.6 6,640.3
Females 15 to 24 345.9 430.1 480.0 825.9 910.1 1,256.0 25 to 34 177.8 635.2 448.3 626.1 1,083.5 1,261.3 35 to 44 124.6 707.2 422.4 546.9 1,129.6 1,254.2 45 to 54 111.1 679.3 382.4 493.5 1,061.7 1,172.8 55 to 64 84.6 562.7 201.8 286.5 764.6 849.2 65 and over 148.9 500.1 247.1 396.0 747.2 896.1 TOTAL 992.9 3,514.7 2,182.0 3,174.8 5,696.7 6,689.5
Persons 15 to 24 736.1 797.8 1,038.4 1,774.5 1,836.2 2,572.2 25 to 34 404.1 1,224.4 963.2 1,367.3 2,187.6 2,591.7 35 to 44 328.3 1,319.9 858.8 1,187.2 2,178.7 2,507.0 45 to 54 255.8 1,289.7 713.8 969.6 2,003.6 2,259.3 55 to 64 205.0 1,083.0 428.5 633.4 1,511.5 1,716.5 65 and over 314.3 923.0 445.7 760.1 1,368.7 1,683.0 TOTAL 2,243.6 6,637.7 4,448.5 6,692.1 11,086.3 13,329.8
Participation rate (%)
Males 15 to 24 27.2 25.6 38.9 66.1 64.5 91.725 to 34 15.1 39.2 34.3 49.4 73.5 88.635 to 44 13.8 41.4 29.5 43.3 70.9 84.745 to 54 10.5 44.4 24.1 34.6 68.5 79.055 to 64 11.1 48.1 21.0 32.1 69.1 80.365 and over 15.3 39.1 18.4 33.7 57.5 72.8TOTAL 15.7 39.3 28.5 44.2 67.8 83.5
Females 15 to 24 24.9 30.9 34.5 59.4 65.4 90.325 to 34 12.0 42.9 30.3 42.3 73.1 85.135 to 44 8.4 47.7 28.5 36.9 76.2 84.745 to 54 8.0 48.9 27.5 35.5 76.4 84.455 to 64 8.1 53.8 19.3 27.4 73.0 81.165 and over 11.8 39.8 19.6 31.5 59.4 71.3TOTAL 12.3 43.7 27.1 39.4 70.8 83.1
Persons 15 to 24 26.0 28.2 36.7 62.8 64.9 91.025 to 34 13.5 41.0 32.3 45.8 73.3 86.935 to 44 11.1 44.6 29.0 40.1 73.6 84.745 to 54 9.3 46.7 25.8 35.1 72.5 81.755 to 64 9.6 50.9 20.1 29.8 71.1 80.765 and over 13.4 39.5 19.1 32.5 58.5 71.9TOTAL 14.0 41.5 27.8 41.8 69.3 83.3
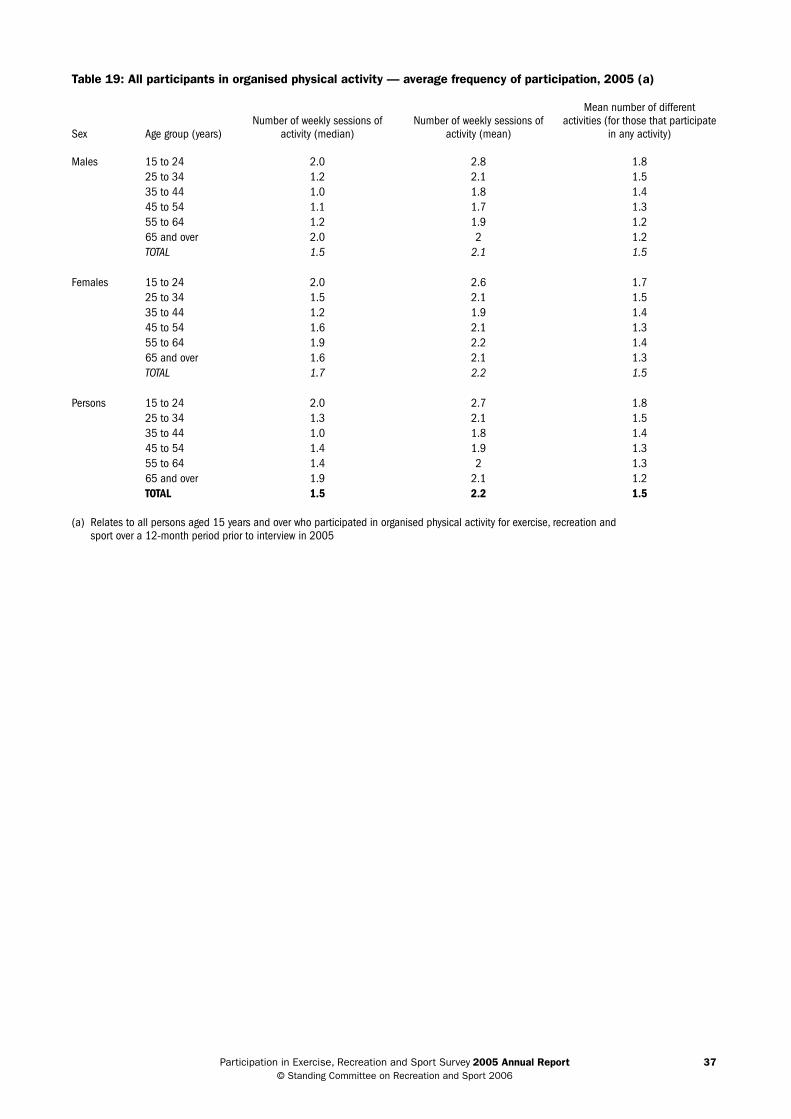
participation in exercise, recreation and sport survey 2005 Annual Report 37 © standing committee on recreation and sport 2006
Table 19: All participants in organised physical activity — average frequency of participation, 2005 (a)
Sex Age group (years)Number of weekly sessions of
activity (median)Number of weekly sessions of
activity (mean)
Mean number of different activities (for those that participate
in any activity)
Males 15 to 24 2.0 2.8 1.825 to 34 1.2 2.1 1.535 to 44 1.0 1.8 1.445 to 54 1.1 1.7 1.355 to 64 1.2 1.9 1.265 and over 2.0 2 1.2TOTAL 1.5 2.1 1.5
Females 15 to 24 2.0 2.6 1.725 to 34 1.5 2.1 1.535 to 44 1.2 1.9 1.445 to 54 1.6 2.1 1.355 to 64 1.9 2.2 1.465 and over 1.6 2.1 1.3TOTAL 1.7 2.2 1.5
Persons 15 to 24 2.0 2.7 1.825 to 34 1.3 2.1 1.535 to 44 1.0 1.8 1.445 to 54 1.4 1.9 1.355 to 64 1.4 2 1.365 and over 1.9 2.1 1.2TOTAL 1.5 2.2 1.5
(a) Relates to all persons aged 15 years and over who participated in organised physical activity for exercise, recreation and sport over a 12-month period prior to interview in 2005
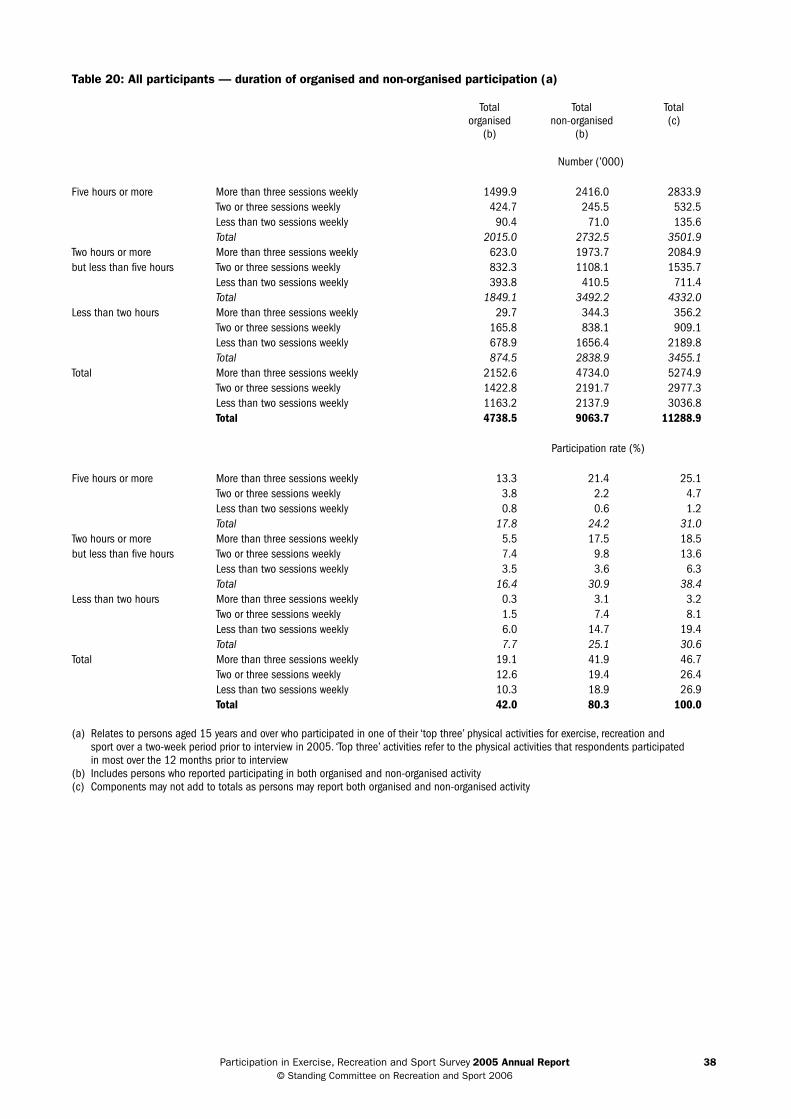
participation in exercise, recreation and sport survey 2005 Annual Report 38 © standing committee on recreation and sport 2006
Table 20: All participants — duration of organised and non-organised participation (a)
Totalorganised
(b)
Totalnon-organised
(b)
Total (c)
Number (’000)
Five hours or more More than three sessions weekly 1499.9 2416.0 2833.9Two or three sessions weekly 424.7 245.5 532.5Less than two sessions weekly 90.4 71.0 135.6Total 2015.0 2732.5 3501.9
Two hours or more More than three sessions weekly 623.0 1973.7 2084.9but less than five hours Two or three sessions weekly 832.3 1108.1 1535.7
Less than two sessions weekly 393.8 410.5 711.4Total 1849.1 3492.2 4332.0
Less than two hours More than three sessions weekly 29.7 344.3 356.2Two or three sessions weekly 165.8 838.1 909.1Less than two sessions weekly 678.9 1656.4 2189.8Total 874.5 2838.9 3455.1
Total More than three sessions weekly 2152.6 4734.0 5274.9Two or three sessions weekly 1422.8 2191.7 2977.3Less than two sessions weekly 1163.2 2137.9 3036.8Total 4738.5 9063.7 11288.9
Participation rate (%)
Five hours or more More than three sessions weekly 13.3 21.4 25.1Two or three sessions weekly 3.8 2.2 4.7Less than two sessions weekly 0.8 0.6 1.2Total 17.8 24.2 31.0
Two hours or more More than three sessions weekly 5.5 17.5 18.5but less than five hours Two or three sessions weekly 7.4 9.8 13.6
Less than two sessions weekly 3.5 3.6 6.3Total 16.4 30.9 38.4
Less than two hours More than three sessions weekly 0.3 3.1 3.2Two or three sessions weekly 1.5 7.4 8.1Less than two sessions weekly 6.0 14.7 19.4Total 7.7 25.1 30.6
Total More than three sessions weekly 19.1 41.9 46.7Two or three sessions weekly 12.6 19.4 26.4Less than two sessions weekly 10.3 18.9 26.9Total 42.0 80.3 100.0
(a) Relates to persons aged 15 years and over who participated in one of their ‘top three’ physical activities for exercise, recreation and sport over a two-week period prior to interview in 2005. ‘Top three’ activities refer to the physical activities that respondents participated in most over the 12 months prior to interview
(b) Includes persons who reported participating in both organised and non-organised activity(c) Components may not add to totals as persons may report both organised and non-organised activity
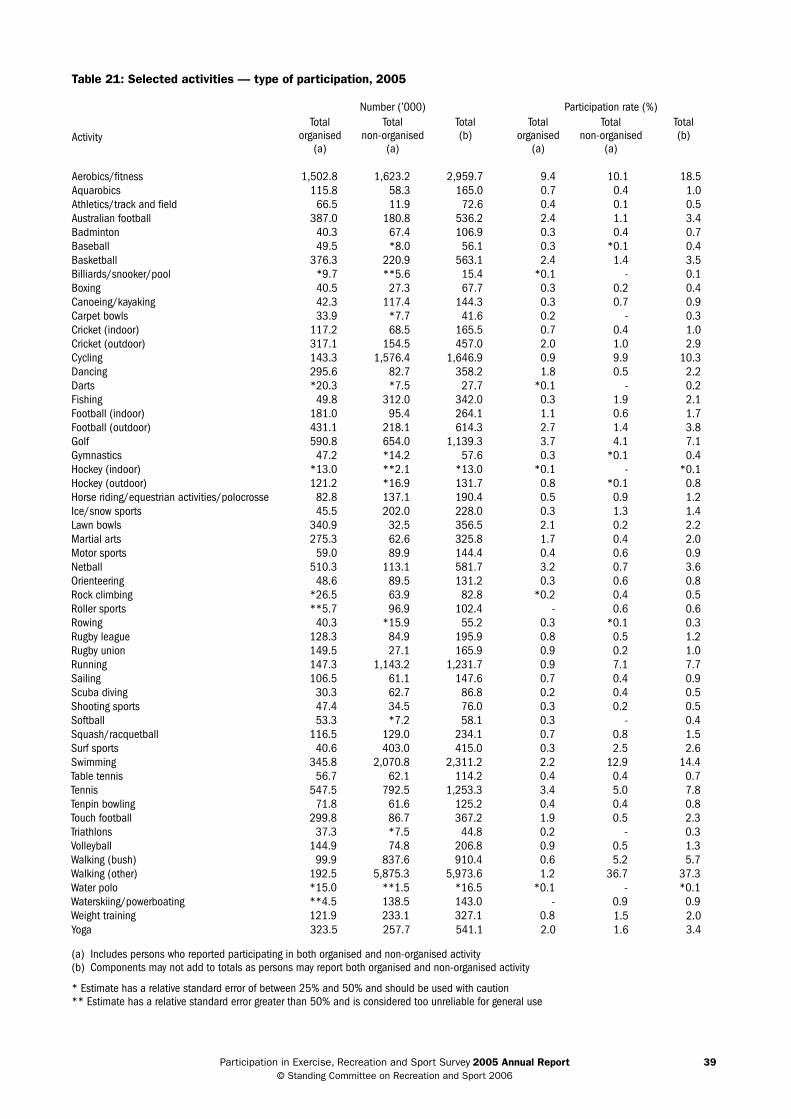
participation in exercise, recreation and sport survey 2005 Annual Report 39 © standing committee on recreation and sport 2006
Table 21: Selected activities — type of participation, 2005
Number (’000) Participation rate (%)Total
organised (a)
Totalnon-organised
(a)
Total (b)
Totalorganised
(a)
Totalnon-organised
(a)
Total (b)Activity
Aerobics/fitness 1,502.8 1,623.2 2,959.7 9.4 10.1 18.5 Aquarobics 115.8 58.3 165.0 0.7 0.4 1.0 Athletics/track and field 66.5 11.9 72.6 0.4 0.1 0.5 Australian football 387.0 180.8 536.2 2.4 1.1 3.4 Badminton 40.3 67.4 106.9 0.3 0.4 0.7 Baseball 49.5 *8.0 56.1 0.3 *0.1 0.4 Basketball 376.3 220.9 563.1 2.4 1.4 3.5 Billiards/snooker/pool *9.7 **5.6 15.4 *0.1 - 0.1 Boxing 40.5 27.3 67.7 0.3 0.2 0.4 Canoeing/kayaking 42.3 117.4 144.3 0.3 0.7 0.9 Carpet bowls 33.9 *7.7 41.6 0.2 - 0.3 Cricket (indoor) 117.2 68.5 165.5 0.7 0.4 1.0 Cricket (outdoor) 317.1 154.5 457.0 2.0 1.0 2.9 Cycling 143.3 1,576.4 1,646.9 0.9 9.9 10.3 Dancing 295.6 82.7 358.2 1.8 0.5 2.2 Darts *20.3 *7.5 27.7 *0.1 - 0.2 Fishing 49.8 312.0 342.0 0.3 1.9 2.1 Football (indoor) 181.0 95.4 264.1 1.1 0.6 1.7 Football (outdoor) 431.1 218.1 614.3 2.7 1.4 3.8 Golf 590.8 654.0 1,139.3 3.7 4.1 7.1 Gymnastics 47.2 *14.2 57.6 0.3 *0.1 0.4 Hockey (indoor) *13.0 **2.1 *13.0 *0.1 - *0.1 Hockey (outdoor) 121.2 *16.9 131.7 0.8 *0.1 0.8 Horse riding/equestrian activities/polocrosse 82.8 137.1 190.4 0.5 0.9 1.2 Ice/snow sports 45.5 202.0 228.0 0.3 1.3 1.4 Lawn bowls 340.9 32.5 356.5 2.1 0.2 2.2 Martial arts 275.3 62.6 325.8 1.7 0.4 2.0 Motor sports 59.0 89.9 144.4 0.4 0.6 0.9 Netball 510.3 113.1 581.7 3.2 0.7 3.6 Orienteering 48.6 89.5 131.2 0.3 0.6 0.8 Rock climbing *26.5 63.9 82.8 *0.2 0.4 0.5 Roller sports **5.7 96.9 102.4 - 0.6 0.6 Rowing 40.3 *15.9 55.2 0.3 *0.1 0.3 Rugby league 128.3 84.9 195.9 0.8 0.5 1.2 Rugby union 149.5 27.1 165.9 0.9 0.2 1.0 Running 147.3 1,143.2 1,231.7 0.9 7.1 7.7 Sailing 106.5 61.1 147.6 0.7 0.4 0.9 Scuba diving 30.3 62.7 86.8 0.2 0.4 0.5 Shooting sports 47.4 34.5 76.0 0.3 0.2 0.5 Softball 53.3 *7.2 58.1 0.3 - 0.4 Squash/racquetball 116.5 129.0 234.1 0.7 0.8 1.5 Surf sports 40.6 403.0 415.0 0.3 2.5 2.6 Swimming 345.8 2,070.8 2,311.2 2.2 12.9 14.4 Table tennis 56.7 62.1 114.2 0.4 0.4 0.7 Tennis 547.5 792.5 1,253.3 3.4 5.0 7.8 Tenpin bowling 71.8 61.6 125.2 0.4 0.4 0.8 Touch football 299.8 86.7 367.2 1.9 0.5 2.3 Triathlons 37.3 *7.5 44.8 0.2 - 0.3 Volleyball 144.9 74.8 206.8 0.9 0.5 1.3 Walking (bush) 99.9 837.6 910.4 0.6 5.2 5.7 Walking (other) 192.5 5,875.3 5,973.6 1.2 36.7 37.3 Water polo *15.0 **1.5 *16.5 *0.1 - *0.1 Waterskiing/powerboating **4.5 138.5 143.0 - 0.9 0.9 Weight training 121.9 233.1 327.1 0.8 1.5 2.0 Yoga 323.5 257.7 541.1 2.0 1.6 3.4 (a) Includes persons who reported participating in both organised and non-organised activity(b) Components may not add to totals as persons may report both organised and non-organised activity
* Estimate has a relative standard error of between 25% and 50% and should be used with caution** Estimate has a relative standard error greater than 50% and is considered too unreliable for general use
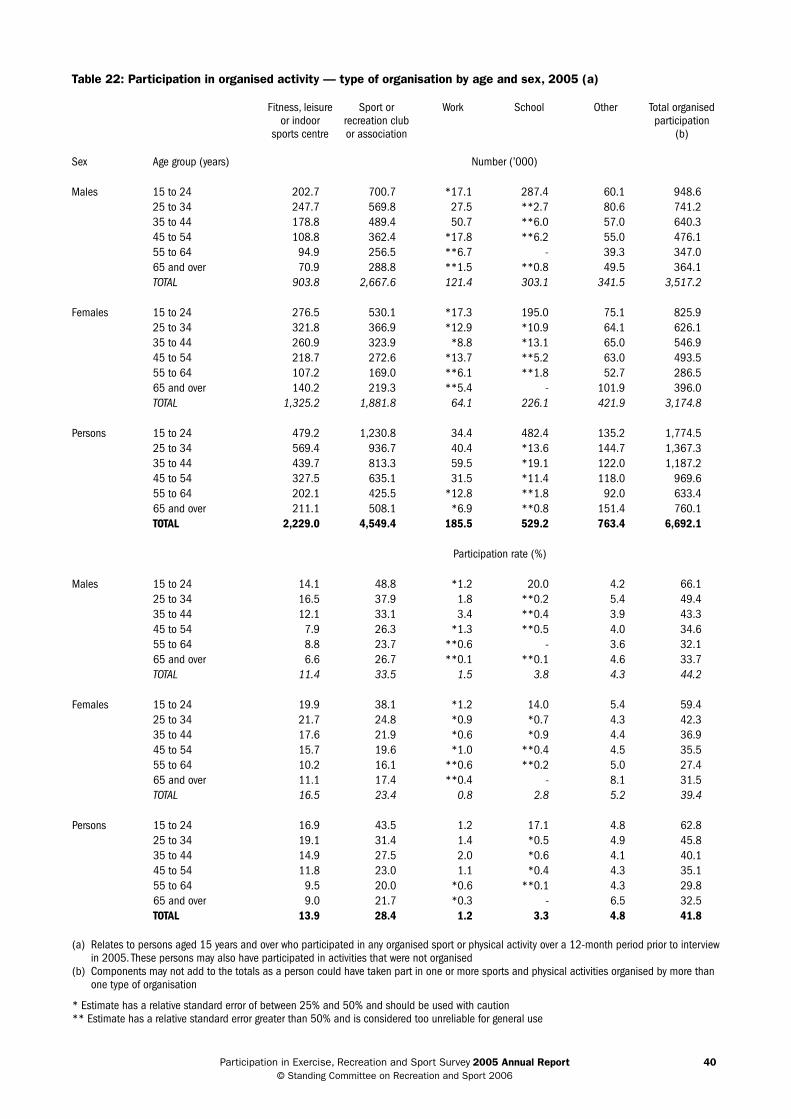
participation in exercise, recreation and sport survey 2005 Annual Report 40 © standing committee on recreation and sport 2006
Table 22: Participation in organised activity — type of organisation by age and sex, 2005 (a)
Fitness, leisure or indoor
sports centre
Sport or recreation club or association
Work School Other Total organised participation
(b)
Sex Age group (years) Number (’000)
Males 15 to 24 202.7 700.7 *17.1 287.4 60.1 948.6 25 to 34 247.7 569.8 27.5 **2.7 80.6 741.2 35 to 44 178.8 489.4 50.7 **6.0 57.0 640.3 45 to 54 108.8 362.4 *17.8 **6.2 55.0 476.1 55 to 64 94.9 256.5 **6.7 - 39.3 347.0 65 and over 70.9 288.8 **1.5 **0.8 49.5 364.1 TOTAL 903.8 2,667.6 121.4 303.1 341.5 3,517.2
Females 15 to 24 276.5 530.1 *17.3 195.0 75.1 825.9 25 to 34 321.8 366.9 *12.9 *10.9 64.1 626.1 35 to 44 260.9 323.9 *8.8 *13.1 65.0 546.9 45 to 54 218.7 272.6 *13.7 **5.2 63.0 493.5 55 to 64 107.2 169.0 **6.1 **1.8 52.7 286.5 65 and over 140.2 219.3 **5.4 - 101.9 396.0 TOTAL 1,325.2 1,881.8 64.1 226.1 421.9 3,174.8
Persons 15 to 24 479.2 1,230.8 34.4 482.4 135.2 1,774.5 25 to 34 569.4 936.7 40.4 *13.6 144.7 1,367.3 35 to 44 439.7 813.3 59.5 *19.1 122.0 1,187.2 45 to 54 327.5 635.1 31.5 *11.4 118.0 969.6 55 to 64 202.1 425.5 *12.8 **1.8 92.0 633.4 65 and over 211.1 508.1 *6.9 **0.8 151.4 760.1 TOTAL 2,229.0 4,549.4 185.5 529.2 763.4 6,692.1
Participation rate (%)
Males 15 to 24 14.1 48.8 *1.2 20.0 4.2 66.125 to 34 16.5 37.9 1.8 **0.2 5.4 49.435 to 44 12.1 33.1 3.4 **0.4 3.9 43.345 to 54 7.9 26.3 *1.3 **0.5 4.0 34.655 to 64 8.8 23.7 **0.6 - 3.6 32.165 and over 6.6 26.7 **0.1 **0.1 4.6 33.7TOTAL 11.4 33.5 1.5 3.8 4.3 44.2
Females 15 to 24 19.9 38.1 *1.2 14.0 5.4 59.425 to 34 21.7 24.8 *0.9 *0.7 4.3 42.335 to 44 17.6 21.9 *0.6 *0.9 4.4 36.945 to 54 15.7 19.6 *1.0 **0.4 4.5 35.555 to 64 10.2 16.1 **0.6 **0.2 5.0 27.465 and over 11.1 17.4 **0.4 - 8.1 31.5TOTAL 16.5 23.4 0.8 2.8 5.2 39.4
Persons 15 to 24 16.9 43.5 1.2 17.1 4.8 62.825 to 34 19.1 31.4 1.4 *0.5 4.9 45.835 to 44 14.9 27.5 2.0 *0.6 4.1 40.145 to 54 11.8 23.0 1.1 *0.4 4.3 35.155 to 64 9.5 20.0 *0.6 **0.1 4.3 29.865 and over 9.0 21.7 *0.3 - 6.5 32.5TOTAL 13.9 28.4 1.2 3.3 4.8 41.8
(a) Relates to persons aged 15 years and over who participated in any organised sport or physical activity over a 12-month period prior to interview in 2005. These persons may also have participated in activities that were not organised
(b) Components may not add to the totals as a person could have taken part in one or more sports and physical activities organised by more than one type of organisation
* Estimate has a relative standard error of between 25% and 50% and should be used with caution ** Estimate has a relative standard error greater than 50% and is considered too unreliable for general use
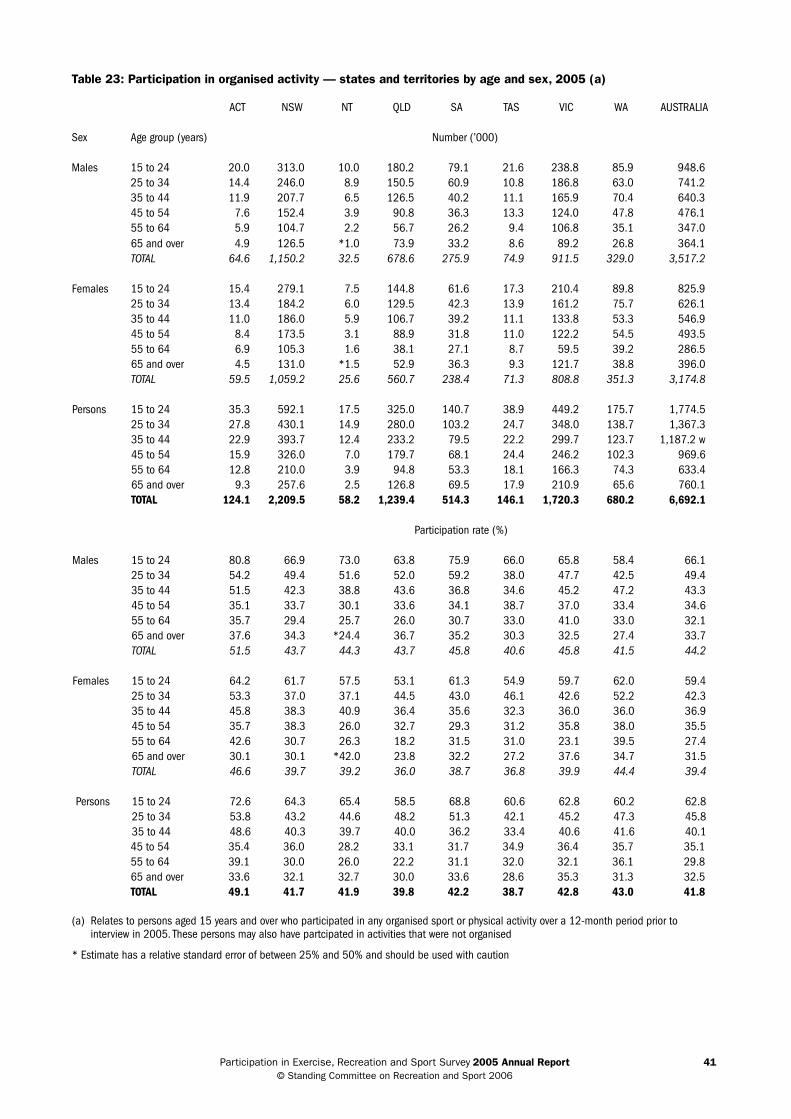
participation in exercise, recreation and sport survey 2005 Annual Report 41 © standing committee on recreation and sport 2006
Table 23: Participation in organised activity — states and territories by age and sex, 2005 (a)
ACT NSW NT QLD SA TAS VIC WA AUSTRALIA
Sex Age group (years) Number (’000)
Males 15 to 24 20.0 313.0 10.0 180.2 79.1 21.6 238.8 85.9 948.6 25 to 34 14.4 246.0 8.9 150.5 60.9 10.8 186.8 63.0 741.2 35 to 44 11.9 207.7 6.5 126.5 40.2 11.1 165.9 70.4 640.3 45 to 54 7.6 152.4 3.9 90.8 36.3 13.3 124.0 47.8 476.1 55 to 64 5.9 104.7 2.2 56.7 26.2 9.4 106.8 35.1 347.0 65 and over 4.9 126.5 *1.0 73.9 33.2 8.6 89.2 26.8 364.1 TOTAL 64.6 1,150.2 32.5 678.6 275.9 74.9 911.5 329.0 3,517.2
Females 15 to 24 15.4 279.1 7.5 144.8 61.6 17.3 210.4 89.8 825.9 25 to 34 13.4 184.2 6.0 129.5 42.3 13.9 161.2 75.7 626.1 35 to 44 11.0 186.0 5.9 106.7 39.2 11.1 133.8 53.3 546.9 45 to 54 8.4 173.5 3.1 88.9 31.8 11.0 122.2 54.5 493.5 55 to 64 6.9 105.3 1.6 38.1 27.1 8.7 59.5 39.2 286.5 65 and over 4.5 131.0 *1.5 52.9 36.3 9.3 121.7 38.8 396.0 TOTAL 59.5 1,059.2 25.6 560.7 238.4 71.3 808.8 351.3 3,174.8
Persons 15 to 24 35.3 592.1 17.5 325.0 140.7 38.9 449.2 175.7 1,774.5 25 to 34 27.8 430.1 14.9 280.0 103.2 24.7 348.0 138.7 1,367.3 35 to 44 22.9 393.7 12.4 233.2 79.5 22.2 299.7 123.7 1,187.2 w45 to 54 15.9 326.0 7.0 179.7 68.1 24.4 246.2 102.3 969.6 55 to 64 12.8 210.0 3.9 94.8 53.3 18.1 166.3 74.3 633.4 65 and over 9.3 257.6 2.5 126.8 69.5 17.9 210.9 65.6 760.1 TOTAL 124.1 2,209.5 58.2 1,239.4 514.3 146.1 1,720.3 680.2 6,692.1
Participation rate (%)
Males 15 to 24 80.8 66.9 73.0 63.8 75.9 66.0 65.8 58.4 66.125 to 34 54.2 49.4 51.6 52.0 59.2 38.0 47.7 42.5 49.435 to 44 51.5 42.3 38.8 43.6 36.8 34.6 45.2 47.2 43.345 to 54 35.1 33.7 30.1 33.6 34.1 38.7 37.0 33.4 34.655 to 64 35.7 29.4 25.7 26.0 30.7 33.0 41.0 33.0 32.165 and over 37.6 34.3 *24.4 36.7 35.2 30.3 32.5 27.4 33.7TOTAL 51.5 43.7 44.3 43.7 45.8 40.6 45.8 41.5 44.2
Females 15 to 24 64.2 61.7 57.5 53.1 61.3 54.9 59.7 62.0 59.425 to 34 53.3 37.0 37.1 44.5 43.0 46.1 42.6 52.2 42.335 to 44 45.8 38.3 40.9 36.4 35.6 32.3 36.0 36.0 36.945 to 54 35.7 38.3 26.0 32.7 29.3 31.2 35.8 38.0 35.555 to 64 42.6 30.7 26.3 18.2 31.5 31.0 23.1 39.5 27.465 and over 30.1 30.1 *42.0 23.8 32.2 27.2 37.6 34.7 31.5TOTAL 46.6 39.7 39.2 36.0 38.7 36.8 39.9 44.4 39.4
Persons 15 to 24 72.6 64.3 65.4 58.5 68.8 60.6 62.8 60.2 62.825 to 34 53.8 43.2 44.6 48.2 51.3 42.1 45.2 47.3 45.835 to 44 48.6 40.3 39.7 40.0 36.2 33.4 40.6 41.6 40.145 to 54 35.4 36.0 28.2 33.1 31.7 34.9 36.4 35.7 35.155 to 64 39.1 30.0 26.0 22.2 31.1 32.0 32.1 36.1 29.865 and over 33.6 32.1 32.7 30.0 33.6 28.6 35.3 31.3 32.5TOTAL 49.1 41.7 41.9 39.8 42.2 38.7 42.8 43.0 41.8
(a) Relates to persons aged 15 years and over who participated in any organised sport or physical activity over a 12-month period prior to interview in 2005. These persons may also have partcipated in activities that were not organised
* Estimate has a relative standard error of between 25% and 50% and should be used with caution

participation in exercise, recreation and sport survey 2005 Annual Report 42 © standing committee on recreation and sport 2006
Table 24: All persons aged 15 years and over — frequency of participation, Australian Capital Territory, 2005
None
Zero – once per week
(a)
Once or twice per week
(b)
Three or four times per week
(c)
Five or more times per week Total
Sex Age group (years) Number (’000)
Males 15 to 24 **0.5 3.8 6.4 4.5 9.5 24.725 to 34 2.8 2.8 9.7 6.1 5.1 26.535 to 44 *2.0 3.9 6.0 5.3 5.9 23.145 to 54 2.6 2.6 6.6 4.1 5.6 21.555 to 64 *1.9 *1.2 3.2 4.2 6.1 16.565 and over 2.4 *0.9 3.6 *1.4 4.5 12.9TOTAL 12.2 15.3 35.6 25.6 36.7 125.3
Females 15 to 24 2.6 *2.0 6.1 7.5 5.7 23.925 to 34 2.8 3.3 6.9 5.6 6.5 25.135 to 44 2.3 *1.9 6.2 6.4 7.2 23.945 to 54 2.6 2.8 6.1 4.0 7.8 23.455 to 64 *1.0 2.1 4.5 4.0 4.5 16.365 and over 4.2 *1.3 3.3 2.7 3.4 14.9TOTAL 15.7 13.4 33.3 30.2 35.1 127.6
Persons 15 to 24 3.1 5.8 12.6 12.0 15.2 48.725 to 34 5.6 6.1 16.7 11.7 11.5 51.735 to 44 4.3 5.8 12.3 11.7 13.0 47.145 to 54 5.3 5.4 12.7 8.2 13.4 45.055 to 64 2.9 3.3 7.7 8.3 10.6 32.865 and over 6.7 2.2 6.9 4.0 7.9 27.8TOTAL 27.8 28.7 68.9 55.8 71.7 253.0
Proportion of each demographic group within each category (row %)
Males 15 to 24 **1.9 15.4 26.0 18.3 38.5 100.025 to 34 10.7 10.7 36.6 22.9 19.1 100.035 to 44 *8.5 16.9 26.2 23.1 25.4 100.045 to 54 12.2 12.2 30.5 19.1 26.0 100.055 to 64 *11.2 *7.1 19.4 25.5 36.7 100.065 and over 18.8 *7.1 28.2 *10.6 35.3 100.0TOTAL 9.7 12.2 28.4 20.4 29.2 100.0
Females 15 to 24 11.0 *8.3 25.7 31.2 23.9 100.025 to 34 11.2 13.2 27.6 22.4 25.7 100.035 to 44 9.6 *7.9 26.0 26.6 29.9 100.045 to 54 11.3 11.9 26.2 17.3 33.3 100.055 to 64 *6.2 13.2 27.9 24.8 27.9 100.065 and over 28.5 *8.9 22.0 17.9 22.8 100.0TOTAL 12.3 10.5 26.1 23.7 27.5 100.0
Persons 15 to 24 6.4 11.9 25.8 24.6 31.3 100.025 to 34 10.9 11.9 32.3 22.6 22.3 100.035 to 44 9.0 12.3 26.1 24.8 27.7 100.045 to 54 11.7 12.1 28.3 18.1 29.8 100.055 to 64 8.7 10.1 23.6 25.2 32.4 100.065 and over 24.0 8.1 24.9 14.5 28.6 100.0TOTAL 11.0 11.4 27.2 22.1 28.4 100.0
(a) More than zero and less than once per week (b) Once or more and less than three times per week (c) Three or more times and less than five times per week
* Estimate has a relative standard error of between 25% and 50% and should be used with caution ** Estimate has a relative standard error greater than 50% and is considered too unreliable for general use
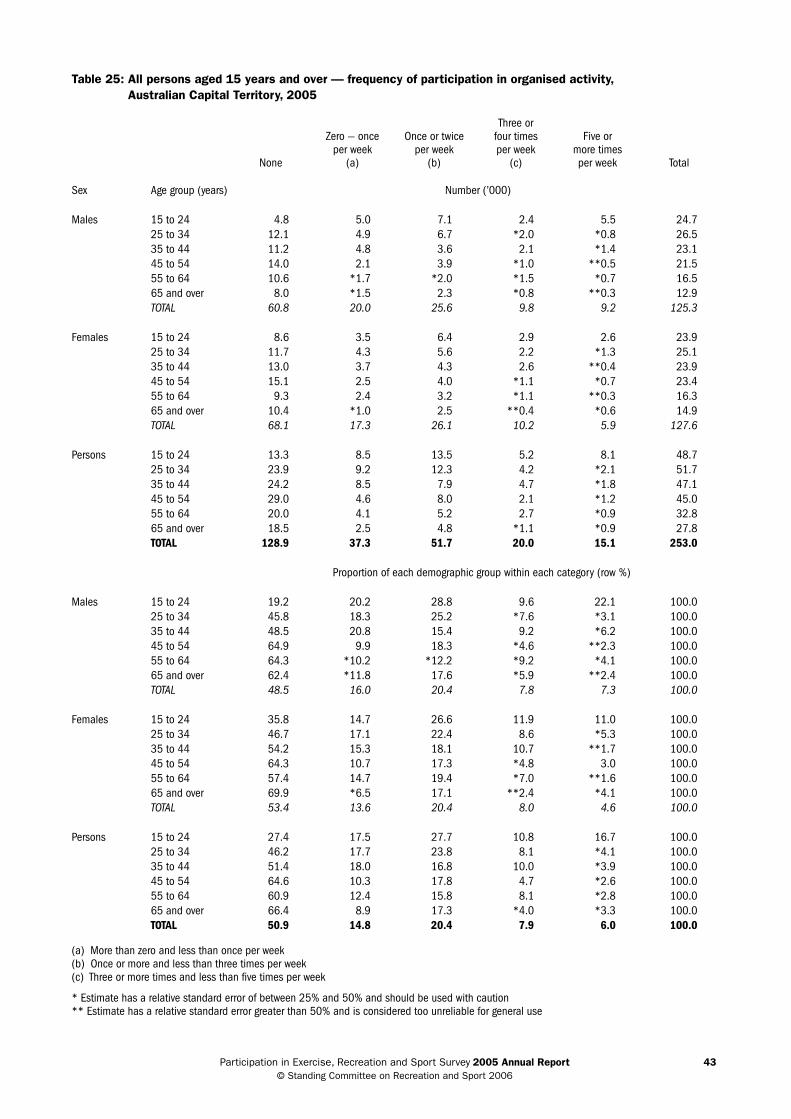
participation in exercise, recreation and sport survey 2005 Annual Report 43 © standing committee on recreation and sport 2006
Table 25: All persons aged 15 years and over — frequency of participation in organised activity, Australian Capital Territory, 2005
None
Zero — once per week
(a)
Once or twice per week
(b)
Three or four times per week
(c)
Five or more times per week Total
Sex Age group (years) Number (’000)
Males 15 to 24 4.8 5.0 7.1 2.4 5.5 24.725 to 34 12.1 4.9 6.7 *2.0 *0.8 26.535 to 44 11.2 4.8 3.6 2.1 *1.4 23.145 to 54 14.0 2.1 3.9 *1.0 **0.5 21.555 to 64 10.6 *1.7 *2.0 *1.5 *0.7 16.565 and over 8.0 *1.5 2.3 *0.8 **0.3 12.9TOTAL 60.8 20.0 25.6 9.8 9.2 125.3
Females 15 to 24 8.6 3.5 6.4 2.9 2.6 23.925 to 34 11.7 4.3 5.6 2.2 *1.3 25.135 to 44 13.0 3.7 4.3 2.6 **0.4 23.945 to 54 15.1 2.5 4.0 *1.1 *0.7 23.455 to 64 9.3 2.4 3.2 *1.1 **0.3 16.365 and over 10.4 *1.0 2.5 **0.4 *0.6 14.9TOTAL 68.1 17.3 26.1 10.2 5.9 127.6
Persons 15 to 24 13.3 8.5 13.5 5.2 8.1 48.725 to 34 23.9 9.2 12.3 4.2 *2.1 51.735 to 44 24.2 8.5 7.9 4.7 *1.8 47.145 to 54 29.0 4.6 8.0 2.1 *1.2 45.055 to 64 20.0 4.1 5.2 2.7 *0.9 32.865 and over 18.5 2.5 4.8 *1.1 *0.9 27.8TOTAL 128.9 37.3 51.7 20.0 15.1 253.0
Proportion of each demographic group within each category (row %)
Males 15 to 24 19.2 20.2 28.8 9.6 22.1 100.025 to 34 45.8 18.3 25.2 *7.6 *3.1 100.035 to 44 48.5 20.8 15.4 9.2 *6.2 100.045 to 54 64.9 9.9 18.3 *4.6 **2.3 100.055 to 64 64.3 *10.2 *12.2 *9.2 *4.1 100.065 and over 62.4 *11.8 17.6 *5.9 **2.4 100.0TOTAL 48.5 16.0 20.4 7.8 7.3 100.0
Females 15 to 24 35.8 14.7 26.6 11.9 11.0 100.025 to 34 46.7 17.1 22.4 8.6 *5.3 100.035 to 44 54.2 15.3 18.1 10.7 **1.7 100.045 to 54 64.3 10.7 17.3 *4.8 3.0 100.055 to 64 57.4 14.7 19.4 *7.0 **1.6 100.065 and over 69.9 *6.5 17.1 **2.4 *4.1 100.0TOTAL 53.4 13.6 20.4 8.0 4.6 100.0
Persons 15 to 24 27.4 17.5 27.7 10.8 16.7 100.025 to 34 46.2 17.7 23.8 8.1 *4.1 100.035 to 44 51.4 18.0 16.8 10.0 *3.9 100.045 to 54 64.6 10.3 17.8 4.7 *2.6 100.055 to 64 60.9 12.4 15.8 8.1 *2.8 100.065 and over 66.4 8.9 17.3 *4.0 *3.3 100.0TOTAL 50.9 14.8 20.4 7.9 6.0 100.0
(a) More than zero and less than once per week (b) Once or more and less than three times per week (c) Three or more times and less than five times per week
* Estimate has a relative standard error of between 25% and 50% and should be used with caution ** Estimate has a relative standard error greater than 50% and is considered too unreliable for general use
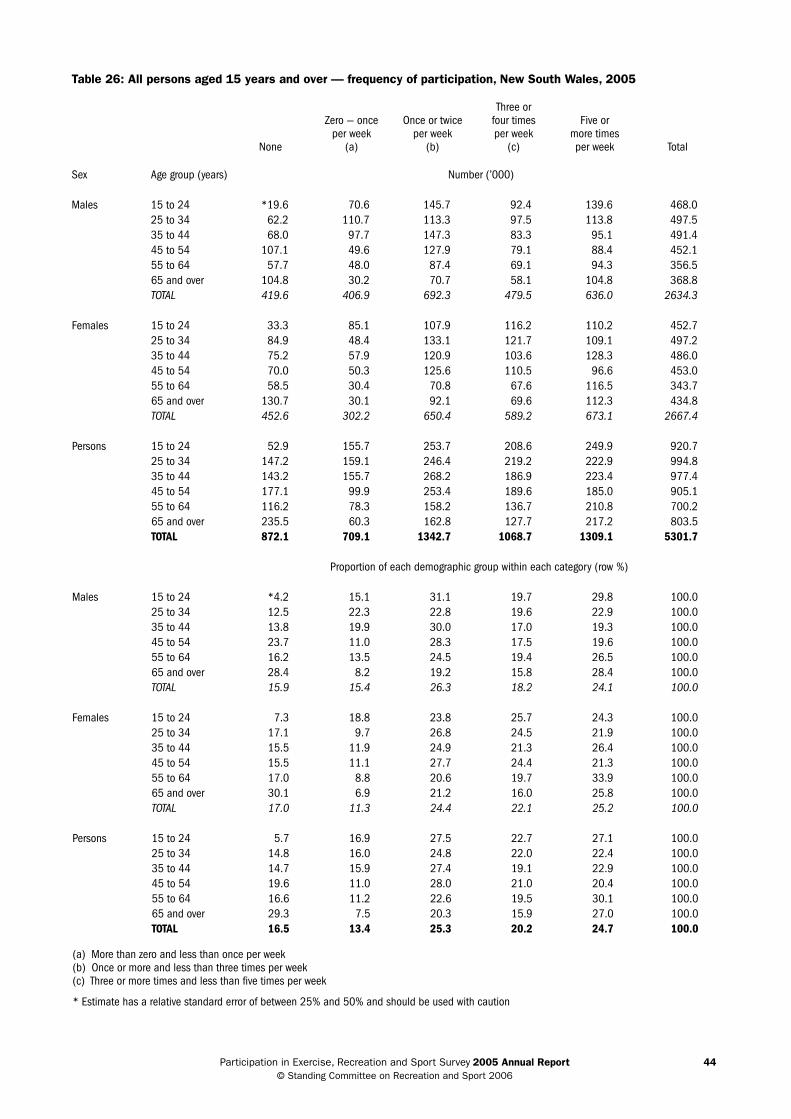
participation in exercise, recreation and sport survey 2005 Annual Report 44 © standing committee on recreation and sport 2006
Table 26: All persons aged 15 years and over — frequency of participation, New South Wales, 2005
None
Zero — once per week
(a)
Once or twice per week
(b)
Three or four times per week
(c)
Five or more times per week Total
Sex Age group (years) Number (’000)
Males 15 to 24 *19.6 70.6 145.7 92.4 139.6 468.025 to 34 62.2 110.7 113.3 97.5 113.8 497.535 to 44 68.0 97.7 147.3 83.3 95.1 491.445 to 54 107.1 49.6 127.9 79.1 88.4 452.155 to 64 57.7 48.0 87.4 69.1 94.3 356.565 and over 104.8 30.2 70.7 58.1 104.8 368.8TOTAL 419.6 406.9 692.3 479.5 636.0 2634.3
Females 15 to 24 33.3 85.1 107.9 116.2 110.2 452.725 to 34 84.9 48.4 133.1 121.7 109.1 497.235 to 44 75.2 57.9 120.9 103.6 128.3 486.045 to 54 70.0 50.3 125.6 110.5 96.6 453.055 to 64 58.5 30.4 70.8 67.6 116.5 343.765 and over 130.7 30.1 92.1 69.6 112.3 434.8TOTAL 452.6 302.2 650.4 589.2 673.1 2667.4
Persons 15 to 24 52.9 155.7 253.7 208.6 249.9 920.725 to 34 147.2 159.1 246.4 219.2 222.9 994.835 to 44 143.2 155.7 268.2 186.9 223.4 977.445 to 54 177.1 99.9 253.4 189.6 185.0 905.155 to 64 116.2 78.3 158.2 136.7 210.8 700.265 and over 235.5 60.3 162.8 127.7 217.2 803.5TOTAL 872.1 709.1 1342.7 1068.7 1309.1 5301.7
Proportion of each demographic group within each category (row %)
Males 15 to 24 *4.2 15.1 31.1 19.7 29.8 100.025 to 34 12.5 22.3 22.8 19.6 22.9 100.035 to 44 13.8 19.9 30.0 17.0 19.3 100.045 to 54 23.7 11.0 28.3 17.5 19.6 100.055 to 64 16.2 13.5 24.5 19.4 26.5 100.065 and over 28.4 8.2 19.2 15.8 28.4 100.0TOTAL 15.9 15.4 26.3 18.2 24.1 100.0
Females 15 to 24 7.3 18.8 23.8 25.7 24.3 100.025 to 34 17.1 9.7 26.8 24.5 21.9 100.035 to 44 15.5 11.9 24.9 21.3 26.4 100.045 to 54 15.5 11.1 27.7 24.4 21.3 100.055 to 64 17.0 8.8 20.6 19.7 33.9 100.065 and over 30.1 6.9 21.2 16.0 25.8 100.0TOTAL 17.0 11.3 24.4 22.1 25.2 100.0
Persons 15 to 24 5.7 16.9 27.5 22.7 27.1 100.025 to 34 14.8 16.0 24.8 22.0 22.4 100.035 to 44 14.7 15.9 27.4 19.1 22.9 100.045 to 54 19.6 11.0 28.0 21.0 20.4 100.055 to 64 16.6 11.2 22.6 19.5 30.1 100.065 and over 29.3 7.5 20.3 15.9 27.0 100.0TOTAL 16.5 13.4 25.3 20.2 24.7 100.0
(a) More than zero and less than once per week (b) Once or more and less than three times per week (c) Three or more times and less than five times per week
* Estimate has a relative standard error of between 25% and 50% and should be used with caution
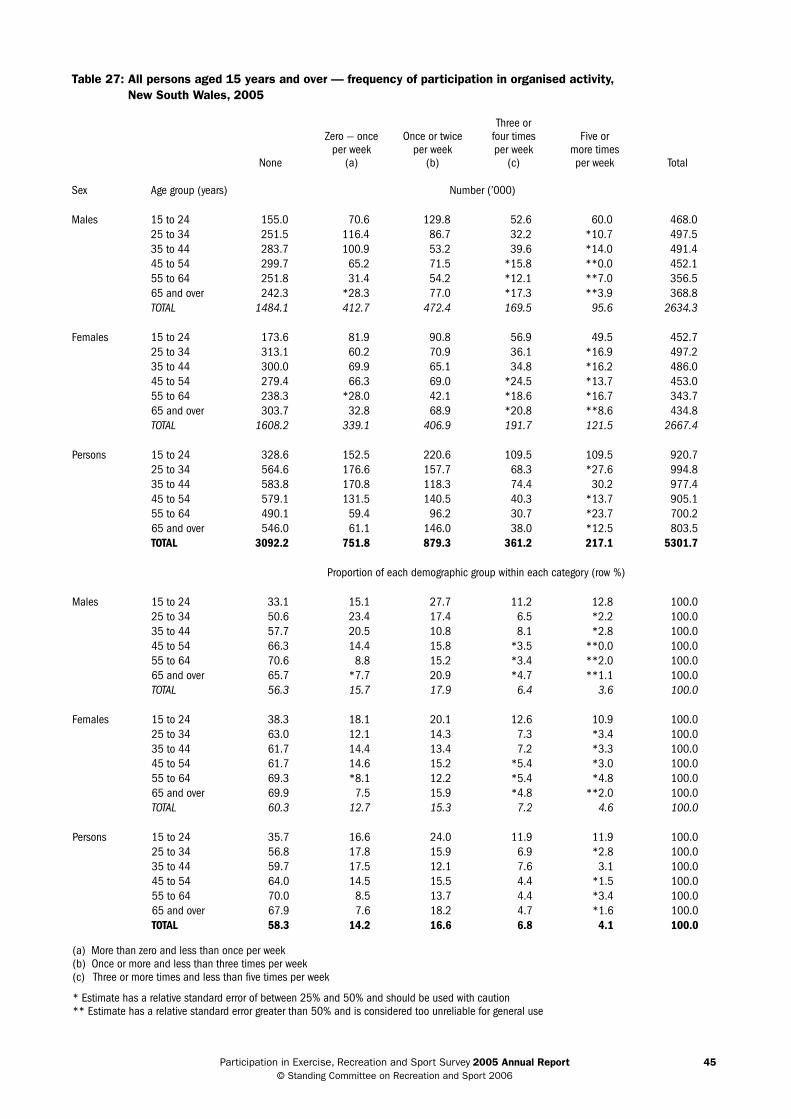
participation in exercise, recreation and sport survey 2005 Annual Report 45 © standing committee on recreation and sport 2006
Table 27: All persons aged 15 years and over — frequency of participation in organised activity, New South Wales, 2005
None
Zero — once per week
(a)
Once or twice per week
(b)
Three or four times per week
(c)
Five or more times per week Total
Sex Age group (years) Number (’000)
Males 15 to 24 155.0 70.6 129.8 52.6 60.0 468.025 to 34 251.5 116.4 86.7 32.2 *10.7 497.535 to 44 283.7 100.9 53.2 39.6 *14.0 491.445 to 54 299.7 65.2 71.5 *15.8 **0.0 452.155 to 64 251.8 31.4 54.2 *12.1 **7.0 356.565 and over 242.3 *28.3 77.0 *17.3 **3.9 368.8TOTAL 1484.1 412.7 472.4 169.5 95.6 2634.3
Females 15 to 24 173.6 81.9 90.8 56.9 49.5 452.725 to 34 313.1 60.2 70.9 36.1 *16.9 497.235 to 44 300.0 69.9 65.1 34.8 *16.2 486.045 to 54 279.4 66.3 69.0 *24.5 *13.7 453.055 to 64 238.3 *28.0 42.1 *18.6 *16.7 343.765 and over 303.7 32.8 68.9 *20.8 **8.6 434.8TOTAL 1608.2 339.1 406.9 191.7 121.5 2667.4
Persons 15 to 24 328.6 152.5 220.6 109.5 109.5 920.725 to 34 564.6 176.6 157.7 68.3 *27.6 994.835 to 44 583.8 170.8 118.3 74.4 30.2 977.445 to 54 579.1 131.5 140.5 40.3 *13.7 905.155 to 64 490.1 59.4 96.2 30.7 *23.7 700.265 and over 546.0 61.1 146.0 38.0 *12.5 803.5TOTAL 3092.2 751.8 879.3 361.2 217.1 5301.7
Proportion of each demographic group within each category (row %)
Males 15 to 24 33.1 15.1 27.7 11.2 12.8 100.025 to 34 50.6 23.4 17.4 6.5 *2.2 100.035 to 44 57.7 20.5 10.8 8.1 *2.8 100.045 to 54 66.3 14.4 15.8 *3.5 **0.0 100.055 to 64 70.6 8.8 15.2 *3.4 **2.0 100.065 and over 65.7 *7.7 20.9 *4.7 **1.1 100.0TOTAL 56.3 15.7 17.9 6.4 3.6 100.0
Females 15 to 24 38.3 18.1 20.1 12.6 10.9 100.025 to 34 63.0 12.1 14.3 7.3 *3.4 100.035 to 44 61.7 14.4 13.4 7.2 *3.3 100.045 to 54 61.7 14.6 15.2 *5.4 *3.0 100.055 to 64 69.3 *8.1 12.2 *5.4 *4.8 100.065 and over 69.9 7.5 15.9 *4.8 **2.0 100.0TOTAL 60.3 12.7 15.3 7.2 4.6 100.0
Persons 15 to 24 35.7 16.6 24.0 11.9 11.9 100.025 to 34 56.8 17.8 15.9 6.9 *2.8 100.035 to 44 59.7 17.5 12.1 7.6 3.1 100.045 to 54 64.0 14.5 15.5 4.4 *1.5 100.055 to 64 70.0 8.5 13.7 4.4 *3.4 100.065 and over 67.9 7.6 18.2 4.7 *1.6 100.0TOTAL 58.3 14.2 16.6 6.8 4.1 100.0
(a) More than zero and less than once per week (b) Once or more and less than three times per week (c) Three or more times and less than five times per week
* Estimate has a relative standard error of between 25% and 50% and should be used with caution ** Estimate has a relative standard error greater than 50% and is considered too unreliable for general use

participation in exercise, recreation and sport survey 2005 Annual Report 46 © standing committee on recreation and sport 2006
Table 28: All persons aged 15 years and over — frequency of participation, Northern Territory, 2005
None
Zero — once per week
(a)
Once or twice per week
(b)
Three or four times per week
(c)
Five or more times per week Total
Sex Age group (years) Number (’000)
Males 15 to 24 2.0 1.8 3.5 3.1 3.2 13.725 to 34 1.7 3.6 4.0 3.8 4.1 17.335 to 44 2.6 2.8 3.7 2.6 5.1 16.945 to 54 3.3 2.4 1.7 2.3 3.2 13.055 to 64 2.3 *0.8 *1.1 *0.8 3.7 8.765 and over 1.6 **0.3 *0.9 *0.4 *0.8 4.1TOTAL 13.7 11.7 15.0 12.9 20.1 73.5
Females 15 to 24 *1.1 2.0 3.3 1.8 4.8 13.125 to 34 1.7 *1.3 3.6 2.9 6.6 16.135 to 44 2.2 *1.2 3.8 2.9 4.3 14.445 to 54 2.4 *1.4 2.6 *1.5 4.0 11.955 to 64 1.7 **0.5 *1.0 *0.9 2.1 6.365 and over *0.7 *0.6 **0.4 *1.0 *0.8 3.6TOTAL 9.9 7.1 14.7 11.0 22.7 65.3
Persons 15 to 24 3.2 3.8 6.8 4.9 8.0 26.725 to 34 3.4 4.9 7.7 6.7 10.7 33.435 to 44 4.8 4.0 7.5 5.5 9.4 31.245 to 54 5.7 3.8 4.3 3.8 7.3 24.955 to 64 4.1 *1.3 2.1 *1.7 5.8 14.965 and over 2.4 *0.9 *1.4 *1.4 1.6 7.7TOTAL 23.5 18.8 29.8 23.9 42.8 138.8
Proportion of each demographic group within each category (row %)
Males 15 to 24 14.7 13.4 25.8 22.5 23.6 100.025 to 34 10.0 20.8 23.3 22.2 23.9 100.035 to 44 15.7 16.6 22.1 15.2 30.3 100.045 to 54 25.6 18.7 13.1 17.7 24.9 100.055 to 64 26.9 *9.1 *12.8 *8.9 42.3 100.065 and over 40.5 **7.1 *23.2 *10.1 *19.1 100.0TOTAL 18.6 16.0 20.4 17.6 27.4 100.0
Females 15 to 24 *8.8 15.3 25.1 14.1 36.7 100.025 to 34 10.7 *8.0 22.6 17.8 40.8 100.035 to 44 15.0 *8.6 26.3 20.2 29.9 100.045 to 54 19.9 *11.8 21.8 *12.5 34.0 100.055 to 64 27.6 **7.8 *16.4 *14.2 34.1 100.065 and over *20.4 *17.8 **12.1 *26.9 *22.8 100.0TOTAL 15.1 10.8 22.6 16.8 34.7 100.0
Persons 15 to 24 11.8 14.4 25.4 18.4 30.0 100.025 to 34 10.3 14.6 22.9 20.1 32.0 100.035 to 44 15.4 12.9 24.0 17.5 30.1 100.045 to 54 22.8 15.4 17.3 15.2 29.2 100.055 to 64 27.2 *8.5 14.3 *11.1 38.9 100.065 and over 31.0 *12.2 *18.0 *18.1 20.8 100.0TOTAL 17.0 13.5 21.4 17.2 30.8 100.0
(a) More than zero and less than once per week (b) Once or more and less than three times per week (c) Three or more times and less than five times per week
* Estimate has a relative standard error of between 25% and 50% and should be used with caution ** Estimate has a relative standard error greater than 50% and is considered too unreliable for general use
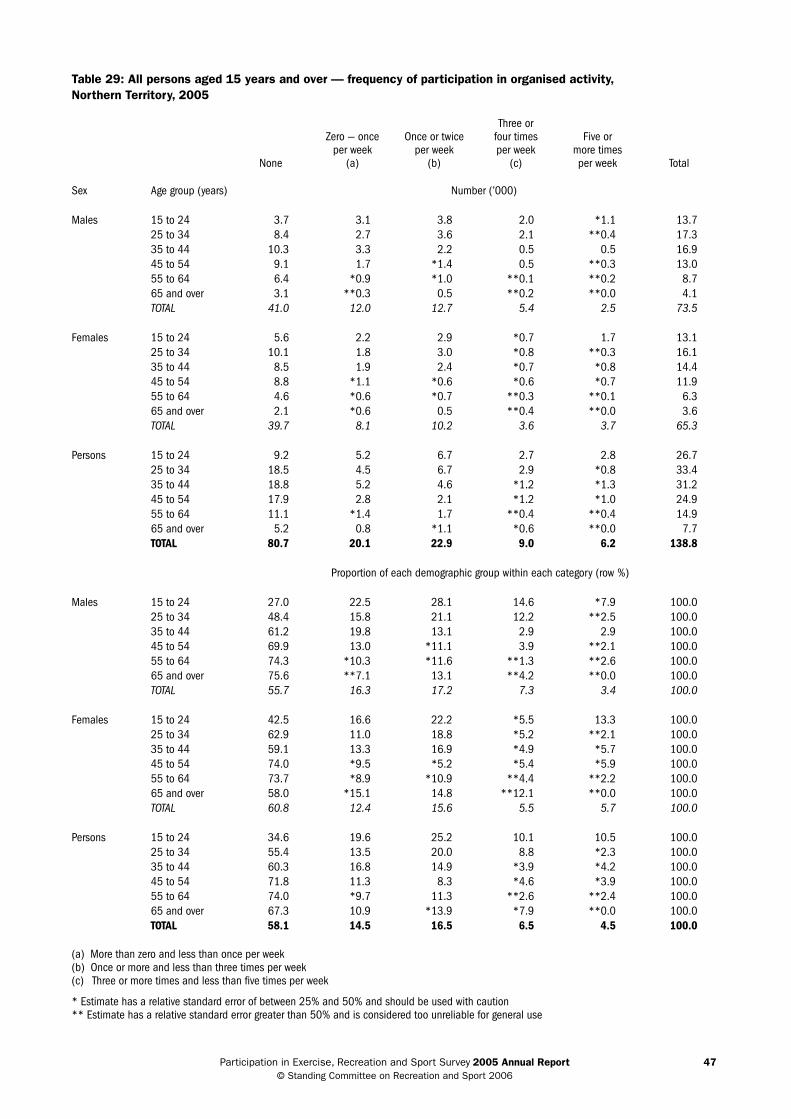
participation in exercise, recreation and sport survey 2005 Annual Report 47 © standing committee on recreation and sport 2006
Table 29: All persons aged 15 years and over — frequency of participation in organised activity, Northern Territory, 2005
None
Zero — once per week
(a)
Once or twice per week
(b)
Three or four times per week
(c)
Five or more times per week Total
Sex Age group (years) Number (’000)
Males 15 to 24 3.7 3.1 3.8 2.0 *1.1 13.725 to 34 8.4 2.7 3.6 2.1 **0.4 17.335 to 44 10.3 3.3 2.2 0.5 0.5 16.945 to 54 9.1 1.7 *1.4 0.5 **0.3 13.055 to 64 6.4 *0.9 *1.0 **0.1 **0.2 8.765 and over 3.1 **0.3 0.5 **0.2 **0.0 4.1TOTAL 41.0 12.0 12.7 5.4 2.5 73.5
Females 15 to 24 5.6 2.2 2.9 *0.7 1.7 13.125 to 34 10.1 1.8 3.0 *0.8 **0.3 16.135 to 44 8.5 1.9 2.4 *0.7 *0.8 14.445 to 54 8.8 *1.1 *0.6 *0.6 *0.7 11.955 to 64 4.6 *0.6 *0.7 **0.3 **0.1 6.365 and over 2.1 *0.6 0.5 **0.4 **0.0 3.6TOTAL 39.7 8.1 10.2 3.6 3.7 65.3
Persons 15 to 24 9.2 5.2 6.7 2.7 2.8 26.725 to 34 18.5 4.5 6.7 2.9 *0.8 33.435 to 44 18.8 5.2 4.6 *1.2 *1.3 31.245 to 54 17.9 2.8 2.1 *1.2 *1.0 24.955 to 64 11.1 *1.4 1.7 **0.4 **0.4 14.965 and over 5.2 0.8 *1.1 *0.6 **0.0 7.7TOTAL 80.7 20.1 22.9 9.0 6.2 138.8
Proportion of each demographic group within each category (row %)
Males 15 to 24 27.0 22.5 28.1 14.6 *7.9 100.025 to 34 48.4 15.8 21.1 12.2 **2.5 100.035 to 44 61.2 19.8 13.1 2.9 2.9 100.045 to 54 69.9 13.0 *11.1 3.9 **2.1 100.055 to 64 74.3 *10.3 *11.6 **1.3 **2.6 100.065 and over 75.6 **7.1 13.1 **4.2 **0.0 100.0TOTAL 55.7 16.3 17.2 7.3 3.4 100.0
Females 15 to 24 42.5 16.6 22.2 *5.5 13.3 100.025 to 34 62.9 11.0 18.8 *5.2 **2.1 100.035 to 44 59.1 13.3 16.9 *4.9 *5.7 100.045 to 54 74.0 *9.5 *5.2 *5.4 *5.9 100.055 to 64 73.7 *8.9 *10.9 **4.4 **2.2 100.065 and over 58.0 *15.1 14.8 **12.1 **0.0 100.0TOTAL 60.8 12.4 15.6 5.5 5.7 100.0
Persons 15 to 24 34.6 19.6 25.2 10.1 10.5 100.025 to 34 55.4 13.5 20.0 8.8 *2.3 100.035 to 44 60.3 16.8 14.9 *3.9 *4.2 100.045 to 54 71.8 11.3 8.3 *4.6 *3.9 100.055 to 64 74.0 *9.7 11.3 **2.6 **2.4 100.065 and over 67.3 10.9 *13.9 *7.9 **0.0 100.0TOTAL 58.1 14.5 16.5 6.5 4.5 100.0
(a) More than zero and less than once per week (b) Once or more and less than three times per week (c) Three or more times and less than five times per week
* Estimate has a relative standard error of between 25% and 50% and should be used with caution ** Estimate has a relative standard error greater than 50% and is considered too unreliable for general use

participation in exercise, recreation and sport survey 2005 Annual Report 48 © standing committee on recreation and sport 2006
Table 30: All persons aged 15 years and over — frequency of participation, Queensland, 2005
None
Zero — once per week
(a)
Once or twice per week
(b)
Three or four times per week
(c)
Five or more times per week Total
Sex Age group (years) Number (’000)
Males 15 to 24 32.1 22.3 105.0 49.1 74.1 282.525 to 34 35.7 65.6 87.6 52.0 48.7 289.535 to 44 45.8 64.2 82.4 40.5 57.0 289.945 to 54 64.3 37.6 75.9 33.0 59.3 270.155 to 64 55.6 41.3 37.8 26.2 57.4 218.365 and over 45.1 29.0 40.4 24.4 62.6 201.4TOTAL 278.5 259.9 429.2 225.1 359.1 1551.8
Females 15 to 24 47.4 30.0 84.2 50.5 60.6 272.725 to 34 39.7 57.1 55.5 61.9 76.7 291.035 to 44 50.0 50.4 50.0 62.3 80.2 292.945 to 54 56.2 23.1 70.4 53.0 69.2 271.955 to 64 51.6 27.7 46.8 35.4 47.8 209.365 and over 71.2 *10.5 50.3 27.8 61.9 221.8TOTAL 316.1 198.9 357.3 290.9 396.4 1559.6
Persons 15 to 24 79.5 52.3 189.3 99.5 134.7 555.325 to 34 75.4 122.7 143.1 113.9 125.4 580.435 to 44 95.7 114.6 132.4 102.9 137.2 582.845 to 54 120.4 60.7 146.4 86.0 128.5 542.055 to 64 107.3 69.0 84.7 61.5 105.2 427.665 and over 116.2 39.6 90.7 52.2 124.5 423.2TOTAL 594.6 458.8 786.5 516.0 755.5 3111.4
Proportion of each demographic group within each category (row %)
Males 15 to 24 11.4 7.9 37.2 17.4 26.2 100.025 to 34 12.3 22.6 30.3 18.0 16.8 100.035 to 44 15.8 22.1 28.4 14.0 19.7 100.045 to 54 23.8 13.9 28.1 12.2 22.0 100.055 to 64 25.5 18.9 17.3 12.0 26.3 100.065 and over 22.4 14.4 20.0 12.1 31.1 100.0TOTAL 17.9 16.8 27.7 14.5 23.1 100.0
Females 15 to 24 17.4 11.0 30.9 18.5 22.2 100.025 to 34 13.7 19.6 19.1 21.3 26.4 100.035 to 44 17.1 17.2 17.1 21.3 27.4 100.045 to 54 20.7 8.5 25.9 19.5 25.4 100.055 to 64 24.7 13.2 22.4 16.9 22.8 100.065 and over 32.1 *4.7 22.7 12.6 27.9 100.0TOTAL 20.3 12.8 22.9 18.7 25.4 100.0
Persons 15 to 24 14.3 9.4 34.1 17.9 24.3 100.025 to 34 13.0 21.1 24.7 19.6 21.6 100.035 to 44 16.4 19.7 22.7 17.6 23.5 100.045 to 54 22.2 11.2 27.0 15.9 23.7 100.055 to 64 25.1 16.1 19.8 14.4 24.6 100.065 and over 27.5 9.4 21.4 12.3 29.4 100.0TOTAL 19.1 14.7 25.3 16.6 24.3 100.0
(a) More than zero and less than once per week (b) Once or more and less than three times per week (c) Three or more times and less than five times per week
* Estimate has a relative standard error of between 25% and 50% and should be used with caution
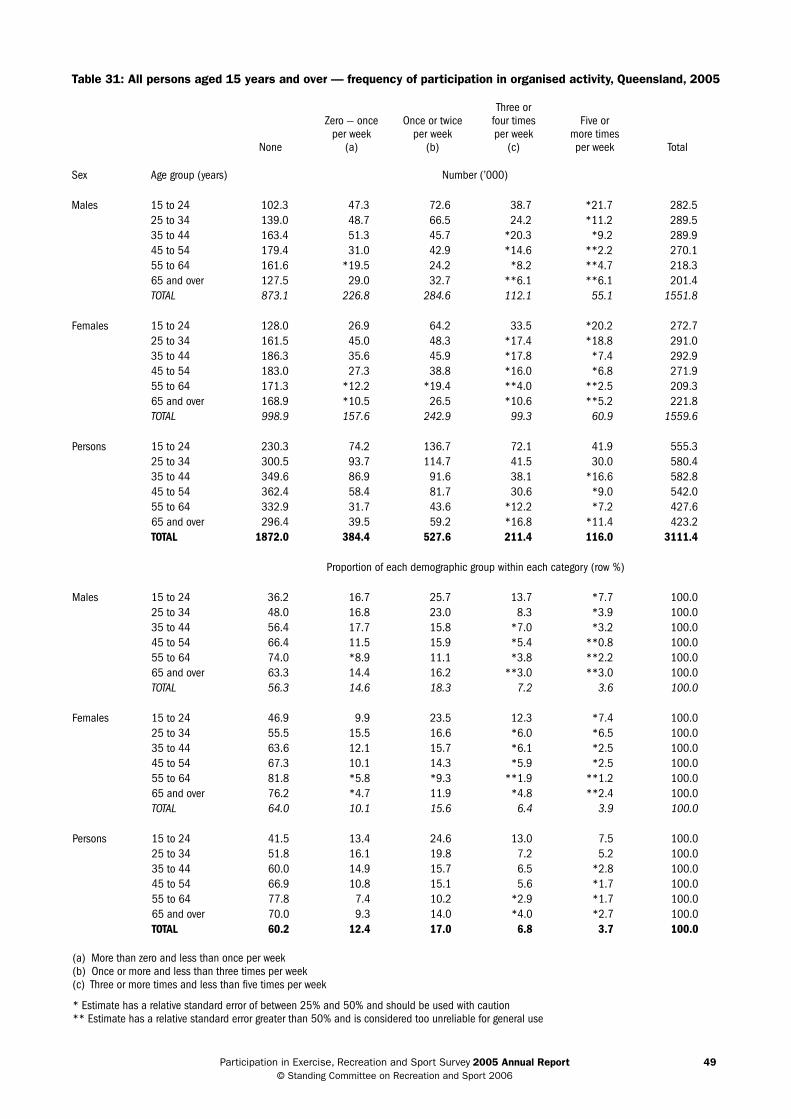
participation in exercise, recreation and sport survey 2005 Annual Report 49 © standing committee on recreation and sport 2006
Table 31: All persons aged 15 years and over — frequency of participation in organised activity, Queensland, 2005
None
Zero — once per week
(a)
Once or twice per week
(b)
Three or four times per week
(c)
Five or more times per week Total
Sex Age group (years) Number (’000)
Males 15 to 24 102.3 47.3 72.6 38.7 *21.7 282.525 to 34 139.0 48.7 66.5 24.2 *11.2 289.535 to 44 163.4 51.3 45.7 *20.3 *9.2 289.945 to 54 179.4 31.0 42.9 *14.6 **2.2 270.155 to 64 161.6 *19.5 24.2 *8.2 **4.7 218.365 and over 127.5 29.0 32.7 **6.1 **6.1 201.4TOTAL 873.1 226.8 284.6 112.1 55.1 1551.8
Females 15 to 24 128.0 26.9 64.2 33.5 *20.2 272.725 to 34 161.5 45.0 48.3 *17.4 *18.8 291.035 to 44 186.3 35.6 45.9 *17.8 *7.4 292.945 to 54 183.0 27.3 38.8 *16.0 *6.8 271.955 to 64 171.3 *12.2 *19.4 **4.0 **2.5 209.365 and over 168.9 *10.5 26.5 *10.6 **5.2 221.8TOTAL 998.9 157.6 242.9 99.3 60.9 1559.6
Persons 15 to 24 230.3 74.2 136.7 72.1 41.9 555.325 to 34 300.5 93.7 114.7 41.5 30.0 580.435 to 44 349.6 86.9 91.6 38.1 *16.6 582.845 to 54 362.4 58.4 81.7 30.6 *9.0 542.055 to 64 332.9 31.7 43.6 *12.2 *7.2 427.665 and over 296.4 39.5 59.2 *16.8 *11.4 423.2TOTAL 1872.0 384.4 527.6 211.4 116.0 3111.4
Proportion of each demographic group within each category (row %)
Males 15 to 24 36.2 16.7 25.7 13.7 *7.7 100.025 to 34 48.0 16.8 23.0 8.3 *3.9 100.035 to 44 56.4 17.7 15.8 *7.0 *3.2 100.045 to 54 66.4 11.5 15.9 *5.4 **0.8 100.055 to 64 74.0 *8.9 11.1 *3.8 **2.2 100.065 and over 63.3 14.4 16.2 **3.0 **3.0 100.0TOTAL 56.3 14.6 18.3 7.2 3.6 100.0
Females 15 to 24 46.9 9.9 23.5 12.3 *7.4 100.025 to 34 55.5 15.5 16.6 *6.0 *6.5 100.035 to 44 63.6 12.1 15.7 *6.1 *2.5 100.045 to 54 67.3 10.1 14.3 *5.9 *2.5 100.055 to 64 81.8 *5.8 *9.3 **1.9 **1.2 100.065 and over 76.2 *4.7 11.9 *4.8 **2.4 100.0TOTAL 64.0 10.1 15.6 6.4 3.9 100.0
Persons 15 to 24 41.5 13.4 24.6 13.0 7.5 100.025 to 34 51.8 16.1 19.8 7.2 5.2 100.035 to 44 60.0 14.9 15.7 6.5 *2.8 100.045 to 54 66.9 10.8 15.1 5.6 *1.7 100.055 to 64 77.8 7.4 10.2 *2.9 *1.7 100.065 and over 70.0 9.3 14.0 *4.0 *2.7 100.0TOTAL 60.2 12.4 17.0 6.8 3.7 100.0
(a) More than zero and less than once per week (b) Once or more and less than three times per week (c) Three or more times and less than five times per week
* Estimate has a relative standard error of between 25% and 50% and should be used with caution ** Estimate has a relative standard error greater than 50% and is considered too unreliable for general use

participation in exercise, recreation and sport survey 2005 Annual Report 50 © standing committee on recreation and sport 2006
Table 32: All persons aged 15 years and over — frequency of participation, South Australia, 2005
None
Zero — once per week
(a)
Once or twice per week
(b)
Three or four times per week
(c)
Five or more times per week Total
Sex Age group (years) Number (’000)
Males 15 to 24 *7.1 14.7 31.5 28.9 22.0 104.225 to 34 10.4 21.2 29.1 16.4 25.8 102.835 to 44 20.5 24.3 38.5 11.0 15.0 109.245 to 54 22.3 22.7 28.0 11.9 21.3 106.255 to 64 18.9 11.6 19.4 11.8 23.7 85.365 and over 24.9 10.0 22.5 15.6 21.2 94.2TOTAL 104.1 104.5 168.9 95.6 129.0 602.0
Females 15 to 24 *9.3 16.3 29.2 15.7 29.9 100.425 to 34 18.0 14.6 23.5 24.4 18.0 98.435 to 44 16.2 15.4 29.7 25.1 24.0 110.445 to 54 21.4 12.6 24.0 19.6 31.0 108.655 to 64 13.7 11.2 22.2 18.2 20.8 86.165 and over 29.5 11.5 25.6 17.9 28.3 112.9TOTAL 108.1 81.5 154.3 121.0 152.0 616.8
Persons 15 to 24 16.4 31.0 60.7 44.7 51.9 204.625 to 34 28.3 35.7 52.6 40.8 43.7 201.235 to 44 36.7 39.6 68.2 36.2 38.9 219.645 to 54 43.7 35.3 52.0 31.5 52.3 214.855 to 64 32.6 22.7 41.5 30.0 44.6 171.465 and over 54.4 21.6 48.2 33.5 49.5 207.1TOTAL 212.1 185.9 323.2 216.6 281.0 1218.8
Proportion of each demographic group within each category (row %)
Males 15 to 24 *6.8 14.1 30.2 27.7 21.1 100.025 to 34 10.1 20.6 28.3 16.0 25.1 100.035 to 44 18.8 22.2 35.2 10.1 13.7 100.045 to 54 21.0 21.4 26.3 11.2 20.1 100.055 to 64 22.1 13.6 22.7 13.8 27.8 100.065 and over 26.4 10.6 23.9 16.5 22.5 100.0TOTAL 17.3 17.4 28.1 15.9 21.4 100.0
Females 15 to 24 9.2 16.2 29.1 15.7 29.8 100.025 to 34 18.2 14.8 23.9 24.8 18.2 100.035 to 44 14.7 13.9 26.9 22.8 21.7 100.045 to 54 19.7 11.6 22.1 18.1 28.5 100.055 to 64 15.9 13.0 25.7 21.2 24.2 100.065 and over 26.1 10.2 22.7 15.8 25.1 100.0TOTAL 17.5 13.2 25.0 19.6 24.6 100.0
Persons 15 to 24 8.0 15.1 29.7 21.8 25.4 100.025 to 34 14.1 17.8 26.1 20.3 21.7 100.035 to 44 16.7 18.0 31.0 16.5 17.7 100.045 to 54 20.3 16.4 24.2 14.7 24.4 100.055 to 64 19.0 13.3 24.2 17.5 26.0 100.065 and over 26.3 10.4 23.3 16.2 23.9 100.0TOTAL 17.4 15.3 26.5 17.8 23.1 100.0
(a) More than zero and less than once per week (b) Once or more and less than three times per week (c) Three or more times and less than five times per week
* Estimate has a relative standard error of between 25% and 50% and should be used with caution
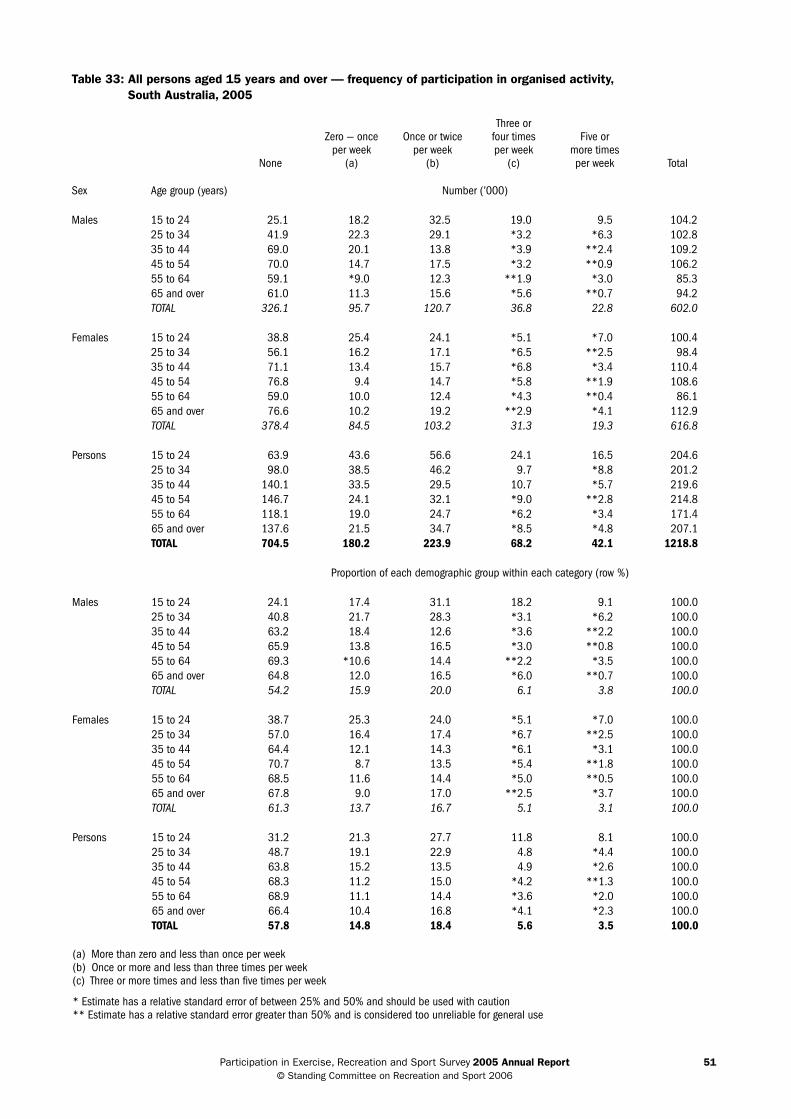
participation in exercise, recreation and sport survey 2005 Annual Report 51 © standing committee on recreation and sport 2006
Table 33: All persons aged 15 years and over — frequency of participation in organised activity, South Australia, 2005
None
Zero — once per week
(a)
Once or twice per week
(b)
Three or four times per week
(c)
Five or more times per week Total
Sex Age group (years) Number (’000)
Males 15 to 24 25.1 18.2 32.5 19.0 9.5 104.225 to 34 41.9 22.3 29.1 *3.2 *6.3 102.835 to 44 69.0 20.1 13.8 *3.9 **2.4 109.245 to 54 70.0 14.7 17.5 *3.2 **0.9 106.255 to 64 59.1 *9.0 12.3 **1.9 *3.0 85.365 and over 61.0 11.3 15.6 *5.6 **0.7 94.2TOTAL 326.1 95.7 120.7 36.8 22.8 602.0
Females 15 to 24 38.8 25.4 24.1 *5.1 *7.0 100.425 to 34 56.1 16.2 17.1 *6.5 **2.5 98.435 to 44 71.1 13.4 15.7 *6.8 *3.4 110.445 to 54 76.8 9.4 14.7 *5.8 **1.9 108.655 to 64 59.0 10.0 12.4 *4.3 **0.4 86.165 and over 76.6 10.2 19.2 **2.9 *4.1 112.9TOTAL 378.4 84.5 103.2 31.3 19.3 616.8
Persons 15 to 24 63.9 43.6 56.6 24.1 16.5 204.625 to 34 98.0 38.5 46.2 9.7 *8.8 201.235 to 44 140.1 33.5 29.5 10.7 *5.7 219.645 to 54 146.7 24.1 32.1 *9.0 **2.8 214.855 to 64 118.1 19.0 24.7 *6.2 *3.4 171.465 and over 137.6 21.5 34.7 *8.5 *4.8 207.1TOTAL 704.5 180.2 223.9 68.2 42.1 1218.8
Proportion of each demographic group within each category (row %)
Males 15 to 24 24.1 17.4 31.1 18.2 9.1 100.025 to 34 40.8 21.7 28.3 *3.1 *6.2 100.035 to 44 63.2 18.4 12.6 *3.6 **2.2 100.045 to 54 65.9 13.8 16.5 *3.0 **0.8 100.055 to 64 69.3 *10.6 14.4 **2.2 *3.5 100.065 and over 64.8 12.0 16.5 *6.0 **0.7 100.0TOTAL 54.2 15.9 20.0 6.1 3.8 100.0
Females 15 to 24 38.7 25.3 24.0 *5.1 *7.0 100.025 to 34 57.0 16.4 17.4 *6.7 **2.5 100.035 to 44 64.4 12.1 14.3 *6.1 *3.1 100.045 to 54 70.7 8.7 13.5 *5.4 **1.8 100.055 to 64 68.5 11.6 14.4 *5.0 **0.5 100.065 and over 67.8 9.0 17.0 **2.5 *3.7 100.0TOTAL 61.3 13.7 16.7 5.1 3.1 100.0
Persons 15 to 24 31.2 21.3 27.7 11.8 8.1 100.025 to 34 48.7 19.1 22.9 4.8 *4.4 100.035 to 44 63.8 15.2 13.5 4.9 *2.6 100.045 to 54 68.3 11.2 15.0 *4.2 **1.3 100.055 to 64 68.9 11.1 14.4 *3.6 *2.0 100.065 and over 66.4 10.4 16.8 *4.1 *2.3 100.0TOTAL 57.8 14.8 18.4 5.6 3.5 100.0
(a) More than zero and less than once per week (b) Once or more and less than three times per week (c) Three or more times and less than five times per week
* Estimate has a relative standard error of between 25% and 50% and should be used with caution ** Estimate has a relative standard error greater than 50% and is considered too unreliable for general use
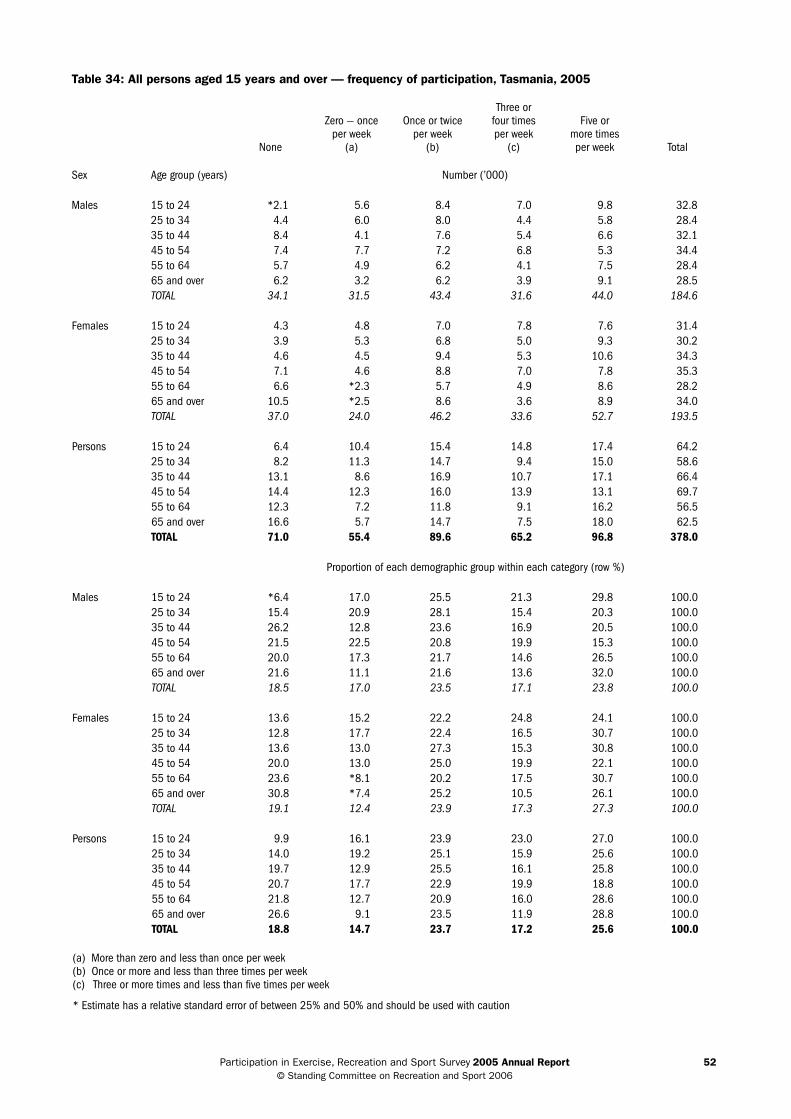
participation in exercise, recreation and sport survey 2005 Annual Report 52 © standing committee on recreation and sport 2006
Table 34: All persons aged 15 years and over — frequency of participation, Tasmania, 2005
None
Zero — once per week
(a)
Once or twice per week
(b)
Three or four times per week
(c)
Five or more times per week Total
Sex Age group (years) Number (’000)
Males 15 to 24 *2.1 5.6 8.4 7.0 9.8 32.825 to 34 4.4 6.0 8.0 4.4 5.8 28.435 to 44 8.4 4.1 7.6 5.4 6.6 32.145 to 54 7.4 7.7 7.2 6.8 5.3 34.455 to 64 5.7 4.9 6.2 4.1 7.5 28.465 and over 6.2 3.2 6.2 3.9 9.1 28.5TOTAL 34.1 31.5 43.4 31.6 44.0 184.6
Females 15 to 24 4.3 4.8 7.0 7.8 7.6 31.425 to 34 3.9 5.3 6.8 5.0 9.3 30.235 to 44 4.6 4.5 9.4 5.3 10.6 34.345 to 54 7.1 4.6 8.8 7.0 7.8 35.355 to 64 6.6 *2.3 5.7 4.9 8.6 28.265 and over 10.5 *2.5 8.6 3.6 8.9 34.0TOTAL 37.0 24.0 46.2 33.6 52.7 193.5
Persons 15 to 24 6.4 10.4 15.4 14.8 17.4 64.225 to 34 8.2 11.3 14.7 9.4 15.0 58.635 to 44 13.1 8.6 16.9 10.7 17.1 66.445 to 54 14.4 12.3 16.0 13.9 13.1 69.755 to 64 12.3 7.2 11.8 9.1 16.2 56.565 and over 16.6 5.7 14.7 7.5 18.0 62.5TOTAL 71.0 55.4 89.6 65.2 96.8 378.0
Proportion of each demographic group within each category (row %)
Males 15 to 24 *6.4 17.0 25.5 21.3 29.8 100.025 to 34 15.4 20.9 28.1 15.4 20.3 100.035 to 44 26.2 12.8 23.6 16.9 20.5 100.045 to 54 21.5 22.5 20.8 19.9 15.3 100.055 to 64 20.0 17.3 21.7 14.6 26.5 100.065 and over 21.6 11.1 21.6 13.6 32.0 100.0TOTAL 18.5 17.0 23.5 17.1 23.8 100.0
Females 15 to 24 13.6 15.2 22.2 24.8 24.1 100.025 to 34 12.8 17.7 22.4 16.5 30.7 100.035 to 44 13.6 13.0 27.3 15.3 30.8 100.045 to 54 20.0 13.0 25.0 19.9 22.1 100.055 to 64 23.6 *8.1 20.2 17.5 30.7 100.065 and over 30.8 *7.4 25.2 10.5 26.1 100.0TOTAL 19.1 12.4 23.9 17.3 27.3 100.0
Persons 15 to 24 9.9 16.1 23.9 23.0 27.0 100.025 to 34 14.0 19.2 25.1 15.9 25.6 100.035 to 44 19.7 12.9 25.5 16.1 25.8 100.045 to 54 20.7 17.7 22.9 19.9 18.8 100.055 to 64 21.8 12.7 20.9 16.0 28.6 100.065 and over 26.6 9.1 23.5 11.9 28.8 100.0TOTAL 18.8 14.7 23.7 17.2 25.6 100.0
(a) More than zero and less than once per week (b) Once or more and less than three times per week (c) Three or more times and less than five times per week
* Estimate has a relative standard error of between 25% and 50% and should be used with caution

participation in exercise, recreation and sport survey 2005 Annual Report 53 © standing committee on recreation and sport 2006
Table 35: All persons aged 15 years and over — frequency of participation in organised activity, Tasmania, 2005
None
Zero — once per week
(a)
Once or twice per week
(b)
Three or four times per week
(c)
Five or more times per week Total
Sex Age group (years) Number (’000)
Males 15 to 24 11.2 6.3 7.3 4.9 3.1 32.825 to 34 17.6 3.5 4.3 *1.4 *1.5 28.435 to 44 21.0 4.3 4.1 *1.8 **0.9 32.145 to 54 21.1 7.5 3.9 **0.8 *1.1 34.455 to 64 19.0 4.0 3.2 *1.5 **0.7 28.465 and over 19.8 *2.5 4.7 **0.7 **0.8 28.5TOTAL 109.7 28.1 27.7 11.0 8.0 184.6
Females 15 to 24 14.2 4.8 8.3 *1.3 *2.8 31.425 to 34 16.3 6.8 4.7 *1.2 *1.3 30.235 to 44 23.2 3.8 4.5 *1.5 *1.2 34.345 to 54 24.3 3.6 5.0 *2.2 **0.2 35.355 to 64 19.5 3.2 3.7 *1.2 **0.6 28.265 and over 24.7 *2.4 5.4 **0.3 *1.2 34.0TOTAL 122.2 24.6 31.6 7.7 7.4 193.5
Persons 15 to 24 25.3 11.1 15.7 6.2 5.9 64.225 to 34 33.9 10.3 9.0 2.6 2.8 58.635 to 44 44.2 8.1 8.7 3.2 *2.1 66.445 to 54 45.4 11.1 8.9 *3.0 *1.3 69.755 to 64 38.4 7.2 6.9 *2.7 *1.3 56.565 and over 44.6 4.8 10.1 **1.0 *2.0 62.5TOTAL 231.9 52.7 59.3 18.8 15.4 378.0
Proportion of each demographic group within each category (row %)
Males 15 to 24 34.0 19.1 22.4 14.9 9.6 100.025 to 34 62.0 12.5 15.2 *5.1 *5.2 100.035 to 44 65.4 13.4 12.9 *5.5 **2.8 100.045 to 54 61.3 21.9 11.5 **2.3 *3.1 100.055 to 64 67.0 14.0 11.3 *5.2 **2.5 100.065 and over 69.7 *8.7 16.6 **2.4 **2.7 100.0TOTAL 59.4 15.2 15.0 6.0 4.4 100.0
Females 15 to 24 45.1 15.2 26.5 *4.3 *8.9 100.025 to 34 53.9 22.4 15.5 *3.9 *4.4 100.035 to 44 67.7 11.2 13.2 *4.3 *3.6 100.045 to 54 68.8 10.3 14.1 *6.3 **0.5 100.055 to 64 69.0 11.4 13.0 *4.3 **2.2 100.065 and over 72.8 *6.9 15.9 **0.9 *3.5 100.0TOTAL 63.2 12.7 16.3 4.0 3.8 100.0
Persons 15 to 24 39.4 17.2 24.4 9.7 9.3 100.025 to 34 57.9 17.6 15.3 4.5 4.8 100.035 to 44 66.6 12.3 13.1 4.9 *3.2 100.045 to 54 65.1 16.0 12.8 *4.3 *1.8 100.055 to 64 68.0 12.7 12.2 *4.7 *2.3 100.065 and over 71.4 7.7 16.2 **1.6 *3.1 100.0TOTAL 61.3 13.9 15.7 5.0 4.1 100.0
(a) More than zero and less than once per week (b) Once or more and less than three times per week (c) Three or more times and less than five times per week
* Estimate has a relative standard error of between 25% and 50% and should be used with caution ** Estimate has a relative standard error greater than 50% and is considered too unreliable for general use

participation in exercise, recreation and sport survey 2005 Annual Report 54 © standing committee on recreation and sport 2006
Table 36: All persons aged 15 years and over — frequency of participation, Victoria, 2005
None
Zero — once per week
(a)
Once or twice per week
(b)
Three or four times per week
(c)
Five or more times per week Total
Sex Age group (years) Number (’000)
Males 15 to 24 36.0 39.3 94.8 74.7 118.1 362.925 to 34 36.1 67.4 124.5 72.5 90.9 391.435 to 44 59.6 85.3 74.1 85.4 62.8 367.245 to 54 57.8 53.5 71.9 60.7 90.9 334.755 to 64 49.1 40.2 71.8 35.9 63.7 260.865 and over 85.3 *21.2 47.7 40.2 79.6 274.1TOTAL 323.9 306.9 484.8 369.5 506.0 1991.1
Females 15 to 24 26.0 40.5 123.9 86.7 75.1 352.125 to 34 49.5 51.4 100.0 79.0 98.7 378.735 to 44 53.8 54.7 97.1 94.9 71.3 371.845 to 54 31.1 50.4 73.8 75.4 111.0 341.755 to 64 43.9 30.8 51.7 59.1 72.0 257.665 and over 86.3 34.8 68.0 49.5 85.3 323.9TOTAL 290.6 262.6 514.6 444.6 513.4 2025.8
Persons 15 to 24 62.0 79.8 218.7 161.4 193.2 715.025 to 34 85.6 118.8 224.5 151.5 189.6 770.135 to 44 113.4 140.0 171.1 180.3 134.1 739.045 to 54 88.8 103.9 145.7 136.1 201.9 676.555 to 64 93.1 71.0 123.6 95.0 135.7 518.465 and over 171.6 55.9 115.7 89.8 164.9 597.9TOTAL 614.5 569.4 999.4 814.1 1019.4 4016.9
Proportion of each demographic group within each category (row %)
Males 15 to 24 9.9 10.8 26.1 20.6 32.6 100.025 to 34 9.2 17.2 31.8 18.5 23.2 100.035 to 44 16.2 23.2 20.2 23.3 17.1 100.045 to 54 17.3 16.0 21.5 18.1 27.1 100.055 to 64 18.8 15.4 27.5 13.8 24.4 100.065 and over 31.1 *7.7 17.4 14.7 29.0 100.0TOTAL 16.3 15.4 24.3 18.6 25.4 100.0
Females 15 to 24 7.4 11.5 35.2 24.6 21.3 100.025 to 34 13.1 13.6 26.4 20.9 26.1 100.035 to 44 14.5 14.7 26.1 25.5 19.2 100.045 to 54 9.1 14.8 21.6 22.1 32.5 100.055 to 64 17.1 11.9 20.1 22.9 28.0 100.065 and over 26.6 10.7 21.0 15.3 26.3 100.0TOTAL 14.3 13.0 25.4 21.9 25.3 100.0
Persons 15 to 24 8.7 11.2 30.6 22.6 27.0 100.025 to 34 11.1 15.4 29.2 19.7 24.6 100.035 to 44 15.3 18.9 23.2 24.4 18.1 100.045 to 54 13.1 15.4 21.5 20.1 29.8 100.055 to 64 18.0 13.7 23.8 18.3 26.2 100.065 and over 28.7 9.4 19.4 15.0 27.6 100.0TOTAL 15.3 14.2 24.9 20.3 25.4 100.0
(a) More than zero and less than once per week (b) Once or more and less than three times per week (c) Three or more times and less than five times per week
* Estimate has a relative standard error of between 25% and 50% and should be used with caution
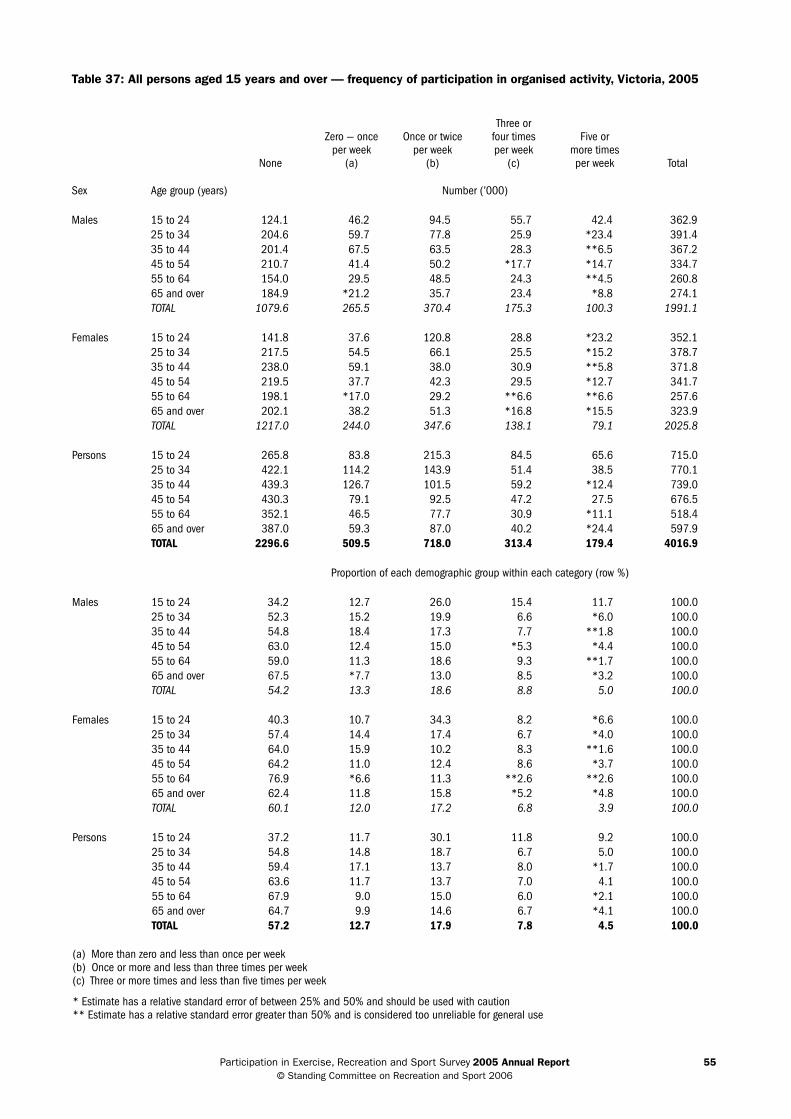
participation in exercise, recreation and sport survey 2005 Annual Report 55 © standing committee on recreation and sport 2006
Table 37: All persons aged 15 years and over — frequency of participation in organised activity, Victoria, 2005
None
Zero — once per week
(a)
Once or twice per week
(b)
Three or four times per week
(c)
Five or more times per week Total
Sex Age group (years) Number (’000)
Males 15 to 24 124.1 46.2 94.5 55.7 42.4 362.925 to 34 204.6 59.7 77.8 25.9 *23.4 391.435 to 44 201.4 67.5 63.5 28.3 **6.5 367.245 to 54 210.7 41.4 50.2 *17.7 *14.7 334.755 to 64 154.0 29.5 48.5 24.3 **4.5 260.865 and over 184.9 *21.2 35.7 23.4 *8.8 274.1TOTAL 1079.6 265.5 370.4 175.3 100.3 1991.1
Females 15 to 24 141.8 37.6 120.8 28.8 *23.2 352.125 to 34 217.5 54.5 66.1 25.5 *15.2 378.735 to 44 238.0 59.1 38.0 30.9 **5.8 371.845 to 54 219.5 37.7 42.3 29.5 *12.7 341.755 to 64 198.1 *17.0 29.2 **6.6 **6.6 257.665 and over 202.1 38.2 51.3 *16.8 *15.5 323.9TOTAL 1217.0 244.0 347.6 138.1 79.1 2025.8
Persons 15 to 24 265.8 83.8 215.3 84.5 65.6 715.025 to 34 422.1 114.2 143.9 51.4 38.5 770.135 to 44 439.3 126.7 101.5 59.2 *12.4 739.045 to 54 430.3 79.1 92.5 47.2 27.5 676.555 to 64 352.1 46.5 77.7 30.9 *11.1 518.465 and over 387.0 59.3 87.0 40.2 *24.4 597.9TOTAL 2296.6 509.5 718.0 313.4 179.4 4016.9
Proportion of each demographic group within each category (row %)
Males 15 to 24 34.2 12.7 26.0 15.4 11.7 100.025 to 34 52.3 15.2 19.9 6.6 *6.0 100.035 to 44 54.8 18.4 17.3 7.7 **1.8 100.045 to 54 63.0 12.4 15.0 *5.3 *4.4 100.055 to 64 59.0 11.3 18.6 9.3 **1.7 100.065 and over 67.5 *7.7 13.0 8.5 *3.2 100.0TOTAL 54.2 13.3 18.6 8.8 5.0 100.0
Females 15 to 24 40.3 10.7 34.3 8.2 *6.6 100.025 to 34 57.4 14.4 17.4 6.7 *4.0 100.035 to 44 64.0 15.9 10.2 8.3 **1.6 100.045 to 54 64.2 11.0 12.4 8.6 *3.7 100.055 to 64 76.9 *6.6 11.3 **2.6 **2.6 100.065 and over 62.4 11.8 15.8 *5.2 *4.8 100.0TOTAL 60.1 12.0 17.2 6.8 3.9 100.0
Persons 15 to 24 37.2 11.7 30.1 11.8 9.2 100.025 to 34 54.8 14.8 18.7 6.7 5.0 100.035 to 44 59.4 17.1 13.7 8.0 *1.7 100.045 to 54 63.6 11.7 13.7 7.0 4.1 100.055 to 64 67.9 9.0 15.0 6.0 *2.1 100.065 and over 64.7 9.9 14.6 6.7 *4.1 100.0TOTAL 57.2 12.7 17.9 7.8 4.5 100.0
(a) More than zero and less than once per week (b) Once or more and less than three times per week (c) Three or more times and less than five times per week
* Estimate has a relative standard error of between 25% and 50% and should be used with caution ** Estimate has a relative standard error greater than 50% and is considered too unreliable for general use

participation in exercise, recreation and sport survey 2005 Annual Report 56 © standing committee on recreation and sport 2006
Table 38: All persons aged 15 years and over — frequency of participation, Western Australia, 2005
None
Zero — once per week
(a)
Once or twice per week
(b)
Three or four times per week
(c)
Five or more times per week Total
Sex Age group (years) Number (’000)
Males 15 to 24 20.2 27.8 34.1 20.4 44.4 147.125 to 34 17.9 29.4 39.9 20.2 40.7 148.235 to 44 19.2 34.1 35.3 28.8 31.8 149.145 to 54 24.3 22.7 35.3 26.6 34.5 143.455 to 64 22.2 16.6 23.1 *10.2 34.1 106.265 and over 24.4 *9.9 12.2 16.8 34.4 97.7TOTAL 128.2 140.6 179.9 123.1 220.0 791.7
Females 15 to 24 *11.4 21.9 40.5 34.7 36.4 144.825 to 34 19.8 17.4 37.5 34.1 36.2 145.035 to 44 23.0 24.6 27.8 36.9 35.5 147.845 to 54 25.5 *7.2 35.2 28.0 47.2 143.255 to 64 20.3 *7.5 22.8 13.9 34.7 99.365 and over 28.5 *9.0 18.8 15.0 40.5 111.9TOTAL 128.6 87.6 182.6 162.7 230.5 791.9
Persons 15 to 24 31.6 49.7 74.6 55.2 80.8 291.925 to 34 37.7 46.8 77.4 54.3 76.9 293.235 to 44 42.2 58.7 63.0 65.7 67.2 296.945 to 54 49.8 29.9 70.5 54.7 81.7 286.655 to 64 42.5 24.2 45.9 24.1 68.9 205.565 and over 52.9 18.8 31.0 31.9 74.9 209.5TOTAL 256.8 228.2 362.5 285.7 450.5 1583.6
Proportion of each demographic group within each category (row %)
Males 15 to 24 13.8 18.9 23.2 13.9 30.2 100.025 to 34 12.1 19.9 26.9 13.6 27.5 100.035 to 44 12.9 22.9 23.6 19.3 21.3 100.045 to 54 16.9 15.8 24.6 18.6 24.1 100.055 to 64 20.9 15.7 21.8 *9.6 32.1 100.065 and over 24.9 *10.1 12.5 17.2 35.2 100.0TOTAL 16.2 17.8 22.7 15.5 27.8 100.0
Females 15 to 24 *7.8 15.1 28.0 24.0 25.1 100.025 to 34 13.7 12.0 25.9 23.5 25.0 100.035 to 44 15.6 16.7 18.8 25.0 24.0 100.045 to 54 17.8 *5.0 24.6 19.6 33.0 100.055 to 64 20.5 *7.6 23.0 14.0 35.0 100.065 and over 25.5 *8.0 16.8 13.5 36.2 100.0TOTAL 16.2 11.1 23.1 20.5 29.1 100.0
Persons 15 to 24 10.8 17.0 25.5 18.9 27.7 100.025 to 34 12.9 16.0 26.4 18.5 26.2 100.035 to 44 14.2 19.8 21.2 22.1 22.6 100.045 to 54 17.4 10.4 24.6 19.1 28.5 100.055 to 64 20.7 11.8 22.3 11.7 33.5 100.065 and over 25.2 9.0 14.8 15.2 35.8 100.0TOTAL 16.2 14.4 22.9 18.0 28.4 100.0
(a) More than zero and less than once per week (b) Once or more and less than three times per week (c) Three or more times and less than five times per week
* Estimate has a relative standard error of between 25% and 50% and should be used with caution

participation in exercise, recreation and sport survey 2005 Annual Report 57 © standing committee on recreation and sport 2006
Table 39: All persons aged 15 years and over — frequency of participation in organised activity, Western Australia, 2005
None
Zero — once per week
(a)
Once or twice per week
(b)
Three or four times per week
(c)
Five or more times per week Total
Sex Age group (years) Number (’000)
Males 15 to 24 61.1 24.1 29.2 21.7 *10.9 147.125 to 34 85.2 22.8 16.1 15.1 *9.0 148.235 to 44 78.8 29.9 25.1 *10.7 *4.6 149.145 to 54 95.6 17.2 20.2 *5.1 *5.3 143.455 to 64 71.1 14.8 *11.1 *6.4 **2.8 106.265 and over 70.9 *4.6 15.3 *4.6 **2.3 97.7TOTAL 462.8 113.4 117.0 63.7 34.8 791.7
Females 15 to 24 55.0 23.2 27.4 20.2 19.0 144.825 to 34 69.2 27.7 26.2 14.4 *7.5 145.035 to 44 94.5 17.2 23.7 *10.9 **1.5 147.845 to 54 88.7 12.8 20.8 12.9 *8.0 143.255 to 64 60.1 *7.5 21.8 *7.8 **2.0 99.365 and over 73.1 *10.3 19.3 *6.3 **2.9 111.9TOTAL 440.6 98.8 139.1 72.5 40.9 791.9
Persons 15 to 24 116.2 47.3 56.6 41.9 29.9 291.925 to 34 154.5 50.5 42.3 29.4 16.5 293.235 to 44 173.3 47.1 48.8 21.6 *6.1 296.945 to 54 184.3 30.0 41.0 18.0 13.4 286.655 to 64 131.2 22.3 32.9 14.3 *4.8 205.565 and over 144.0 14.8 34.6 *11.0 *5.2 209.5TOTAL 903.4 212.1 256.2 136.2 75.7 1583.6
Proportion of each demographic group within each category (row %)
Males 15 to 24 41.6 16.4 19.9 14.8 *7.4 100.025 to 34 57.5 15.4 10.9 10.2 *6.1 100.035 to 44 52.8 20.1 16.8 *7.2 *3.1 100.045 to 54 66.6 12.0 14.1 *3.6 *3.7 100.055 to 64 67.0 13.9 *10.5 *6.1 **2.6 100.065 and over 72.6 *4.7 15.6 *4.7 **2.4 100.0TOTAL 58.5 14.3 14.8 8.0 4.4 100.0
Females 15 to 24 38.0 16.0 18.9 13.9 13.1 100.025 to 34 47.8 19.1 18.1 9.9 *5.2 100.035 to 44 64.0 11.6 16.0 *7.4 **1.0 100.045 to 54 62.0 9.0 14.5 9.0 *5.6 100.055 to 64 60.5 *7.6 22.0 *7.9 **2.0 100.065 and over 65.3 *9.2 17.2 *5.7 **2.6 100.0TOTAL 55.6 12.5 17.6 9.2 5.2 100.0
Persons 15 to 24 39.8 16.2 19.4 14.4 10.2 100.025 to 34 52.7 17.2 14.4 10.0 5.6 100.035 to 44 58.4 15.9 16.4 7.3 *2.0 100.045 to 54 64.3 10.5 14.3 6.3 4.7 100.055 to 64 63.9 10.9 16.0 6.9 *2.3 100.065 and over 68.7 7.1 16.5 *5.2 *2.5 100.0TOTAL 57.0 13.4 16.2 8.6 4.8 100.0
(a) More than zero and less than once per week (b) Once or more and less than three times per week (c) Three or more times and less than five times per week
* Estimate has a relative standard error of between 25% and 50% and should be used with caution ** Estimate has a relative standard error greater than 50% and is considered too unreliable for general use
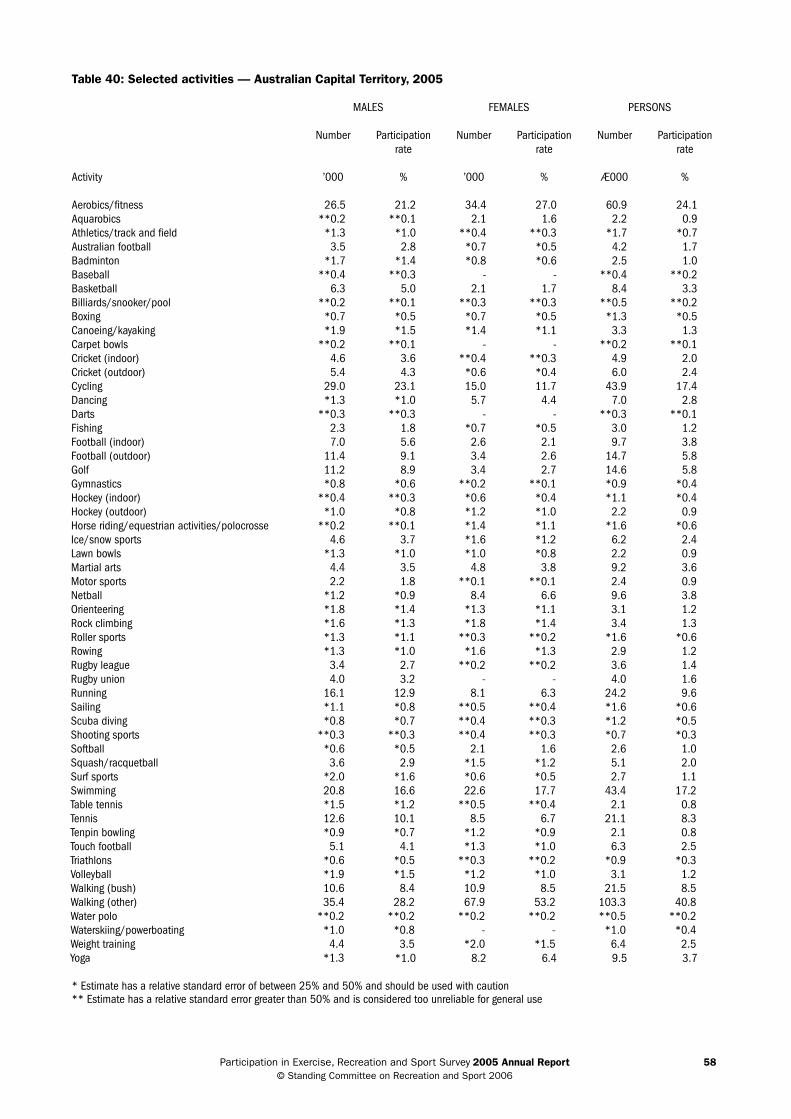
participation in exercise, recreation and sport survey 2005 Annual Report 58 © standing committee on recreation and sport 2006
Table 40: Selected activities — Australian Capital Territory, 2005
MALES FEMALES PERSONS
Number Participation Number Participation Number Participationrate rate rate
Activity ’000 % ’000 % Æ000 %
Aerobics/fitness 26.5 21.2 34.4 27.0 60.9 24.1 Aquarobics **0.2 **0.1 2.1 1.6 2.2 0.9 Athletics/track and field *1.3 *1.0 **0.4 **0.3 *1.7 *0.7 Australian football 3.5 2.8 *0.7 *0.5 4.2 1.7 Badminton *1.7 *1.4 *0.8 *0.6 2.5 1.0 Baseball **0.4 **0.3 - - **0.4 **0.2 Basketball 6.3 5.0 2.1 1.7 8.4 3.3 Billiards/snooker/pool **0.2 **0.1 **0.3 **0.3 **0.5 **0.2 Boxing *0.7 *0.5 *0.7 *0.5 *1.3 *0.5 Canoeing/kayaking *1.9 *1.5 *1.4 *1.1 3.3 1.3 Carpet bowls **0.2 **0.1 - - **0.2 **0.1 Cricket (indoor) 4.6 3.6 **0.4 **0.3 4.9 2.0 Cricket (outdoor) 5.4 4.3 *0.6 *0.4 6.0 2.4 Cycling 29.0 23.1 15.0 11.7 43.9 17.4 Dancing *1.3 *1.0 5.7 4.4 7.0 2.8 Darts **0.3 **0.3 - - **0.3 **0.1 Fishing 2.3 1.8 *0.7 *0.5 3.0 1.2 Football (indoor) 7.0 5.6 2.6 2.1 9.7 3.8 Football (outdoor) 11.4 9.1 3.4 2.6 14.7 5.8 Golf 11.2 8.9 3.4 2.7 14.6 5.8 Gymnastics *0.8 *0.6 **0.2 **0.1 *0.9 *0.4 Hockey (indoor) **0.4 **0.3 *0.6 *0.4 *1.1 *0.4 Hockey (outdoor) *1.0 *0.8 *1.2 *1.0 2.2 0.9 Horse riding/equestrian activities/polocrosse **0.2 **0.1 *1.4 *1.1 *1.6 *0.6 Ice/snow sports 4.6 3.7 *1.6 *1.2 6.2 2.4 Lawn bowls *1.3 *1.0 *1.0 *0.8 2.2 0.9 Martial arts 4.4 3.5 4.8 3.8 9.2 3.6 Motor sports 2.2 1.8 **0.1 **0.1 2.4 0.9 Netball *1.2 *0.9 8.4 6.6 9.6 3.8 Orienteering *1.8 *1.4 *1.3 *1.1 3.1 1.2 Rock climbing *1.6 *1.3 *1.8 *1.4 3.4 1.3 Roller sports *1.3 *1.1 **0.3 **0.2 *1.6 *0.6 Rowing *1.3 *1.0 *1.6 *1.3 2.9 1.2 Rugby league 3.4 2.7 **0.2 **0.2 3.6 1.4 Rugby union 4.0 3.2 - - 4.0 1.6 Running 16.1 12.9 8.1 6.3 24.2 9.6 Sailing *1.1 *0.8 **0.5 **0.4 *1.6 *0.6 Scuba diving *0.8 *0.7 **0.4 **0.3 *1.2 *0.5 Shooting sports **0.3 **0.3 **0.4 **0.3 *0.7 *0.3 Softball *0.6 *0.5 2.1 1.6 2.6 1.0 Squash/racquetball 3.6 2.9 *1.5 *1.2 5.1 2.0 Surf sports *2.0 *1.6 *0.6 *0.5 2.7 1.1 Swimming 20.8 16.6 22.6 17.7 43.4 17.2 Table tennis *1.5 *1.2 **0.5 **0.4 2.1 0.8 Tennis 12.6 10.1 8.5 6.7 21.1 8.3 Tenpin bowling *0.9 *0.7 *1.2 *0.9 2.1 0.8 Touch football 5.1 4.1 *1.3 *1.0 6.3 2.5 Triathlons *0.6 *0.5 **0.3 **0.2 *0.9 *0.3 Volleyball *1.9 *1.5 *1.2 *1.0 3.1 1.2 Walking (bush) 10.6 8.4 10.9 8.5 21.5 8.5 Walking (other) 35.4 28.2 67.9 53.2 103.3 40.8 Water polo **0.2 **0.2 **0.2 **0.2 **0.5 **0.2 Waterskiing/powerboating *1.0 *0.8 - - *1.0 *0.4 Weight training 4.4 3.5 *2.0 *1.5 6.4 2.5 Yoga *1.3 *1.0 8.2 6.4 9.5 3.7
* Estimate has a relative standard error of between 25% and 50% and should be used with caution** Estimate has a relative standard error greater than 50% and is considered too unreliable for general use
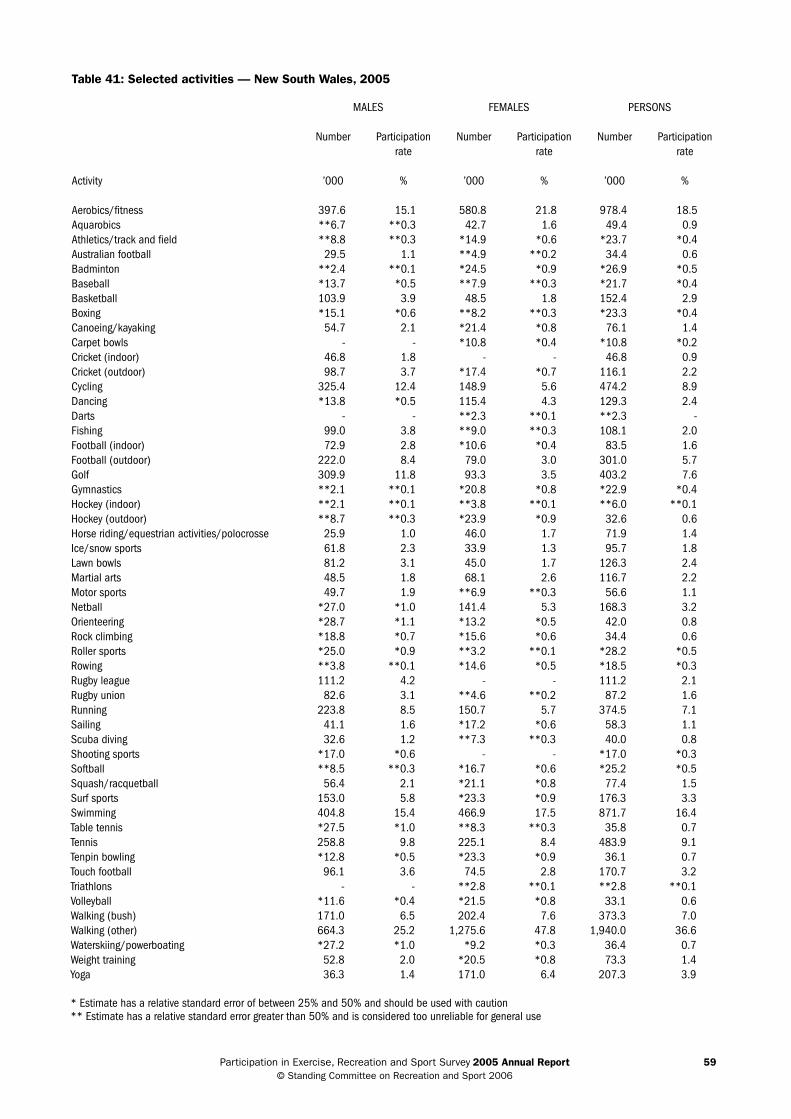
participation in exercise, recreation and sport survey 2005 Annual Report 59 © standing committee on recreation and sport 2006
Table 41: Selected activities — New South Wales, 2005
MALES FEMALES PERSONS
Number Participation Number Participation Number Participationrate rate rate
Activity ’000 % ’000 % ’000 %
Aerobics/fitness 397.6 15.1 580.8 21.8 978.4 18.5 Aquarobics **6.7 **0.3 42.7 1.6 49.4 0.9 Athletics/track and field **8.8 **0.3 *14.9 *0.6 *23.7 *0.4 Australian football 29.5 1.1 **4.9 **0.2 34.4 0.6 Badminton **2.4 **0.1 *24.5 *0.9 *26.9 *0.5 Baseball *13.7 *0.5 **7.9 **0.3 *21.7 *0.4 Basketball 103.9 3.9 48.5 1.8 152.4 2.9 Boxing *15.1 *0.6 **8.2 **0.3 *23.3 *0.4 Canoeing/kayaking 54.7 2.1 *21.4 *0.8 76.1 1.4 Carpet bowls - - *10.8 *0.4 *10.8 *0.2 Cricket (indoor) 46.8 1.8 - - 46.8 0.9 Cricket (outdoor) 98.7 3.7 *17.4 *0.7 116.1 2.2 Cycling 325.4 12.4 148.9 5.6 474.2 8.9 Dancing *13.8 *0.5 115.4 4.3 129.3 2.4 Darts - - **2.3 **0.1 **2.3 - Fishing 99.0 3.8 **9.0 **0.3 108.1 2.0 Football (indoor) 72.9 2.8 *10.6 *0.4 83.5 1.6 Football (outdoor) 222.0 8.4 79.0 3.0 301.0 5.7 Golf 309.9 11.8 93.3 3.5 403.2 7.6 Gymnastics **2.1 **0.1 *20.8 *0.8 *22.9 *0.4 Hockey (indoor) **2.1 **0.1 **3.8 **0.1 **6.0 **0.1 Hockey (outdoor) **8.7 **0.3 *23.9 *0.9 32.6 0.6 Horse riding/equestrian activities/polocrosse 25.9 1.0 46.0 1.7 71.9 1.4 Ice/snow sports 61.8 2.3 33.9 1.3 95.7 1.8 Lawn bowls 81.2 3.1 45.0 1.7 126.3 2.4 Martial arts 48.5 1.8 68.1 2.6 116.7 2.2 Motor sports 49.7 1.9 **6.9 **0.3 56.6 1.1 Netball *27.0 *1.0 141.4 5.3 168.3 3.2 Orienteering *28.7 *1.1 *13.2 *0.5 42.0 0.8 Rock climbing *18.8 *0.7 *15.6 *0.6 34.4 0.6 Roller sports *25.0 *0.9 **3.2 **0.1 *28.2 *0.5 Rowing **3.8 **0.1 *14.6 *0.5 *18.5 *0.3 Rugby league 111.2 4.2 - - 111.2 2.1 Rugby union 82.6 3.1 **4.6 **0.2 87.2 1.6 Running 223.8 8.5 150.7 5.7 374.5 7.1 Sailing 41.1 1.6 *17.2 *0.6 58.3 1.1 Scuba diving 32.6 1.2 **7.3 **0.3 40.0 0.8 Shooting sports *17.0 *0.6 - - *17.0 *0.3 Softball **8.5 **0.3 *16.7 *0.6 *25.2 *0.5 Squash/racquetball 56.4 2.1 *21.1 *0.8 77.4 1.5 Surf sports 153.0 5.8 *23.3 *0.9 176.3 3.3 Swimming 404.8 15.4 466.9 17.5 871.7 16.4 Table tennis *27.5 *1.0 **8.3 **0.3 35.8 0.7 Tennis 258.8 9.8 225.1 8.4 483.9 9.1 Tenpin bowling *12.8 *0.5 *23.3 *0.9 36.1 0.7 Touch football 96.1 3.6 74.5 2.8 170.7 3.2 Triathlons - - **2.8 **0.1 **2.8 **0.1 Volleyball *11.6 *0.4 *21.5 *0.8 33.1 0.6 Walking (bush) 171.0 6.5 202.4 7.6 373.3 7.0 Walking (other) 664.3 25.2 1,275.6 47.8 1,940.0 36.6 Waterskiing/powerboating *27.2 *1.0 *9.2 *0.3 36.4 0.7 Weight training 52.8 2.0 *20.5 *0.8 73.3 1.4 Yoga 36.3 1.4 171.0 6.4 207.3 3.9
* Estimate has a relative standard error of between 25% and 50% and should be used with caution ** Estimate has a relative standard error greater than 50% and is considered too unreliable for general use

participation in exercise, recreation and sport survey 2005 Annual Report 60 © standing committee on recreation and sport 2006
Table 42: Selected activities — Northern Territory, 2005
MALES FEMALES PERSONS
Number Participation Number Participation Number Participationrate rate rate
Activity ’000 % ’000 % ’000 %
Aerobics/fitness 8.3 11.4 13.1 20.1 21.5 15.5 Aquarobics - - 1.6 2.5 1.6 1.2 Athletics/track and field **0.1 **0.2 **0.3 **0.5 **0.4 **0.3 Australian football 5.6 7.6 *0.7 *1.1 6.3 4.5 Badminton **0.3 **0.3 **0.3 **0.5 *0.6 *0.4 Baseball *1.4 *1.9 *0.1 *0.1 *1.5 *1.1 Basketball 2.6 3.6 1.6 2.4 4.2 3.0 Boxing **0.4 **0.6 **0.4 **0.6 *0.8 *0.6 Canoeing/kayaking *0.7 *1.0 *0.5 *0.7 *1.2 *0.9 Carpet bowls - - **0.1 **0.1 **0.1 **0.1 Cricket (indoor) 1.9 2.6 *1.1 *1.7 3.0 2.2 Cricket (outdoor) 4.9 6.6 **0.3 **0.5 5.2 3.8 Cycling 15.3 20.8 8.4 12.8 23.7 17.1 Dancing **0.1 **0.2 1.8 2.8 1.9 1.4 Darts **0.2 **0.3 **0.1 **0.1 **0.3 **0.2 Fishing 4.7 6.4 *1.3 *1.9 5.9 4.3 Football (indoor) *1.3 *1.8 *0.8 *1.2 2.1 1.5 Football (outdoor) 4.8 6.5 1.6 2.5 6.4 4.6 Golf 5.3 7.2 1.6 2.5 6.9 5.0 Gymnastics - - **0.3 **0.5 **0.3 **0.2 Hockey (indoor) **0.3 **0.4 **0.4 **0.6 *0.7 *0.5 Hockey (outdoor) *0.8 *1.0 *0.8 *1.2 *1.5 *1.1 Horse riding/equestrian activities/polocrosse - - *1.4 *2.2 *1.4 *1.0 Ice/snow sports **0.3 **0.4 **0.2 **0.3 *0.5 *0.3 Lawn bowls *0.9 *1.3 *0.5 *0.8 *1.5 *1.1 Martial arts 1.8 2.5 *0.9 *1.4 2.8 2.0 Motor sports 2.9 3.9 **0.1 **0.1 3.0 2.1 Netball **0.3 **0.3 4.7 7.3 5.0 3.6 Orienteering *0.9 *1.2 *0.5 *0.8 *1.4 *1.0 Rock climbing **0.3 **0.4 **0.3 **0.5 *0.6 *0.5 Roller sports *1.2 *1.6 **0.1 **0.2 *1.3 *1.0 Rugby league 2.0 2.8 **0.3 **0.4 2.3 1.7 Rugby union *1.1 *1.4 **0.1 **0.1 *1.1 *0.8 Running 7.1 9.7 7.8 11.9 14.9 10.7 Sailing *1 *1.3 **0.4 **0.6 *1.4 *1.0 Scuba diving *0.5 *0.7 **0.1 **0.1 *0.6 *0.5 Shooting sports 1.6 2.1 - - 1.6 1.1 Softball **0.4 **0.6 *0.6 *0.9 *1.0 *0.7 Squash/racquetball 1.8 2.5 *0.5 *0.7 2.3 1.6 Surf sports **0.3 **0.4 *0.5 *0.8 *0.8 *0.6 Swimming 11.4 15.5 14.8 22.7 26.2 18.9 Table tennis **0.4 **0.5 **0.2 **0.2 *0.5 *0.4 Tennis 3.6 4.8 3.1 4.7 6.6 4.8 Tenpin bowling **0.4 **0.6 *1.2 *1.8 1.6 1.1 Touch football 2.5 3.4 2.4 3.7 4.9 3.5 Triathlons **0.1 **0.2 **0.2 **0.3 **0.3 **0.3 Volleyball 2.7 3.7 3.1 4.7 5.8 4.2 Walking (bush) 4.1 5.6 4.1 6.3 8.2 5.9 Walking (other) 17.8 24.2 30.5 46.8 48.4 34.8 Water polo - - **0.1 **0.1 **0.1 **0.1 Waterskiing/powerboating *0.8 *1.1 **0.3 **0.5 *1.2 *0.8 Weight training 2.6 3.6 *1.3 *2.0 3.9 2.8 Yoga *0.5 *0.7 3.5 5.3 4.0 2.9
* Estimate has a relative standard error of between 25% and 50% and should be used with caution ** Estimate has a relative standard error greater than 50% and is considered too unreliable for general use
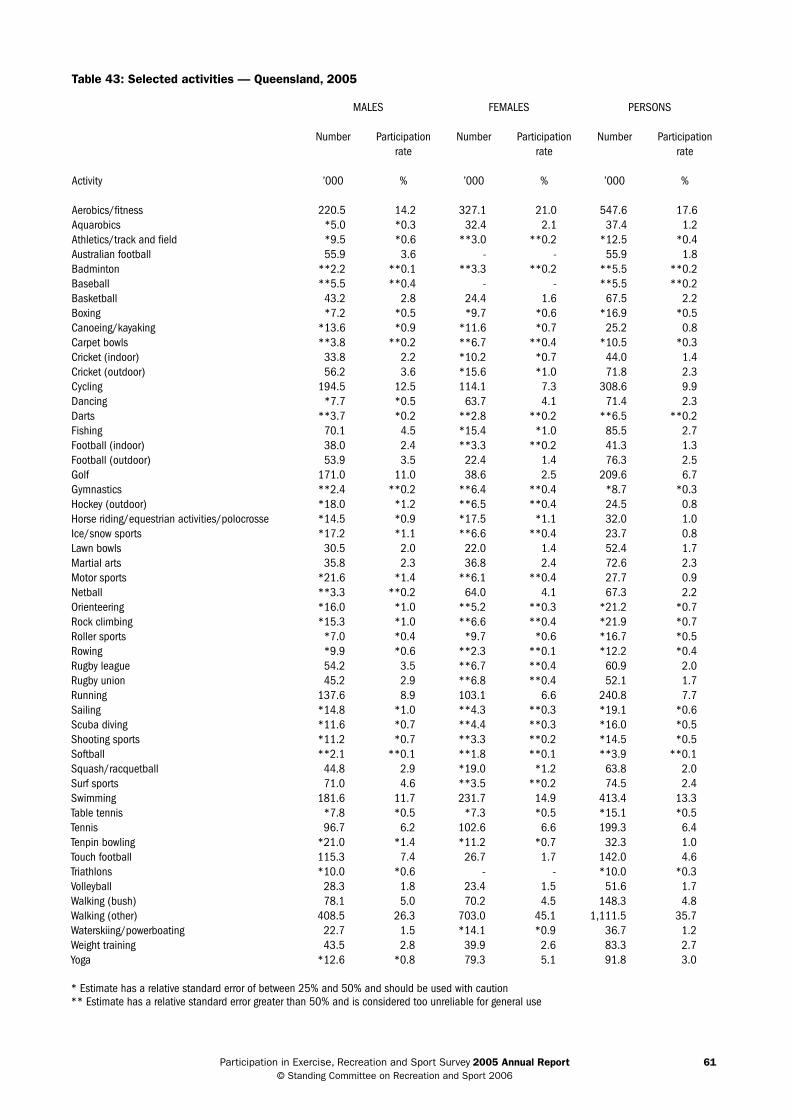
participation in exercise, recreation and sport survey 2005 Annual Report 61 © standing committee on recreation and sport 2006
Table 43: Selected activities — Queensland, 2005
MALES FEMALES PERSONS
Number Participation Number Participation Number Participationrate rate rate
Activity ’000 % ’000 % ’000 %
Aerobics/fitness 220.5 14.2 327.1 21.0 547.6 17.6 Aquarobics *5.0 *0.3 32.4 2.1 37.4 1.2 Athletics/track and field *9.5 *0.6 **3.0 **0.2 *12.5 *0.4 Australian football 55.9 3.6 - - 55.9 1.8 Badminton **2.2 **0.1 **3.3 **0.2 **5.5 **0.2 Baseball **5.5 **0.4 - - **5.5 **0.2 Basketball 43.2 2.8 24.4 1.6 67.5 2.2 Boxing *7.2 *0.5 *9.7 *0.6 *16.9 *0.5 Canoeing/kayaking *13.6 *0.9 *11.6 *0.7 25.2 0.8 Carpet bowls **3.8 **0.2 **6.7 **0.4 *10.5 *0.3 Cricket (indoor) 33.8 2.2 *10.2 *0.7 44.0 1.4 Cricket (outdoor) 56.2 3.6 *15.6 *1.0 71.8 2.3 Cycling 194.5 12.5 114.1 7.3 308.6 9.9 Dancing *7.7 *0.5 63.7 4.1 71.4 2.3 Darts **3.7 *0.2 **2.8 **0.2 **6.5 **0.2 Fishing 70.1 4.5 *15.4 *1.0 85.5 2.7 Football (indoor) 38.0 2.4 **3.3 **0.2 41.3 1.3 Football (outdoor) 53.9 3.5 22.4 1.4 76.3 2.5 Golf 171.0 11.0 38.6 2.5 209.6 6.7 Gymnastics **2.4 **0.2 **6.4 **0.4 *8.7 *0.3 Hockey (outdoor) *18.0 *1.2 **6.5 **0.4 24.5 0.8 Horse riding/equestrian activities/polocrosse *14.5 *0.9 *17.5 *1.1 32.0 1.0 Ice/snow sports *17.2 *1.1 **6.6 **0.4 23.7 0.8 Lawn bowls 30.5 2.0 22.0 1.4 52.4 1.7 Martial arts 35.8 2.3 36.8 2.4 72.6 2.3 Motor sports *21.6 *1.4 **6.1 **0.4 27.7 0.9 Netball **3.3 **0.2 64.0 4.1 67.3 2.2 Orienteering *16.0 *1.0 **5.2 **0.3 *21.2 *0.7 Rock climbing *15.3 *1.0 **6.6 **0.4 *21.9 *0.7 Roller sports *7.0 *0.4 *9.7 *0.6 *16.7 *0.5 Rowing *9.9 *0.6 **2.3 **0.1 *12.2 *0.4 Rugby league 54.2 3.5 **6.7 **0.4 60.9 2.0 Rugby union 45.2 2.9 **6.8 **0.4 52.1 1.7 Running 137.6 8.9 103.1 6.6 240.8 7.7 Sailing *14.8 *1.0 **4.3 **0.3 *19.1 *0.6 Scuba diving *11.6 *0.7 **4.4 **0.3 *16.0 *0.5 Shooting sports *11.2 *0.7 **3.3 **0.2 *14.5 *0.5 Softball **2.1 **0.1 **1.8 **0.1 **3.9 **0.1 Squash/racquetball 44.8 2.9 *19.0 *1.2 63.8 2.0 Surf sports 71.0 4.6 **3.5 **0.2 74.5 2.4 Swimming 181.6 11.7 231.7 14.9 413.4 13.3 Table tennis *7.8 *0.5 *7.3 *0.5 *15.1 *0.5 Tennis 96.7 6.2 102.6 6.6 199.3 6.4 Tenpin bowling *21.0 *1.4 *11.2 *0.7 32.3 1.0 Touch football 115.3 7.4 26.7 1.7 142.0 4.6 Triathlons *10.0 *0.6 - - *10.0 *0.3 Volleyball 28.3 1.8 23.4 1.5 51.6 1.7 Walking (bush) 78.1 5.0 70.2 4.5 148.3 4.8 Walking (other) 408.5 26.3 703.0 45.1 1,111.5 35.7 Waterskiing/powerboating 22.7 1.5 *14.1 *0.9 36.7 1.2 Weight training 43.5 2.8 39.9 2.6 83.3 2.7 Yoga *12.6 *0.8 79.3 5.1 91.8 3.0
* Estimate has a relative standard error of between 25% and 50% and should be used with caution ** Estimate has a relative standard error greater than 50% and is considered too unreliable for general use
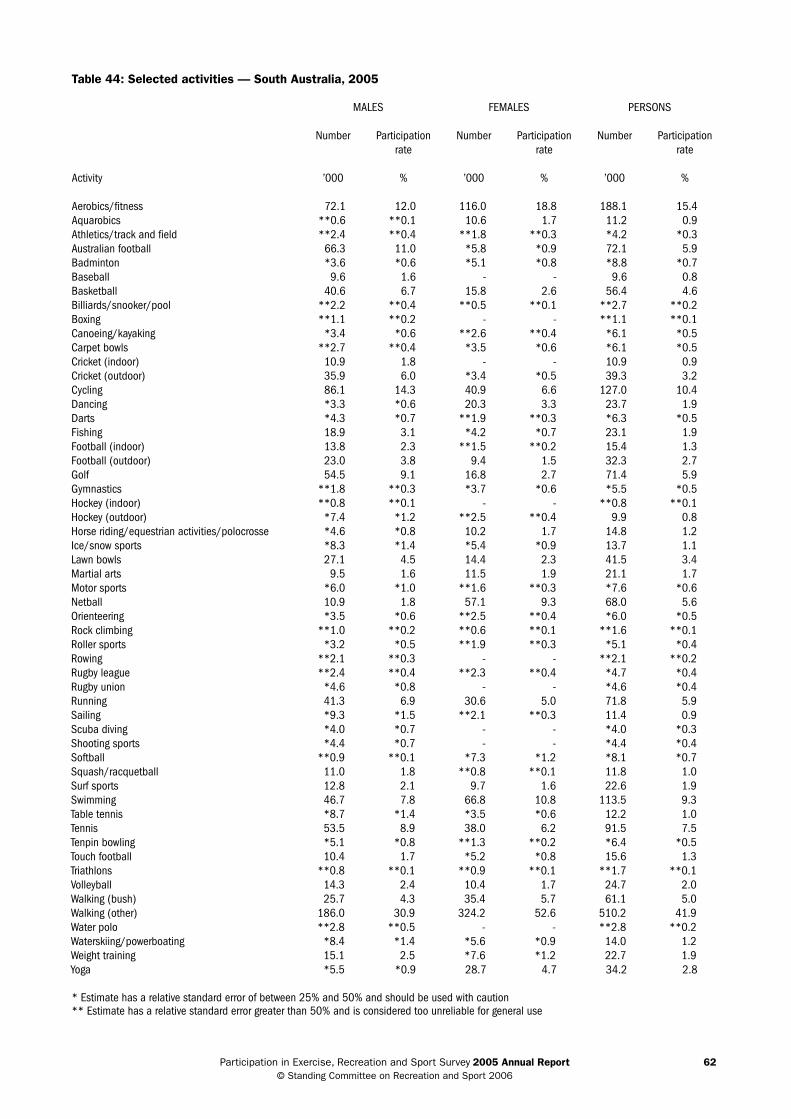
participation in exercise, recreation and sport survey 2005 Annual Report 62 © standing committee on recreation and sport 2006
Table 44: Selected activities — South Australia, 2005
MALES FEMALES PERSONS
Number Participation Number Participation Number Participationrate rate rate
Activity ’000 % ’000 % ’000 %
Aerobics/fitness 72.1 12.0 116.0 18.8 188.1 15.4 Aquarobics **0.6 **0.1 10.6 1.7 11.2 0.9 Athletics/track and field **2.4 **0.4 **1.8 **0.3 *4.2 *0.3 Australian football 66.3 11.0 *5.8 *0.9 72.1 5.9 Badminton *3.6 *0.6 *5.1 *0.8 *8.8 *0.7 Baseball 9.6 1.6 - - 9.6 0.8 Basketball 40.6 6.7 15.8 2.6 56.4 4.6 Billiards/snooker/pool **2.2 **0.4 **0.5 **0.1 **2.7 **0.2 Boxing **1.1 **0.2 - - **1.1 **0.1 Canoeing/kayaking *3.4 *0.6 **2.6 **0.4 *6.1 *0.5 Carpet bowls **2.7 **0.4 *3.5 *0.6 *6.1 *0.5 Cricket (indoor) 10.9 1.8 - - 10.9 0.9 Cricket (outdoor) 35.9 6.0 *3.4 *0.5 39.3 3.2 Cycling 86.1 14.3 40.9 6.6 127.0 10.4 Dancing *3.3 *0.6 20.3 3.3 23.7 1.9 Darts *4.3 *0.7 **1.9 **0.3 *6.3 *0.5 Fishing 18.9 3.1 *4.2 *0.7 23.1 1.9 Football (indoor) 13.8 2.3 **1.5 **0.2 15.4 1.3 Football (outdoor) 23.0 3.8 9.4 1.5 32.3 2.7 Golf 54.5 9.1 16.8 2.7 71.4 5.9 Gymnastics **1.8 **0.3 *3.7 *0.6 *5.5 *0.5 Hockey (indoor) **0.8 **0.1 - - **0.8 **0.1 Hockey (outdoor) *7.4 *1.2 **2.5 **0.4 9.9 0.8 Horse riding/equestrian activities/polocrosse *4.6 *0.8 10.2 1.7 14.8 1.2 Ice/snow sports *8.3 *1.4 *5.4 *0.9 13.7 1.1 Lawn bowls 27.1 4.5 14.4 2.3 41.5 3.4 Martial arts 9.5 1.6 11.5 1.9 21.1 1.7 Motor sports *6.0 *1.0 **1.6 **0.3 *7.6 *0.6 Netball 10.9 1.8 57.1 9.3 68.0 5.6 Orienteering *3.5 *0.6 **2.5 **0.4 *6.0 *0.5 Rock climbing **1.0 **0.2 **0.6 **0.1 **1.6 **0.1 Roller sports *3.2 *0.5 **1.9 **0.3 *5.1 *0.4 Rowing **2.1 **0.3 - - **2.1 **0.2 Rugby league **2.4 **0.4 **2.3 **0.4 *4.7 *0.4 Rugby union *4.6 *0.8 - - *4.6 *0.4 Running 41.3 6.9 30.6 5.0 71.8 5.9 Sailing *9.3 *1.5 **2.1 **0.3 11.4 0.9 Scuba diving *4.0 *0.7 - - *4.0 *0.3 Shooting sports *4.4 *0.7 - - *4.4 *0.4 Softball **0.9 **0.1 *7.3 *1.2 *8.1 *0.7 Squash/racquetball 11.0 1.8 **0.8 **0.1 11.8 1.0 Surf sports 12.8 2.1 9.7 1.6 22.6 1.9 Swimming 46.7 7.8 66.8 10.8 113.5 9.3 Table tennis *8.7 *1.4 *3.5 *0.6 12.2 1.0 Tennis 53.5 8.9 38.0 6.2 91.5 7.5 Tenpin bowling *5.1 *0.8 **1.3 **0.2 *6.4 *0.5 Touch football 10.4 1.7 *5.2 *0.8 15.6 1.3 Triathlons **0.8 **0.1 **0.9 **0.1 **1.7 **0.1 Volleyball 14.3 2.4 10.4 1.7 24.7 2.0 Walking (bush) 25.7 4.3 35.4 5.7 61.1 5.0 Walking (other) 186.0 30.9 324.2 52.6 510.2 41.9 Water polo **2.8 **0.5 - - **2.8 **0.2 Waterskiing/powerboating *8.4 *1.4 *5.6 *0.9 14.0 1.2 Weight training 15.1 2.5 *7.6 *1.2 22.7 1.9 Yoga *5.5 *0.9 28.7 4.7 34.2 2.8
* Estimate has a relative standard error of between 25% and 50% and should be used with caution** Estimate has a relative standard error greater than 50% and is considered too unreliable for general use
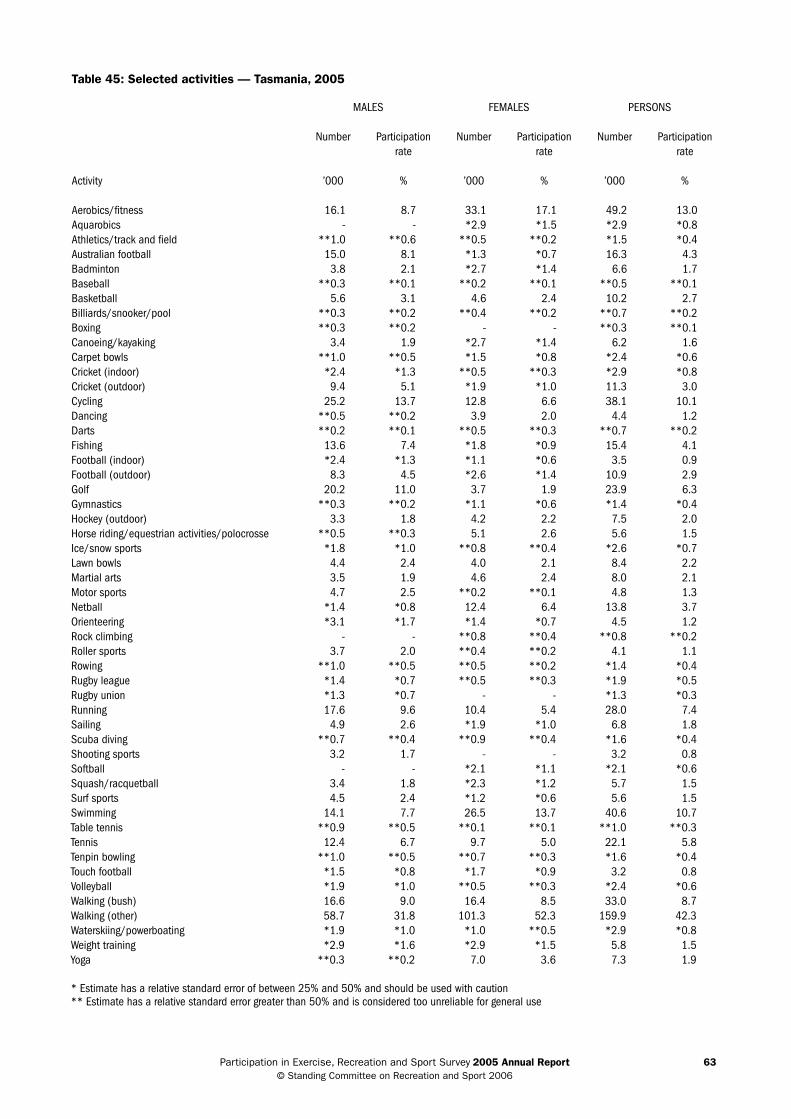
participation in exercise, recreation and sport survey 2005 Annual Report 63 © standing committee on recreation and sport 2006
Table 45: Selected activities — Tasmania, 2005
MALES FEMALES PERSONS
Number Participation Number Participation Number Participationrate rate rate
Activity ’000 % ’000 % ’000 %
Aerobics/fitness 16.1 8.7 33.1 17.1 49.2 13.0 Aquarobics - - *2.9 *1.5 *2.9 *0.8 Athletics/track and field **1.0 **0.6 **0.5 **0.2 *1.5 *0.4 Australian football 15.0 8.1 *1.3 *0.7 16.3 4.3 Badminton 3.8 2.1 *2.7 *1.4 6.6 1.7 Baseball **0.3 **0.1 **0.2 **0.1 **0.5 **0.1 Basketball 5.6 3.1 4.6 2.4 10.2 2.7 Billiards/snooker/pool **0.3 **0.2 **0.4 **0.2 **0.7 **0.2 Boxing **0.3 **0.2 - - **0.3 **0.1 Canoeing/kayaking 3.4 1.9 *2.7 *1.4 6.2 1.6 Carpet bowls **1.0 **0.5 *1.5 *0.8 *2.4 *0.6 Cricket (indoor) *2.4 *1.3 **0.5 **0.3 *2.9 *0.8 Cricket (outdoor) 9.4 5.1 *1.9 *1.0 11.3 3.0 Cycling 25.2 13.7 12.8 6.6 38.1 10.1 Dancing **0.5 **0.2 3.9 2.0 4.4 1.2 Darts **0.2 **0.1 **0.5 **0.3 **0.7 **0.2 Fishing 13.6 7.4 *1.8 *0.9 15.4 4.1 Football (indoor) *2.4 *1.3 *1.1 *0.6 3.5 0.9 Football (outdoor) 8.3 4.5 *2.6 *1.4 10.9 2.9 Golf 20.2 11.0 3.7 1.9 23.9 6.3 Gymnastics **0.3 **0.2 *1.1 *0.6 *1.4 *0.4 Hockey (outdoor) 3.3 1.8 4.2 2.2 7.5 2.0 Horse riding/equestrian activities/polocrosse **0.5 **0.3 5.1 2.6 5.6 1.5 Ice/snow sports *1.8 *1.0 **0.8 **0.4 *2.6 *0.7 Lawn bowls 4.4 2.4 4.0 2.1 8.4 2.2 Martial arts 3.5 1.9 4.6 2.4 8.0 2.1 Motor sports 4.7 2.5 **0.2 **0.1 4.8 1.3 Netball *1.4 *0.8 12.4 6.4 13.8 3.7 Orienteering *3.1 *1.7 *1.4 *0.7 4.5 1.2 Rock climbing - - **0.8 **0.4 **0.8 **0.2 Roller sports 3.7 2.0 **0.4 **0.2 4.1 1.1 Rowing **1.0 **0.5 **0.5 **0.2 *1.4 *0.4 Rugby league *1.4 *0.7 **0.5 **0.3 *1.9 *0.5 Rugby union *1.3 *0.7 - - *1.3 *0.3 Running 17.6 9.6 10.4 5.4 28.0 7.4 Sailing 4.9 2.6 *1.9 *1.0 6.8 1.8 Scuba diving **0.7 **0.4 **0.9 **0.4 *1.6 *0.4 Shooting sports 3.2 1.7 - - 3.2 0.8 Softball - - *2.1 *1.1 *2.1 *0.6 Squash/racquetball 3.4 1.8 *2.3 *1.2 5.7 1.5 Surf sports 4.5 2.4 *1.2 *0.6 5.6 1.5 Swimming 14.1 7.7 26.5 13.7 40.6 10.7 Table tennis **0.9 **0.5 **0.1 **0.1 **1.0 **0.3 Tennis 12.4 6.7 9.7 5.0 22.1 5.8 Tenpin bowling **1.0 **0.5 **0.7 **0.3 *1.6 *0.4 Touch football *1.5 *0.8 *1.7 *0.9 3.2 0.8 Volleyball *1.9 *1.0 **0.5 **0.3 *2.4 *0.6 Walking (bush) 16.6 9.0 16.4 8.5 33.0 8.7 Walking (other) 58.7 31.8 101.3 52.3 159.9 42.3 Waterskiing/powerboating *1.9 *1.0 *1.0 **0.5 *2.9 *0.8 Weight training *2.9 *1.6 *2.9 *1.5 5.8 1.5 Yoga **0.3 **0.2 7.0 3.6 7.3 1.9
* Estimate has a relative standard error of between 25% and 50% and should be used with caution ** Estimate has a relative standard error greater than 50% and is considered too unreliable for general use
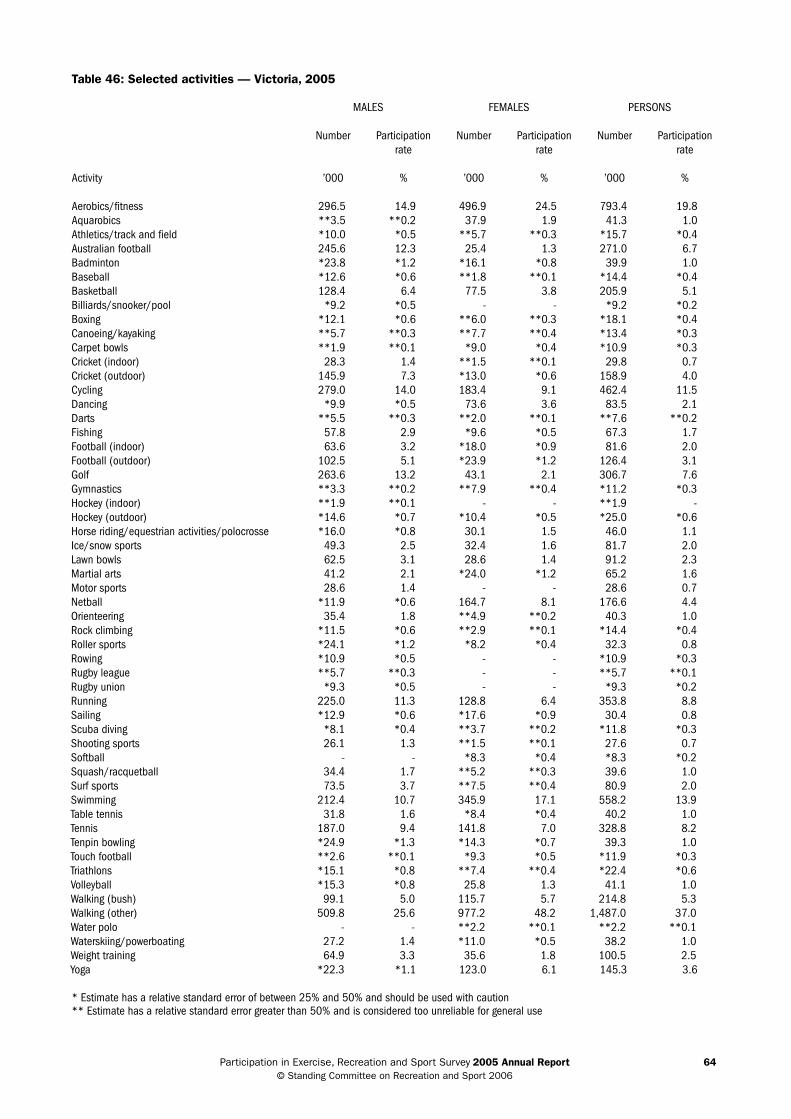
participation in exercise, recreation and sport survey 2005 Annual Report 64 © standing committee on recreation and sport 2006
Table 46: Selected activities — Victoria, 2005
MALES FEMALES PERSONS
Number Participation Number Participation Number Participationrate rate rate
Activity ’000 % ’000 % ’000 %
Aerobics/fitness 296.5 14.9 496.9 24.5 793.4 19.8 Aquarobics **3.5 **0.2 37.9 1.9 41.3 1.0 Athletics/track and field *10.0 *0.5 **5.7 **0.3 *15.7 *0.4 Australian football 245.6 12.3 25.4 1.3 271.0 6.7 Badminton *23.8 *1.2 *16.1 *0.8 39.9 1.0 Baseball *12.6 *0.6 **1.8 **0.1 *14.4 *0.4 Basketball 128.4 6.4 77.5 3.8 205.9 5.1 Billiards/snooker/pool *9.2 *0.5 - - *9.2 *0.2 Boxing *12.1 *0.6 **6.0 **0.3 *18.1 *0.4 Canoeing/kayaking **5.7 **0.3 **7.7 **0.4 *13.4 *0.3 Carpet bowls **1.9 **0.1 *9.0 *0.4 *10.9 *0.3 Cricket (indoor) 28.3 1.4 **1.5 **0.1 29.8 0.7 Cricket (outdoor) 145.9 7.3 *13.0 *0.6 158.9 4.0 Cycling 279.0 14.0 183.4 9.1 462.4 11.5 Dancing *9.9 *0.5 73.6 3.6 83.5 2.1 Darts **5.5 **0.3 **2.0 **0.1 **7.6 **0.2 Fishing 57.8 2.9 *9.6 *0.5 67.3 1.7 Football (indoor) 63.6 3.2 *18.0 *0.9 81.6 2.0 Football (outdoor) 102.5 5.1 *23.9 *1.2 126.4 3.1 Golf 263.6 13.2 43.1 2.1 306.7 7.6 Gymnastics **3.3 **0.2 **7.9 **0.4 *11.2 *0.3 Hockey (indoor) **1.9 **0.1 - - **1.9 - Hockey (outdoor) *14.6 *0.7 *10.4 *0.5 *25.0 *0.6 Horse riding/equestrian activities/polocrosse *16.0 *0.8 30.1 1.5 46.0 1.1 Ice/snow sports 49.3 2.5 32.4 1.6 81.7 2.0 Lawn bowls 62.5 3.1 28.6 1.4 91.2 2.3 Martial arts 41.2 2.1 *24.0 *1.2 65.2 1.6 Motor sports 28.6 1.4 - - 28.6 0.7 Netball *11.9 *0.6 164.7 8.1 176.6 4.4 Orienteering 35.4 1.8 **4.9 **0.2 40.3 1.0 Rock climbing *11.5 *0.6 **2.9 **0.1 *14.4 *0.4 Roller sports *24.1 *1.2 *8.2 *0.4 32.3 0.8 Rowing *10.9 *0.5 - - *10.9 *0.3 Rugby league **5.7 **0.3 - - **5.7 **0.1 Rugby union *9.3 *0.5 - - *9.3 *0.2 Running 225.0 11.3 128.8 6.4 353.8 8.8 Sailing *12.9 *0.6 *17.6 *0.9 30.4 0.8 Scuba diving *8.1 *0.4 **3.7 **0.2 *11.8 *0.3 Shooting sports 26.1 1.3 **1.5 **0.1 27.6 0.7 Softball - - *8.3 *0.4 *8.3 *0.2 Squash/racquetball 34.4 1.7 **5.2 **0.3 39.6 1.0 Surf sports 73.5 3.7 **7.5 **0.4 80.9 2.0 Swimming 212.4 10.7 345.9 17.1 558.2 13.9 Table tennis 31.8 1.6 *8.4 *0.4 40.2 1.0 Tennis 187.0 9.4 141.8 7.0 328.8 8.2 Tenpin bowling *24.9 *1.3 *14.3 *0.7 39.3 1.0 Touch football **2.6 **0.1 *9.3 *0.5 *11.9 *0.3 Triathlons *15.1 *0.8 **7.4 **0.4 *22.4 *0.6 Volleyball *15.3 *0.8 25.8 1.3 41.1 1.0 Walking (bush) 99.1 5.0 115.7 5.7 214.8 5.3 Walking (other) 509.8 25.6 977.2 48.2 1,487.0 37.0 Water polo - - **2.2 **0.1 **2.2 **0.1 Waterskiing/powerboating 27.2 1.4 *11.0 *0.5 38.2 1.0 Weight training 64.9 3.3 35.6 1.8 100.5 2.5 Yoga *22.3 *1.1 123.0 6.1 145.3 3.6
* Estimate has a relative standard error of between 25% and 50% and should be used with caution** Estimate has a relative standard error greater than 50% and is considered too unreliable for general use

participation in exercise, recreation and sport survey 2005 Annual Report 65 © standing committee on recreation and sport 2006
Table 47: Selected activities — Western Australia, 2005
MALES FEMALES PERSONS
Number Participation Number Participation Number Participationrate rate rate
Activity ’000 % ’000 % ’000 %
Aerobics/fitness 130.1 16.4 190.4 24.0 320.5 20.2 Aquarobics **3.0 **0.4 15.8 2.0 18.8 1.2 Athletics/track and field *5.9 *0.7 *6.9 *0.9 12.8 0.8 Australian football 67.0 8.5 *9.0 *1.1 76.0 4.8 Badminton *8.2 *1.0 *8.1 *1.0 16.3 1.0 Baseball **2.5 **0.3 - - **2.5 **0.2 Basketball 32.7 4.1 25.4 3.2 58.1 3.7 Billiards/snooker/pool **2.2 **0.3 - - **2.2 **0.1 Boxing *3.9 *0.5 **1.9 **0.2 *5.8 *0.4 Canoeing/kayaking *8.5 *1.1 *4.5 *0.6 12.9 0.8 Carpet bowls - - **0.6 **0.1 **0.6 - Cricket (indoor) 21.6 2.7 **1.5 **0.2 23.1 1.5 Cricket (outdoor) 46.1 5.8 **2.2 **0.3 48.3 3.0 Cycling 112.6 14.2 56.3 7.1 168.9 10.7 Dancing *5.2 *0.7 31.9 4.0 37.1 2.3 Darts **0.9 **0.1 **2.7 **0.3 **3.7 **0.2 Fishing 26.8 3.4 *6.9 *0.9 33.7 2.1 Football (indoor) 20.3 2.6 *6.8 *0.9 27.0 1.7 Football (outdoor) 32.9 4.2 13.4 1.7 46.3 2.9 Golf 84.6 10.7 18.4 2.3 103.0 6.5 Gymnastics **1.2 **0.1 *5.3 *0.7 *6.5 *0.4 Hockey (indoor) **1.3 **0.2 **1.3 **0.2 **2.6 **0.2 Hockey (outdoor) 17.8 2.2 *10.6 *1.3 28.4 1.8 Horse riding/equestrian activities/polocrosse **2.0 **0.3 15.0 1.9 17.0 1.1 Ice/snow sports **2.4 **0.3 **1.6 **0.2 *4.0 *0.3 Lawn bowls 21.7 2.7 *11.2 *1.4 33.0 2.1 Martial arts 14.1 1.8 16.2 2.0 30.2 1.9 Motor sports 12.8 1.6 **1.0 **0.1 13.8 0.9 Netball *7.6 *1.0 65.4 8.3 73.0 4.6 Orienteering *7.3 *0.9 *5.4 *0.7 12.7 0.8 Rock climbing *4.2 *0.5 **1.4 **0.2 *5.6 *0.4 Roller sports *9.6 *1.2 **3.4 **0.4 13.0 0.8 Rowing **3.4 **0.4 **3.8 **0.5 *7.2 *0.5 Rugby league **3.7 **0.5 **2.1 **0.3 *5.7 *0.4 Rugby union *4.8 *0.6 **1.5 **0.2 *6.3 *0.4 Running 75.5 9.5 48.2 6.1 123.7 7.8 Sailing 16.3 2.1 **2.3 **0.3 18.6 1.2 Scuba diving *10.5 *1.3 **1.0 **0.1 11.6 0.7 Shooting sports *6.1 *0.8 **0.9 **0.1 *7.0 *0.4 Softball **0.9 **0.1 *5.8 *0.7 *6.8 *0.4 Squash/racquetball 19.9 2.5 *8.5 *1.1 28.4 1.8 Surf sports 38.8 4.9 12.8 1.6 51.7 3.3 Swimming 102.2 12.9 142.0 17.9 244.2 15.4 Table tennis *4.6 *0.6 **2.7 **0.3 *7.3 *0.5 Tennis 56.3 7.1 43.7 5.5 99.9 6.3 Tenpin bowling *4.4 *0.6 **1.5 **0.2 *5.9 *0.4 Touch football *6.5 *0.8 *6.1 *0.8 12.6 0.8 Triathlons *4.4 *0.6 **2.2 **0.3 *6.6 *0.4 Volleyball 27.7 3.5 17.3 2.2 45.0 2.8 Walking (bush) 19.5 2.5 30.7 3.9 50.2 3.2 Walking (other) 240.0 30.3 373.4 47.2 613.4 38.7 Water polo *5.3 *0.7 *5.6 *0.7 *10.9 *0.7 Waterskiing/powerboating *8.0 *1.0 *4.5 *0.6 12.5 0.8 Weight training 20.3 2.6 *10.9 *1.4 31.1 2.0 Yoga *4.1 *0.5 37.6 4.7 41.7 2.6
* Estimate has a relative standard error of between 25% and 50% and should be used with caution** Estimate has a relative standard error greater than 50% and is considered too unreliable for general use
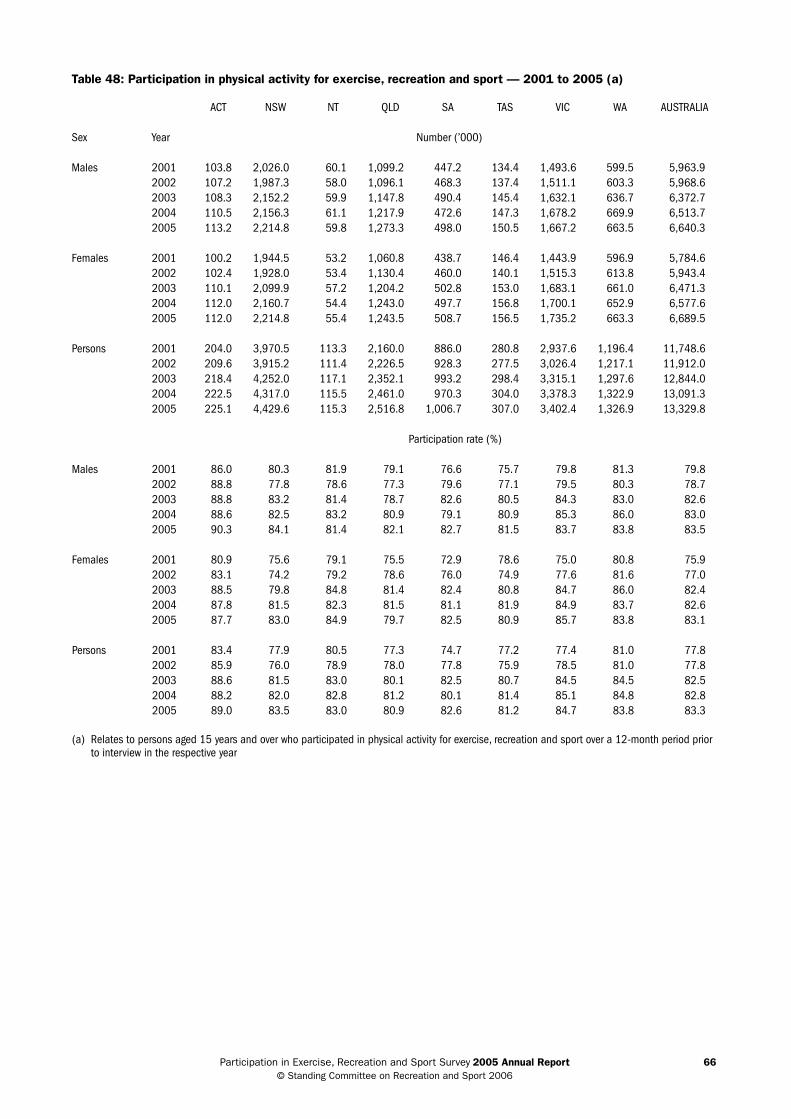
participation in exercise, recreation and sport survey 2005 Annual Report 66 © standing committee on recreation and sport 2006
Table 48: Participation in physical activity for exercise, recreation and sport — 2001 to 2005 (a)
ACT NSW NT QLD SA TAS VIC WA AUSTRALIA
Sex Year Number (’000)
Males 2001 103.8 2,026.0 60.1 1,099.2 447.2 134.4 1,493.6 599.5 5,963.9 2002 107.2 1,987.3 58.0 1,096.1 468.3 137.4 1,511.1 603.3 5,968.6 2003 108.3 2,152.2 59.9 1,147.8 490.4 145.4 1,632.1 636.7 6,372.7 2004 110.5 2,156.3 61.1 1,217.9 472.6 147.3 1,678.2 669.9 6,513.7 2005 113.2 2,214.8 59.8 1,273.3 498.0 150.5 1,667.2 663.5 6,640.3
Females 2001 100.2 1,944.5 53.2 1,060.8 438.7 146.4 1,443.9 596.9 5,784.6 2002 102.4 1,928.0 53.4 1,130.4 460.0 140.1 1,515.3 613.8 5,943.4 2003 110.1 2,099.9 57.2 1,204.2 502.8 153.0 1,683.1 661.0 6,471.3 2004 112.0 2,160.7 54.4 1,243.0 497.7 156.8 1,700.1 652.9 6,577.6 2005 112.0 2,214.8 55.4 1,243.5 508.7 156.5 1,735.2 663.3 6,689.5
Persons 2001 204.0 3,970.5 113.3 2,160.0 886.0 280.8 2,937.6 1,196.4 11,748.6 2002 209.6 3,915.2 111.4 2,226.5 928.3 277.5 3,026.4 1,217.1 11,912.0 2003 218.4 4,252.0 117.1 2,352.1 993.2 298.4 3,315.1 1,297.6 12,844.0 2004 222.5 4,317.0 115.5 2,461.0 970.3 304.0 3,378.3 1,322.9 13,091.3 2005 225.1 4,429.6 115.3 2,516.8 1,006.7 307.0 3,402.4 1,326.9 13,329.8
Participation rate (%)
Males 2001 86.0 80.3 81.9 79.1 76.6 75.7 79.8 81.3 79.8 2002 88.8 77.8 78.6 77.3 79.6 77.1 79.5 80.3 78.7 2003 88.8 83.2 81.4 78.7 82.6 80.5 84.3 83.0 82.6 2004 88.6 82.5 83.2 80.9 79.1 80.9 85.3 86.0 83.0 2005 90.3 84.1 81.4 82.1 82.7 81.5 83.7 83.8 83.5
Females 2001 80.9 75.6 79.1 75.5 72.9 78.6 75.0 80.8 75.9 2002 83.1 74.2 79.2 78.6 76.0 74.9 77.6 81.6 77.0 2003 88.5 79.8 84.8 81.4 82.4 80.8 84.7 86.0 82.4 2004 87.8 81.5 82.3 81.5 81.1 81.9 84.9 83.7 82.6 2005 87.7 83.0 84.9 79.7 82.5 80.9 85.7 83.8 83.1
Persons 2001 83.4 77.9 80.5 77.3 74.7 77.2 77.4 81.0 77.8 2002 85.9 76.0 78.9 78.0 77.8 75.9 78.5 81.0 77.8 2003 88.6 81.5 83.0 80.1 82.5 80.7 84.5 84.5 82.5 2004 88.2 82.0 82.8 81.2 80.1 81.4 85.1 84.8 82.8 2005 89.0 83.5 83.0 80.9 82.6 81.2 84.7 83.8 83.3
(a) Relates to persons aged 15 years and over who participated in physical activity for exercise, recreation and sport over a 12-month period prior to interview in the respective year
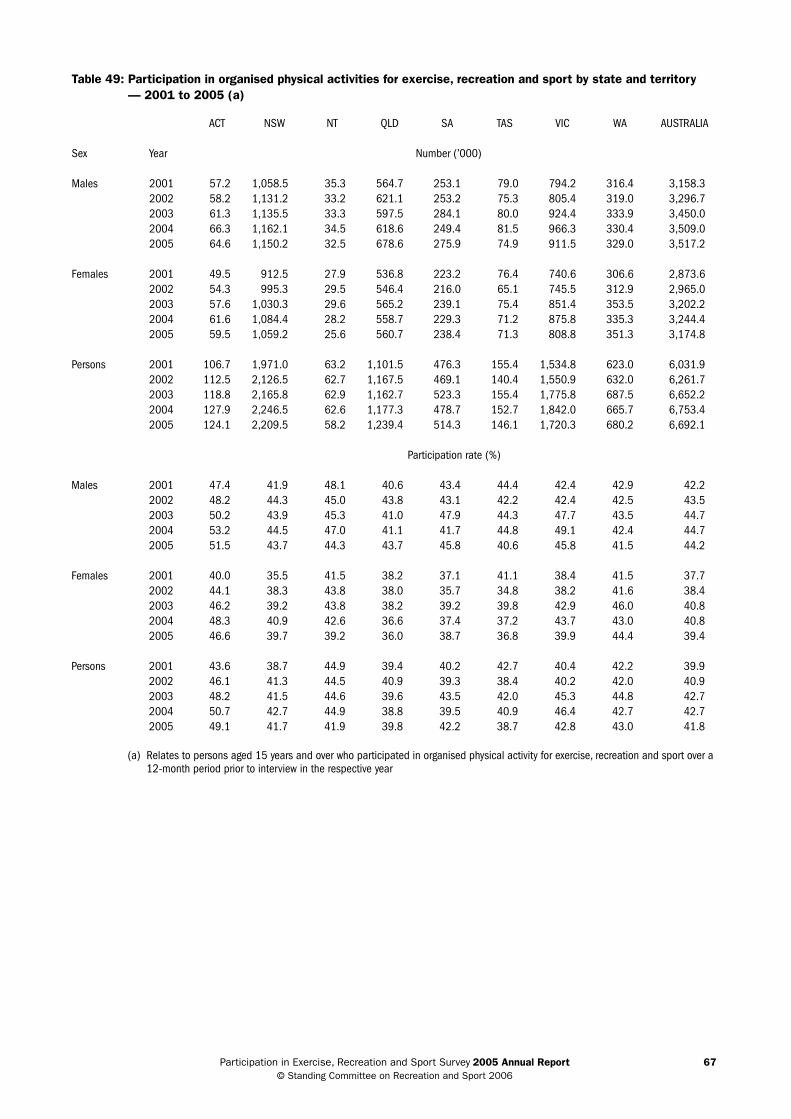
participation in exercise, recreation and sport survey 2005 Annual Report 67 © standing committee on recreation and sport 2006
Table 49: Participation in organised physical activities for exercise, recreation and sport by state and territory — 2001 to 2005 (a)
ACT NSW NT QLD SA TAS VIC WA AUSTRALIA
Sex Year Number (’000)
Males 2001 57.2 1,058.5 35.3 564.7 253.1 79.0 794.2 316.4 3,158.3 2002 58.2 1,131.2 33.2 621.1 253.2 75.3 805.4 319.0 3,296.7 2003 61.3 1,135.5 33.3 597.5 284.1 80.0 924.4 333.9 3,450.0 2004 66.3 1,162.1 34.5 618.6 249.4 81.5 966.3 330.4 3,509.0 2005 64.6 1,150.2 32.5 678.6 275.9 74.9 911.5 329.0 3,517.2
Females 2001 49.5 912.5 27.9 536.8 223.2 76.4 740.6 306.6 2,873.6 2002 54.3 995.3 29.5 546.4 216.0 65.1 745.5 312.9 2,965.0 2003 57.6 1,030.3 29.6 565.2 239.1 75.4 851.4 353.5 3,202.2 2004 61.6 1,084.4 28.2 558.7 229.3 71.2 875.8 335.3 3,244.4 2005 59.5 1,059.2 25.6 560.7 238.4 71.3 808.8 351.3 3,174.8
Persons 2001 106.7 1,971.0 63.2 1,101.5 476.3 155.4 1,534.8 623.0 6,031.9 2002 112.5 2,126.5 62.7 1,167.5 469.1 140.4 1,550.9 632.0 6,261.7 2003 118.8 2,165.8 62.9 1,162.7 523.3 155.4 1,775.8 687.5 6,652.2 2004 127.9 2,246.5 62.6 1,177.3 478.7 152.7 1,842.0 665.7 6,753.4 2005 124.1 2,209.5 58.2 1,239.4 514.3 146.1 1,720.3 680.2 6,692.1
Participation rate (%)
Males 2001 47.4 41.9 48.1 40.6 43.4 44.4 42.4 42.9 42.2 2002 48.2 44.3 45.0 43.8 43.1 42.2 42.4 42.5 43.5 2003 50.2 43.9 45.3 41.0 47.9 44.3 47.7 43.5 44.7 2004 53.2 44.5 47.0 41.1 41.7 44.8 49.1 42.4 44.7 2005 51.5 43.7 44.3 43.7 45.8 40.6 45.8 41.5 44.2
Females 2001 40.0 35.5 41.5 38.2 37.1 41.1 38.4 41.5 37.7 2002 44.1 38.3 43.8 38.0 35.7 34.8 38.2 41.6 38.4 2003 46.2 39.2 43.8 38.2 39.2 39.8 42.9 46.0 40.8 2004 48.3 40.9 42.6 36.6 37.4 37.2 43.7 43.0 40.8 2005 46.6 39.7 39.2 36.0 38.7 36.8 39.9 44.4 39.4
Persons 2001 43.6 38.7 44.9 39.4 40.2 42.7 40.4 42.2 39.9 2002 46.1 41.3 44.5 40.9 39.3 38.4 40.2 42.0 40.9 2003 48.2 41.5 44.6 39.6 43.5 42.0 45.3 44.8 42.7 2004 50.7 42.7 44.9 38.8 39.5 40.9 46.4 42.7 42.7 2005 49.1 41.7 41.9 39.8 42.2 38.7 42.8 43.0 41.8
(a) Relates to persons aged 15 years and over who participated in organised physical activity for exercise, recreation and sport over a 12-month period prior to interview in the respective year
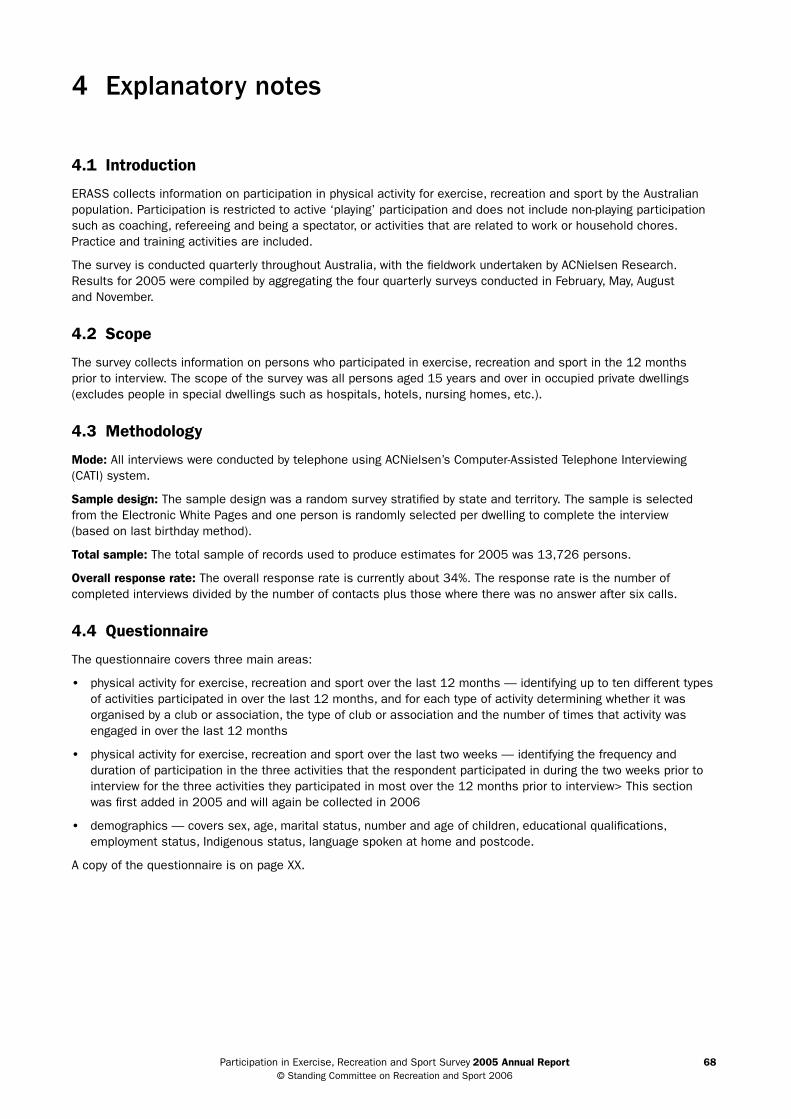
participation in exercise, recreation and sport survey 2005 Annual Report 68 © standing committee on recreation and sport 2006
4 Explanatory notes
4.1 Introduction
erass collects information on participation in physical activity for exercise, recreation and sport by the australian population. participation is restricted to active ‘playing’ participation and does not include non-playing participation such as coaching, refereeing and being a spectator, or activities that are related to work or household chores. practice and training activities are included.
the survey is conducted quarterly throughout australia, with the fieldwork undertaken by acnielsen research. results for 2005 were compiled by aggregating the four quarterly surveys conducted in February, May, august and november.
4.2 Scope
the survey collects information on persons who participated in exercise, recreation and sport in the 12 months prior to interview. the scope of the survey was all persons aged 15 years and over in occupied private dwellings (excludes people in special dwellings such as hospitals, hotels, nursing homes, etc.).
4.3 Methodology
Mode: all interviews were conducted by telephone using acnielsen’s computer-assisted telephone interviewing (cati) system.
Sample design: the sample design was a random survey stratified by state and territory. the sample is selected from the electronic White pages and one person is randomly selected per dwelling to complete the interview (based on last birthday method).
Total sample: the total sample of records used to produce estimates for 2005 was 13,726 persons.
Overall response rate: the overall response rate is currently about 34%. the response rate is the number of completed interviews divided by the number of contacts plus those where there was no answer after six calls.
4.4 Questionnaire
the questionnaire covers three main areas:
• physical activity for exercise, recreation and sport over the last 12 months — identifying up to ten different types of activities participated in over the last 12 months, and for each type of activity determining whether it was organised by a club or association, the type of club or association and the number of times that activity was engaged in over the last 12 months
• physical activity for exercise, recreation and sport over the last two weeks — identifying the frequency and duration of participation in the three activities that the respondent participated in during the two weeks prior to interview for the three activities they participated in most over the 12 months prior to interview> this section was first added in 2005 and will again be collected in 2006
• demographics — covers sex, age, marital status, number and age of children, educational qualifications, employment status, indigenous status, language spoken at home and postcode.
a copy of the questionnaire is on page xx.
participation in exercise, recreation and sport survey 2005 Annual Report 69 © standing committee on recreation and sport 2006
4.5 Comparability of the data
the survey was first conducted in 2001. this publication provides results from the fifth annual survey, which was conducted in 2005. the survey will also be conducted in 2006, which will allow a comparison of participation in physical activity for exercise, recreation and sport over a six-year period.
erass is not comparable with data collected through other surveys of participation in physical activity. in particular, the data cannot be directly compared with participation surveys conducted by the australian Bureau of statistics (for example, population survey Monitor) and by sweeney sports (sweeney research). this is due to differences in the scope, methodology and questionnaire design of the various surveys.
4.6 Standard errors and relative standard errors
since the estimates presented in the tables are based on information obtained from persons from a sample of households selected randomly by telephone number, they are subject to sampling variability; that is, they may differ from those that would have been produced if all households had been included in the survey.
one measure of the likely difference is given by the standard error (se), which indicates the extent to which an estimate might have varied by chance because only a sample of households was included. there are about two chances in three (67%) that a sample estimate will vary by less than one standard error from the number that would have been obtained if all households had been included, and about 19 chances in 20 (95%) that the difference will be less than two standard errors.
For example, if an estimate of 100,000 persons is provided for participating in a particular activity, then we are 67% confident that if we surveyed the entire australian population the result would be between 88,100 and 111,900. similarly, we would be 95% confident that, if we surveyed the entire australian population, the result would be between 76,200 and 123,800
another measure of the likely difference is the relative standard error (rse) that is obtained by expressing the standard error as a percentage of the estimate. the relative standard error is a useful measure in that it provides an indication of the relative accuracy of the estimate.
For the tables provided in this publication, only estimates with relative standard errors of less than 25% are considered sufficiently reliable for most purposes. However, estimates with relative standard errors between 25% and 50% have been included and are preceded by an asterisk (for example,*13.5) to indicate that they should be treated with caution and viewed as being merely indicative of the magnitude involved. estimates with relative standard errors greater than 50% are preceded by a double asterisk (for example, **3.6) and are subject to sampling error too high for most practical purposes.
the table on page xx gives the relative standard error cut-offs to be used when applying, if required, a single or double asterisk to the estimate. For example, for new south Wales an estimate between 9,083 and 28,973 should be followed by a single asterisk and used with caution, and an estimate less than 9,083 should be followed by a double asterisk and will be considered too unreliable for general use.
4.7 Significance testing
When differences are detected between statistics, it is important to test to determine if those perceived differences are statistically significant. For example, in nsW 42.7% and 41.7% of the population participated in organised physical activities for exercise, recreation and sport in 2004 and 2005 respectively. While on face value it may appear that this participation rate has decreased by one per cent between 2004 and 2005, statistical tests identify that there is not enough evidence to substantiate this. that is, the sample sizes are too small to reliably detect a difference of this size.
all comparisons between statistics have been tested for significant differences using applicable significance testing, with an alpha value of 0.05. the alpha value is a number between 0 and 1 that sets a cut-off for differences to be statistically significant. For tests where proportions are being compared, the Bonferroni correction was also applied.
the Bonferroni correction is used when several dependent or independent statistical tests are being performed simultaneously. this correction is required in these situations because while a given alpha value may be appropriate for each individual comparison, it is not appropriate for the set of all comparisons. in order to avoid a lot of spurious positives, the alpha value needs to be lowered to account for the number of comparisons being performed.
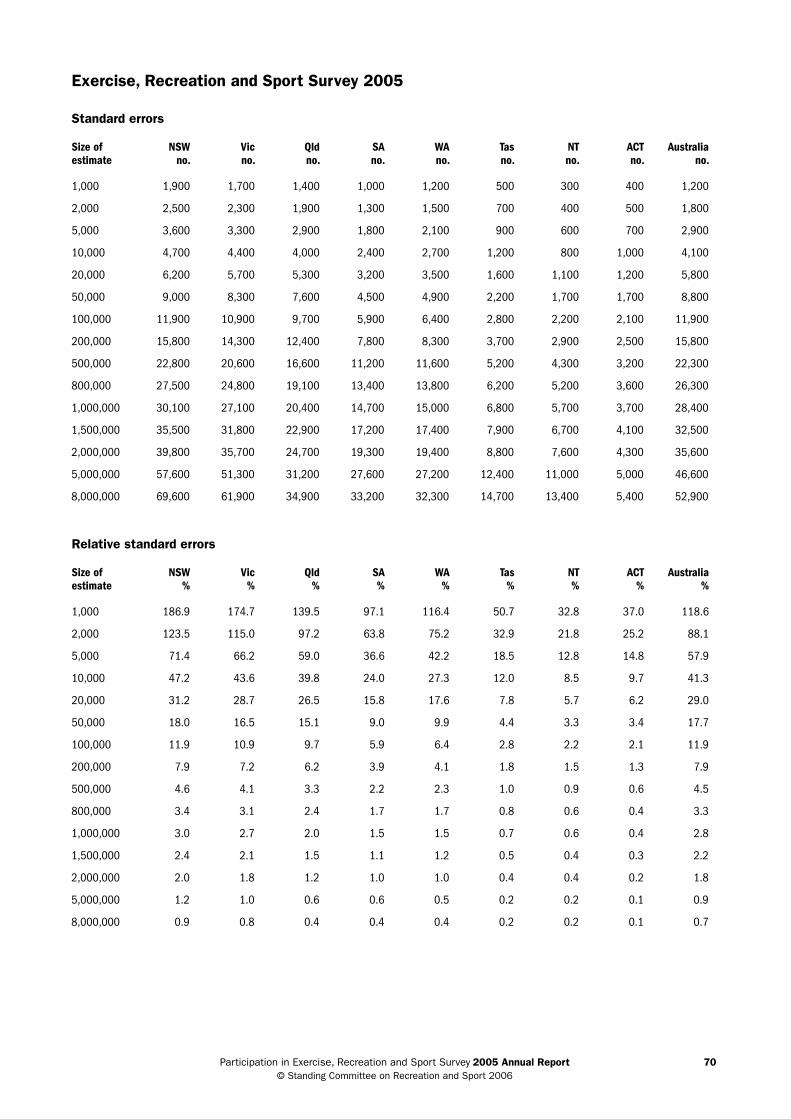
participation in exercise, recreation and sport survey 2005 Annual Report 70 © standing committee on recreation and sport 2006
Exercise, Recreation and Sport Survey 2005
Standard errors
Size ofestimate
NSWno.
Vicno.
Qldno.
SAno.
WAno.
Tasno.
NTno.
ACTno.
Australiano.
1,000 1,900 1,700 1,400 1,000 1,200 500 300 400 1,200
2,000 2,500 2,300 1,900 1,300 1,500 700 400 500 1,800
5,000 3,600 3,300 2,900 1,800 2,100 900 600 700 2,900
10,000 4,700 4,400 4,000 2,400 2,700 1,200 800 1,000 4,100
20,000 6,200 5,700 5,300 3,200 3,500 1,600 1,100 1,200 5,800
50,000 9,000 8,300 7,600 4,500 4,900 2,200 1,700 1,700 8,800
100,000 11,900 10,900 9,700 5,900 6,400 2,800 2,200 2,100 11,900
200,000 15,800 14,300 12,400 7,800 8,300 3,700 2,900 2,500 15,800
500,000 22,800 20,600 16,600 11,200 11,600 5,200 4,300 3,200 22,300
800,000 27,500 24,800 19,100 13,400 13,800 6,200 5,200 3,600 26,300
1,000,000 30,100 27,100 20,400 14,700 15,000 6,800 5,700 3,700 28,400
1,500,000 35,500 31,800 22,900 17,200 17,400 7,900 6,700 4,100 32,500
2,000,000 39,800 35,700 24,700 19,300 19,400 8,800 7,600 4,300 35,600
5,000,000 57,600 51,300 31,200 27,600 27,200 12,400 11,000 5,000 46,600
8,000,000 69,600 61,900 34,900 33,200 32,300 14,700 13,400 5,400 52,900
Relative standard errors
Size ofestimate
NSW%
Vic%
Qld%
SA%
WA%
Tas%
NT%
ACT%
Australia%
1,000 186.9 174.7 139.5 97.1 116.4 50.7 32.8 37.0 118.6
2,000 123.5 115.0 97.2 63.8 75.2 32.9 21.8 25.2 88.1
5,000 71.4 66.2 59.0 36.6 42.2 18.5 12.8 14.8 57.9
10,000 47.2 43.6 39.8 24.0 27.3 12.0 8.5 9.7 41.3
20,000 31.2 28.7 26.5 15.8 17.6 7.8 5.7 6.2 29.0
50,000 18.0 16.5 15.1 9.0 9.9 4.4 3.3 3.4 17.7
100,000 11.9 10.9 9.7 5.9 6.4 2.8 2.2 2.1 11.9
200,000 7.9 7.2 6.2 3.9 4.1 1.8 1.5 1.3 7.9
500,000 4.6 4.1 3.3 2.2 2.3 1.0 0.9 0.6 4.5
800,000 3.4 3.1 2.4 1.7 1.7 0.8 0.6 0.4 3.3
1,000,000 3.0 2.7 2.0 1.5 1.5 0.7 0.6 0.4 2.8
1,500,000 2.4 2.1 1.5 1.1 1.2 0.5 0.4 0.3 2.2
2,000,000 2.0 1.8 1.2 1.0 1.0 0.4 0.4 0.2 1.8
5,000,000 1.2 1.0 0.6 0.6 0.5 0.2 0.2 0.1 0.9
8,000,000 0.9 0.8 0.4 0.4 0.4 0.2 0.2 0.1 0.7
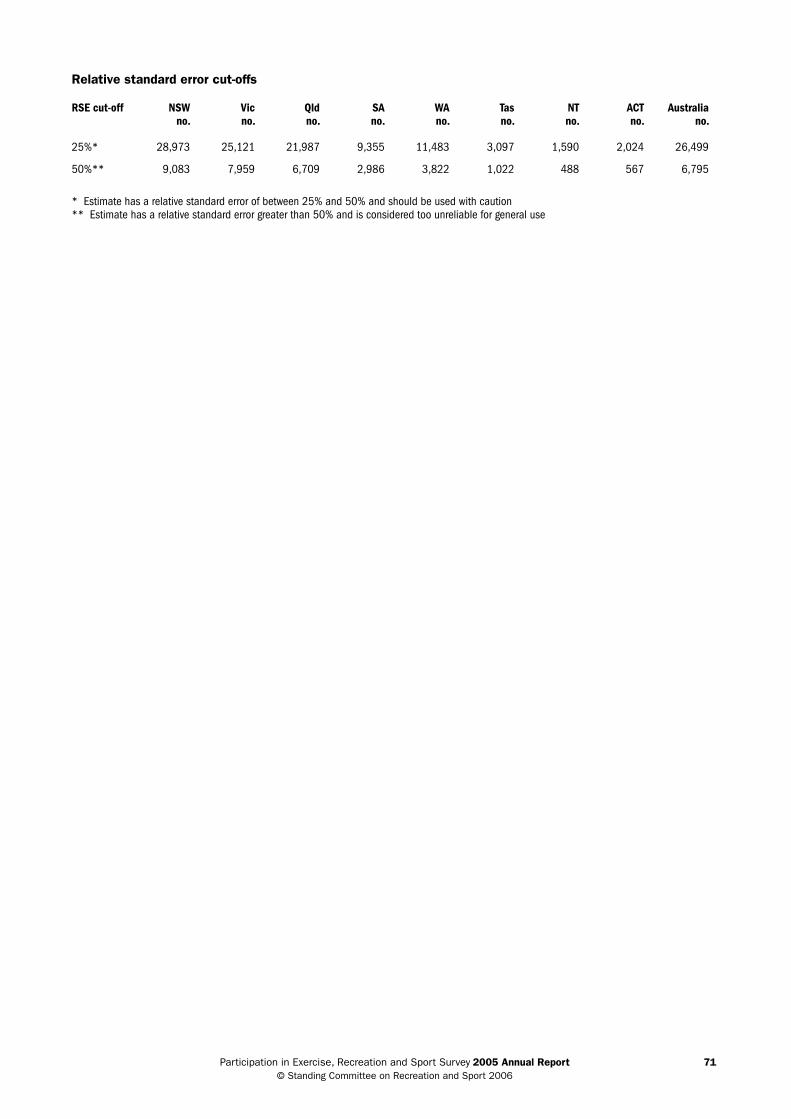
participation in exercise, recreation and sport survey 2005 Annual Report 71 © standing committee on recreation and sport 2006
Relative standard error cut-offs
RSE cut-off NSWno.
Vicno.
Qldno.
SAno.
WAno.
Tasno.
NTno.
ACTno.
Australiano.
25%* 28,973 25,121 21,987 9,355 11,483 3,097 1,590 2,024 26,499
50%** 9,083 7,959 6,709 2,986 3,822 1,022 488 567 6,795
* Estimate has a relative standard error of between 25% and 50% and should be used with caution** Estimate has a relative standard error greater than 50% and is considered too unreliable for general use
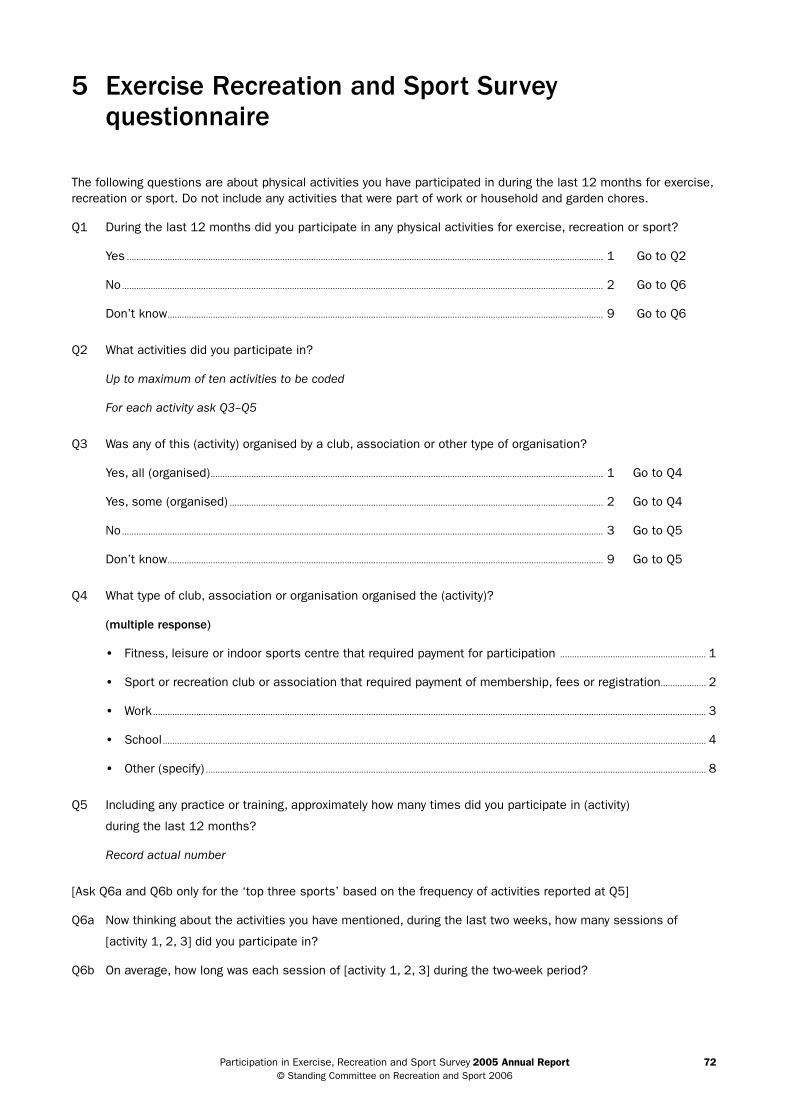
participation in exercise, recreation and sport survey 2005 Annual Report 72 © standing committee on recreation and sport 2006
5 Exercise Recreation and Sport Survey questionnaire
the following questions are about physical activities you have participated in during the last 12 months for exercise, recreation or sport. do not include any activities that were part of work or household and garden chores.
Q1 during the last 12 months did you participate in any physical activities for exercise, recreation or sport?
Yes ....................................................................................................................................................................................................... 1 Go to Q2
no ......................................................................................................................................................................................................... 2 Go to Q6
don’t know ...................................................................................................................................................................................... 9 Go to Q6
Q2 What activities did you participate in?
Up to maximum of ten activities to be coded
For each activity ask Q3–Q5
Q3 Was any of this (activity) organised by a club, association or other type of organisation?
Yes, all (organised) .................................................................................................................................................................... 1 Go to Q4
Yes, some (organised) ............................................................................................................................................................ 2 Go to Q4
no ......................................................................................................................................................................................................... 3 Go to Q5
don’t know ...................................................................................................................................................................................... 9 Go to Q5
Q4 What type of club, association or organisation organised the (activity)?
(multiple response)
• Fitness, leisure or indoor sports centre that required payment for participation ............................................................. 1
• sport or recreation club or association that required payment of membership, fees or registration ................... 2
• Work ....................................................................................................................................................................................................................................... 3
• school ................................................................................................................................................................................................................................... 4
• other (specify) ................................................................................................................................................................................................................. 8
Q5 including any practice or training, approximately how many times did you participate in (activity)
during the last 12 months?
Record actual number
[ask Q6a and Q6b only for the ‘top three sports’ based on the frequency of activities reported at Q5]
Q6a now thinking about the activities you have mentioned, during the last two weeks, how many sessions of
[activity 1, 2, 3] did you participate in?
Q6b on average, how long was each session of [activity 1, 2, 3] during the two-week period?

participation in exercise, recreation and sport survey 2005 Annual Report 73 © standing committee on recreation and sport 2006
Q7 sex of respondent
Male ............................................................................................................................................................................................................................................... 1
Female .......................................................................................................................................................................................................................................... 2
Q8 What is your current age?
(record age)
Q9 Which of the following best describes your current marital status? (read out)
Married ......................................................................................................................................................................................................................................... 1
de facto ....................................................................................................................................................................................................................................... 2
separated ................................................................................................................................................................................................................................... 3
divorced....................................................................................................................................................................................................................................... 4
Widowed ...................................................................................................................................................................................................................................... 5
never married .......................................................................................................................................................................................................................... 6
refused ....................................................................................................................................................................................................................................... 7
Q10 do you have any children under 18 years of age?
Yes ....................................................................................................................................................................................................... 1 Go to Q10
no ......................................................................................................................................................................................................... 2 Go to Q12
Q11 How many of these children are living with you? (record actual number. if zero then go to Q12)
Q12 What is the age of each of these children who are under 18 years of age and living with you?
(record actual age of each child)
Q13 What is the highest educational qualification you have completed?
University degree or higher (including postgraduate diploma) ................................................................................................................ 1
Undergraduate diploma or associate diploma ................................................................................................................................................... 2
certificate, trade qualification or apprenticeship ............................................................................................................................................. 3
Highest level of secondary school ............................................................................................................................................................................. 4
did not complete highest level of school .............................................................................................................................................................. 5
never went to school .......................................................................................................................................................................................................... 6
still at secondary school.................................................................................................................................................................................................. 7
other (specify) ......................................................................................................................................................................................................................... 8
refused ....................................................................................................................................................................................................................................... 9

participation in exercise, recreation and sport survey 2005 Annual Report 74 © standing committee on recreation and sport 2006
Q14 do you have a full-time or part-time job of any kind?
Yes ....................................................................................................................................................................................................... 1 Go to Q14
no ......................................................................................................................................................................................................... 2 Go to Q16
Q15 do you have more than one job?
Yes .................................................................................................................................................................................................................................................. 1
no ................................................................................................................................................................................................................................................... 2
Q16 How many hours a week do you usually work (in all jobs)?
Go to Q17
Q17 did you look for work at any time in the last four weeks?
Yes .................................................................................................................................................................................................................................................. 1
no ................................................................................................................................................................................................................................................... 2
Q18 Which language or languages do you speak at home? (please indicate all languages spoken)
Q19 are you of aboriginal or torres strait islander origin?
Q20 What is the postcode of the suburb/area where you live? (record postcode)
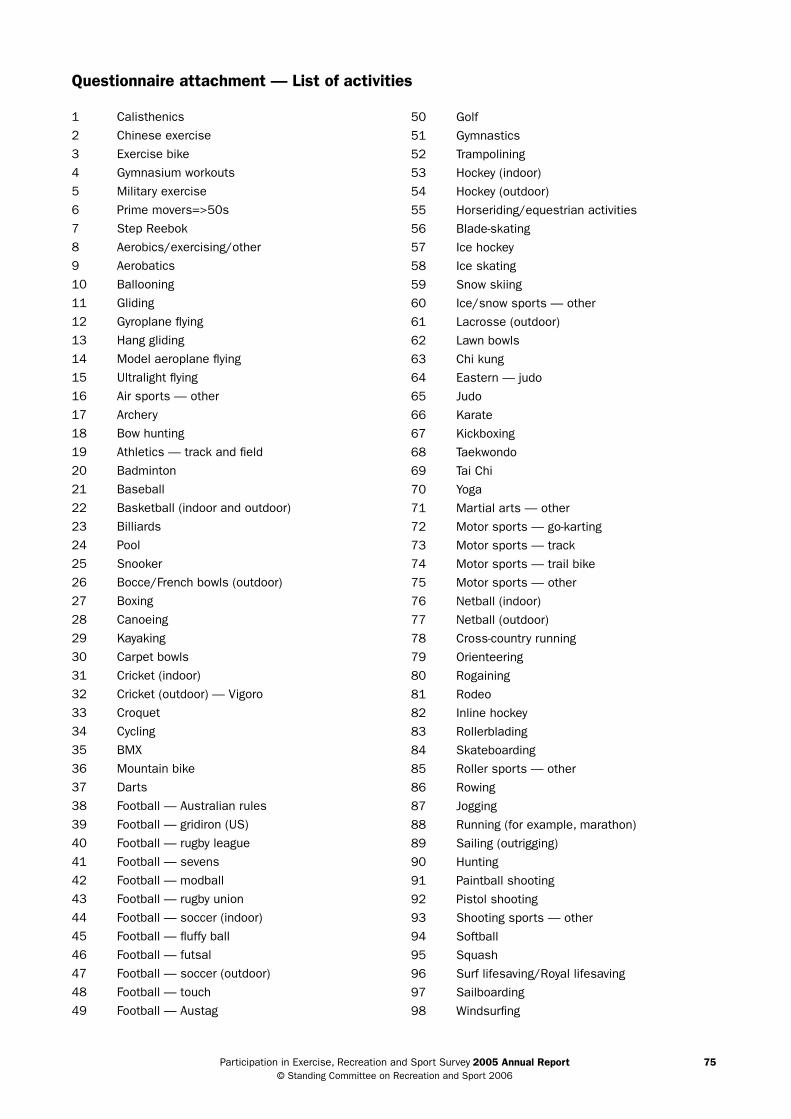
participation in exercise, recreation and sport survey 2005 Annual Report 75 © standing committee on recreation and sport 2006
1 calisthenics
2 chinese exercise
3 exercise bike
4 Gymnasium workouts
5 Military exercise
6 prime movers=>50s
7 step reebok
8 aerobics/exercising/other
9 aerobatics
10 Ballooning
11 Gliding
12 Gyroplane flying
13 Hang gliding
14 Model aeroplane flying
15 Ultralight flying
16 air sports — other
17 archery
18 Bow hunting
19 athletics — track and field
20 Badminton
21 Baseball
22 Basketball (indoor and outdoor)
23 Billiards
24 pool
25 snooker
26 Bocce/French bowls (outdoor)
27 Boxing
28 canoeing
29 Kayaking
30 carpet bowls
31 cricket (indoor)
32 cricket (outdoor) — Vigoro
33 croquet
34 cycling
35 BMx
36 Mountain bike
37 darts
38 Football — australian rules
39 Football — gridiron (Us)
40 Football — rugby league
41 Football — sevens
42 Football — modball
43 Football — rugby union
44 Football — soccer (indoor)
45 Football — fluffy ball
46 Football — futsal
47 Football — soccer (outdoor)
48 Football — touch
49 Football — austag
50 Golf
51 Gymnastics
52 trampolining
53 Hockey (indoor)
54 Hockey (outdoor)
55 Horseriding/equestrian activities
56 Blade-skating
57 ice hockey
58 ice skating
59 snow skiing
60 ice/snow sports — other
61 Lacrosse (outdoor)
62 Lawn bowls
63 chi kung
64 eastern — judo
65 Judo
66 Karate
67 Kickboxing
68 taekwondo
69 tai chi
70 Yoga
71 Martial arts — other
72 Motor sports — go-karting
73 Motor sports — track
74 Motor sports — trail bike
75 Motor sports — other
76 netball (indoor)
77 netball (outdoor)
78 cross-country running
79 orienteering
80 rogaining
81 rodeo
82 inline hockey
83 rollerblading
84 skateboarding
85 roller sports — other
86 rowing
87 Jogging
88 running (for example, marathon)
89 sailing (outrigging)
90 Hunting
91 paintball shooting
92 pistol shooting
93 shooting sports — other
94 softball
95 squash
96 surf lifesaving/royal lifesaving
97 sailboarding
98 Windsurfing
Questionnaire attachment — List of activities

participation in exercise, recreation and sport survey 2005 Annual Report 76 © standing committee on recreation and sport 2006
99 surfing
100 surf sports — other
101 diving (board)
102 swimming
103 table tennis
104 tennis (outdoor)
105 tenpin bowling
106 triathlons
107 Volleyball (indoor) — rebound
108 newcombe ball
109 Volleyball (outdoor)
110 Jet skiing
111 powerboating
112 Waterskiing
113 Wrestling
114 tennis (indoor)
115 Lacrosse (indoor)
116 canoe polo
117 Bodybuilding
118 circuits
119 power team
120 Weight training for fitness — other
121 Ballet
122 Boot scooting
123 dancing — other
124 Fishing
125 electric light cricket
126 Wheelchair ice hockey
127 scuba diving
128 Water polo
129 dog racing
130 Walking — bush
131 Walking — other (specify)
133 abseiling
134 caving
135 rock climbing
136 Handball
137 Fencing
138 Gorilla ball
139 racquet ball
140 Ultimate frisbee
141 Gaelic football
142 Horseracing (strapping)
143 teeball (t-ball)
144 Boomerang throwing
145 Water volleyball
146 Woodchopping
147 dog shows
148 sheepdog trials
149 Winter olympics
150 Marching
151 aquarobics
152 Korfball
153 Underwater hockey
154 sofcrosse
155 commonwealth Games
156 royal tennis
157 Broom ball
158 polocrosse
159 Leader ball
160 pigeon racing
161 Weight-lifting (competition)
162 play
163 putt-putt golf
164 Grockey
165 other activities (specify)
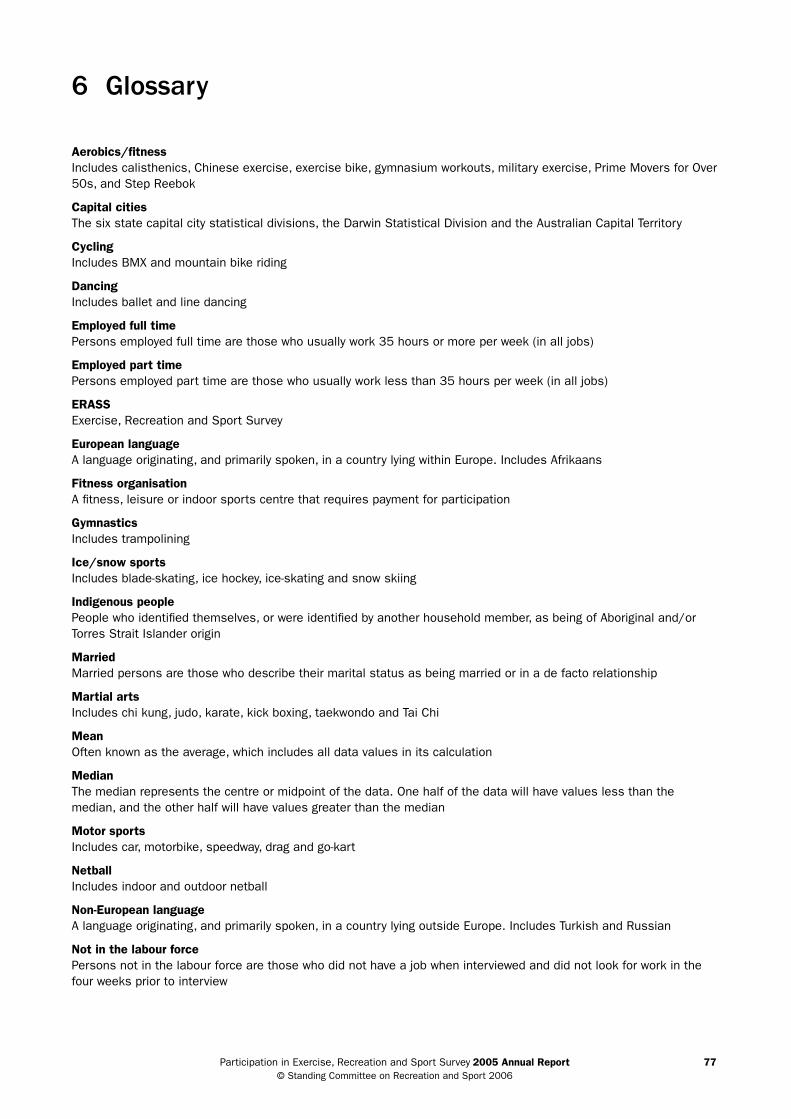
participation in exercise, recreation and sport survey 2005 Annual Report 77 © standing committee on recreation and sport 2006
6 Glossary
Aerobics/fitness includes calisthenics, chinese exercise, exercise bike, gymnasium workouts, military exercise, prime Movers for over 50s, and step reebok
Capital cities the six state capital city statistical divisions, the darwin statistical division and the australian capital territory
Cycling includes BMx and mountain bike riding
Dancing includes ballet and line dancing
Employed full time persons employed full time are those who usually work 35 hours or more per week (in all jobs)
Employed part time persons employed part time are those who usually work less than 35 hours per week (in all jobs)
ERASS exercise, recreation and sport survey
European language a language originating, and primarily spoken, in a country lying within europe. includes afrikaans
Fitness organisation a fitness, leisure or indoor sports centre that requires payment for participation
Gymnastics includes trampolining
Ice/snow sports includes blade-skating, ice hockey, ice-skating and snow skiing
Indigenous people people who identified themselves, or were identified by another household member, as being of aboriginal and/or torres strait islander origin
Married Married persons are those who describe their marital status as being married or in a de facto relationship
Martial arts includes chi kung, judo, karate, kick boxing, taekwondo and tai chi
Mean often known as the average, which includes all data values in its calculation
Median the median represents the centre or midpoint of the data. one half of the data will have values less than the median, and the other half will have values greater than the median
Motor sports includes car, motorbike, speedway, drag and go-kart
Netball includes indoor and outdoor netball
Non-European language a language originating, and primarily spoken, in a country lying outside europe. includes turkish and russian
Not in the labour force persons not in the labour force are those who did not have a job when interviewed and did not look for work in the four weeks prior to interview
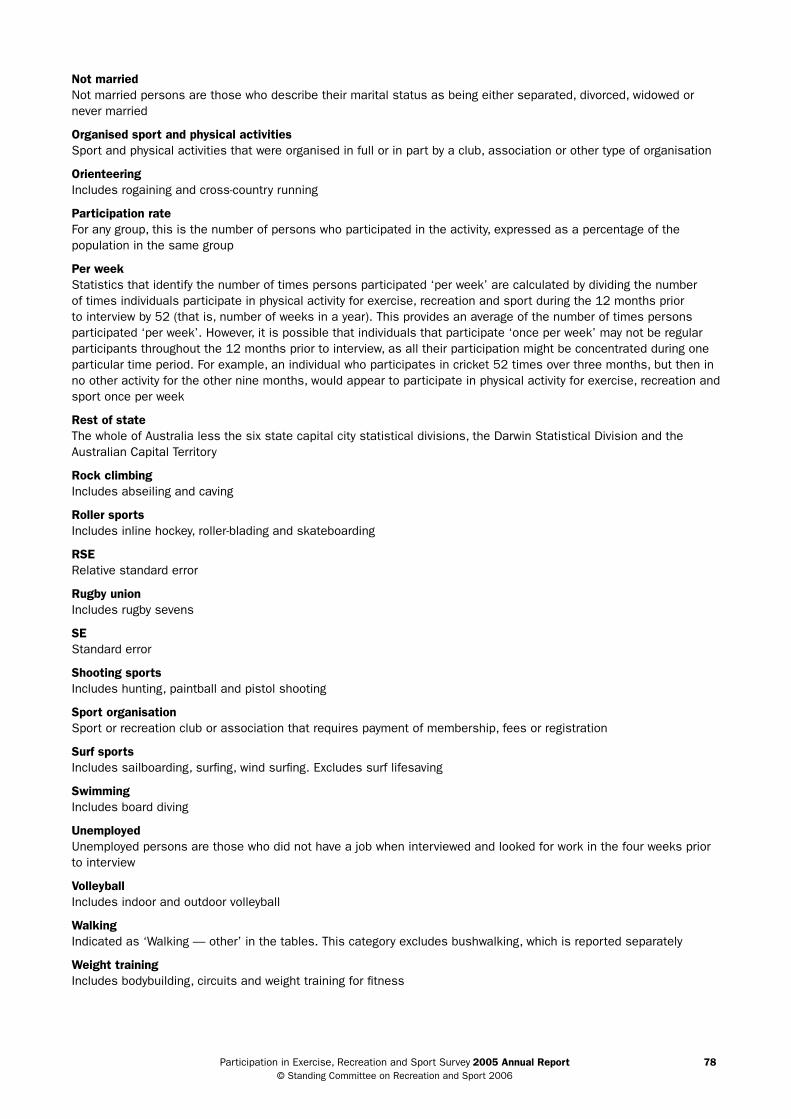
participation in exercise, recreation and sport survey 2005 Annual Report 78 © standing committee on recreation and sport 2006
Not married not married persons are those who describe their marital status as being either separated, divorced, widowed or never married
Organised sport and physical activities sport and physical activities that were organised in full or in part by a club, association or other type of organisation
Orienteering includes rogaining and cross-country running
Participation rate For any group, this is the number of persons who participated in the activity, expressed as a percentage of the population in the same group
Per week statistics that identify the number of times persons participated ‘per week’ are calculated by dividing the number of times individuals participate in physical activity for exercise, recreation and sport during the 12 months prior to interview by 52 (that is, number of weeks in a year). this provides an average of the number of times persons participated ‘per week’. However, it is possible that individuals that participate ‘once per week’ may not be regular participants throughout the 12 months prior to interview, as all their participation might be concentrated during one particular time period. For example, an individual who participates in cricket 52 times over three months, but then in no other activity for the other nine months, would appear to participate in physical activity for exercise, recreation and sport once per week
Rest of state the whole of australia less the six state capital city statistical divisions, the darwin statistical division and the australian capital territory
Rock climbing includes abseiling and caving
Roller sports includes inline hockey, roller-blading and skateboarding
RSE relative standard error
Rugby union includes rugby sevens
SE standard error
Shooting sports includes hunting, paintball and pistol shooting
Sport organisation sport or recreation club or association that requires payment of membership, fees or registration
Surf sports includes sailboarding, surfing, wind surfing. excludes surf lifesaving
Swimming includes board diving
Unemployed Unemployed persons are those who did not have a job when interviewed and looked for work in the four weeks prior to interview
Volleyball includes indoor and outdoor volleyball
Walking indicated as ‘Walking — other’ in the tables. this category excludes bushwalking, which is reported separately
Weight training includes bodybuilding, circuits and weight training for fitness
participation in exercise, recreation and sport survey 2005 Annual Report 79 © standing committee on recreation and sport 2006
7 References
acnielsen 2006, ACNielsen Panorama, acnielsen, sydney.
australian Bureau of statistics 2002, National Aboriginal and Torres Strait Islander Social Survey, cat. no. 4714.0, aBs, canberra.
australian Bureau of statistics 2006a, ‘the aBs and indigenous statistics theme page’, aBs, canberra, viewed 15 august 2006, www.abs.gov.au.
australian Bureau of statistics 2006b, 2006 Year Book Australia, cat. no. 1301.0, aBs, canberra.
participation in exercise, recreation and sport survey 2005 Annual Report 80 © standing committee on recreation and sport 2006
8 Contacts
For more information about the survey, please contact:
research and corporate planningaustralian sports commissionpo Box 176Belconnen act 2616tel: (02) 6214 1111email: [email protected] Web site: www.ausport.gov.au
or contact your state or territory government agency responsible for sport and recreation:
Australian Capital Territorysport and recreation acttel: (02) 6207 2111
New South Walesnew south Wales sport and recreationtel: (02) 9006 3761
Northern Territorydivision of sport and recreationtel: (08) 8982 2325
Queenslandsport and recreation Queenslandtel: (07) 3237 0098
South Australiaoffice for recreation and sporttel: (08) 8416 6677
Tasmaniasport and recreation tasmaniatel: (03) 6233 5627
Victoriasport and recreation Victoriatel: (03) 9208 3333
Western Australiadepartment of sport and recreationtel: (08) 9492 9700