ericsson capitalmarkets day 2018 · highly scalable, cost competitive, modular platforms offering...
TRANSCRIPT

EricssonCapital MarketsDay 2018
November 8, 2018New York

Trends, strategy, performance and next step
Peter Nyquist
VP Investor Relations

Safe harbour statement
This presentation contains forward-looking statements. Such statements are based on our current expectations and are subject to risks and uncertainties that could materially
affect our business and results. Please read our earnings reports and our most recent annual report for a better understanding of these risks and uncertainties and please see
the last page in this presentation for further information about forward-looking statements. Any forward-looking statements made during this presentation speaks
only as of the date of this presentation and Ericsson expressly disclaim a duty to provide updates to these forward-looking statements, and the estimates and assumptions
associated with them.
Ericsson Internal | 2018-02-21© Telefonaktiebolaget LM Ericsson 2018 | Ericsson Capital Markets Day 2018, Nov 8 | Page 4
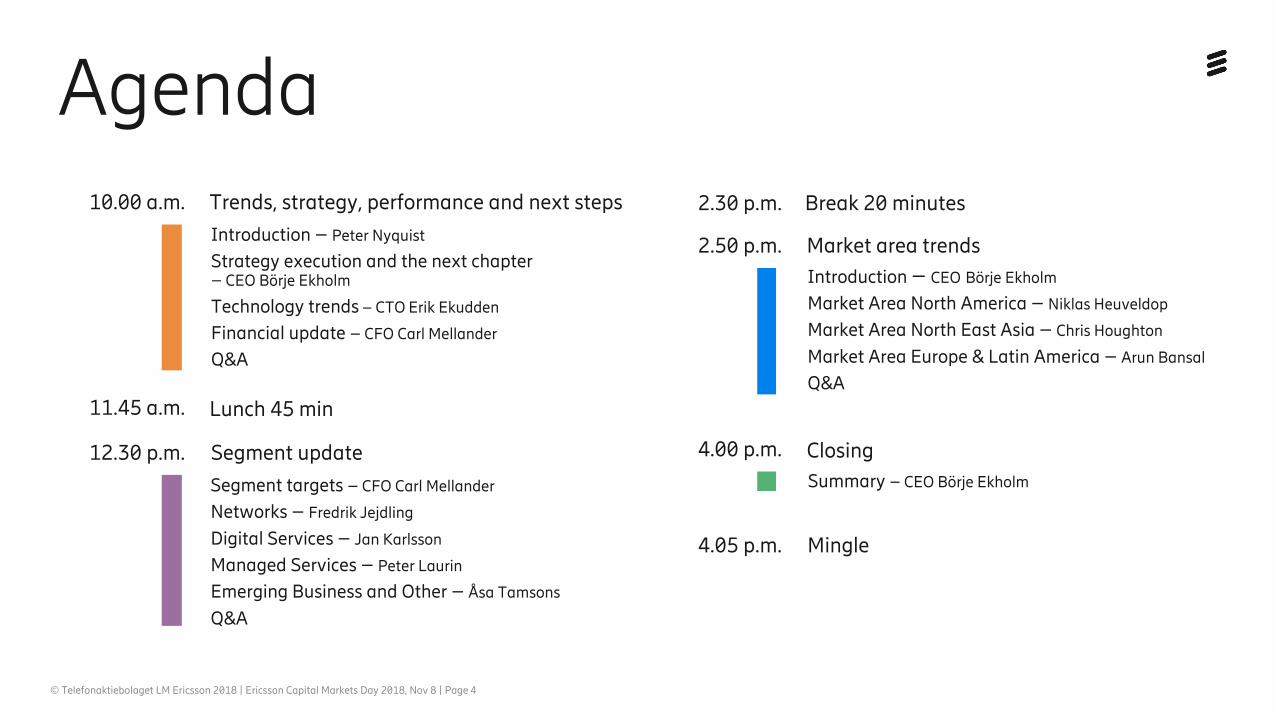
Agenda10.00 a.m.
11.45 a.m.
12.30 p.m.
2.30 p.m.
2.50 p.m.
4.00 p.m.
Trends, strategy, performance and next steps
Introduction – Peter Nyquist
Strategy execution and the next chapter– CEO Börje Ekholm
Technology trends – CTO Erik Ekudden
Financial update – CFO Carl Mellander
Q&A
Lunch 45 min
Segment update
Segment targets – CFO Carl Mellander
Networks – Fredrik Jejdling
Digital Services – Jan Karlsson
Managed Services – Peter Laurin
Emerging Business and Other – Åsa Tamsons
Q&A
Break 20 minutes
Market area trendsIntroduction – CEO Börje Ekholm
Market Area North America – Niklas Heuveldop
Market Area North East Asia – Chris Houghton
Market Area Europe & Latin America – Arun Bansal
Q&A
ClosingSummary – CEO Börje Ekholm
4.05 p.m. Mingle


Strategy execution and the next chapter
Börje Ekholm President and CEO

Ericsson Internal | 2018-02-21© Telefonaktiebolaget LM Ericsson 2018 | Ericsson Capital Markets Day 2018, Nov 8 | Page 7
What we will cover today
Our turnaround
Market opportunity
Growth
Targets

Ericsson Internal | 2018-02-21© Telefonaktiebolaget LM Ericsson 2018 | Ericsson Capital Markets Day 2018, Nov 8 | Page 8
What we will cover today
Our turnaround
Market opportunity
Growth
Targets

Ericsson Internal | 2018-02-21© Telefonaktiebolaget LM Ericsson 2018 | Ericsson Capital Markets Day 2018, Nov 8 | Page 9
Creating a strong foundation
Stability and profitability Technology
leadership

Ericsson Internal | 2018-02-21© Telefonaktiebolaget LM Ericsson 2018 | Ericsson Capital Markets Day 2018, Nov 8 | Page 10
Our turnaround plan
Stabilize& simplify
Invest& grow
Simplified structure
Accelerated cost out – SEK 10 b.
Portfolio review
Contract review
Digital Services turnaround
Invest in R&D for technology and cost leadership
Selective market expansion in Networks
Scale in Emerging Businesses
2017 2018 2019 2020
Compliance program accelerated
25K HC reduction + delayering
59 of 87 contracts addressed
6K automations implemented
4K+ R&D engineers
26% growth in IoT SIMs
Improved cash position +SEK 11 b.
74% hit rate on targeted Networks contracts
This slide contains forward-looking statements. Actual result may be materially different.
Ericsson Internal | 2018-02-21© Telefonaktiebolaget LM Ericsson 2018 | Ericsson Capital Markets Day 2018, Nov 8 | Page 11
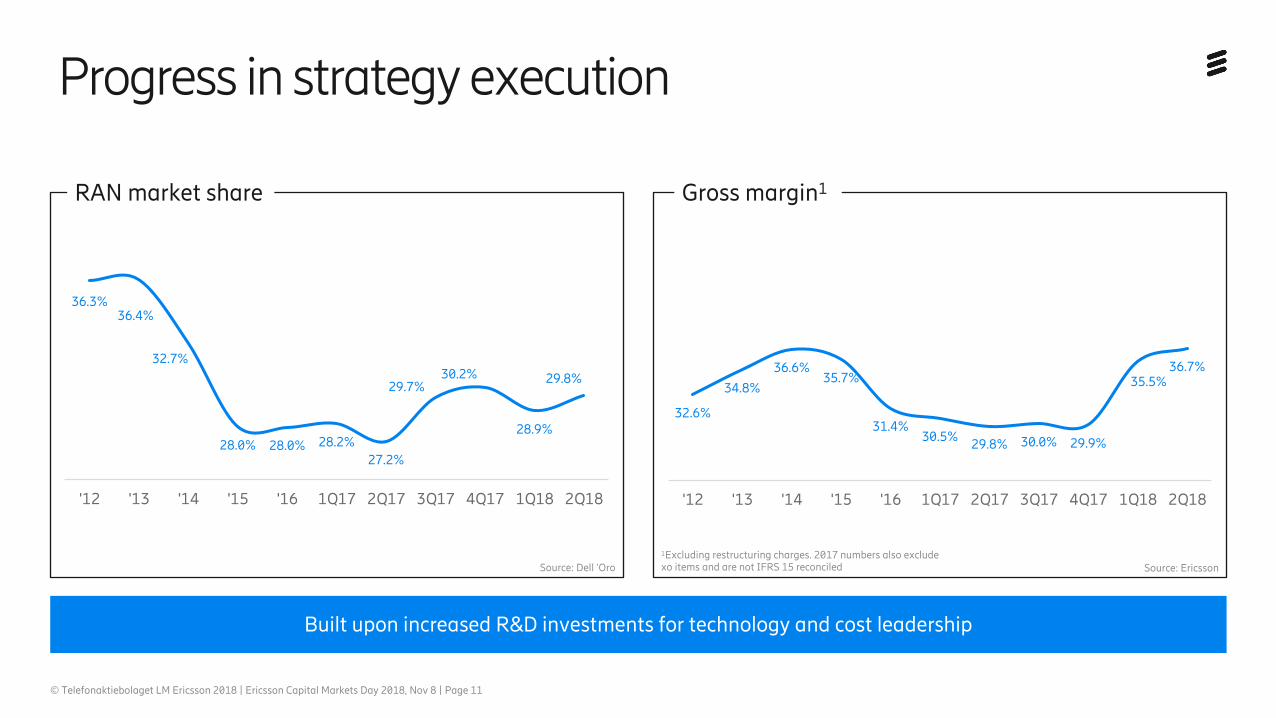
Progress in strategy execution
Built upon increased R&D investments for technology and cost leadership
RAN market share Gross margin1
36.3%36.4%
32.7%
28.0% 28.0% 28.2%27.2%
29.7%30.2%
28.9%
29.8%
'12 '13 '14 '15 '16 1Q17 2Q17 3Q17 4Q17 1Q18 2Q18
32.6%
34.8%
36.6%35.7%
31.4%30.5% 29.8% 30.0% 29.9%
35.5%36.7%
'12 '13 '14 '15 '16 1Q17 2Q17 3Q17 4Q17 1Q18 2Q18
Source: Dell ’Oro1Excluding restructuring charges. 2017 numbers also excludexo items and are not IFRS 15 reconciled Source: Ericsson

Ericsson Internal | 2018-02-21© Telefonaktiebolaget LM Ericsson 2018 | Ericsson Capital Markets Day 2018, Nov 8 | Page 12
Returned to growth
Q1 15 Q2 15 Q3 15 Q4 15 Q1 16 Q2 16 Q3 16 Q4 16 Q1 17 Q2 17 Q3 17 Q4 17 Q1 18 Q2 18 Q3 18
Net sales adjusted for comparable units and currency Net sales as reported
Ericsson Internal | 2018-02-21© Telefonaktiebolaget LM Ericsson 2018 | Ericsson Capital Markets Day 2018, Nov 8 | Page 13
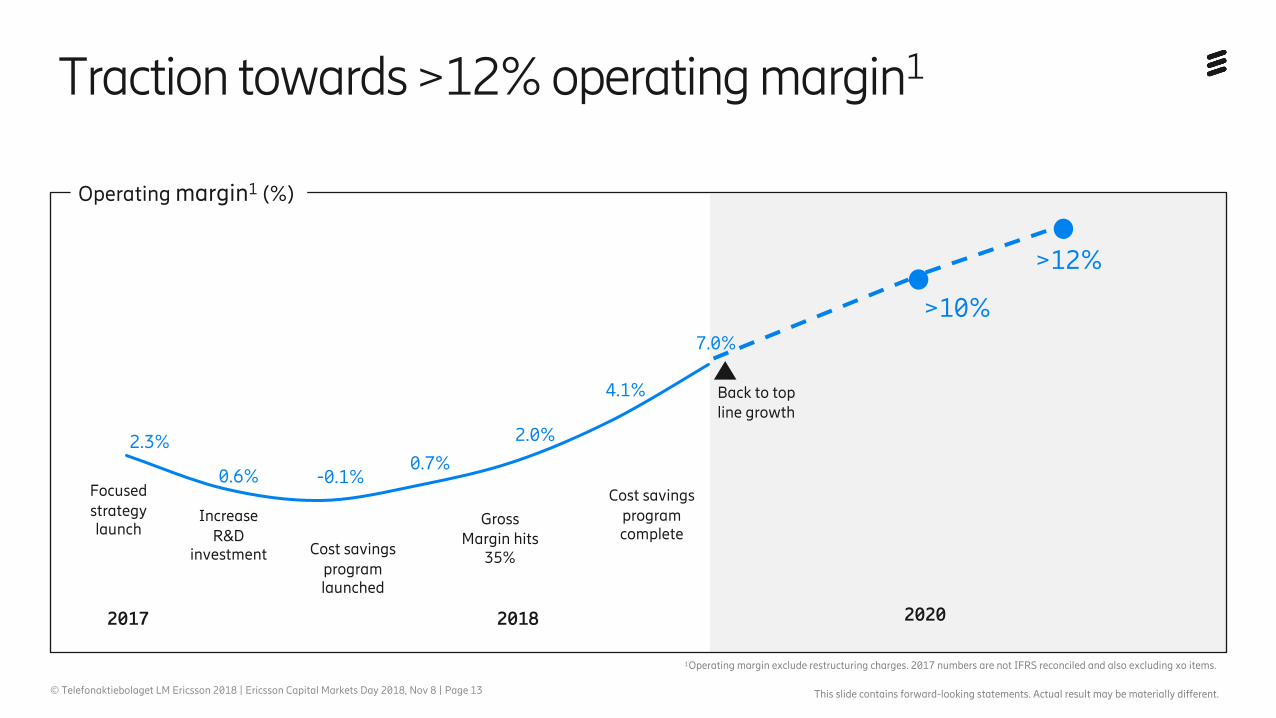
Operating margin1 (%)
2020
>10%
>12%
Traction towards >12% operating margin1
Back to top line growth
1Operating margin exclude restructuring charges. 2017 numbers are not IFRS reconciled and also excluding xo items.
20182017
Focused strategy launch
Cost savings program launched
Increase R&D
investment
Gross Margin hits
35%
Cost savings program complete
This slide contains forward-looking statements. Actual result may be materially different.
2.3%
0.6% -0.1%0.7%
2.0%
4.1%
7.0%

Ericsson Internal | 2018-02-21© Telefonaktiebolaget LM Ericsson 2018 | Ericsson Capital Markets Day 2018, Nov 8 | Page 14
NetworksHighly scalable, cost competitive, modular platforms offering lowest total cost of ownership, best user experience & smooth network transformation to 5G
Focused strategy remains
Empowering an intelligent, sustainableand connected world.
Technology leadership Product-led solutions Global skill & scale
Enabling the full value of connectivity for service providers.
Emerging BusinessPursue new business opportunities e.g. within IoT and Industry 4.0, foster an innovation culture and invest in promising incubation opportunities
Managed ServicesProviding superior customer experience and cost performance led by automation and AI driven operations and optimization
Digital ServicesTCO efficient solutions for programmable 4G and 5G core networks, automated operations and digital engagements
Relentless efficiency End-customer experience New revenue streams
Foundation:
Purpose and vision Mission
Our customers’ needs
Ericsson Internal | 2018-02-21© Telefonaktiebolaget LM Ericsson 2018 | Ericsson Capital Markets Day 2018, Nov 8 | Page 15
What we will cover today
Our turnaround
Market opportunity
Growth
Targets
Ericsson Internal | 2018-02-21© Telefonaktiebolaget LM Ericsson 2018 | Ericsson Capital Markets Day 2018, Nov 8 | Page 16
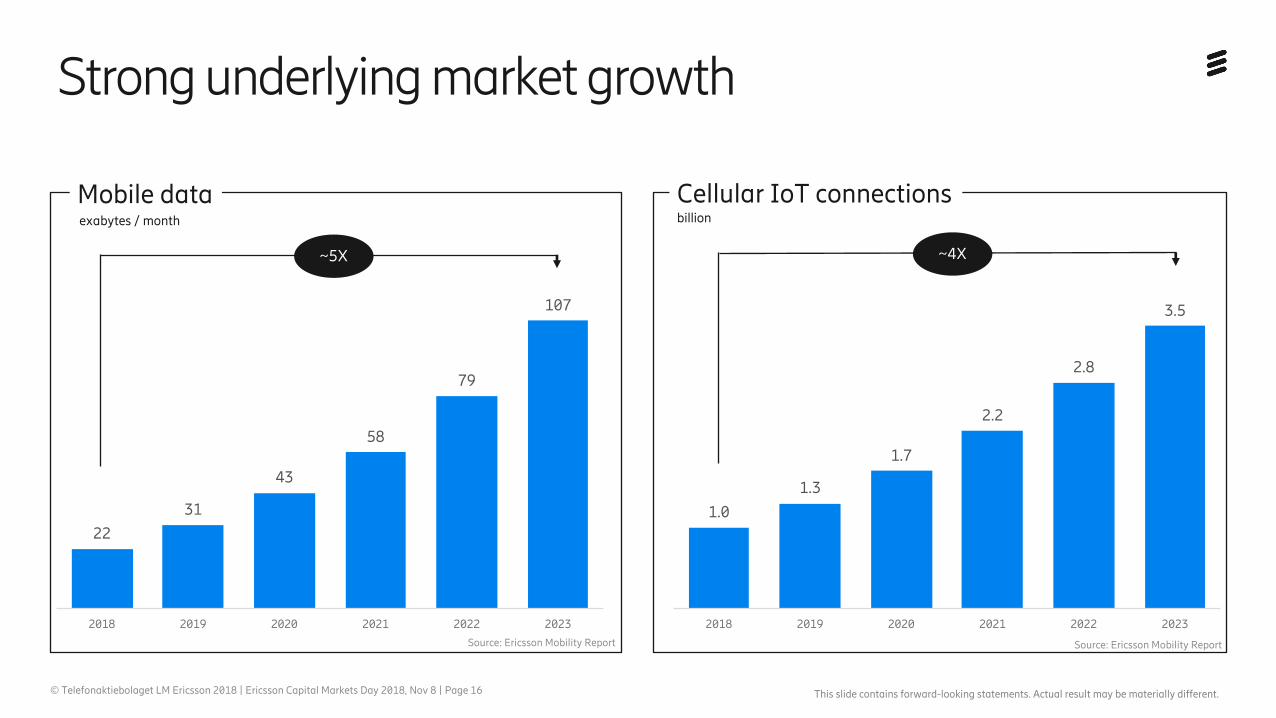
Strong underlying market growth
Source: Ericsson Mobility Report
Cellular IoT connections
Source: Ericsson Mobility Report
~5X
billionexabytes / month
This slide contains forward-looking statements. Actual result may be materially different.
1.0
1.3
1.7
2.2
2.8
3.5
2018 2019 2020 2021 2022 2023
22
31
43
58
79
107
2018 2019 2020 2021 2022 2023
Mobile data
~4X

Ericsson Internal | 2018-02-21© Telefonaktiebolaget LM Ericsson 2018 | Ericsson Capital Markets Day 2018, Nov 8 | Page 17
Focused strategy creates value for customers
30%Reduction in critical incidents despite tripled number of software upgrades
90%Reduction in customer supportesclated to Tier 2
10%Increase in ARPU, despite flat market, from network modernization
50%Reduction in energy consumption from footprint and operations optimization
86%Reduction in average deploymenttime for new software
210%ROI in year 1 for an IoT based factory maitenance system
Relentless efficiency End customer experience New revenue streams
Managed Services Digital Services Networks
Networks Digital Services Emerging Business and Other

Ericsson Internal | 2018-02-21© Telefonaktiebolaget LM Ericsson 2018 | Ericsson Capital Markets Day 2018, Nov 8 | Page 18
Technology shifts create market opportunity
$0
$10
$20
$30
$40
2012 2014 2016 2018 2020 2022
2G 3G 4G 5G
$0
$1
$2
$3
$4
$5
2017 2018 2019 2020 2021 2022 2023
Non-Virtualized Virtualized
Core Networking TAM1
USD b.
RAN TAM1
USD b.
Cloud and Edge AI and Automation
Yearly savings to CSPs2
from analytics, AI, automation
Source: Dell ’OroSource: IHS, Dell ’Oro
Network Mgmt Assurance
Revenue Mgmt Workforce Mgmt
Other
474USD b.
per year
Source: Gartner
5G and IoT
1TAM: Total addressable market2CSP: Communication service providers
This slide contains forward-looking statements. Actual result may be materially different.

Ericsson Internal | 2018-02-21© Telefonaktiebolaget LM Ericsson 2018 | Ericsson Capital Markets Day 2018, Nov 8 | Page 19
5G expands the addressable market enabling new revenue streams
Performance driven opportunities
Scal
e dr
iven
op
port
unit
ies
Enhanced Mobile Broadband (eMBB)
Massive IoT Critical IoT
Fixed Wireless Access (FWA)
$200 –600 b.
$50 –100 b.
$950 –1,100 b.
Addressing Industry 4.0
Note: Numbers are early estimates.
This slide contains forward-looking statements. Actual result may be materially different.
Ericsson Internal | 2018-02-21© Telefonaktiebolaget LM Ericsson 2018 | Ericsson Capital Markets Day 2018, Nov 8 | Page 20
What we will cover today
Our turnaround
Market opportunity
Growth
Targets

Ericsson Internal | 2018-02-21© Telefonaktiebolaget LM Ericsson 2018 | Ericsson Capital Markets Day 2018, Nov 8 | Page 21
Taking the next step
Stability and profitability
Growth in core business
Growth in new business
Technologyleadership
Ericsson Internal | 2018-02-21© Telefonaktiebolaget LM Ericsson 2018 | Ericsson Capital Markets Day 2018, Nov 8 | Page 22
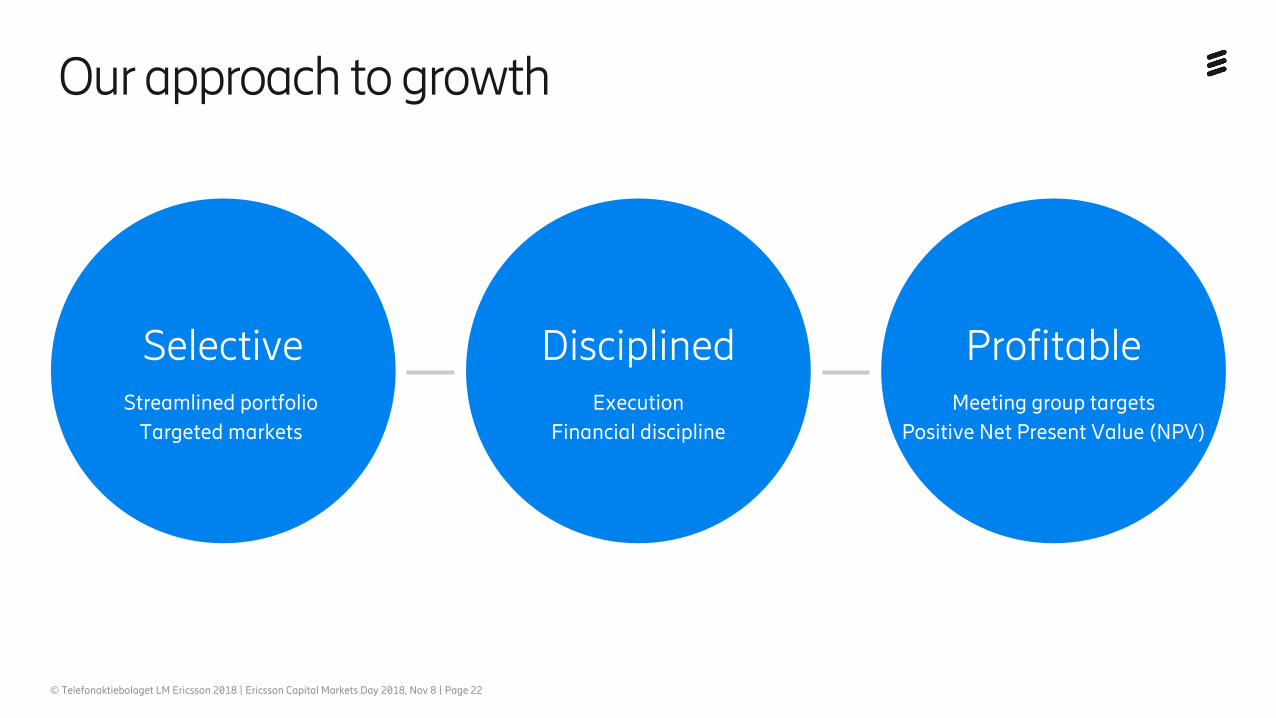
Our approach to growth
Selective Disciplined ProfitableStreamlined portfolio
Targeted markets Execution
Financial disciplineMeeting group targets
Positive Net Present Value (NPV)
Ericsson Internal | 2018-02-21© Telefonaktiebolaget LM Ericsson 2018 | Ericsson Capital Markets Day 2018, Nov 8 | Page 23
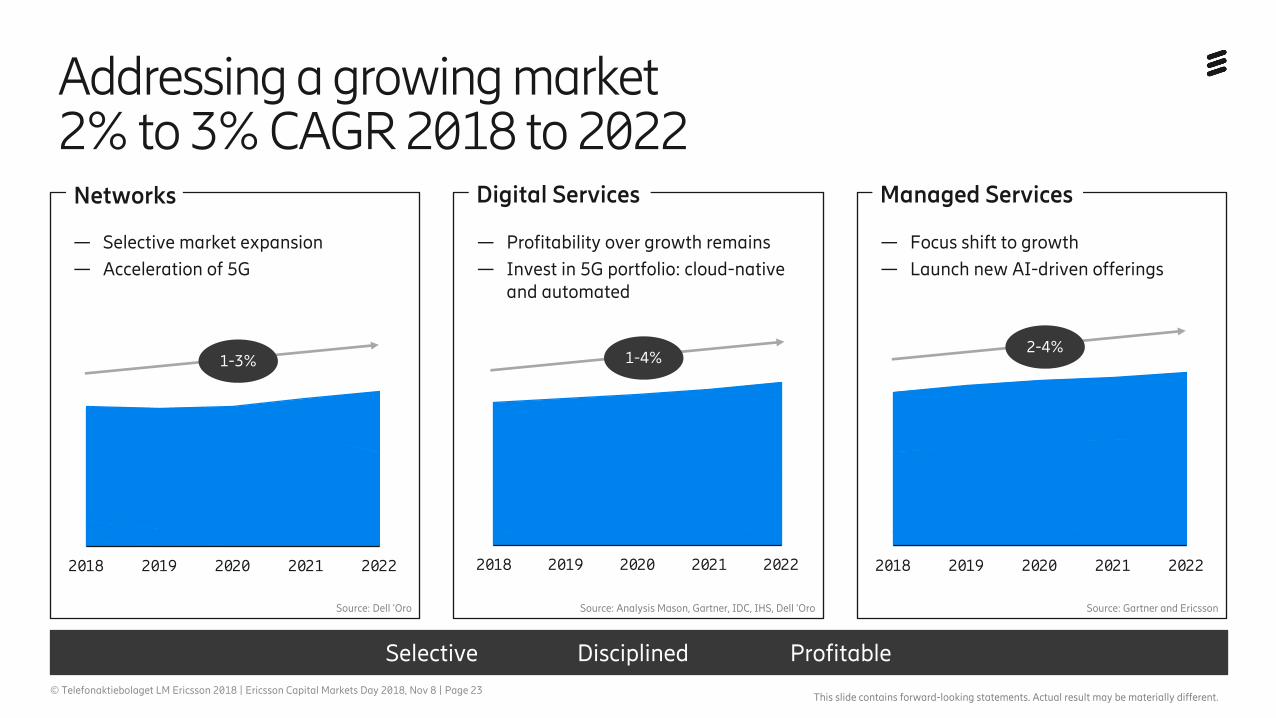
Addressing a growing market2% to 3% CAGR 2018 to 2022
— Selective market expansion— Acceleration of 5G
Networks
— Profitability over growth remains— Invest in 5G portfolio: cloud-native
and automated
Digital Services
— Focus shift to growth— Launch new AI-driven offerings
Managed Services
2018 2019 2020 2021 20222018 2019 2020 2021 20222018 2019 2020 2021 2022
1-3%
Source: Dell ’Oro Source: Analysis Mason, Gartner, IDC, IHS, Dell ’Oro Source: Gartner and Ericsson
1-4%2-4%
This slide contains forward-looking statements. Actual result may be materially different.
Selective Disciplined Profitable
Ericsson Internal | 2018-02-21© Telefonaktiebolaget LM Ericsson 2018 | Ericsson Capital Markets Day 2018, Nov 8 | Page 24
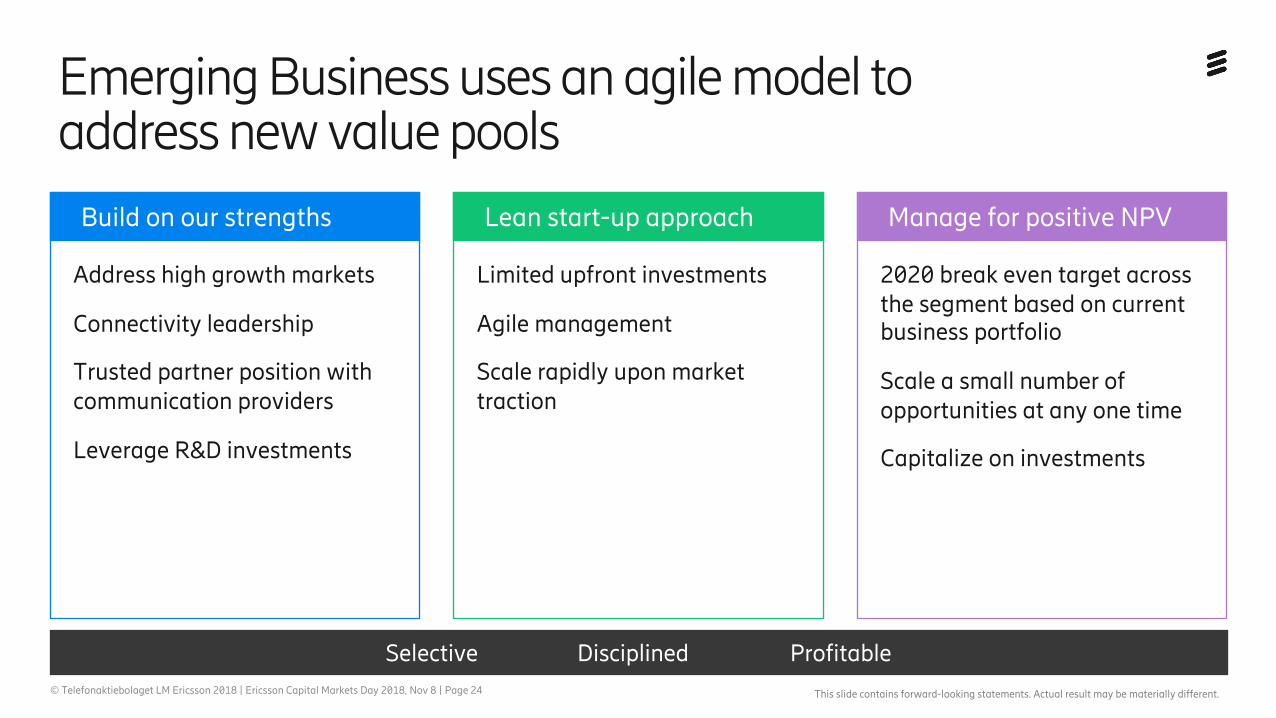
Emerging Business uses an agile model to address new value pools
Address high growth markets
Connectivity leadership
Trusted partner position with communication providers
Leverage R&D investments
Limited upfront investments
Agile management
Scale rapidly upon market traction
2020 break even target across the segment based on current business portfolio
Scale a small number of opportunities at any one time
Capitalize on investments
Build on our strengths Lean start-up approach Manage for positive NPV
This slide contains forward-looking statements. Actual result may be materially different.
Selective Disciplined Profitable

Ericsson Internal | 2018-02-21© Telefonaktiebolaget LM Ericsson 2018 | Ericsson Capital Markets Day 2018, Nov 8 | Page 25
Growth strategy supported by M&A
Networks Digital Services Managed Services Emerging Business
— Growth areas where we need to strengthen our position— Adjacencies to existing businesses — Complement R&D activities to achieve quicker time to market— New areas where we have limited presence but see clear, scalable solutions
building on our operator customer base
Portfolio near focus
— Competence— Patent complements— Emerging technologies
Technology
Grow in adjacent technologies
Radio software and hardware, transport
Portfolio & competence
Artificial Intelligence for operations and optimization
Portfolio expansion
Horizontal solutions enhancing IoT connectivity platforms
Portfolio expansion
Extending 5G beyond enhanced mobile broadband
Selective Disciplined Profitable
This slide contains forward-looking statements. Actual result may be materially different.

Ericsson Internal | 2018-02-21© Telefonaktiebolaget LM Ericsson 2018 | Ericsson Capital Markets Day 2018, Nov 8 | Page 26
What we will cover today
Our turnaround
Market opportunity
Growth
Targets

Ericsson Internal | 2018-02-21© Telefonaktiebolaget LM Ericsson 2018 | Ericsson Capital Markets Day 2018, Nov 8 | Page 27
Target update 2020
Continued investments but growing slower than sales
Structural improvements
2020
210-220
37-39%
>10%
SEK b.
Positive
CMD 2017 CMD 2018
2020
190-200
2020 operating margin1 target ranges
Networks 15% to 17%
Digital Services Low single digits
Managed Services 5% to 8%
Emerging Business and Other Break-even
Sum of the parts 10% to 13%
Increased net sales ambition, maintained operating margin1 target
This slide contains forward-looking statements. Actual result may be materially different.
1Numbers exclude restructuring charges.
Sales
Gross margin1
R&D
SG&A
Operating margin1
Free Cash Flow
(before M&A)

Ericsson Internal | 2018-02-21© Telefonaktiebolaget LM Ericsson 2018 | Ericsson Capital Markets Day 2018, Nov 8 | Page 28
Target 2022
1Numbers exclude restructuring charges.
2022 operating margin1 target ranges
Networks 15% to 17%
Digital Services 10% to 12%
Managed Services 8% to 10%
Emerging Business and Other
Sum of the parts 12% to 14%
Operating margin1 >12% no later than 2022
Continued investments but growing slower than sales
Structural improvements
2020
210-220
37-39%
>10%
SEK b.
Positive
CMD 2017 CMD 2018
2020
190-200
2022CMD 2018
>12%
Strong
Sales
Gross margin1
R&D
SG&A
Operating margin1
Free Cash Flow
(before M&A)
This slide contains forward-looking statements. Actual result may be materially different.
-

Ericsson Internal | 2018-02-21© Telefonaktiebolaget LM Ericsson 2018 | Ericsson Capital Markets Day 2018, Nov 8 | Page 29
Illustrative
Opportunities for growth beyond 2020
Baseline – Grow with the market
Growth in core businesses – Market share gain
Growth in new businesses – 5G and IOT use cases
M&A – Portfolio near acquisitions & technology focus
2020 202X
2% to 3% YoY
This slide contains forward-looking statements. Actual result may be materially different.

Technology trends
Erik Ekudden, CTO

Ericsson Internal | 2018-02-21© Telefonaktiebolaget LM Ericsson 2018 | Ericsson Capital Markets Day 2018, Nov 8 | Page 31
Towards a more versatile network
4GLTE
5GNR
NB-IoT
Rad
io a
cces
s
C
ore
Man
agem
ent
LTE-M2G 3G
Building the industries strongest 5G patent portfolioThis slide contains forward-looking statements. Actual result may be materially different.
Virtualized Cloud native
Orchestrated
ENM DynamicOrchestration
EPC
Software defined
5GCore
1990 NOW
AI assistedAI controlled
© Telefonaktiebolaget LM Ericsson 2018 | Ericsson Capital Markets Day 2018, Nov 8 | Page 31

Ericsson Internal | 2018-02-21© Telefonaktiebolaget LM Ericsson 2018 | Ericsson Capital Markets Day 2018, Nov 8 | Page 32
Global sitesDevices / Local networks
National sitesDistributed sitesAccess sites
Our global architecture
Transport
Management & Monetization
Mobile
Fixed Cloud infrastructure
Access, Mobility, Network applications
Application cloud
Mobile
Fixed
We have the vital capabilities to ensure an efficient end-to-end networkThis slide contains forward-looking statements. Actual result may be materially different.

Ericsson Internal | 2018-02-21© Telefonaktiebolaget LM Ericsson 2018 | Ericsson Capital Markets Day 2018, Nov 8 | Page 33
Technology strategy focusInnovation in network platform and new business
5G and LTE for high capacity and wide range of
access characteristics
Distributed cloud for virtualized network
functions and network slicing
AI, machine learning and security for optimization,
automation, agility and trust
IoT platform onboarding and serving industry
devices and use-cases
Global facilitation and aggregation of network
assets for third party services
Technologies providing for new business
Technologies enhancing the network platform
Research Testbeds PoCs Standard Development (Features, Cost rationalization, Characteristics, Security) Maintenance
R&D
Revenue
⏤ Research is the foundation for our technologyleadership and strong patent portfolio
⏤ Business driven pre-standard development and joint customer proof of concepts are necessary to drive the innovation and create a solid foundation for world wide standards and scale
⏤ Leading architecture, modularity, and open interfaces combined with world class development as the means to support customer variants
⏤ Continuous evolution of the network platform for cost rationalization, and fast feature growth throughrapid technology adoption driving profitability
2011 2013 2016 2017
Illustrative no scale implied
This slide contains forward-looking statements. Actual result may be materially different.

Ericsson Internal | 2018-02-21© Telefonaktiebolaget LM Ericsson 2018 | Ericsson Capital Markets Day 2018, Nov 8 | Page 34
5G time plan
NSA SA
Rel-15 Rel-16
5G/NR Phase 1 5G/NR Phase 2
3GPP
Rel- 16 - December 2019Main focus:Wireless and Wireline Convergence Ultra Reliable Low LatencyCommunication
Rel-15 - June 2018Main focus:NR: New 5G radio 5G Core: EPC and 5GCNetwork SlicingSupport for edge computing
Leading 5G investments 2019 – 5G devices broadly available 2020
5G devices broadly available
Rel-17, ...
2017 2018 2019 2020
© Telefonaktiebolaget LM Ericsson 2018 | Ericsson Capital Markets Day 2018, Nov 8 | Page 34 This slide contains forward-looking statements. Actual result may be materially different.

Ericsson Internal | 2018-02-21© Telefonaktiebolaget LM Ericsson 2018 | Ericsson Capital Markets Day 2018, Nov 8 | Page 35
Spectrum usage overview
5G4G3G2G
2019 202020182017 2021 2022
NR Spectrum combination
Highbands(24 GHz –52 GHz)
Mid bands(3 GHz – 6 GHz)
Low bands(0-3 GHz)
Localized Peak Capacity
Wide Areacoverage
and capacityWide areaCoverage
Urban & sub-urbancapacity
Urbancapacity
boost
Increased value from advanced antenna technologies and spectrum aggregation in the active part of the network
Spectrum assets is an increasing competitive advantage for operators This slide contains forward-looking statements. Actual result may be materially different.
This slide contains forward-looking statements. Actual result may be materially different.

Ericsson Internal | 2018-02-21© Telefonaktiebolaget LM Ericsson 2018 | Ericsson Capital Markets Day 2018, Nov 8 | Page 36
FixedWireless Access— Mobile / wireless / fixed— Enterprise— Home
Critical machine typecommunication— Industrial applications— Traffic safety & control— Remote manufacturing
Massive machine type communication— Smart meter— Tracking— Fleet management
EnhancedMobile Broadband— Virtual & Augmented Reality— 4K/8K resolutions— Smartphones
Platform for addressing industry and society transformations
Cost effective delivery of increased data traffic
5G is developed for broader usage
…but subscribers and households addressed initiallyThis slide contains forward-looking statements. Actual result may be materially different.
Ericsson Internal | 2018-02-21© Telefonaktiebolaget LM Ericsson 2018 | Ericsson Capital Markets Day 2018, Nov 8 | Page 37
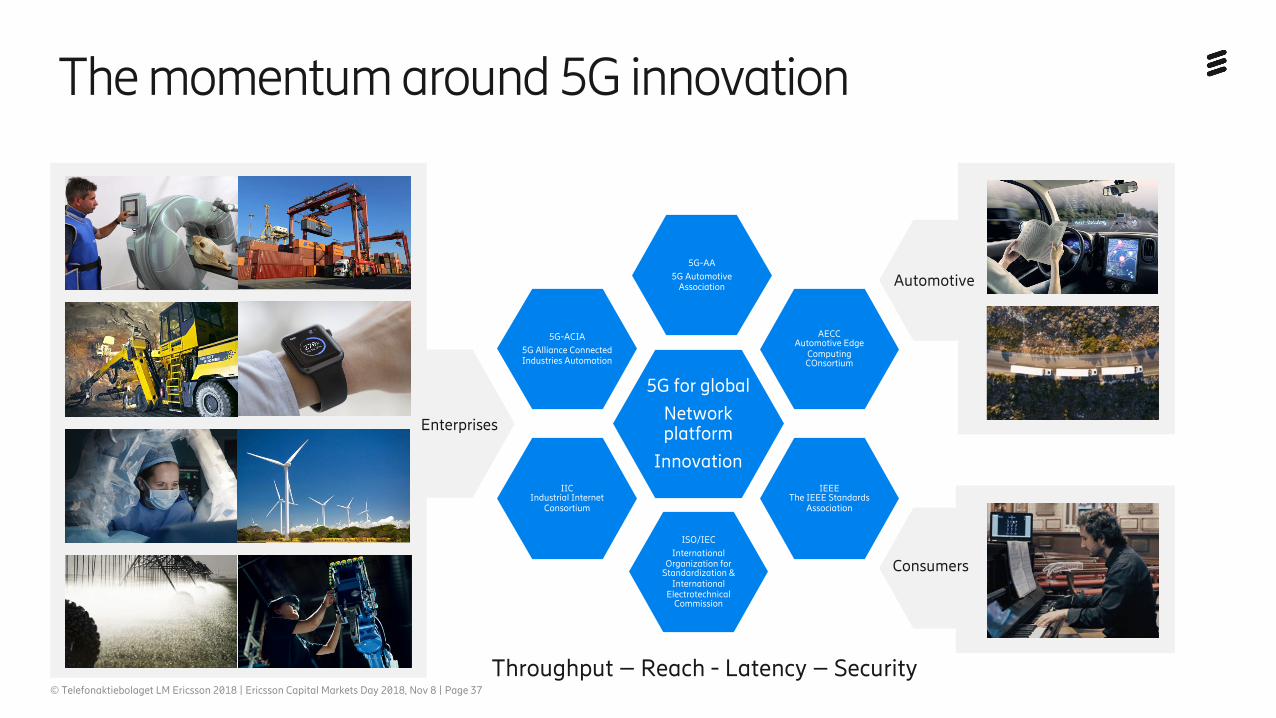
5G for global
Network platform
Innovation
5G-AA5G Automotive
Association
AECCAutomotive Edge
Computing COnsortium
IEEEThe IEEE Standards
Association
ISO/IECInternational
Organization for Standardization &
International Electrotechnical
Commission
IICIndustrial Internet
Consortium
5G-ACIA5G Alliance Connected Industries Automation
The momentum around 5G innovation
Throughput – Reach - Latency – Security
Enterprises
Automotive
Consumers
Ericsson Internal | 2018-02-21© Telefonaktiebolaget LM Ericsson 2018 | Ericsson Capital Markets Day 2018, Nov 8 | Page 38
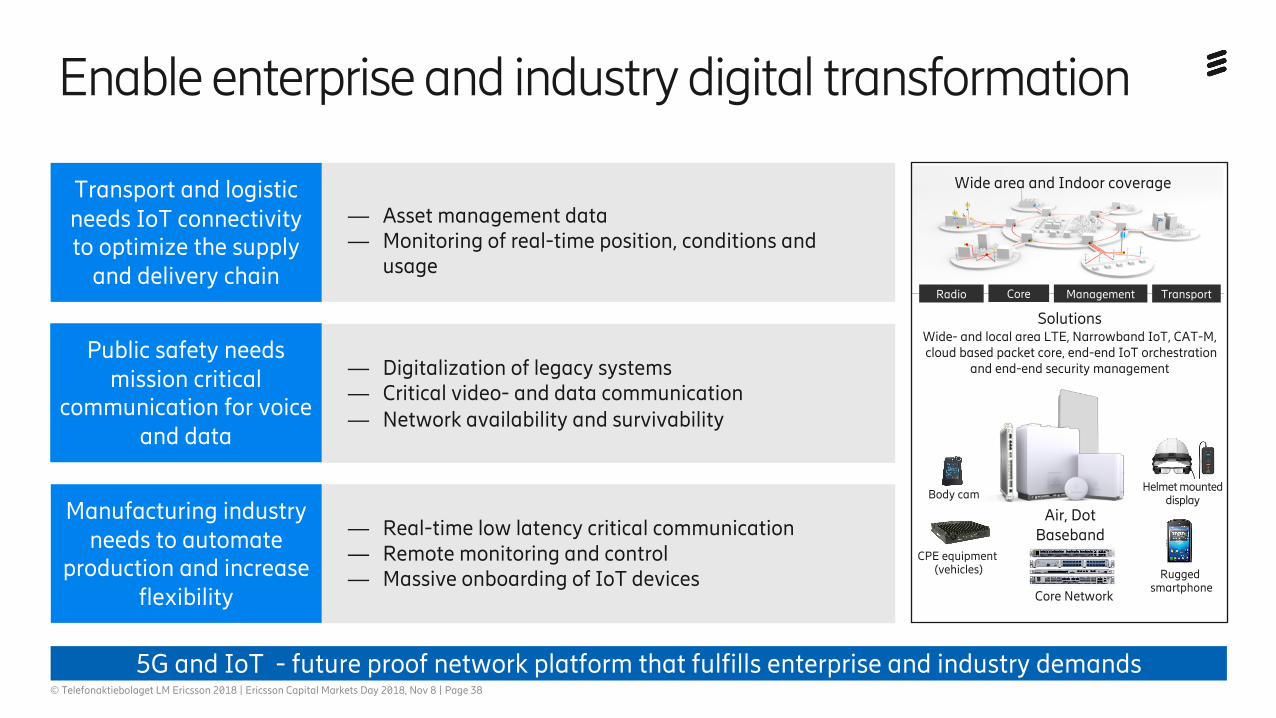
Enable enterprise and industry digital transformation
⏤ Asset management data ⏤ Monitoring of real-time position, conditions and
usage
Transport and logistic needs IoT connectivity to optimize the supply
and delivery chain
Manufacturing industry needs to automate
production and increase flexibility
Public safety needs mission critical
communication for voice and data
⏤ Real-time low latency critical communication⏤ Remote monitoring and control ⏤ Massive onboarding of IoT devices
⏤ Digitalization of legacy systems ⏤ Critical video- and data communication⏤ Network availability and survivability
CPE equipment(vehicles) Rugged
smartphone
Helmet mounted displayBody cam
Wide area and Indoor coverage
Core Network
Radio Core Management Transport
5G and IoT - future proof network platform that fulfills enterprise and industry demands
SolutionsWide- and local area LTE, Narrowband IoT, CAT-M,cloud based packet core, end-end IoT orchestration
and end-end security management
This slide contains forward-looking statements. Actual result may be materially different.
Air, DotBaseband
Ericsson Internal | 2018-02-21© Telefonaktiebolaget LM Ericsson 2018 | Ericsson Capital Markets Day 2018, Nov 8 | Page 39
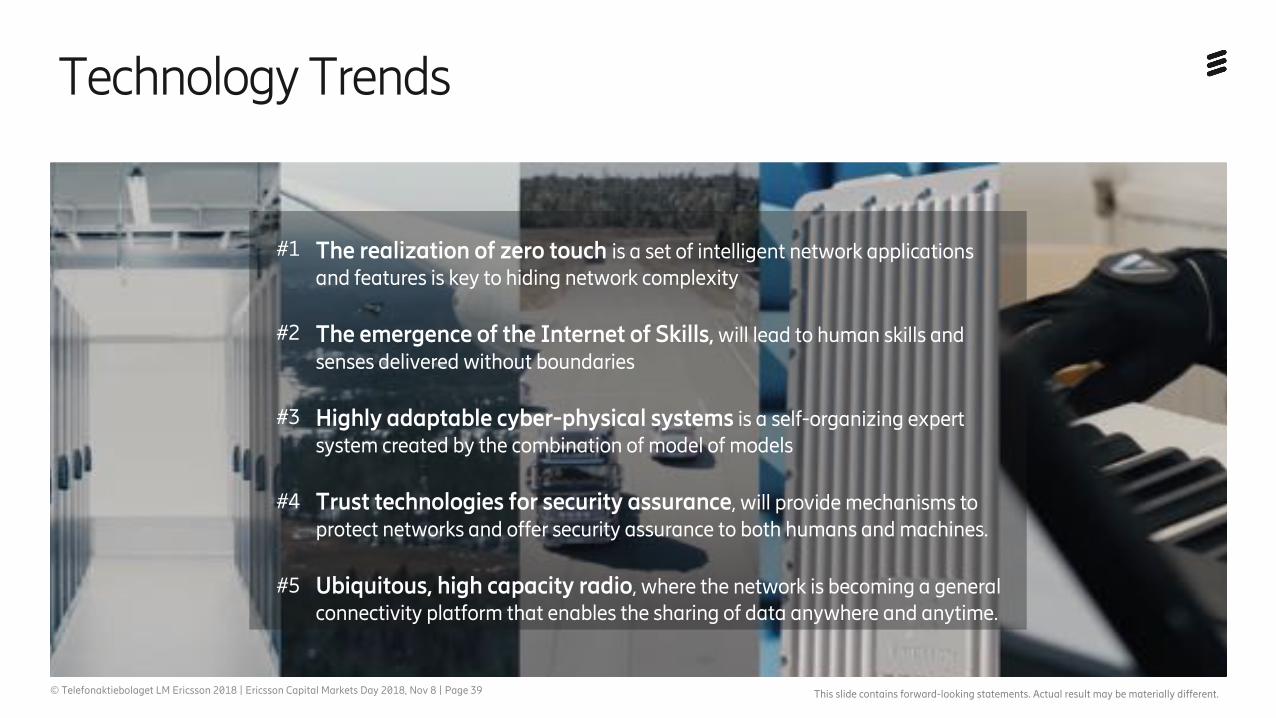
Technology Trends
The realization of zero touch is a set of intelligent network applications and features is key to hiding network complexity
The emergence of the Internet of Skills, will lead to human skills and senses delivered without boundaries
Highly adaptable cyber-physical systems is a self-organizing expert system created by the combination of model of models
Trust technologies for security assurance, will provide mechanisms to protect networks and offer security assurance to both humans and machines.
Ubiquitous, high capacity radio, where the network is becoming a general connectivity platform that enables the sharing of data anywhere and anytime.
#1
#2
#3
#4
#5
This slide contains forward-looking statements. Actual result may be materially different.

Ericsson Internal | 2018-02-21© Telefonaktiebolaget LM Ericsson 2018 | Ericsson Capital Markets Day 2018, Nov 8 | Page 40
Securing long-term technology leadershipSummary
Areas of focus— 5G Radio and Core — Distributed cloud and edge— Security and Trust— AI and Machine Learning
— Management & Orchestration— IoT platforms
Industry wide technology trends#1 The realization of zero touch
#2 The emergence of the Internet of Skills
#3 Highly adaptable cyber-physical systems
#4 Trust technologies for security assurance
#5 Ubiquitous, high capacity radio
Innovation capacity — 23,600 employees in R&D
— Ericsson Research— Ericsson ONE
— Ericsson AI Accelerator— Co-creation with lead customers,
industry partners and academia
— Standardization and open source — 45,000 granted patents— Strategic investments
This slide contains forward-looking statements. Actual result may be materially different.
Financial update
Carl Mellander CFO
Ericsson Internal | 2018-02-21© Telefonaktiebolaget LM Ericsson 2018 | Ericsson Capital Markets Day 2018, Nov 8 | Page 42
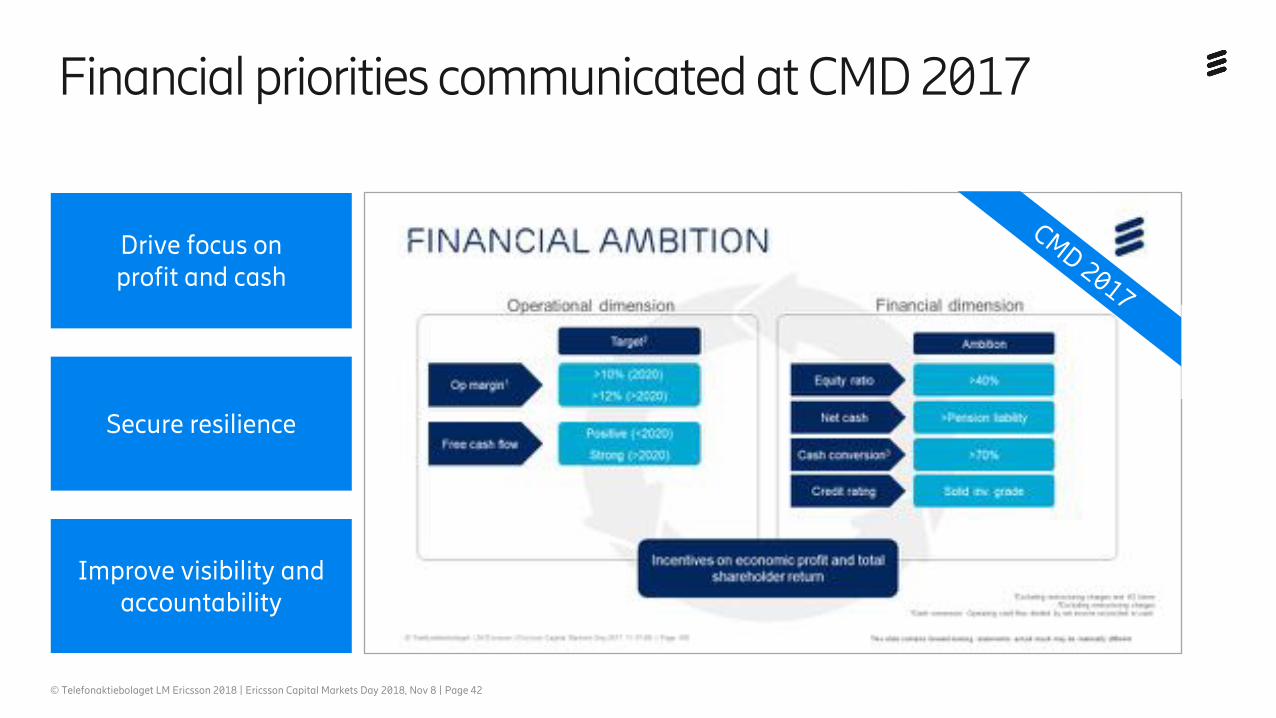
Secure resilience
Improve visibility and accountability
Drive focus on profit and cash
Financial priorities communicated at CMD 2017
CMD 2017

Ericsson Internal | 2018-02-21© Telefonaktiebolaget LM Ericsson 2018 | Ericsson Capital Markets Day 2018, Nov 8 | Page 43
Operating margin1 (%)
2020
>10%
>12%
Ericsson turnaround
Back to top line growth
1Operating margin excludes restructuring charges. 2017 numbers are not IFRS reconciled and also exclude xo items.
20182017
Focused strategy launch
Cost savings program launched
Increase R&D
investment
Gross margin hits
35%
Cost savings program complete
2.3%
0.6% -0.1%0.7%
2.0%
4.1%
7.0%
No later than 2022
Isolated quarters
This slide contains forward-looking statements. Actual result may be materially different.

Ericsson Internal | 2018-02-21© Telefonaktiebolaget LM Ericsson 2018 | Ericsson Capital Markets Day 2018, Nov 8 | Page 44
25
27
29
31
33
35
37
39
Q1 2017 Q3 2017 Q1 2018 Q3 2018
4
0
2
8
6
10
12
Q1 2017 Q3 2017 Q3 2018Q1 2018
Free cash flow before M&A(SEK b. – rolling 4Q)
Positive and increasing free cash flow
Underlying gross margin1
(% – quarterly)
Strong gross margin improvement
140
210
170
200
230
180
150
160
190
220
Q1 2017‘17Q1
Q3 2017 Q1 2018‘18Q1
Q3 2018
Net sales(SEK b. – rolling 4Q)
Net sales turned to growth
-16 -13 -3 -7 -2 -1 1
YoY change in quarterly net sales adjusted to comparable units and currency (%)2
Turnaround is visible across financial metrics
1 Gross margin excludes restructuring charges. 2017 excludes xo items and are not restated for IFRS 15 2 2017 growth rates not adjusted for IFRS 15
Ericsson Internal | 2018-02-21© Telefonaktiebolaget LM Ericsson 2018 | Ericsson Capital Markets Day 2018, Nov 8 | Page 45
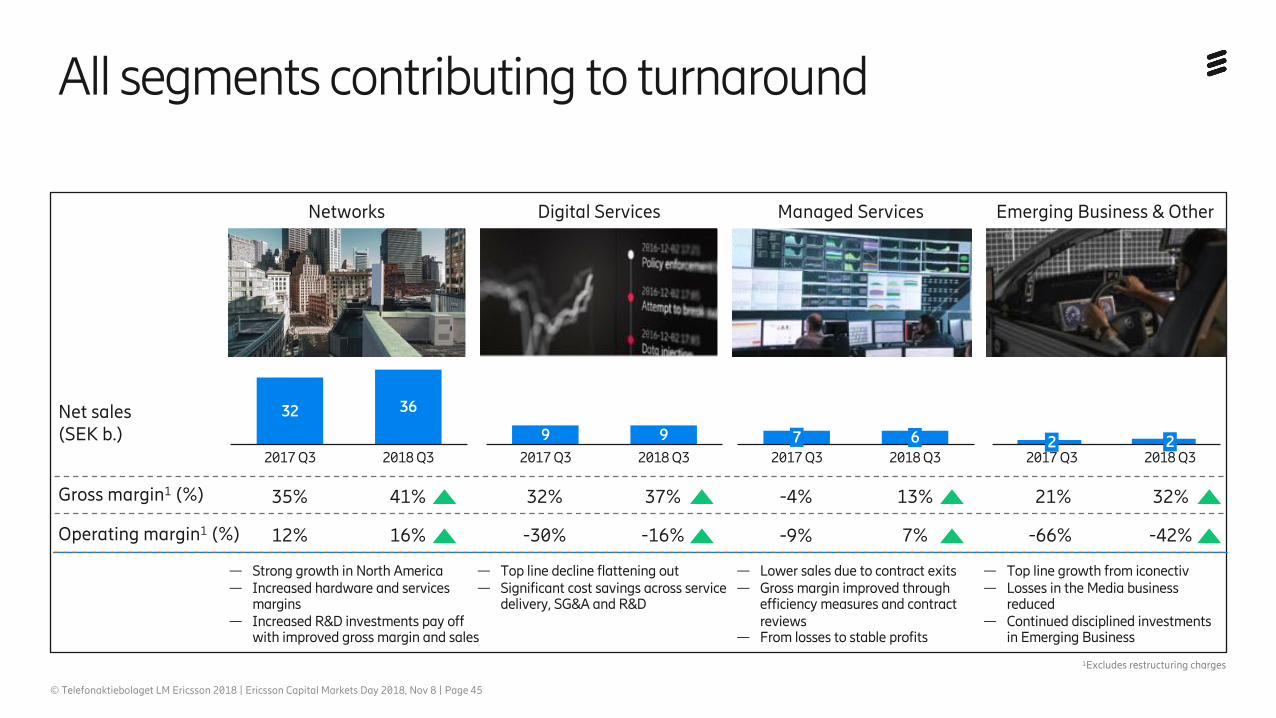
Networks Digital Services Managed Services Emerging Business & Other
Net sales(SEK b.) 99
2018 Q32017 Q32018 Q32017 Q3
32 36
2017 Q37 6
2018 Q322
2017 Q3 2018 Q3
All segments contributing to turnaround
Gross margin1 (%)
Operating margin1 (%)
35%
12%
41%
16%
32%
-30%
37%
-16%
-4%
-9%
13%
7%
21%
-66%
32%
-42%
— Strong growth in North America— Increased hardware and services
margins— Increased R&D investments pay off
with improved gross margin and sales
— Top line decline flattening out— Significant cost savings across service
delivery, SG&A and R&D
— Lower sales due to contract exits— Gross margin improved through
efficiency measures and contract reviews
— From losses to stable profits
— Top line growth from iconectiv— Losses in the Media business
reduced— Continued disciplined investments
in Emerging Business
1Excludes restructuring charges

Ericsson Internal | 2018-02-21© Telefonaktiebolaget LM Ericsson 2018 | Ericsson Capital Markets Day 2018, Nov 8 | Page 46
Improved cost structure
Cost of sales
R&D
Selling expenses
G&A
Other *
— Cost effective product portfolio and delivery — Service delivery efficiency (part of SEK 10 b. program)— Scope review and contract exits— Exiting non-core and underperforming business— Supply chain efficiencies
— Investments to strengthen technology leadership— Strong link to improved gross margin
— Underlying decrease in selling expenses— Decrease offset by provisions for variable compensation
and increased cost of customer field trials
— G&A reductions (part of SEK 10 b. program)
*Other items include revaluation of customer financing, impairment losses on trade receivables, other operating income and expenses, shares in earnings of JV and associated companies
6% 5%6% 7%
16% 19%
70% 64%
2017 09 YTD
5%1%
2018 09 YTD
Operating income
Total cost1 as % of net sales
1All periods excluding restructuring charges2017 also excludes xo items and are not restated for IFRS 15

Ericsson Internal | 2018-02-21© Telefonaktiebolaget LM Ericsson 2018 | Ericsson Capital Markets Day 2018, Nov 8 | Page 47
Strengthened financial resilience
Gross and net cash position (SEK b.)
2016 Q3
44
66
32
16
55
24
2017 Q3 2018 Q3
Debt maturity profile (SEK b.)
Long-term credit rating development
Ba1/BB+
Baa2/BBB
A1/A+
A3/A-
B2/B
Ba3/BB-
Secured strong cash position
Restoring profitability expected to reinstate Investment Grade rating over time
Net cash Gross cash
0
10
5
202220202018 2019 2021 2023 2024 2025
Swedish Export Credit Corporation
Nordic Investment Bank
European Investment Bank
Notes and Bonds
2002 2004 2006 2008 2010 2012 2014 2016 2018
Moody’s S&P Investment grade (Baa3/BBB-)Fitch
Well diversified debt maturity profile and two undrawn credit facilities(USD 2 b. RCF & EUR 250 m. R&D financing from EIB)
This slide contains forward-looking statements. Actual result may be materially different.
Ericsson Internal | 2018-02-21© Telefonaktiebolaget LM Ericsson 2018 | Ericsson Capital Markets Day 2018, Nov 8 | Page 48
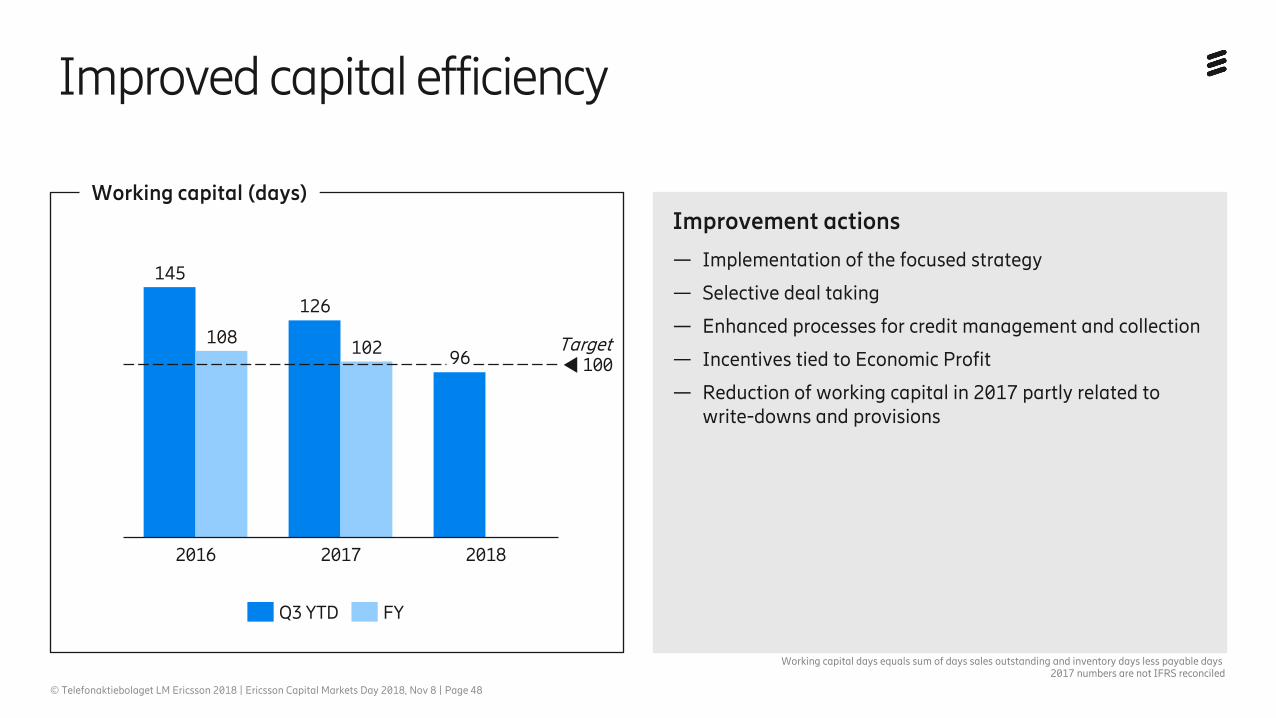
Improved capital efficiency
Improvement actions
— Implementation of the focused strategy
— Selective deal taking
— Enhanced processes for credit management and collection
— Incentives tied to Economic Profit
— Reduction of working capital in 2017 partly related to write-downs and provisions
Working capital (days)
145
126
96108 102
100
20172016 2018
Q3 YTD FY
2017 numbers are not IFRS reconciledWorking capital days equals sum of days sales outstanding and inventory days less payable days
Target
Ericsson Internal | 2018-02-21© Telefonaktiebolaget LM Ericsson 2018 | Ericsson Capital Markets Day 2018, Nov 8 | Page 49
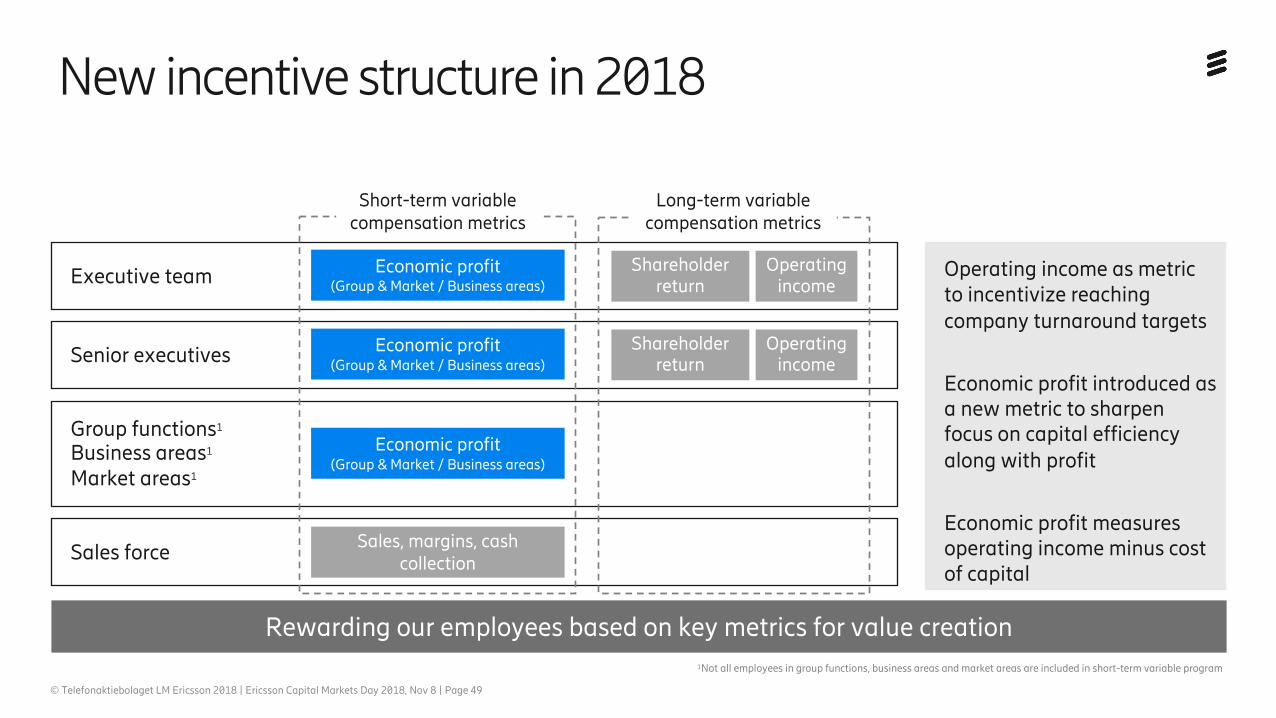
New incentive structure in 2018
Rewarding our employees based on key metrics for value creation
Operating income as metric to incentivize reaching company turnaround targets
Economic profit introduced as a new metric to sharpen focus on capital efficiency along with profit
Economic profit measures operating income minus cost of capital
Executive team
Senior executives
Group functions1
Business areas1
Market areas1
Sales force
Short-term variable compensation metrics
Economic profit(Group & Market / Business areas)
Economic profit(Group & Market / Business areas)
Sales, margins, cash collection
Economic profit(Group & Market / Business areas)
Operating income
Shareholderreturn
Shareholder return
Operating income
Long-term variable compensation metrics
1Not all employees in group functions, business areas and market areas are included in short-term variable program

Ericsson Internal | 2018-02-21© Telefonaktiebolaget LM Ericsson 2018 | Ericsson Capital Markets Day 2018, Nov 8 | Page 50
Operating margin1 (%)
2020
>10%
>12%
Next stage
Back to top line growth
1Operating margin excludes restructuring charges. 2017 numbers are not IFRS reconciled and also exclude xo items.
20182017
Focused strategy launch
Cost savings program launched
Increase R&D
investment
Gross margin hits
35%
Cost savings program complete
2.3%
0.6% -0.1%0.7%
2.0%
4.1%
7.0%
Isolated quarters
This slide contains forward-looking statements. Actual result may be materially different.
No later than 2022

Ericsson Internal | 2018-02-21© Telefonaktiebolaget LM Ericsson 2018 | Ericsson Capital Markets Day 2018, Nov 8 | Page 51
Priorities for further value creation
Secureresilience
Improve visibility and accountability
Drive focus on profit and cash
Continue to drive focus on profit, cash and resilience
Grow profitably
Selective Disciplined Profitable
Streamlined portfolio
Targeted markets
Execution
Financial discipline
Meeting group targets
Positive net present value
This slide contains forward-looking statements. Actual result may be materially different.
Ericsson Internal | 2018-02-21© Telefonaktiebolaget LM Ericsson 2018 | Ericsson Capital Markets Day 2018, Nov 8 | Page 52
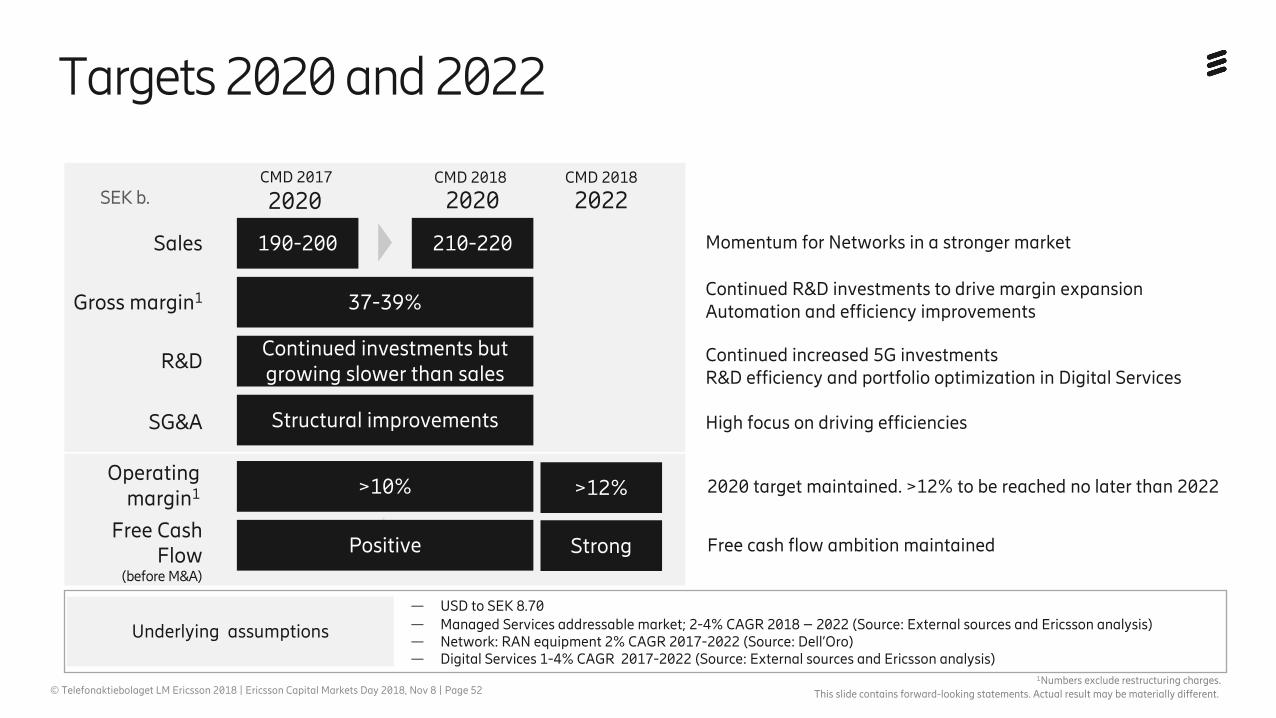
Targets 2020 and 2022
— USD to SEK 8.70— Managed Services addressable market; 2-4% CAGR 2018 – 2022 (Source: External sources and Ericsson analysis)— Network: RAN equipment 2% CAGR 2017-2022 (Source: Dell’Oro) — Digital Services 1-4% CAGR 2017-2022 (Source: External sources and Ericsson analysis)
Underlying assumptions
Momentum for Networks in a stronger market
Continued R&D investments to drive margin expansion Automation and efficiency improvements
Continued increased 5G investmentsR&D efficiency and portfolio optimization in Digital Services
High focus on driving efficiencies
2020 target maintained. >12% to be reached no later than 2022
Free cash flow ambition maintained
Continued investments but growing slower than sales
Structural improvements
Sales
Gross margin1
R&D
SG&A
2020
210-220
37-39%
Operating margin1 >10%
Free Cash Flow
(before M&A)
SEK b.
Positive
CMD 2017 CMD 2018
2020
190-200
2022CMD 2018
>12%
Strong
This slide contains forward-looking statements. Actual result may be materially different.
1Numbers exclude restructuring charges.
Ericsson Internal | 2018-02-21© Telefonaktiebolaget LM Ericsson 2018 | Ericsson Capital Markets Day 2018, Nov 8 | Page 53
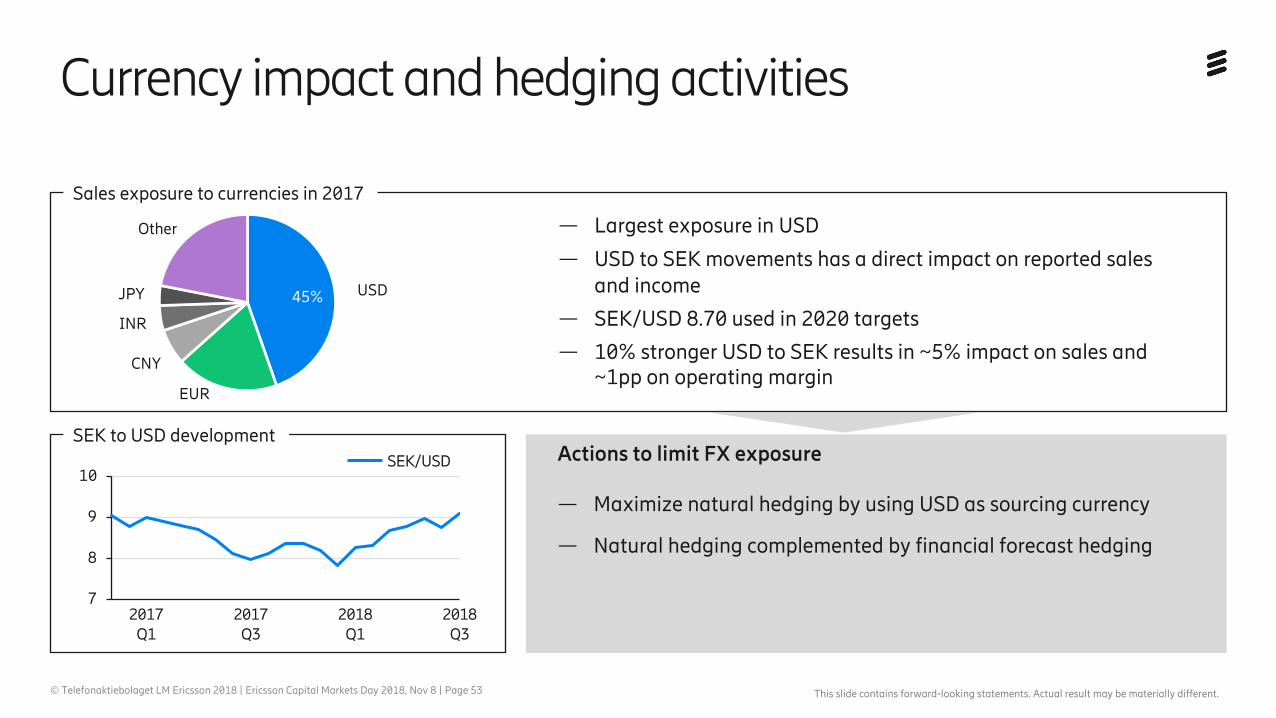
Currency impact and hedging activities
Actions to limit FX exposure
— Maximize natural hedging by using USD as sourcing currency
— Natural hedging complemented by financial forecast hedging
USD45%
EUR
CNY
INR
JPY
Other
Sales exposure to currencies in 2017
— Largest exposure in USD
— USD to SEK movements has a direct impact on reported sales and income
— SEK/USD 8.70 used in 2020 targets
— 10% stronger USD to SEK results in ~5% impact on sales and ~1pp on operating margin
7
8
9
10
2017 Q1
2018 Q1
2017 Q3
2018 Q3
SEK/USD
SEK to USD development
This slide contains forward-looking statements. Actual result may be materially different.

Ericsson Internal | 2018-02-21© Telefonaktiebolaget LM Ericsson 2018 | Ericsson Capital Markets Day 2018, Nov 8 | Page 54
1As we will continue to focus on efficiency improvements across the company, there can be differences between the years and we will continue to give updates regularly if any material deviations are expected
Illustrative bridge on free cash flow
Operating income
Change in working capital+/-
Capex-
Striving to maintain working capital efficiency but swings may impact cash flow
Planning assumption ~2% per year with limited capitalization of development expenses
Planning assumption 1-2% per year
>12%
+-0
~2%
1%
Bridge from operating income to free cash flowComments
Free cash flow (before M&A)= >8%
M&A-
% of net sales
Financial net, tax and other - ~4% Planning assumption based on historical levels
Add back depreciation & amortization+ Planning assumption based on historical levels with less capitalized development~3-4%
Current assumption as a base level going forward1
Gradually decline towards 1%
1-2%
Restructuring-
Illustrative
This slide contains forward-looking statements. Actual result may be materially different.
Ericsson Internal | 2018-02-21© Telefonaktiebolaget LM Ericsson 2018 | Ericsson Capital Markets Day 2018, Nov 8 | Page 55
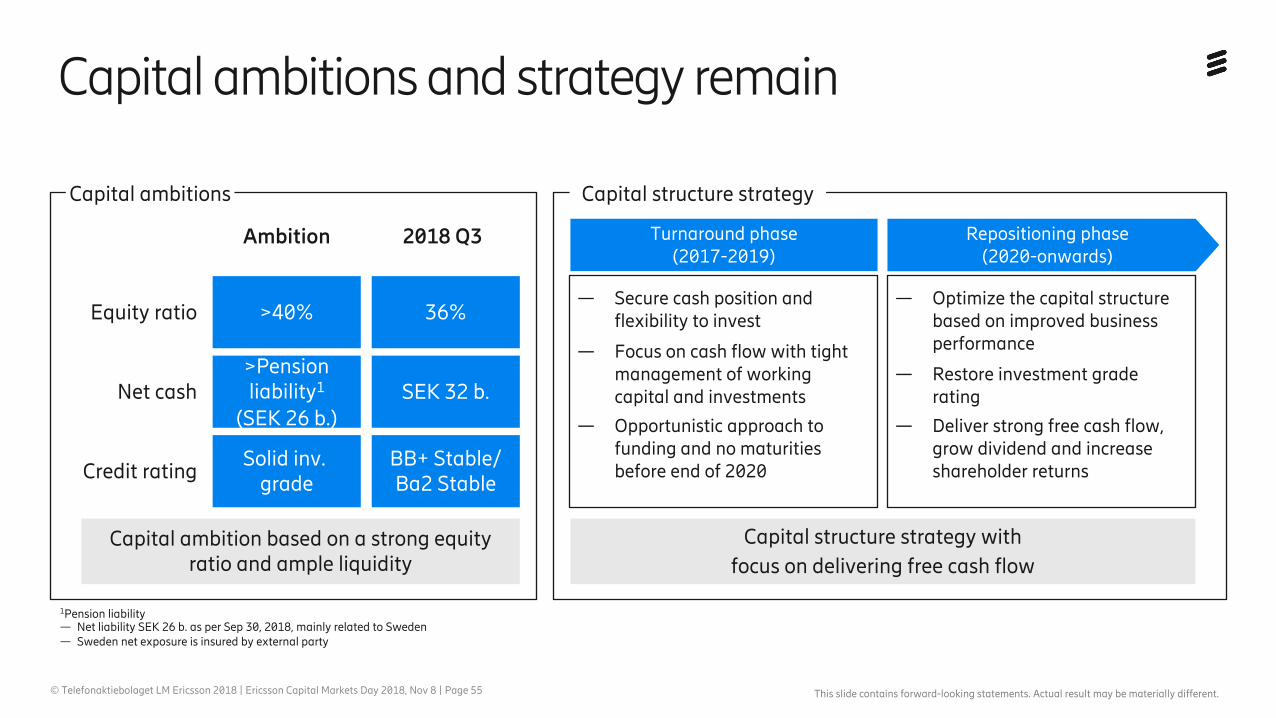
Capital ambitions and strategy remain
Capital ambition based on a strong equity ratio and ample liquidity
>40%
>Pension liability1
(SEK 26 b.)
Solid inv. grade
36%
SEK 32 b.
BB+ Stable/ Ba2 Stable
Equity ratio
Net cash
Credit rating
Ambition 2018 Q3
Capital structure strategy with focus on delivering free cash flow
Capital ambitions Capital structure strategy
— Secure cash position and flexibility to invest
— Focus on cash flow with tight management of working capital and investments
— Opportunistic approach to funding and no maturities before end of 2020
— Optimize the capital structure based on improved business performance
— Restore investment grade rating
— Deliver strong free cash flow, grow dividend and increase shareholder returns
Repositioning phase(2020-onwards)
Turnaround phase(2017-2019)
1Pension liability— Net liability SEK 26 b. as per Sep 30, 2018, mainly related to Sweden— Sweden net exposure is insured by external party
This slide contains forward-looking statements. Actual result may be materially different.

Ericsson Internal | 2018-02-21© Telefonaktiebolaget LM Ericsson 2018 | Ericsson Capital Markets Day 2018, Nov 8 | Page 56
Continuous cost improvements
ü— SEK 10 b. program has been essential in restoring
profitability and reaching more competitive cost levels
— Cost program has helped to establish cost mentality and cemented cost management structures
Cost management structure and ways of working to continue
Enhanced efforts in selected areas Next level of cost efficiencies
Continued governance under Group Transformation Office
Review potential Selling, R&D and G&A productivity improvements
Next step in digital transformation, end-to-end process simplification & continued investment in R&D

Ericsson Internal | 2018-02-21© Telefonaktiebolaget LM Ericsson 2018 | Ericsson Capital Markets Day 2018, Nov 8 | Page 57
Summary
Our focused strategy has led us back to stability and profitability
We continue with relentless profit and cash focus, securing resilience and improving visibility and accountability
As profit and capital efficiency have improved, we pursue disciplined growth for further value creation
This slide contains forward-looking statements. Actual result may be materially different.
Q&A

Lunch