ernest orlando lawrence berkeley national laboratory · ernest orlando lawrence berkeley national...
TRANSCRIPT

LBNL‐1006343
ERNEST ORLANDO LAWRENCE BERKELEY NATIONAL LABORATORY
U.S.EnergyServiceCompany(ESCO)Industry:RecentMarketTrends
ElizabethStuart,*PeterH.Larsen,*JuanPabloCarvallo,*CharlesA.Goldman,*andDonaldGilligan**
*LawrenceBerkeleyNationalLaboratory**NationalAssociationofEnergyServiceCompanies
EnergyAnalysis&EnvironmentalImpactsDivision
ElectricityMarkets&PolicyGroup
October2016
TheworkdescribedinthisreportwasfundedbytheU.S.DepartmentofEnergyOfficeofEnergyEfficiencyandRenewableEnergyunderContractNo.DE‐AC02‐05CH11231

Disclaimer
ThisdocumentwaspreparedasanaccountofworksponsoredbytheUnitedStatesGovernment.Whilethisdocumentisbelievedtocontaincorrectinformation,neithertheUnitedStatesGovernmentnoranyagencythereof,norTheRegentsoftheUniversityofCalifornia,noranyoftheiremployees,makesanywarranty, express or implied, or assumes any legal responsibility for the accuracy, completeness, orusefulnessofanyinformation,apparatus,product,orprocessdisclosed,orrepresentsthatitsusewouldnot infringeprivatelyownedrights.Referenceherein toanyspecific commercialproduct,process,orservice by its tradename, trademark,manufacturer, or otherwise, doesnot necessarily constitute orimply itsendorsement, recommendation,or favoringby theUnitedStatesGovernmentoranyagencythereof, orTheRegentsof theUniversity of California.Theviews andopinionsof authors expressedhereindonotnecessarilystateorreflectthoseoftheUnitedStatesGovernmentoranyagencythereof,orTheRegentsoftheUniversityofCalifornia.
ErnestOrlandoLawrenceBerkeleyNationalLaboratoryisanequalopportunityemployer.

LBNL‐1006343
U.S. Energy Service Company (ESCO) Industry: Recent Market Trends
PreparedfortheOfficeofEnergyEfficiencyandRenewableEnergy
FederalEnergyManagementProgramU.S.DepartmentofEnergy
ElizabethStuart,*PeterH.Larsen,*JuanPabloCarvallo,*CharlesA.Goldman,*andDonaldGilligan**
*LawrenceBerkeleyNationalLaboratory**NationalAssociationofEnergyServiceCompanies
ErnestOrlandoLawrenceBerkeleyNationalLaboratory1CyclotronRoad,MS90R4000
BerkeleyCA94720‐8136
October2016
TheworkdescribedinthisreportwasfundedbytheU.S.DepartmentofEnergyOfficeofEnergyEfficiencyandRenewableEnergyunderContractNo.DE‐AC02‐05CH11231

U.S. Energy Service Company Industry: Recent Market Trends │1
Acknowledgements
TheworkdescribedinthisreportwasfundedbytheU.S.DepartmentofEnergyOfficeofEnergyEfficiencyandRenewableEnergy(EERE)underContractNo.DE‐AC02‐05CH11231.WewouldliketothankKathleenHogan(DOE‐EERE)forongoingsupportofourresearchintothisindustry.WegratefullyacknowledgeDr.TimothyUnruh,KurmitRockwell,andSchuylerSchell(DOE‐FEMP)forprovidingresourcestoconducttheanalysisandwriteuptheresultsforthisresearchreport.WealsothankAnnaMariaGarcia,JenahZweig,AliceDasek,andJamesCarlisle(DOE‐WIP)forsupportingourresearchintotheESCOindustryincludingoutreachtoESCOexecutivesforcollectionofthedataforthisreport.WethankDavidBirr(SynchronousEnergySolutions),PatriciaDonahue(DonahueandAssociates)andChrisHalpin(CelticEnergy)forsharingtheirexpertiseonthisindustry.WethankPhilColeman(LBNL),JeannaPaluzzi(ColoradoEnergyOffice),SteveSchiller(SchillerAssociates),andRobertSlattery(ORNL)forprovidingvaluableinformationandinsight.Inaddition,GregCollins(EnergySystemsGroup),SteveMorgan(CleanEnergySolutions),PaulPoblocki(JohnsonControls)RickRodriquez(Siemens)andTerrySinger(NationalAssociationofEnergyServiceCompanies)providedvaluablecommentsonanearlierdraftofthisreport.Finally,wewouldliketogratefullyacknowledgekeystaffattheESCOswhospentaconsiderableamounttimerespondingtoourrequestsforinformation.Anyremainingomissionsanderrorsaretheresponsibilityoftheauthors.

U.S. Energy Service Company Industry: Recent Market Trends │2
Table of Contents
Acknowledgements........................................................................................................................................................................................1
TableofContents.............................................................................................................................................................................................2
TableofFigures................................................................................................................................................................................................3
ListofTables.....................................................................................................................................................................................................3
AcronymsandAbbreviations....................................................................................................................................................................4
ExecutiveSummary........................................................................................................................................................................................5
1. Introduction............................................................................................................................................................................................11
2. DataSourcesandMethods...............................................................................................................................................................14
2.1. DataSources............................................................................................................................................................................14
2.2. Method........................................................................................................................................................................................15
3. U.S.ESCOIndustryRevenueandMarketTrends...................................................................................................................17
3.1. Currentandhistoricrevenue...........................................................................................................................................17
3.2. Short‐termrevenueprojectionsfromESCOs............................................................................................................18
3.3. ESCOindustryrevenuesbymarketsegmentandsizeofESCO........................................................................19
3.4. RevenuetrendsovertimebytypeofESCObusinessactivityandsector.....................................................23
3.5. ESCOrevenuesbycensusregion....................................................................................................................................24
3.6. ESCOperformancecontractingrevenuesfromnewandexistingcustomers............................................26
3.7. Incorporationofnon‐energybenefitsinESPC.........................................................................................................27
3.8. Financingtoolsandincentives........................................................................................................................................31
4. Discussion................................................................................................................................................................................................35
4.1. ESCOindustryrevenueestimates..................................................................................................................................35
4.2. FactorsinfluencingrecentESCOindustrymarketactivity.................................................................................35
4.3. Prospectsfornear‐termgrowth.....................................................................................................................................41
5. Conclusion...............................................................................................................................................................................................42
References........................................................................................................................................................................................................44
DataTables...................................................................................................................................................................48 AppendixA.

U.S. Energy Service Company Industry: Recent Market Trends │3
Table of Figures
FigureES‐1.ReportedandprojectedESCOindustryrevenues(nominal$):1990‐2017............................................6
FigureES‐2.Useofnon‐energybenefitsinperformance‐basedprojects(2012‐2014)...............................................8
FigureES‐3.FinancingApproachesbyMarketSegment(2012‐2014)...............................................................................10
Figure1.AggregateESCOindustryrevenuefrom1990to2014.............................................................................................17
Figure2.ReportedandprojectedESCOindustryrevenues(nominal):1990‐2017.......................................................18
Figure3.ESCOindustryrevenueshareandabsoluterevenuebymarketsegment.......................................................20
Figure4.ESCOindustryrevenuesharebysizeofESCO..............................................................................................................21
Figure5.ShareofESCOindustryrevenuesbymarketsegmentandsizeofESCO..........................................................22
Figure6.ESCOindustryrevenuebybusinessactivityovertime(nominal$)...................................................................23
Figure7.2014revenuesbybusinessactivityandmarketsegment.......................................................................................24
Figure8.2014ESCOrevenuesbycensussub‐region,disaggregatedbysizeofESCO...................................................26
Figure9.ContributiontoESCOperformancecontractingrevenuesfromnewandexistingcustomers(2012‐2014)..........................................................................................................................................................................................................27
Figure10.Useofnon‐energybenefitsinperformance‐basedprojects(2012‐2014)....................................................29
Figure11.Incorporationofnon‐energybenefitsinState/LocalGovernment,K–12schools,andUniversity/Collegemarkets.............................................................................................................................................................29
Figure12.Incorporationofnon‐energybenefitsinFederalgovernment,Healthcare,andC/Imarkets..............30
Figure13.UseofESPCstrictlyforfacilityimprovementpurposes........................................................................................31
Figure14.Utilizationoflocal,stateorfederaltaxbenefitsinprojectsdevelopedbyESCOsduring2012‐2014......................................................................................................................................................................................................................32
Figure15.Projectfundingsourcesforperformance‐basedprojectsbymarketsegment...........................................33
Figure16.Projectfinancingapproachesbymarketsegment...................................................................................................34
Figure17.Changeintaxrevenuefromexamplestates(PewCharitableTrust2015)..................................................38
Figure18.Debtandunfundedretirementcostsasashareofstatepersonalincome(PewCharitableTrust2015)..........................................................................................................................................................................................................39
List of Tables
Table1.ESCOresponseratestorequestsforinformation.........................................................................................................16
Table2.AverageannualgrowthratesbysizeofESCO................................................................................................................18
Table3.2014ESCOindustryrevenuebymarketsegment........................................................................................................19
Table4.MarketshareoftotalESCOrevenuesreceivedbytheeightlargestcompaniessince2006......................21
Table5.2014ESCOindustryabsoluterevenuebyU.S.Censussub‐regionandESCOsize..........................................25
Table6.NumberofESCOsincorporatingnon‐energybenefitsinperformance‐basedprojects(2012‐2014)..28
Table7.NumberofESCOsreportingincorporationoftaxbenefitsinprojectsimplemented2012‐2014...........32
TableA‐1.ESCOindustryrevenue(nominal$)bymarketsegmentfor2008,2011and2014...............................48
TableA‐2.ESCOindustryrevenuesharebymarketsegmentfor2008,2011and2014............................................48

U.S. Energy Service Company Industry: Recent Market Trends │4
Acronyms and Abbreviations
ARRA AmericanReinvestmentandRecoveryAct
Btu Britishthermalunit
MMBtu MillionBritishthermalunit
C&I commercialandindustrial(privatesector)
CBECS CommercialBuildingEnergyConsumptionSurvey
DOE U.S.DepartmentofEnergy
ECM energyconservationmeasure
EERE (DOEOfficeof)EnergyEfficiencyandRenewableEnergy
EIA EnergyInformationAdministration
ESC EnergyServicesCoalition
ESCO energyservicescompany
ESPC energysavingsperformancecontract
FEMP U.S.DepartmentofEnergyFederalEnergyManagementProgram
HUD U.S.DepartmentofHousingandUrbanDevelopment
HVAC heating,ventilationandairconditioning
IDIQ DOE’sIndefiniteInfiniteQuantity(IDIQ)SuperESPCcontract
LBNL LawrenceBerkeleyNationalLaboratory
MUSH Municipalandstategovernments,universitiesandcolleges,K–12schools,andhealthcaremarkets
NAESCO NationalAssociationofEnergyServiceCompanies
NEBs Non‐energybenefits
O&M operationsandmaintenance
OE (DOEOfficeof)ElectricityDeliveryandEnergyReliability
OWIP (DOEOfficeof)WeatherizationandIntergovernmentalPrograms
PACE PropertyAssessedCleanEnergy
PPA PowerPurchaseAgreement
QECB qualifiedenergyconservationbond
UESC utilityenergysavingscontract

U.S. Energy Service Company Industry: Recent Market Trends │5
Executive Summary
Thisstudypresentsananalysisofthemarketsize,growthprojectionsandindustrytrendsoftheU.S.EnergyServiceCompany(ESCO)industry,drawingoninformationprovidedbyESCOexecutivesinlate2015.WedefineESCOsasenergyservicecompaniesforwhomperformance‐basedcontractingisacorebusinessoffering.Weidentifiedforty‐sevenfirmsthatmetourdefinitionofanESCO.1Forty‐threeofthesecompaniesrespondedtoourrequestsforinformation,representinga91%responserate.2Wealsoreport2014ESCOindustryrevenuesbymarketsegment,regionandbusinessactivitytype,andfornewversusexistingcustomers.Finally,wereportonuseoftaxincentivesandfinancingtools,andincorporationofnon‐energybenefitsintoperformance‐basedprojecteconomics.Wesummarizekeyfindingsbelow.
ESCO Industry Revenue and Growth Trends
Keyfinding: Aftermorethantwodecadesofyear‐over‐yeargrowth,ESCOindustryrevenuesappearedtoflattenbetween2011and2014.
ESCOsreported2014industryrevenueofapproximately$5.3billion,whichrepresentsnoincreaseoverthe2011ESCOindustryrevenueof$5.3billion(nominal$)reportedbyStuartetal.(2013)(seeFigureES‐1).InanearlierLawrenceBerkeleyNationalLaboratory(LBNL)study(Stuartetal2013),ESCOsprojectedannualrevenuesof~$7.5billionin2014,whichwasabout44%($2.3billion)higherthanactualESCO‐reportedrevenues.Keyfinding: ESCOsexpecttotalannualindustryrevenuestobeapproximately$7.6billionin
2017,whichequatestoanaverageannualgrowthrateof~13%from2015‐2017.
1 For purposes of defining the scope of the ESCO industry, we define ESCOs as firms that provide energy efficiency‐related and
other value‐added services and for which performance contracting makes up a core part of its energy‐efficiency services
business. In a performance contract, the ESCO guarantees energy and/or dollar savings for the project and ESCO compensation
is linked in some fashion to the performance of the project. We exclude companies such as engineering and architectural
firms; HVAC, lighting, windows or insulation contractors; companies whose primary business is utility energy efficiency
program implementation; and consultants that offer energy efficiency services, but typically do not enter into long‐term
contracts that link compensation to project energy savings and/or performance. We also exclude companies that only provide
on‐site generation or renewable energy systems without also deploying energy efficiency measures. 2 The four non‐respondent ESCOs were small companies in terms of revenue, which we estimate accounted for about 2% of
total industry revenues

U.S. Energy Service Company Industry: Recent Market Trends │6
Figure ES ‐ 1. Reported and projected ESCO industry revenues (nominal $): 1990‐2017
Keyfinding: Publicandinstitutionalmarketsectorsaccountedfor85%ofindustryrevenue
in2014,whichisconsistentwithpreviousresults.
Theshareofrevenuegeneratedbythefederalsectorwas~21%in2014,thesameasin2011.Theshareofrevenuefromstateandlocalprojectsremainednearlythesamebetween2011(24%)and2014(25%).However,thepercentageofrevenuefromK–12schoolsincreasedbetween2011and2014(from19%to23%),whilerevenuesharefromtheuniversity/collegesectordeclinedinthesameperiod(from14%to10%).Theshareofindustryrevenuefromthehealthcaresectorremainedconsistentbetween2011and2014,at6%.Keyfinding: Performancecontractinggenerated74%($3.7billion)oftheindustryrevenue
in2014,whichwassomewhathigherthanthe69%sharefromperformancecontractingin2011and2008.

U.S. Energy Service Company Industry: Recent Market Trends │7
Design‐buildprojectscontributedthenextlargestportionofrevenuein2014(16%orabout$800million),followeddistantlybyconsultingservices(5%),onsitegenerationpowerpurchaseagreements(PPA)(3%)andotheractivities(2%).Keyfinding: LargeESCOs’shareoftotalindustryrevenuedecreasedsomewhatbetween
2011and2014,whilemediumandsmallESCOs’shareincreasedslightlyin2014.
WeanalyzedshareofindustryrevenuebysizeofESCOovertimeandfoundthattheshareoftotalindustryrevenuesgarneredbylargeESCOs(annualrevenueof$300Morgreater)decreasedfrom56%in2011to51%in2014.Medium‐sizedESCOs(annualrevenuesbetween$100Mand$299M)increasedmarketsharefrom29%in2011to33%in2014.SmallESCOs(annualrevenue<$100M)increasedtheirshareoftotalindustryrevenuefrom15%in2011to16%in2014.Keyfinding: ShareofrevenuebyESCOsizevariesfordifferentmarketsegments.
LargeESCOsasagroupaccountedfor66%of2014industryrevenuesinthefederalmarket,whichishigherthantheiroverallmarketshare(51%).However,smallESCOscaptured25%oftheK–12schoolsmarketand29%oftheprivatecommercialmarket,bothsignificantlyhigherproportionsthansmallESCOs’overallshareofindustryrevenue(16%).Keyfinding: ShareofrevenuebyESCOsizevariesindifferentregionsacrosstheUnited
States.
Forthefirsttime,ESCOsestimatedthedistributionoftheir2014revenuesfromvariousU.S.Censussub‐regions.DisaggregatingtheresultsbysizeofESCO,wefoundthatlargeESCOsaccountedfor~60‐80%ofindustryrevenuesintheWestNorthCentral,MiddleAtlanticandNewEnglandregions.However,intheEastNorthCentralregion,smallESCOsgarnerednearlyasmuchofthetotalmarketrevenueaslargeESCOswhileintheWestandSouthCentralregions,mediumandlargeESCOshadnearlyequalshareofrevenue(~40%and45%respectively).Keyfinding: Newcustomersaccountedforthemajorityofperformance‐basedrevenue
during2012‐2014.
ESCOsalsoestimatedthepercentageofrevenuefromperformance‐basedprojectsgeneratedfromnewandexistingcustomersinvariousmarketsectors.Forperformance‐basedprojectsimplementedduringtheyears2012–2014,newcustomers3accountedforapproximately60%ofK–12schoolsrevenueand85%ofpublichousingrevenue.Inthefederal,university/collegeandhealthcaremarketsectors,newcustomersgeneratedabout50%ofrevenuewhile57%ofstate/localgovernmentmarketrevenuesweregeneratedbynewcustomers.
3 We defined a new customer as a facility or site the ESCO had not previously provided with energy efficiency or other energy
services.

U.S. Energy Service Company Industry: Recent Market Trends │8
Incorporation of Non‐energy Benefits in Performance‐based Projects
Keyfinding: ESCOsreportedincorporatingatleastonetypeofnon‐energybenefitinperformance‐basedprojectsacrossallmarkets.
Thirty‐eightofthirty‐ninerespondentESCOsreportedthattheyincorporatedatleastoneofsixtypesofnon‐energybenefits(NEBs)inperformance‐basedprojectsimplementedbetween2012and2014foratleastonemarketsegment.4NearlyalloftheESCOsindicatedthatthreetypesofnon‐energybenefits—avoidedO&M,avoidedcapitalcostsandwaterconservation—areincorporatedacrossallmarketsectors[seeFigureES‐2].
Figure ES ‐ 2. Use of non‐energy benefits in performance‐based projects (2012‐2014)
4 Incorporation of non‐energy benefits (NEBs) into a performance contract involves estimating dollar values for the NEBs and
accounting for them in the project economics and guaranteed or stipulated savings.
U.S. Energy Service Company Industry: Recent Market Trends │9
Tax Benefits and Financing Approaches
Keyfinding: MorethanhalfoftheESCOsthatserveeachmarketreportedusinglocal,state,orfederaltaxbenefits.
ThirtyESCOsestimatedthepercentageoftheirprojectsimplementedduring2012–2014thatusedlocal,state,orfederaltaxbenefits(e.g.,Section179dInvestmentTaxCredit[ITC],ortheProductionTaxCredit[PTC]).Acrossallmarketsectors,morethan50%oftheESCOsthatserveeachmarketreportedusingtaxbenefits.OftheESCOsthatrespondedforthestate/localmarket,nearly50%(elevenoftwenty‐four)reportedthatahighpercentage(>66%)ofstate/localprojectsusedtaxbenefits.OftheESCOsservingtheK–12market,50%(twelveoftwenty‐four)reportedthatahighpercentageofK–12projectsleveragedtaxbenefits.Inthefederalsector,30%(fiveoffifteen)ESCOsreportedthatahighpercentageofprojectsusedtaxbenefits.Keyfinding: ESCOsreporteduseofvariousfinancingapproachesforprojectsthatwere
partiallyor100%financed,bymarket.
WealsoaskedESCOstoestimatetheshareofperformance‐basedprojects(100%financedoracombinationofcashandfinancing)thatclosedfinancingduringthe2012‐2014period,thatusedeachofthefollowingsourcesoffunds,bymarketsector:(1)bond;(2)lease;(3)termloan;and(4)other(seerightaxisofFigureES‐3).ESCOsreportedthatmostfederalprojectswerefinancedusingtermloans.FinancedprojectsintheMUSH5andprivatecommercialmarketsmadeextensiveuseofleasesandtermloans.Bondsweremostlyusedforstate/localandK–12schoolsprojects.
5 MUSH includes municipal and state governments, universities and colleges, K‐12 schools, and healthcare markets.

U.S. Energy Service Company Industry: Recent Market Trends │10
Figure ES ‐ 3. Financing Approaches by Market Segment (2012‐2014)

U.S. Energy Service Company Industry: Recent Market Trends │11
1. Introduction
TheU.S.energyservicescompany(ESCO)industryhasawell‐establishedrecordofdeliveringsubstantial,cost‐effectiveenergyandeconomicsavingsinlargeandmedium‐sizedfacilities,primarilyinthepublicandinstitutionalsector(Vineetal.1999,Goldmanetal.,2005,Hopperetal.2007,Satchwelletal.2010,Larsenetal.2012,Stuartetal.2014).Theindustryachievessignificantincrementalenergysavingseachyear.In2012,ESCO‐implementedprojectsintheUnitedStatesthatwerestillinthecontractperformanceperioddeliveredatotalofabout34TWhofelectricitysavings.Energysavingsfromallsourcestotaledapproximately224millionMMBtuorabout1%oftotalannualenergyconsumptioninU.S.commercialbuildings(Carvalloetal.2015).ESCOsdelivermostoftheseenergyandcostsavingsthroughanenergysavingsperformancecontract(ESPC)model.ESPCsarelong‐termcontractsbetweenESCOsandcustomersthatenablecustomerstofinanceenergyefficiency,onsitegenerationandothertypesofenergyprojectswithouttheneedforsignificantup‐frontcapital.TheESCOtypicallyguaranteesthattheprojectwillgenerateaspecifiedannuallevelofenergysavingssufficienttopaybacktheprojectinstallationandfinancingcosts.ThisreportbuildsonpreviousstudiesoftheU.S.ESCOindustryconductedbyLawrenceBerkeleyNationalLaboratory(LBNL)andpresentspolicy‐relevantfindingsonrecentU.S.ESCOindustrygrowthandmarkettrends.WedrawoninterviewsconductedwithESCOindustryexecutivesinlate2015.TodefinetheboundariesoftheESCOindustryforpurposesofreportingindustrytrendsandmarketactivity,weusethedefinitionofanESCOestablishedbyLarsenetal.(2012):
Acompanythatprovidesenergyefficiency‐relatedandothervalue‐addedservicesandfor which performance contracting is a core part of its energy efficiency servicesbusiness. In a performance contract, the ESCO guarantees energy and/or dollarsavingsfortheprojectandESCOcompensationistherefore linkedinsomefashiontotheperformanceofthecontract.
In2011,ESCOsreportedaggregateindustryrevenuesofabout$5.3billion,withexpectationsofgrowingtoabout$7billionbytheendof2014(Stuartetal.2014).About80‐85%ofindustryrevenuehascomefromthe“MUSH”market(municipalities,universities,collegesandK‐12schools,stategovernmentfacilitiesandhealthcarefacilities)andfederalcustomers.Historically,ESCOindustrygrowthhasbeendrivenlargelybyenablingpoliciesaswellascapitalimprovementneedsofcustomers.Examplesofsuchpoliciesincludethefollowing:
PresidentObamacalledforacombined$4BinfederalESPCtobeimplementedfromDecemberof2011throughDecember2016(TheWhiteHouse2011;2014).AsofMay2016,awardedprojectstotaled$3B(Rockwell,2016).
Forty‐sevenstateshaveenablinglegislationthatallowsESPC(ORNL2016;NCSL2013),whichallowexemptionsfromstandardbiddingrequirements,suchastherequirementinmanyjurisdictionsthatK‐12andlocalgovernmentcapitalborrowingsbeapprovedby

U.S. Energy Service Company Industry: Recent Market Trends │12
voters,iftheESPCprovidesthesavingsguarantee.
ManyofthesestatesoffermodesttocomprehensivetechnicalsupportforESPCimplementedingovernmentandeducationalfacilities.Forexample,theNevadaGovernor’sOfficeofEnergyadministersacomprehensiveESPCprogram,whichincludestechnicalassistance,accesstoapoolofpre‐qualifiedESCOs,requireddocumentationandreporting,andfinancialsubsidiesforinvestmentgradeaudits.Severalstatesareintheprocessoframpinguporre‐establishinglanguishingESPCprograms.However,somepreviouslyactiveESPCprogramsinseveralstateshavefallendormantduetobudgetchallenges,complexcontractingprocesses,andstaffingreductionsinleadagenciesthatadministerESPCprograms.6
Energyefficiencytaxbenefitsandtaxdeductions,including179d7,enableincreasedinvestmentandsavingsforESPCprojectsoverwhatwouldhavebeenpossiblewithoutthetaxbenefit.179dwasrecentlyextendedthrough2016;Stuartetal.(2013)reportedthatmostESCOsleveragedsomeformoftaxbenefitsinsomeoftheirprojects.
SomestatesaresuccessfullyleveragingQualifiedEnergyConservationBonds(QECBs)8tohelpfinancepublicsector(city,county,K–12,state)energyefficiencyprojects,includingprojectsthatincludeperformancecontracting(EPC2016).Inourinterviews,someESCOsreportedthattheyareinformingstateenergyofficesandtheirlocalclientsabouttheavailabilityofQECBs.
CommercialProperty‐AssessedCleanEnergy(PACE)programs9areactiveinsixteenstates(PaceNation2016).PACEenablesfinancingofenergyefficiency,renewableandwaterconservationmeasuresinbuildingsviaanassessmentontheproperty’staxbillthatcanberepaidoveraloantermofuptotwentyyears.SomeESCOspromotetheuseofcommercialPACEtotheircustomers.10
6 California Department of General Services (DGS) reported that the state’s current three‐contract ESPC requirement makes
transaction costs too high for most ESCOs; a 2016 legislative proposal to streamline the ESCO is in process (Sacks 2016). The
Arizona Governor’s Office of Energy Policy, responsible for reviewing the state’s ESPCs, was closed in late 2015 (Randazzo
2015). The Illinois FY16 budget impasse has stalled efficiency projects in K‐12 schools and other facilities (Daniels 2016). 7 179d, the Energy Efficient Commercial Buildings Tax Deduction, is a section of the Federal Tax Code enacted under the 2005
Energy Policy Act (EPACT). This section provides a tax deduction to building owners, or to contractors (e.g., architects, design
firms, ESCOs) for making energy efficiency improvements to commercial buildings. In 2008, the tax code was amended to allow
government agencies to assign their 179d deduction to the implementer or designer of their buildings’ efficiency projects.
179d is scheduled to expire December 31, 2016. 8 QECBs are U.S. Treasury‐subsidized bonds that enable state, tribal and local government issuers to borrow money to fund a
range of energy conservation projects at very attractive borrowing rates over long contract terms. QECBs provide subsidies
that cover a substantial portion of the interest the public agency issuer pays back to bond purchasers (DOE 2012a). The
American Reinvestment and Recovery Act (ARRA) increased the national bond cap for QECBs by $2.4 billion to a total of $3.2
billion and provided allocations to each state proportional to population. 9 PACE statutes authorize municipalities and counties to work with private sector lenders to provide financing for authorized
energy projects (e.g., energy efficiency retrofits, onsite renewable generation) and to collect loan repayment for a term of up
to 20 years through an annual assessment on the property’s real estate tax bill. 10 NORESCO (2016) promotes its experience with PACE on its website; Ameresco (2015b) and Johnson Controls (2013b) have
publicized projects that leveraged PACE financing.

U.S. Energy Service Company Industry: Recent Market Trends │13
Thisreportisintendedforfederal,state,andlocalpolicymakers,ESCOindustryexecutives,otherenergyefficiencyserviceprovidersandendusers.ThereportprovidesanexplanationoftherolethatESCOscanplayinsecuringprivatecapitalforenergyefficiencyinvestment,includingcurrentandprojectedinvestmentlevels,whichmarketsESCOsreachmosteffectivelyandwherethepotentialforgrowthresides.WhiletheevolutionoftheU.S.ESCOindustrydifferssignificantlyfromthatofothercountries’energyefficiencyservicesmarkets,internationalpolicymakersandstakeholdersmayalsobenefitfromknowledgeaboutU.S.ESCOindustrytrendstoinformtheirworktoexpandprivate‐sectorenergyservicesindustriesintheirownjurisdictions.Thispaperisorganizedasfollows.Section2summarizesinformationaboutourdatasourcesandanalysisapproach.Section3providesfindingsonESCOindustrygrowthandindustrycharacteristics.Section4discussesfactorsthatinfluencerecentESCOindustrymarketactivityandprospectsforfuturegrowth.Section5summarizesfindings,discussespolicyimplications,andintroducespossibleextensionsofthiswork.

U.S. Energy Service Company Industry: Recent Market Trends │14
2. Data Sources and Methods
Inthissection,wediscussdatasourcesandmethodsfordevelopingestimatesof2014ESCOindustryrevenues,projectedgrowthinESCOrevenuesto2017,andmarketcharacteristics.Forpurposesofdefiningtheindustryscopeandestimatingindustryrevenue,weincludeonlythosecompaniesthatmeetourdefinitionofanESCO:firmsthatprovideenergyefficiency‐relatedandothervalue‐addedservicesforwhichperformancecontractingisacorepart11ofitsenergyefficiencyservicesbusiness.Weexcludefirmssuchasengineeringandarchitecturalfirms;mechanicalcontractorsthatprovidearangeofenergyefficiencyequipmentinstallationandenergymanagementservicesbutdonotofferperformancecontracts;HVAC,lighting,windowsorinsulationcontractors;companieswhoseprimarybusinessisutilityenergyefficiencyprogramimplementation;andconsultantsthatofferenergyefficiencyservices,buttypicallydonotenterintolong‐termcontractsthatlinkcompensationtoprojectsavingsand/oreconomicperformance.Wealsoexcludecompaniesthatexclusivelyprovideon‐sitegenerationorrenewableenergysystemswithoutalsoinstallingmeasurestoaddressenergyefficiency.SomeexcludedcompaniesserveassubcontractorstoESCOsandmayevenengageinperformance‐basedworkattimes,butnotasacorebusinessoffering.Thesecompaniescontributetothebroadermarketforenergyefficiency,cleanenergyandretailenergyservices,butarenotincludedinourassessmentoftheU.S.ESCOindustry.
2.1. Data Sources
Wecollectedinformationfromseveralsourcesincluding:
InterviewswithESCOexecutivesconductedinlate2015
Publicly‐availableinformationoncorporations’financialperformance
Companywebsites
eProjectBuilder12
TheLBNL/NationalAssociationofEnergyServiceCompanies(NAESCO)databaseofprojects
ADelphi13processwithindustryexperts
DatafrompreviousLBNLstudiesthatanalyzedESCOindustrytrendsandproject11 We define companies for whom performance contracting is a core part of its energy efficiency services business as
companies that self‐define as an ESCO in our interviews, those that clearly indicate on their websites that they offer
performance contracting, or those that announce performance contracting projects through public news releases 12 eProject Builder (ePB) is a secure web‐based ESPC data management system developed and managed on behalf of U.S. DOE
by Lawrence Berkeley National Laboratory. ePB standardizes data collection and reporting for ESPC projects nationwide—
across ESCOs and customers in all market sectors. As of September 20, 2016 the ePB database contained 435 projects across
federal, state, local, university and K‐12 markets. For more information, see eprojectbuilder.lbl.gov. 13 A Delphi technique is a process used in business forecasting to reach a consensus via the solicitation and comparison of the
views of a small group of experts (Stuart et al. 2014, Satchwell et al. 2010, Hopper et al. 2007, Linstone and Turoff 1975).

U.S. Energy Service Company Industry: Recent Market Trends │15
performance.14
TheprimarysourceofESCOrevenuedatausedinthisreportcamefromcommunicationwithU.S.ESCOexecutivesconductedduringthesummerandfallof2015.WeaskedESCOstoprovideinformationabouttheircompany’s2014revenuefromenergyservices;growthinprojectedrevenueinthenextthreeyears;activitybymarketsegment,businesstype(e.g.,performancecontracting,design‐build,PPA),andregion;andtheshareofnewversusexistingcustomers.Wedefinedenergyservicesasperformancecontracts,energy‐efficiencydesign/buildprojects,engineering,procurement&constructionprojects,andenergyefficiency‐relatedconsulting.Forpurposesofthisreport,thedefinitionofenergyservicesexcludesretailcommoditysalesorprojectsbuilttosupplypowertobulkpowermarkets.WealsoaskedESCOstoprovideinformationaboutseveraltopicspertainingtoperformance‐basedprojectsincludingprojectfinancingapproaches,useoftaxbenefits,incorporationofnon‐energybenefitsandtypicalM&Vpractices.Afterreviewingtheinitialquantitativeresults,weconductedfollow‐upinterviewswithsomeESCOstogainadditionalinsightintosomeofthekeyfindings.
2.2. Method
WefirstdevelopedacomprehensivelistoffirmsthatmightbeconsideredESCOsforthepurposesofthisstudyandusedthefollowingsourcestoidentifyESCOsactiveintheUnitedStates:
NAESCO‐accreditedESCOs
U.S.DOElistofqualifiedenergyservicecompaniesforthefederalESPCprogram
MembersoftheEnergyServicesCoalition(ESC)thatindicatedthattheyprovidedperformancecontracting
QualifiedESCOsidentifiedthroughactivestateperformancecontractingprograms,includingArkansas,Colorado,Delaware,NorthCarolina,OregonandWashington
EnergyservicescompaniesidentifiedinpreviousLBNLmarketsurveys
Onlineresearchtoidentifyothercompanieswhomightbeengagedinperformancecontracting;and
EnergyservicecompaniesthathaverequestedaccountsortrainingforeProjectBuilderThroughthisprocess,weidentifiedaninitiallistof139firmsthatappearedtoprovideenergyefficiencyservices,possiblyincludingperformancecontracting.Next,weundertookadditionalmarketresearchonthisinitiallistoffirmstodeterminewhetherfirmswerestillinbusiness,whethertheyhadbeenacquiredbyotherESCOs,andwhethertheyofferedenergyefficiency
14 See Stuart et al. (2014), Larsen et al. (2012), Satchwell et al. (2010), Hopper et al. (2007), and Goldman et al. (2005).

U.S. Energy Service Company Industry: Recent Market Trends │16
performancecontractingasacoreactivity.15Throughthisprocess,weidentifiedforty‐sevenESCOsthatmetourcriteriaandthatwerestillactivelyworkingintheUnitedStates.16Forty‐threeoftheforty‐sevencompaniesrespondedtoourrequestsforinformationresultingina91%responserate,whichwassomewhathigherthanourpreviousstudies(seeTable1).Table 1. ESCO response rates to requests for information
Year Respondent ESCOs Response Rate
Satchwell et al. (2010) 29 of 38 76%
Stuart et al. (2013) 35 of 45 78%
Stuart et al. (2016) 43 of 47 91%
Weestimatedtotal2014ESCOindustryrevenuefromenergyservicesbysummingrevenuesreportedbytheforty‐threerespondentESCOsandtheestimatedrevenuesforthefournon‐respondentcompanies.17Wealsodevelopedestimatesof2014revenuesbymarketsegment,regionandcontracttypeandfornewversusexistingcustomersbymultiplyingthepercentofrevenueeachrespondentESCOreportedforeachofthesevariablesbytheESCOs’reportedrevenue.WealsoaskedeachESCOtoprovideannualrevenuegrowthprojectionsforthenextthreeyears(2015to2017),anddevelopedanaggregateestimateofprojectedU.S.ESCOindustryrevenuesforthatperiodbyapplyingeachESCO’sgrowthprojectionstoits2014revenues.
15 We excluded fifteen companies included in the previous LBNL ESCO market study because they were acquired by other
ESCOs, indicated that they no longer provided performance contracting, or whose websites gave no indication that they
provide performance contracting and they did not respond to our requests for confirmation. Of the ninety‐two companies
excluded from this study, nine had been acquired or were subsidiaries of ESCOs, three appeared to be out of business, twelve
responded to us that they are not an ESCO or no longer provide performance contracting, seven were just entering the
performance contracting business and could not respond with 2014 or historical data, and 61 appeared to provide some level
of energy efficiency services but not performance contracting. 16 Our market research included: (1) reviewing every company’s website to determine whether the company was in business
and whether the website included performance contracting among its energy efficiency services; (2) where such information
was unclear, contacting the company to ask whether it provides energy efficiency performance contracting; and (3)
determining the company was not a subsidiary of another company in our survey. Our initial market research process may not
have identified all of the small regional ESCOs or mechanical contractors in the United States that undertook an energy savings
performance contract in 2014. Because revenues from energy services for regional companies tend to be modest, we believe
that our results represent ~90% or more of U.S. ESCO industry revenue. 17 For ESCOs that are part of a larger organization, the revenues included for purposes of this report come exclusively from the
business unit providing ESCO‐related energy services. As part of our QC/QA process, we compared the 2014 results with
revenue estimates from the Stuart et al. (2014) study and to other public information (e.g., company reports, U.S. SEC 10‐K
filings). Estimates of 2014 revenue for the four non‐respondent companies came from a Delphi process with industry experts.
Total estimated revenue for the four non‐respondent companies accounted for only about 2% of aggregate industry revenue.
U.S. Energy Service Company Industry: Recent Market Trends │17
3. U.S. ESCO Industry Revenue and Market Trends
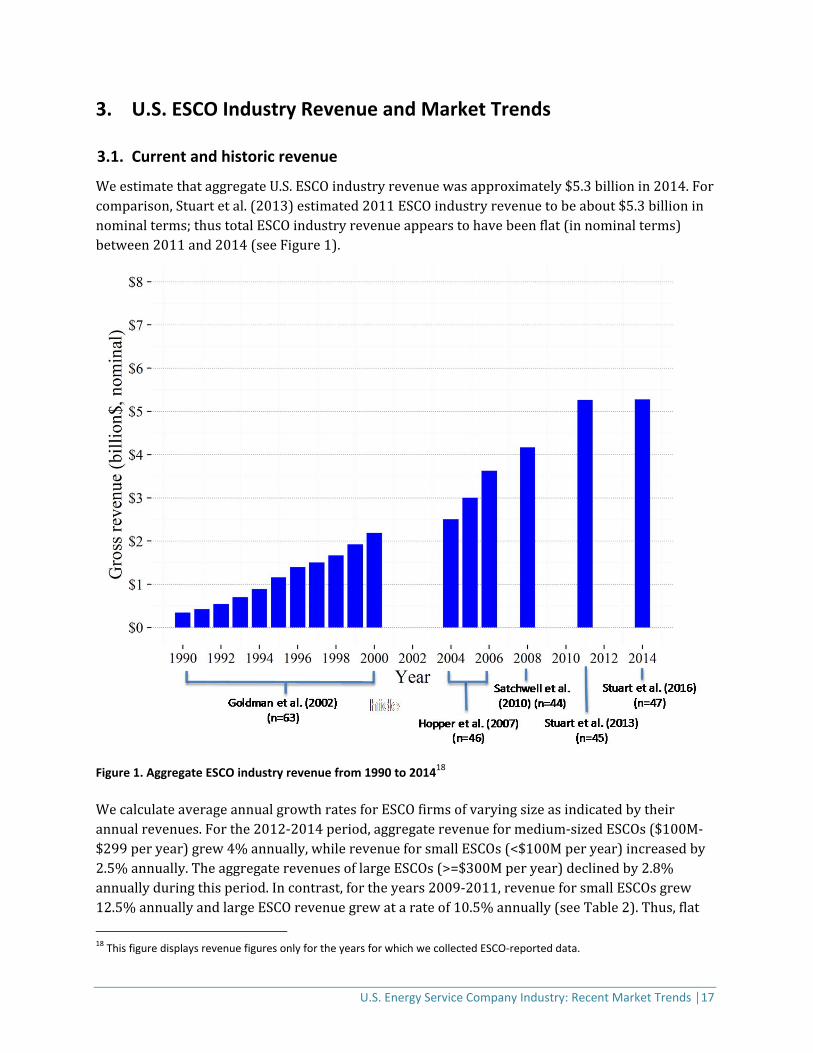
3.1. Current and historic revenue
WeestimatethataggregateU.S.ESCOindustryrevenuewasapproximately$5.3billionin2014.Forcomparison,Stuartetal.(2013)estimated2011ESCOindustryrevenuetobeabout$5.3billioninnominalterms;thustotalESCOindustryrevenueappearstohavebeenflat(innominalterms)between2011and2014(seeFigure1).
Figure 1. Aggregate ESCO industry revenue from 1990 to 201418
WecalculateaverageannualgrowthratesforESCOfirmsofvaryingsizeasindicatedbytheirannualrevenues.Forthe2012‐2014period,aggregaterevenueformedium‐sizedESCOs($100M‐$299peryear)grew4%annually,whilerevenueforsmallESCOs(<$100Mperyear)increasedby2.5%annually.TheaggregaterevenuesoflargeESCOs(>=$300Mperyear)declinedby2.8%annuallyduringthisperiod.Incontrast,fortheyears2009‐2011,revenueforsmallESCOsgrew12.5%annuallyandlargeESCOrevenuegrewatarateof10.5%annually(seeTable2).Thus,flat
18 This figure displays revenue figures only for the years for which we collected ESCO‐reported data.

U.S. Energy Service Company Industry: Recent Market Trends │18
ordecliningrevenuesamonglargerESCOsappearstobeasignificantcontributortotheoverallindustryslowdownbetween2012and2014.Table 2. Average annual growth rates by size of ESCO
ESCO Size Average Annual Growth Rate 2009‐2011 (nominal)
Average Annual Growth Rate 2012‐2014 (nominal)
Small 12.5% (n=32) 2.5% (n=31)
Medium 2.7% (n=8) 4% (n‐10)
Large 10.5% (n=5) ‐2.8% (n=6)
3.2. Short‐term revenue projections from ESCOs
BasedonESCOs’growthprojectionsfor2015‐17,weestimatethattheU.S.ESCOindustryanticipatestotalannualrevenuesofapproximately$7.6billionin2017,whichequatestoanaverageannualgrowthrateof~13%overthethreeyeartimeframe(seeFigure2).
Figure 2. Reported and projected ESCO industry revenues (nominal): 1990‐2017

U.S. Energy Service Company Industry: Recent Market Trends │19
Wealsocompare2014revenuetoindustryprojectionsoffuturerevenuefromapreviousLBNLstudy(Stuartetal.2013)inwhichESCOsprojectedthattheirrevenueswouldbe~$7.5billionin2014(seeorangelineinFigure2).AsFigure2shows,thisrevenueprojectionturnedouttobeabout$2.3billionhigher(44%)thanactualESCO‐reportedrevenuesfor2014($5.3billion).TheESCOindustry’srevenuegrowthprojectionsfor2015‐17period(~13%annualgrowthrate)aresimilartoprojectionsmadefor2012‐2014(~12%annualgrowthrate)[Stuartetal.2014]butlowerthanESCOs’growthprojectionsmadeforthe2009‐2011period(~25%)[Satchwelletal.2010].
3.3. ESCO industry revenues by market segment and size of ESCO
WeaskedESCOstoestimatethebreakdownoftheir2014revenueamongvariousmarketsegments.Forty‐threeESCOsprovidedtheinformationwhichissummarizedinTable3.In2014,about85%ofESCOrevenuescamefromfederal,stateandlocalgovernmentfacilities,universitiesandcolleges,K–12schoolsandhealthcareandhospitalfacilities.State/localgovernments,K–12schoolsandfederalcustomersaccountedfor25%,24%,and21%ofESCOindustryrevenue,respectively.Table 3. 2014 ESCO industry revenue by market segment
Market Segment Share of Total Revenue
2014 Revenue
($ million)
State/Local 25.4% $1,314
K–12 Schools 23.5% $1,219
Federal 20.7% $1,073
University/College 10.0% $519
Healthcare 5.9% $304
Commercial/Industrial 7.9% $409
Public Housing/Other 6.6% $342
SUBTOTAL (n=43) 100.0% $5,180
Non‐respondents/Delphi process (n=4) ‐ $95
TOTAL $5,275
Historically,thebulkofESCOindustryrevenuehascomefromthepublicandinstitutionalsectors.Figure3showsabsoluterevenueandthebreakdownbymarketsectorfor2014comparedtoyearsreportedinpreviousLBNLstudies.In2014,thecombined“MUSH”andfederalsectorsmadeup85%ofindustryrevenue,upslightlyfrom82%in2011.Theuniversity/collegesectordeclinedtoa10%sharein2014,downfrom16%in2008.Thepercentageofrevenuegeneratedbythefederalsectorwas21%in2014whichiscomparabletomarketsharein2011and2006(22%).Thefederalmarketrevenuesharetookasignificant,butapparentlytemporary,dipin2008,to15%(Stuartet

U.S. Energy Service Company Industry: Recent Market Trends │20
al.2013,Satchwelletal.2010,Hopperetal.2007).19Theprivatecommercial/industrialsectorgeneratedabout8%of2014industryrevenue,thesamepercentageasin2011.SeeAppendixA,TablesA‐1andA‐2forthemarketshareandrevenuedatapresentedinFigure3.
Figure 3. ESCO industry revenue share and absolute revenue by market segment
WealsoreportmarketshareintermsofsizeofESCOfirm,comparing2014resultstorevenuesreportedbyfirmsinpreviousLBNLreports.TheshareoftotalESCOindustryrevenuesgoingtolargeESCOs(annualrevenueofgreaterthan$300M)decreasedfrom56%in2011to51%in2014.SmallESCOshaveslightlyincreasedmarketshareoverthissixyeartimeperiod,from14%in2008to16%in2014(seeFigure4).
19 Indefinite Delivery Indefinite Quantity (IDIQ) contracts are “blanket” contracts issued to multiple ESCOs by DOE and Army
Corps of Engineers. They streamline procurement of ESPC projects by placing them under a single standardized contract (FEMP
2013). The 2007 ESPC IDIQ Continuation Plan required project proposals to kick off by April 1, 2008; projects not meeting that
deadline would not be authorized to proceed under the then current DOE ESPC IDIQ contract (DOE 2012b). There was a lull in
federal ESPC activity until the contract was extended.

U.S. Energy Service Company Industry: Recent Market Trends │21
Figure 4. ESCO industry revenue share by size of ESCO
WealsoobservethatthemarketshareofthelargesteightESCOshasdeclinedsince2006.In2006,thesefirmsaccountedfor79%oftotalrevenuewhereasthetopeightfirmsaccountedfor60%oftotalindustryrevenuein2014(seeTable4).20Table 4. Market share of total ESCO revenues received by the eight largest companies since 2006
Year % of Total Market Revenue Revenue ($ million)
2014 60% $3,178
2011 70% $3,707
2008 76% $3,137
2006 79% $2,867
20 The eight largest ESCOs (by revenues) changed somewhat year‐to‐year and includes both large and some medium‐sized
ESCOs.

U.S. Energy Service Company Industry: Recent Market Trends │22
Wealsolookedattheactivitylevelsoflarge,mediumandsmallESCOsinvariousmarketsegmentsandhighlightseveralfindings:
LargeESCOs(>$300M)accountedfor66%oftotalrevenuesinthefederalmarket,whichishigherthantheiroverallmarketshare(51%);
Medium‐sizedESCOs’shareofrevenueintheK–12(31%),University(35%)andstate/local(36%)marketswerecomparabletotheir33%shareoftotalindustryrevenue;
SmallESCOs(<$100M)capturedasubstantialportion(25%)oftheK–12schoolsmarket,whichisasignificantlyhigherproportionthantheir16%shareoftotalindustryrevenue;and
SmallESCOsalsodorelativelywellintheprivatecommercial/industrialmarketwheretheyaccountfor29%ofthesector’sbusinessin2014(seeFigure5).
Figure 5. Share of ESCO industry revenues by market segment and size of ESCO

U.S. Energy Service Company Industry: Recent Market Trends │23
3.4. Revenue trends over time by type of ESCO business activity and sector
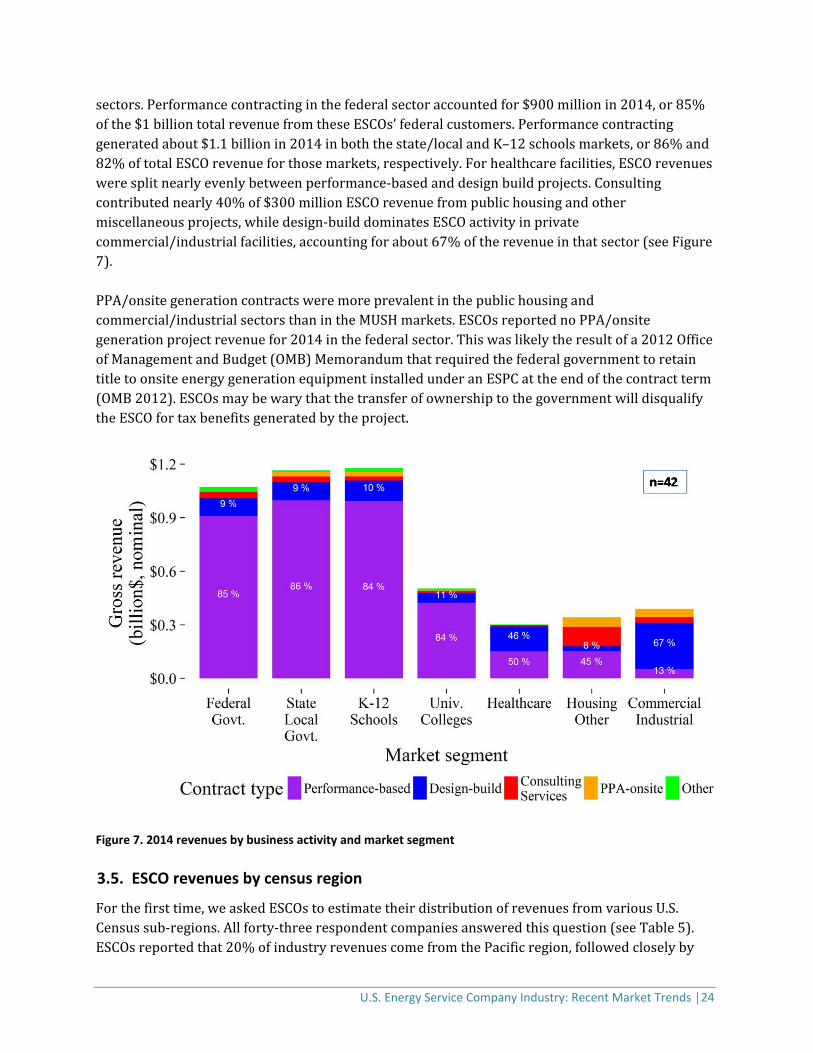
ESCOsalsoestimatedtheshareoftheir2014energyservicesforvariousbusinessactivities:performance‐basedcontracts,design‐build,consultingservices,onsitegenerationpowerpurchaseagreements(PPA),utilityprogramimplementationandotheractivities.21Figure6showsthattheshareofrevenuefromperformancecontractingin2014was74%($3.7B)—thisvalueissomewhathigherthantheshare(69%)reportedin2008and2011.Design‐buildprojectscontributedthenextlargestshareofrevenuein2014(16%orabout$800million),followedbyconsulting(5%),onsitegenerationPPA(3%)andother(2%).22
Figure 6. ESCO industry revenue by business activity over time (nominal $) Forty‐twoESCOsestimatedthebreakdownoftheir2014revenuesfromeachtypeofbusinessactivitybymarketsegment.PerformancecontractingistheoverwhelmingchoiceforgovernmentandeducationalcustomerswhenprocuringservicesfromanESCO,butlessprevalentinother
21 Design‐ build projects involve fee‐based contracts that may include such services as engineering, procurement, project
installation and construction; ESCOs do not guarantee energy savings or assume long‐term performance risk in these projects.
Consulting contracts can include a wide range of activities including audits, engineering studies, project and subcontractor
management. Some ESCOs manage or implement programs for utility energy efficiency programs, most commonly in the small
commercial or commercial/industrial sector, but occasionally in the residential sector as well. Under a PPA, a third‐party (e.g.,
ESCO) installs and operates an onsite energy generation system and sells the generated energy to the customer. 22 In this study, we asked ESCOs to include utility program implementation services under “Other” rather than as a separate
category, and thus that category does not appear in the 2014 pie in Figure 6. It is likely that some revenue from utility
consulting contracts, which ESCOs included in the “Utility programs implementation” category in 2011, was reported under the
“Consulting Services” category for 2014.
U.S. Energy Service Company Industry: Recent Market Trends │24
sectors.Performancecontractinginthefederalsectoraccountedfor$900millionin2014,or85%ofthe$1billiontotalrevenuefromtheseESCOs’federalcustomers.Performancecontractinggeneratedabout$1.1billionin2014inboththestate/localandK–12schoolsmarkets,or86%and82%oftotalESCOrevenueforthosemarkets,respectively.Forhealthcarefacilities,ESCOrevenuesweresplitnearlyevenlybetweenperformance‐basedanddesignbuildprojects.Consultingcontributednearly40%of$300millionESCOrevenuefrompublichousingandothermiscellaneousprojects,whiledesign‐builddominatesESCOactivityinprivatecommercial/industrialfacilities,accountingforabout67%oftherevenueinthatsector(seeFigure7).PPA/onsitegenerationcontractsweremoreprevalentinthepublichousingandcommercial/industrialsectorsthanintheMUSHmarkets.ESCOsreportednoPPA/onsitegenerationprojectrevenuefor2014inthefederalsector.Thiswaslikelytheresultofa2012OfficeofManagementandBudget(OMB)MemorandumthatrequiredthefederalgovernmenttoretaintitletoonsiteenergygenerationequipmentinstalledunderanESPCattheendofthecontractterm(OMB2012).ESCOsmaybewarythatthetransferofownershiptothegovernmentwilldisqualifytheESCOfortaxbenefitsgeneratedbytheproject.
Figure 7. 2014 revenues by business activity and market segment
3.5. ESCO revenues by census region
Forthefirsttime,weaskedESCOstoestimatetheirdistributionofrevenuesfromvariousU.S.Censussub‐regions.Allforty‐threerespondentcompaniesansweredthisquestion(seeTable5).ESCOsreportedthat20%ofindustryrevenuescomefromthePacificregion,followedcloselyby

U.S. Energy Service Company Industry: Recent Market Trends │25
theSouthAtlantic(18%)andMiddleAtlantic(18%),andEastNorthCentral(16%)regions.About7%ofindustryrevenuecomesfromNewEnglandstates,with6%comingfromtheWestSouthCentralregionandabout5%foreachoftheWestNorthCentral,MountainandEastSouthCentralregions.Table 5. 2014 ESCO industry absolute revenue by U.S. Census sub‐region and ESCO size
U.S. Census Sub‐region
States Total Revenue ($M)
Large ESCOs Revenue ($M) (% Share for Region)
Medium ESCOs
Revenue ($M) (% Share for Region)
Small ESCOs Revenue ($M) (% Share for Region)
New England
CT, MA, ME, NH, RI, VT
$371
$257 (69%) $79 (21%) $35 (9%)
Middle Atlantic
CT, PA, NJ, NY $899 $487 (54%) $326 (36%) $86 (10%)
South Atlantic
DE, DC, GA, FL, MD, NC, SC, VA,
WV
$985 $542 (55%) $388 (39%) $55 (6%)
East South Central
AL, KY, MS, TN $256 $109 (42%) $79 (31%) $68 (26%)
West South Central
AR, LA, OK, TX $302 $157 (52%) $130 (43%) $15 (5%)
East North Central
IL, IN, MI, OH, WI $825 $375 (45%) $178 (22%) $272 (33%)
West North Central
IA, KS, MN, MO, ND, NE, SD
$226 $181 (80%) $30 (14%) $15 (6%)
Mountain AZ, CO, ID, MT, NV, NM, UT, WY
$286 $172 (60%) $91 (32%) $23 (8%)
Pacific AK, CA, HI, OR, WA
$1,031 $410 (40%) $422 (41%) $199 (19%)
Total – All Regions
$5,181 $2,690 (52%) $1,724 (33%) $768 (15%)
WedisaggregatereportedrevenuebysizeofESCOandfindthat—intheWestNorthCentral,MiddleAtlanticandNewEnglandregions(seeTable5forstatesincludedineachregion)—largeESCOsaccountfor~60‐80%ofrevenueshareineachofthoseregions.However,intheEastNorthCentralregion,smallESCOshavenearlyasmuchofthetotalmarketaslargeESCOs.IntheWestandSouthCentralregions,mediumandlargeESCOshavenearlyequalshare(~40%and45%respectively)[seeFigure8].

U.S. Energy Service Company Industry: Recent Market Trends │26
Figure 8. 2014 ESCO revenues by census sub‐region, disaggregated by size of ESCO
3.6. ESCO performance contracting revenues from new and existing customers
WealsoaskedESCOstoreportestimatedshareof2014performancecontractingrevenuethatcamefromnewandexistingcustomersinvariousmarketsectorsforthepastthreeyears(2012–2014).Wedefinedanewcustomeras“afacilityorsitethatyourcompanyhadnotpreviouslyprovidedwithenergyefficiencyorotherenergyservices.”ESCOprojectsforexistingcustomerstypicallyinvolveadditionalprojectphasesormodificationsthatincreaseprojectscope(e.g.,retrofitadditionalbuildingsatacampus)orinstalladditionalmeasures.Fortyoftheforty‐threerespondentESCOsprovidedinformationonthisquestion.Approximately60%ofESCOrevenuesfromK–12schoolsand85%ofpublichousingrevenuecamefromnewcustomersbetween2012and2014.Inthefederal,university/collegeandhealthcaremarketsectors,newcustomersgeneratedabout50%ofESPCrevenuewhile57%ofrevenuesinthestate/localgovernmentmarketweregeneratedbynewcustomers.ESCOsindicatedthatlessthan40%oftheirrevenuesintheprivatecommercial/industrialsectorcamefromnewcustomers(seeFigure9).

U.S. Energy Service Company Industry: Recent Market Trends │27
Figure 9. Contribution to ESCO performance contracting revenues from new and existing customers (2012‐2014)
3.7. Incorporation of non‐energy benefits in ESPC
WeaskedESCOstoestimatethepercentageofperformance‐basedprojectsimplementedduringthepastthreeyears(2012–2014)ineachmarketsegmentthatincorporatedsometypeofnon‐energybenefit(NEB)intheprojecteconomics.Forthisstudy,weaskedaboutsixtypesofNEBsthatareoftenacceptedeitherinstatesthatauthorizeinclusionofNEBs,orinfederalgovernmentESPCprojects:(1)avoidedcapitalcosts;(2)avoidedoperationsandmaintenance(O&M)costs;(3)benefitsfromdemandresponse;(4)increasedrevenues;(5)tradeableemissionscredits;and(6)waterconservation.2338ofthe39ESCOsthatrespondedtothisquestionreportedincludingatleastonetypeofNEBinatleastonemarketsegment.Table6showsthenumberofESCOsthatindicatedthattheyserveeachmarketsectorcomparedtothenumberofESCOsthatreportquantifyingnon‐energybenefitsinthatsector.23 Avoided capital costs (1) are planned future capital expenditures made unnecessary by the efficiency upgrades. (2) Avoided
O&M costs (2) typically include decreased maintenance costs and staffing reductions related to installation of new energy
conservation measures. Implementing demand response (DR) measures (3) may not result in overall energy use reductions
but DR can reduce a facility’s monthly electric demand charges. Increased revenues (4) can accrue if the project includes
measures that increase the facility’s cash flow (e.g., replacing/upgrading broken parking meters; installing sub‐metering that
allows the agency to charge utilities to its tenants). In some states, efficiency measures can qualify for air pollution reduction
credits (5) monetized through a market‐based auction. Water conservation measures (6) can reduce water utility, sewage and
other costs.
U.S. Energy Service Company Industry: Recent Market Trends │28
Table 6. Number of ESCOs incorporating non‐energy benefits in performance‐based projects (2012‐2014)
Market Sector # of Respondent ESCOs that Serve the Market
Sector
# of ESCOs that Report quantifying NEBs in the Market Sector (% of
Respondents)
Federal government 17 13 (76%)
State/Local government 31 31 (100%)
K–12 schools 29 28 (97%)
Univ./College 21 21 (100%)
Healthcare 18 18 (100%)
Commercial/Industrial 12 11 (92%)
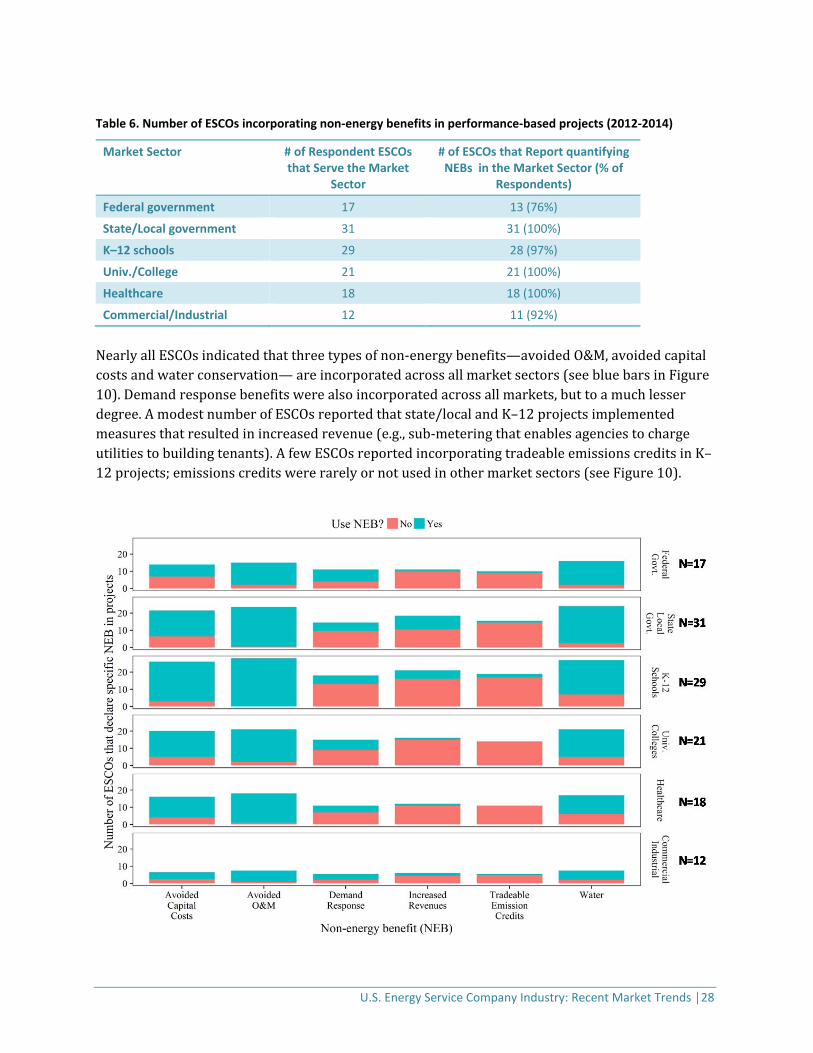
NearlyallESCOsindicatedthatthreetypesofnon‐energybenefits—avoidedO&M,avoidedcapitalcostsandwaterconservation—areincorporatedacrossallmarketsectors(seebluebarsinFigure10).Demandresponsebenefitswerealsoincorporatedacrossallmarkets,buttoamuchlesserdegree.AmodestnumberofESCOsreportedthatstate/localandK–12projectsimplementedmeasuresthatresultedinincreasedrevenue(e.g.,sub‐meteringthatenablesagenciestochargeutilitiestobuildingtenants).AfewESCOsreportedincorporatingtradeableemissionscreditsinK–12projects;emissionscreditswererarelyornotusedinothermarketsectors(seeFigure10).

U.S. Energy Service Company Industry: Recent Market Trends │29
Figure 10. Use of non‐energy benefits in performance‐based projects (2012‐2014)
Figure11andFigure12showthenumberofESCOsthatreportedlow(1%‐33%ofprojects),moderate(34‐66%ofprojects)andhigh(>66%ofprojects)incorporationofNEBsinprojectsimplementedfrom2012‐2014foreachmarketsegment.ESCOsreportedthatoperationsandmaintenance(O&M)savingswasthemostprevalentNEB,capturedinatleastsomeprojectsacrossallmarketsegments.AllESCOsthatservetheK‐12marketthatrespondedtothisquestion(27)reportedthatbetween15%and100%oftheirK–12projectsincorporatedO&Msavings.AvoidedcapitalcostswerenotuncommonintheMUSHmarkets,butwerenotincorporatedatallinthefederalorprivatecommercialsectors.TheFederalEnergyManagementProgram(FEMP)currentlypermitsthreetypesofNEBsinfederalESPCprojects:(1)savingsduetodecreasedwaterandsewerusage;(2)reducedO&Mexpenditures;and(3)savingsduetoreducedrepairandreplacementexpenditures(e.g.,lessfrequentreplacementoflighting)[FEMP2015].Veryfewprojectsacrosssectorsincorporatedtradeableemissionscredits;afewESCOsreportedemissionscreditsinstate/local,K–12andcommercialprojects.
Figure 11. Incorporation of non‐energy benefits in State/Local Government, K–12 schools, and University/College markets

U.S. Energy Service Company Industry: Recent Market Trends │30
Figure 12. Incorporation of non‐energy benefits in Federal government, Healthcare, and C/I markets
WealsoaskedESCOstoestimatethenumberofperformance‐basedprojectsthatwereimplementedprimarilyforfacilityimprovementpurposesversusthosebasedonpurelyfinancialreasons(energyandothercostsavings).Fiftypercentofthe28respondentESCOsreportedthatahighpercentageofK–12projectswereimplementedprimarilyforfacilityimprovementpurposes.SeveraloftheseESCOsreportedthat80%‐100%oftheirK–12projectswerecompletedtoaddressfacilityupgradeneeds.Inthestate/localgovernment,university/collegeandhealthcaresectors,aboutone‐thirdofESCOsreportedthatahighpercentageofthoseprojectswereimplementedforfacilityimprovementreasons(seeFigure13).

U.S. Energy Service Company Industry: Recent Market Trends │31
Figure 13. Use of ESPC strictly for facility improvement purposes
3.8. Financing tools and incentives
WeaskedESCOstoestimatethepercentageoftheirprojectsimplementedduring2012–2014thatusedlocal,state,orfederaltaxbenefits(e.g.,Section179d,24InvestmentTaxCredit(ITC),ortheProductionTaxCredit(PTC)).ThirtyESCOsrespondedtothisquestion.Acrossallmarketsectors,morethanhalfoftheESCOsservingeachmarketreporteduseoftaxbenefits.Morethan85%oftherespondentESCOsinthestate/local,K–12anduniversity/collegesectorsreportusingtaxbenefits(seeTable7).
24 179d allows a public agency to assign the tax credit deduction to the project implementer.

U.S. Energy Service Company Industry: Recent Market Trends │32
Table 7. Number of ESCOs reporting incorporation of tax benefits in projects implemented 2012‐2014
Market Sector # of Respondent ESCOs that Serve the Market Sector
# of ESCOs Reporting Use of Tax Benefits
Federal 15 11
State/Local 22 19
K–12 24 22
Univ./College 16 14
Healthcare 17 12
Commercial/Industrial 16 11
Public Housing/Other 8 5
Figure14showsthenumberofESCOsthatreportedzeropercent(0%),low(1%‐33%ofprojects),moderate(34‐66%ofprojects)andhigh(>66%ofprojects)useoftaxbenefitsinprojectsimplementedfrom2012–2014foreachmarketsegment.Ofthe24ESCOsthatrespondedforthestate/localmarket,nearlyhalf(11)reportedthatahighpercentageofstate/localprojectsusedtaxbenefits(seegreenbarinFigure14).FortheK–12market,half(12)oftheESCOsreportedthatahighpercentageofK–12projectsleveragedtaxbenefits.Inthefederalsector,fiveoffifteenESCOsreportedthatahighpercentageofprojectsusedtaxbenefits.
Figure 14. Utilization of local, state or federal tax benefits in projects developed by ESCOs during 2012‐2014

U.S. Energy Service Company Industry: Recent Market Trends │33
WeaskedESCOstoestimatethepercentageoftheirperformance‐basedprojectsthatclosedfinancingduringthe2012‐2014periodineachmarketsegmentthatusedthefollowingtypesoffundingapproaches:100%financed;abalanceofcashandfinancing;and100%cash.Forty‐oneESCOsprovidedinformationforthisquestion.Figure15showsthenumberofESCOsthatreportedzero(0%),low(1‐33%ofprojects),moderate(34‐66%ofprojects),andhigh(>66%ofprojects)usageofeachfundingapproachinvariousmarketsegments.100%cashfundingismostprevalentinthecommercial/industrialsectorwith44%ofESCOsservingthatsector(elevenoftwenty‐fivecompanies)reportinghighusageofcash.Projectsinthefederal,state/local,K–12,university/collegeandhealthcaresectorshadahighprevalenceoffinancing100%ofprojectcosts;morethan50%ofESCOsservingeachofthosemarketsindicatedhighusageof100%financing(seeFigure15).
Figure 15. Project funding sources for performance‐based projects by market segment
U.S. Energy Service Company Industry: Recent Market Trends │34
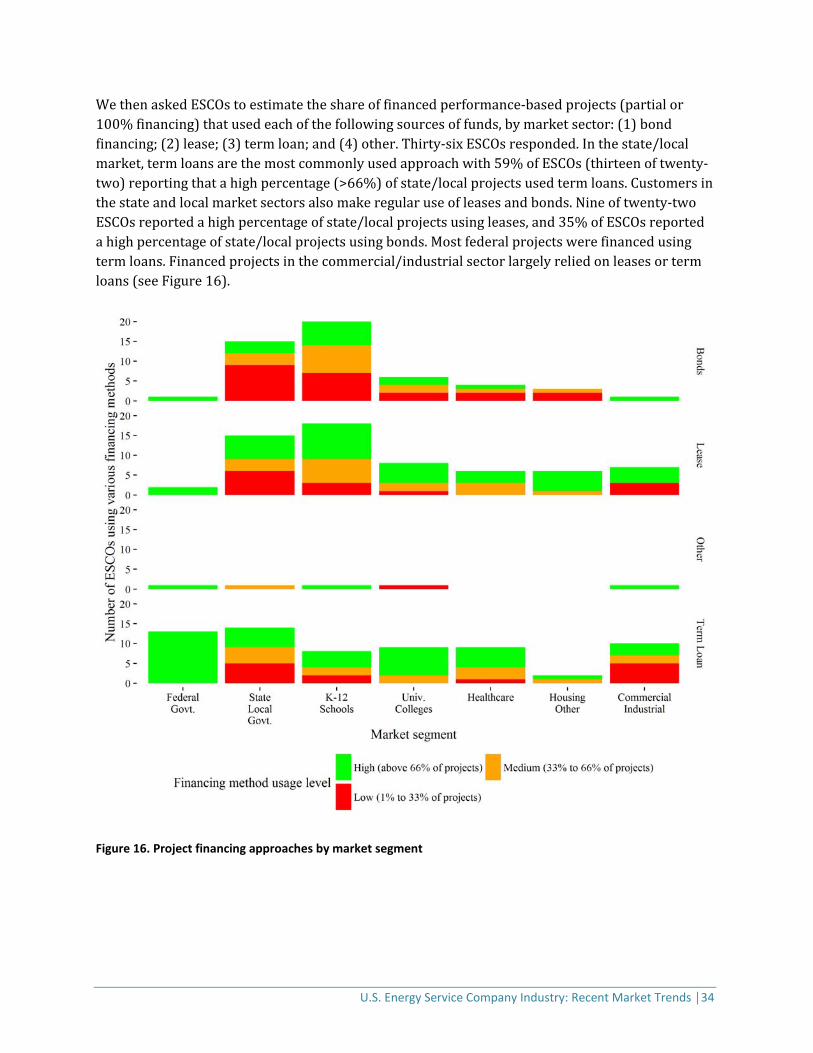
WethenaskedESCOstoestimatetheshareoffinancedperformance‐basedprojects(partialor100%financing)thatusedeachofthefollowingsourcesoffunds,bymarketsector:(1)bondfinancing;(2)lease;(3)termloan;and(4)other.Thirty‐sixESCOsresponded.Inthestate/localmarket,termloansarethemostcommonlyusedapproachwith59%ofESCOs(thirteenoftwenty‐two)reportingthatahighpercentage(>66%)ofstate/localprojectsusedtermloans.Customersinthestateandlocalmarketsectorsalsomakeregularuseofleasesandbonds.Nineoftwenty‐twoESCOsreportedahighpercentageofstate/localprojectsusingleases,and35%ofESCOsreportedahighpercentageofstate/localprojectsusingbonds.Mostfederalprojectswerefinancedusingtermloans.Financedprojectsinthecommercial/industrialsectorlargelyreliedonleasesortermloans(seeFigure16).
Figure 16. Project financing approaches by market segment

U.S. Energy Service Company Industry: Recent Market Trends │35
4. Discussion
4.1. ESCO industry revenue estimates
ESCOindustryrevenuesappearedtobeflatbetween2011and2014,andrevenuegrowthprojectedbyESCOsin2011didnotoccur.Giventhisresult,weundertookadditionalanalysistoreview2014revenuesreportedbyindividualESCOsandconductedadditionalinterviewswithESCOsandotherindustryexpertstoassessfactorsthatmayhavecontributedtothisphenomenon.Forexample,welearnedthatafewESCOsthataresubsidiariesoflargeverticallyintegratedfirmshadreorganizedbusinessunitssince2011.Importantly,theyindicatedthatsomerevenuecategoriesthatwereincludedintheirresponsesinour2011study25werenotincludedintheirreportingof2014revenues.Inaggregate,revenuesincludedinthe2011total,butnotinthe2014figureduetothereorganizationstotaledmorethan$300million.Hadthesereportingchangesnotoccurred,ESCOindustryrevenuesfor2014wouldhavebeensomewhathigherthan2011revenues(innominaldollars).TheESCOindustrygrewsteadilyfrom1990to2000,thengrowthnearlyflattenedbetween2000and2004,andresumedagainfrom2005to2011.Severalfactorscontributedtotheindustryslowdownfrom2000to2004,includingstalledutilityretailcompetitionunderelectricindustryrestructuring,whichledmanyutilitiestodivesttheirunregulatedESCObusinesses;falloutfromtheEnronbankruptcyraisingconcernsaboutenergyprojectaccountingmethods;and,asunsetofenablingfederalESPClegislationin2003(Hopperetal.2007).Similarlywefoundevidencethataconfluenceoffactorsmayhavecontributedtotheindustrygrowthslowdownbetween2011and2014.
4.2. Factors influencing recent ESCO industry market activity
Factor#1: IncreasedcompetitionfromcompaniesthatdonotmeetourdefinitionofanESCO
LBNLpresentedpreliminarystudyresultstotheNAESCOBoardofDirectors(composedofseniorofficersofallNAESCOmemberESCOs).BasedonfeedbackfromsomeESCOs,welearnedthattheindustryrevenueresultslikelyexcludedsomerevenuefromperformance‐basedprojectsimplementedbycompaniesthatdonotmeetLBNL’sdefinitionofanESCO,typicallymechanicalcontractors.WethenreachedouttoESCOexecutivesontheNAESCOBoardofdirectorsandaskedtwoquestions:
(1) Towhatextentarenon‐ESCOcompanieswinningcompetitivesolicitationsforperformancecontractingprojects?
(2) Whatarethenamesofthesenon‐ESCOcompaniesthattheyhavecompetedagainstandthathavewonprojects?
25 Revenue categories included in 2011 that were not included in 2014 results for these ESCOs included demand response,
facility management, and renewable energy installations.

U.S. Energy Service Company Industry: Recent Market Trends │36
SevenESCOsrespondedandeachcompanyindicatedthattheircompanieshadlostcompetitivebidsforperformancecontractstofirmsthattheywouldnotconsidertobeESCOs.Therespondentsestimatedthatnon‐ESCOcompaniesaretaking10‐15%ofthemarketandprovidedalistoftwenty‐eightmechanicalcontractingfirmsthathadwonprojects.SixofthosefirmsmettheLBNLdefinitionofanESCOandwereincludedinthe2014ESCOindustryrevenueresults.Wereviewedthewebsitesoftheothertwenty‐twocompaniesandfoundthatsixlistedperformancecontractingasaservice(oneofthesixoperatesinCanada).Theothersixteencompanies’websiteslistedmanyofthefunctionalcomponentsofaperformancecontractamongtheirserviceofferings,butdidnotexplicitlynameperformancecontractingasaservice.Wetheninterviewedseniormanagersfromtwooftheidentifiedmechanicalcontractingfirmstolearnmoreaboutthemechanicalcontractingcompaniesthatarewinningbidsforperformance‐basedprojects.BothofthesemanagershadmorethantenyearsofperformancecontractingexperienceasformeremployeesoflargeESCOsandtheyidentifiedrecentchangesinthemarketplace:
Somemechanicalcontractorshavebecomeconfidentthattheycanmanagetherisksinvolvedin12–18monthESPCprojectdevelopmentcycles,whichhavehistoricallybeensignificantbarrierstoentry.SomemechanicalcontractorsareincreasinglyinterestedinmanagingtheirowndevelopmentriskratherthanbeingsubcontractorsonprojectstoESCOs(andsubjecttodevelopmentrisksthattheybelievethattheycannotcontrol).
Somemechanicalcontractorsarenowwillingtoassumetheperformancerisksassociatedwithprojectmeasurementandverification(M&V)practicesthataretypicallyutilizedforcertainmeasures(e.g.,stipulatedsavingsorIPMVPOptionA).
Whilethisinformationisanecdotal,wethinkitsuggeststhattherehasbeenincreasedcompetitionforenergyefficiencyprocurementsininstitutionalmarketsinrecentyears.ThistrendmayalsoindicatethattheESCOindustryhasdemonstratedthatthemostcommonenergyefficiencyretrofitsinthepublic/institutionalmarket(lighting,HVACequipmentandcontrols)arenolongerperceivedastechnicallyriskybymanycontractorsandtheircustomers.Furthermore,anincreasingnumberofcustomersappeartoperceivelittleriskintheESCOfinancingmodelofrelyingonthecashflowfromprojectedenergysavingstorepaythecostoftheseretrofits.Thisgradualerosionofperceivedtechnicalriskofmanyhighefficiencytechnologiescanbeviewedasoneofthe“successstories”ofperformancecontracting,whichhasbeenenabledbyfederal/statepoliciesandlegislationandfacilitatedbyfederal(DOE,DOD)andstateenergyagencies.Arelatedfactormaybethedecliningcostofemergingtechnologies(e.g.,LEDs,PV)thatarebeingpromotedbyspecialtycontractors.26Factor#2: ESCOsmayhavealreadyachievedsubstantialmarketsaturationinkeymarkets
26 We see this as the continuation of a trend we observed in the PV market and declining ESCO revenue from PV installations
(Satchwell et al. 2010, Stuart et al. 2013).

U.S. Energy Service Company Industry: Recent Market Trends │37
Thetwolargestnon‐federalsourcesofESCOrevenuehaveconsistentlybeenthestate/localgovernmentandK–12schoolsmarkets.Thoughthereissignificantpotentialintheprivatecommercialandindustrialmarkets,ESCOshavenothadmuchsuccessinpenetratingthatmarket.Inourpreviousstudy,ESCOsestimatedESPCmarketsaturationof30%inthestate/localmarketand42%intheK–12schools(Stuartetal2013).Theseresultssuggestthatforthosetwosectors,ESCOsmayhavemovedbeyondtheearlyadopterphase.ItispossiblethatESCOshaveimplementedprojectsforasubstantialportionoftheirmostwillingandablecustomers—akinto“achievablepotential.”27Theremainingstate/localgovernmentandK–12schoolsmarketmaypresenthigherbarriersthantheaddressedmarket,forreasonsthatincludethefollowing:
Smallerprojects(<$500,000),whichwehypothesizemaymakeupalargeportionoftheremainingmarketandwhoseownersmaybesmallerlocalgovernmentsandschooldistrictsthathistoricallyhavenotbeenattractivetothelargerESCOsthatdominatetheindustry.
AportionoftheremainingmarketiscomprisedofsomepotentialprojectswithlargetechnicalpotentialintheK–12andstate/localgovernmentmarkets,asyetlargelyuntappedduetocomplexbureaucratichurdles(e.g.,NewYorkandPhiladelphiaK–12schools,Michiganprisons,andCaliforniastategovernmentfacilities).
SomeoftheremainingmarketmayconsistofprojectsfororganizationswithlessfinancialmanagementcapacitythanthosethathavecompletedESPCprojects.28
Factor#3: Someremainingcustomersinthepublic/institutionalmarketareuncertain
aboutthelong‐termcommitmentofanESPCproject
Uncertaintyaboutconvertingthevariableexpenseofenergybillsintothelong‐termfixedexpenseofanESPCfinancingrepaymenthasalwaysbeenasignificantbarriertoESPCforsomecustomers.Thecurrenteconomicandfiscalenvironmentforstate/local,K–12andpublicuniversities,withitsbudgetconstraints,uncertainfuturestaterevenues,andseeminglyunpredictablefutureenergypricesreinforces,ratherthanreduces,thisbarrier.WhiletheU.S.economyhasimprovedsignificantlysincethegreatrecession,therecoveryhasnotbeeneven.Taxrevenueshavereturnedtopre‐recessionlevelsinonlyabouthalfofthestates.Figure17showsthestarkdifferencebetweenonestatethathasachievedasubstantialfiscalrecovery(California)andtwostatesthathavenotrecovered(MichiganandOhio)(PewCharitableTrust2015).Theexperienceoftherecessionhasledsomestatestoenlarge“rainyday”funds(to
27 Stuart et al. (2013) defined the ESCO market investment potential as “the aggregate amount of project installation costs
technically possible with a single turnover of the remaining stock of buildings not already addressed by ESCOs.” The approach
to calculating the market potential did not directly align with any of the most common types of energy efficiency estimates
(e.g., technical, economic and achievable) due to limitations of the available data. It used a hybrid approach that may have
under‐estimated the amount of floor space technically addressable, but also potentially over‐estimated the amount of
economic or achievable market potential. 28 Such organizations include those with financial managers and organization attorneys that are not familiar with ESPC and
other types of sophisticated financing.

U.S. Energy Service Company Industry: Recent Market Trends │38
protectcorefunctionsintheeventofafuturerecession).
Figure 17. Change in tax revenue from example states (Pew Charitable Trust 2015)
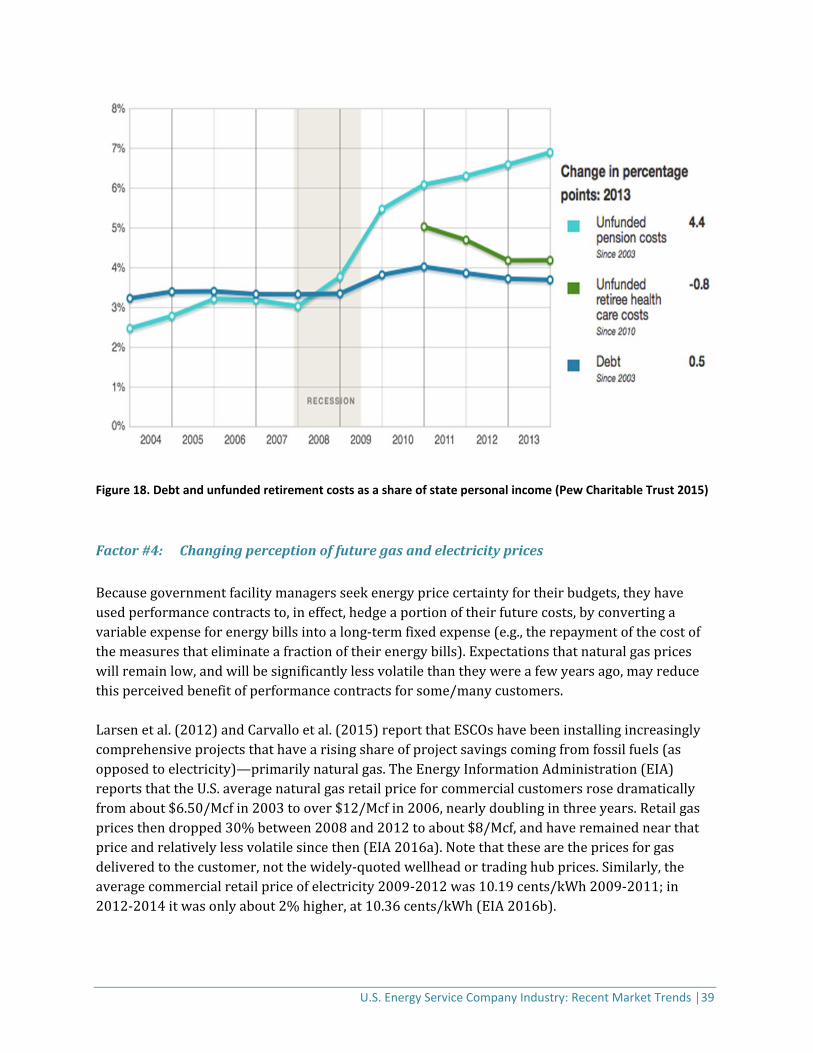
Furthermore,whilestateandlocalgovernmentdebthasstabilized,thegrowingburdenofretirementandretireehealthcareforpublicsectoremployees,whichareeffectivelyanotherformofdebt,makessomestateandlocalgovernmentincreasinglywaryoftakingonadditionallong‐termdebt,suchasanESPCproject(seeFigure18).
U.S. Energy Service Company Industry: Recent Market Trends │39
Figure 18. Debt and unfunded retirement costs as a share of state personal income (Pew Charitable Trust 2015)
Factor#4: Changingperceptionoffuturegasandelectricityprices
Becausegovernmentfacilitymanagersseekenergypricecertaintyfortheirbudgets,theyhaveusedperformancecontractsto,ineffect,hedgeaportionoftheirfuturecosts,byconvertingavariableexpenseforenergybillsintoalong‐termfixedexpense(e.g.,therepaymentofthecostofthemeasuresthateliminateafractionoftheirenergybills).Expectationsthatnaturalgaspriceswillremainlow,andwillbesignificantlylessvolatilethantheywereafewyearsago,mayreducethisperceivedbenefitofperformancecontractsforsome/manycustomers.Larsenetal.(2012)andCarvalloetal.(2015)reportthatESCOshavebeeninstallingincreasinglycomprehensiveprojectsthathavearisingshareofprojectsavingscomingfromfossilfuels(asopposedtoelectricity)—primarilynaturalgas.TheEnergyInformationAdministration(EIA)reportsthattheU.S.averagenaturalgasretailpriceforcommercialcustomersrosedramaticallyfromabout$6.50/Mcfin2003toover$12/Mcfin2006,nearlydoublinginthreeyears.Retailgaspricesthendropped30%between2008and2012toabout$8/Mcf,andhaveremainednearthatpriceandrelativelylessvolatilesincethen(EIA2016a).Notethatthesearethepricesforgasdeliveredtothecustomer,notthewidely‐quotedwellheadortradinghubprices.Similarly,theaveragecommercialretailpriceofelectricity2009‐2012was10.19cents/kWh2009‐2011;in2012‐2014itwasonlyabout2%higher,at10.36cents/kWh(EIA2016b).

U.S. Energy Service Company Industry: Recent Market Trends │40
Factor#5: ExperiencewithsomelegacyprojectshasledtothemorecautioususeofESPCtofinanceneededcapitalimprovements.
Larsenetal(2012)reportthatcustomersinthepublic/institutionalmarketareincreasinglyusingESPCprojectstohelpoffsetaccumulateddeferredmaintenanceneeds(e.g.,asbestosremoval,roofreplacement,wiring).Suchmeasuresarehighlyvaluedbypublicsectorcustomers,butmaygarnerlittleornoenergysavings.Ifthenon‐energybenefitscannotbemonetized,theremaybeanincreasinggapbetweenprojectedandactualcashsavingsduringtheperformancetermoftheproject.Severalyearsago,whentrendsindicatedthatenergypricescouldinexorablyincrease,performancecontractingcustomersmayhavebeenmorecomfortableagreeingtostipulatingsignificantenergycostescalations(e.g.,2‐3%annuallyoverthelifeofthecontract),becausetheseprojectedcostescalationstranslatedintomoresavingsandthusalargerproject.Escalatingthesavingsinthismannerhastheeffectofshowingincreaseddollarvalueofsavingsforprojects.Suchcostescalationsmaybeperceivedasabarrierforsomepotentialnewcustomers,giventhatsomeorganizationsarestrugglingtojustifytheescalationsinlegacycontractsandtopaythefinancingcostsintheabsenceoftheprojectedenergycostsavings.Minimizingescalationslimitsthedollarvalueoftheenergysavingsoverthelifeofnewprojectsandthusthetotalprojectcostthatcanberepaidfromsavings.Moreover,expectationsforcontinuedlownaturalgaspriceshavemadeitmoredifficulttoimplementthefullscopeofmanyprojectswithinpaybackormaximumcontracttermconstraints(Youngetal.2013).Long‐paybackmeasureswhichmaybethemajordriverfromprojects(e.g.,thenewhighschoolroof)arecutfromthescope,makingtheprojectssmallerandreducingthemotivationofthecustomertoimplementaperformance‐basedcontract.29Factor#6: ARRA“boomandbust”
TheAmericanReinvestmentandRecoveryAct(ARRA)generatedanunprecedentedshort‐termburstoffundingforenergyefficiencyinvestmentinthepublic/institutionalsector.Federal,stateandlocalgovernmentsweredirectedtodeploythefundsquicklyandfoundopportunitiestogeneratelongtermenergybillsavingsbytargetingabacklogof“shovel‐ready”projectsingovernmentfacilities(Goldmanetal.2011).SomeESCOrespondentsindicatedthatbecauseoftimepressures,ARRAfundswereoftenusedtopayforshort‐paybackbuildingretrofitprojectsinpublic/institutionalmarkets,ratherthanusingESPC.ARRAalsoprovidedfundingforstateandlocalgovernmentstohireenergyplanningandenergyefficiencyimplementationstaffandconsultantsforalimitedtime.WhentheARRAfundingended,manystatesnolongerhadfundstoretainthisstafforconsultantswhowerehelpingtomanageandoverseeprocurementprojects(NASEO2015).30
29 One reaction to this experience with some legacy projects has been in North Carolina, where in 2012 the state redefined
energy savings to severely restrict energy cost escalations (see State of North Carolina Performance Contracting Law, § 143
64.17.(2)). 30 Results of the NASEO 2014 member survey indicated that the median full‐time equivalent (FTE) staff at state energy offices
declined from 15 in 2012 to 12 in 2014.

U.S. Energy Service Company Industry: Recent Market Trends │41
4.3. Prospects for near‐term growth
ThereareanumberofindicationsthattheESCOindustrymayseesomegrowthinrevenuesoverthenextfewyears.Anumberofenablingpoliciescouldhaveasignificantimpactonfutureindustrygrowthinthecomingyears,including:
PresidentObamaaddedanadditional$2billiontotheexisting$2billiontargetforfederalESPCinvestment,bringingthetotalgoalforfederalinvestmentinESPCprojectsto$4billiontobeachievedbytheendof2016(WhiteHouse2014).AsofMay2016,awardedfederalprojectstotal$3billion;agencycommitmentstoawardbytheendof2016mayaddanother~$1billion.(Rockwell2016).
SeveralstatesarerampingupESPCactivity.Forexample,stafffromtheCaliforniaDepartmentofGeneralServiceshaveindicatedthatthe2016proposedlegislationtostreamlinethestate’sESPCcontractingprocessisexpectedtopass,whichmayhelpaddressalargebacklogofprojectsthatmayimplementedwithinthenextseveralyears.
ItisalsoimportanttohighlightexamplesofrecentrevenuetrendsforlargeESCOs:
Ameresco,theonlypublicly‐tradedU.S.ESCOthatisnotasubsidiaryandwhosebusinessconsistssolelyofESCOservices,isexperiencingarevenuereboundafterseveralyearsofdecline.Thecompany’sreportedrevenueswere$428Min2009andpeakedat$728Min2011,followedbya13%declinein2012($631M)andafurther9%declinein2013($574M).However,in2014,revenuesrose3%(to$593M)andanother8%in2015(to$641M).Thecompany’s2015SEC10‐Kfilingsindicatethatthebacklogofcontractedandawardedprojects(expectedfuturerevenues)hasincreasedsteadilysince2013(Ameresco2010,2011,2012,2013,2014,2015;TheStreet2011).
JohnsonControls,Inc.isalsoseeingrevenuesriseforitsBuildingEfficiencyNorthAmericanSystemsandServicesegment31afterseveralyearsofdeclines.Thesegmentreportedrevenueof$4.6Bin2011(up9%from2010),followedbyannualdeclinesof2%,1%and3%in2012,2013and2014,respectively.In2015,segmentrevenueincreasedby2%over2014(JohnsonControls2010,2011,2012,2013,2014,2015).
31 ESCO business revenues for Johnson Controls, Inc. (JCI) account for only a portion of the total revenue for the Building
Efficiency North American Systems and Service segment. JCI does not report its ESCO revenue separately from other energy
services in its SEC 10‐K filings.
U.S. Energy Service Company Industry: Recent Market Trends │42
5. Conclusion
ThisstudybuildsonpreviousLBNLreportsonESCOindustrymarkettrendsandprovidesupdatedestimatesofESCOindustryrevenue,includingrevenuebymarketsector,businesstype,U.S.Censusregion,andnewandexistingcustomers,aswellasrecentandshort‐termprojectedgrowth.Wealsoreportontheuseofnon‐energybenefits,taxbenefits,andfinancingapproachesforperformance‐basedprojects.TheU.S.ESCOindustryexperiencedyear‐over‐yeargrowthfrom1990through2011with$5.3billioninrevenuesin2011.However,in2014,industryrevenueremainedflatat~$5.3billion.Basedonourinterviews,ESCOindustryexecutivesanticipaterevenuesof~$7.6billionin2017,whichrepresentsanaverageannualgrowthrateof$13%duringtheyears2015‐2017.ThepublicandinstitutionalmarketsegmentshavecontinuedtoaccountforthebulkofESCOindustryrevenue;in2014,thesemarketsaccountedforabout85%ofindustryrevenues.Performancecontractingcontinuestobethedominantbusinessactivity,bringingin~74%($3.7B)of2014revenue.WeobservedthattheshareofmarketrevenuegoingtothetopeightESCOshasdeclinedsince2006.In2014,inafewU.S.Censusregions,smallandmediumESCOscapturednearlyasmuchofthemarketaslargeESCOs.Newcustomersgeneratedapproximately60%ofESCOrevenuesfromK–12schoolsand85%ofpublichousingrevenueduring2012‐2014.Inthefederalsector,andeachoftheremainingMUSHmarkets,newcustomersgenerated50%ormoreofESPCrevenueforthethree‐yearperiod.ESCOsincorporateseveraldifferenttypesofnon‐energybenefits(NEBs)intoperformance‐basedprojects.ThemostcommonlyincorporatedNEBsareO&Msavings—whichareincorporatedinprojectsacrossallmarketsegments.ESCOsreportedthatasignificantnumberofprojects,especiallyintheK–12schoolsmarket,weredevelopedprimarilytoimproveorrepairfacilitiesratherthantoachieveenergysavings.TheESCOrevenuenumbersfor2011and2014werenoteasilycomparable,becauseafewESCOsthatweresubsidiariesoflargercompanieshadundergonereorganization;somecategoriesofrevenuethatwerereportedin2011werenotreportedin2014.Otherfactorsthatmayhavecontributedtoflatrevenuesbetween2011and2014include:
(1) IncreasedcompetitionfromcompaniesthatdonotmeetourdefinitionofanESCO(e.g.,mechanicalcontractors),whichsuggeststhatcustomersandcontractorsarelessintimidatedbyenergyefficiencytechnologiesandthenotionoffinancingprojectswithlong‐termborrowingthatisrepaidfromsavingshasspreadbeyondESCOs;
(2) Increaseddifficultyofdevelopingprojects,becauseinsomemarkets,ESCOsmayhaveattainedasubstantialportionoftheachievablepotential,andmuchoftheremaining

U.S. Energy Service Company Industry: Recent Market Trends │43
marketmayconsistofprojectsfororganizationswithlessfinancialmanagementexpertiseorcapacitythanorganizationsthathaveimplementedESPCs,andlargeprojectsforstateandlocalgovernmentsthathavehistoricallyresistedperformancecontracting,orsmallerprojectsnotattractivetothemostoftheESCOsinoursurvey;
(3) Uncertaintyamongmanypotentialremainingcustomersaboutcommittingtoalong‐termperformancecontract;
(4) MorecautioususeofESPCtofinanceneededcapitalimprovementsbysomecustomers;and
(5) Reductionofperformancecontracting’sperceivedbenefitofhedgingenergypriceincreasesandvolatility,becauseofcustomerexpectationsthatnaturalgas(andelectricity)priceswillcontinuetoberelativelylowandlessvolatilethaninthepast.
Despitethesechallenges,recentactivityatlargerESCOsandsupportorexpansionofenablingpolicies(ESPC,PACE)providessomeindicationthatindustryrevenuesarepoisedtoincreaseinthecomingyears.

U.S. Energy Service Company Industry: Recent Market Trends │44
References
AECOM.2012,2013,2014,2015.SEC10‐KfilingstotheU.S.SecuritiesandExchangeCommission.Accessedat:https://www.sec.gov/edgar/searchedgar/companysearch.html
Ameresco.2010,2011,2012,2013,2014,2015.SEC10‐KfilingstotheU.S.SecuritiesandExchangeCommission.Accessedat:https://www.sec.gov/edgar/searchedgar/companysearch.html.
Ameresco2015b.SaginawPlazaPartnerswithAmerescoforESPCtoEnhanceEnergyEfficiencyandUpgradeFacilitywithRenewablePower.PressreleaseAugust19,2015.Accessedat:http://www.ameresco.com/sites/default/files/pace‐_saginaw_plaza_‐_ameresco_final_8_19_2015.pdf.
Carvallo,J.P.,P.H.Larsen,C.A.Goldman.2015.EstimatingcustomerelectricityandenergysavingsfromprojectsinstalledbytheU.S.ESCOindustry.EnergyEfficiency8(6).doi.10.1007/s12053‐015‐9405‐8.
Daniels,S.2016.ThesecontractorsareoutofworkbecauseofSpringfieldstandoff.Crain’sChicagoBusiness.March26.Accessedat:https://www.chicagobusiness.com/article/20160326/ISSUE01/303269992/illinois‐energy‐efficiency‐program‐loses‐funding‐resulting‐in‐layoffs.
DOE(U.S.DepartmentofEnergy).2012a.MakingitEasiertoCompleteCleanEnergyProjectswithQualifiedEnergyconservationBonds(QECBs).PresentationoftheDOETechnicalAssistanceProgram.July19.Accessedat:https://emp.lbl.gov/sites/all/files/making‐it‐easier‐to‐complete‐clean‐energy‐projects‐with‐qecbs‐webinar.pdf.
DOE.2012b.DepartmentofEnergy,IndefiniteDeliveryIndefiniteQuantity,MultipleAward,EnergySavingsPerformanceContract.Accessedat:http://www.energy.gov/sites/prod/files/2013/10/f3/generic_idiq_espc_contract.pdf.
EIA.2016a.NaturalGasPrices.Accessedat:https://www.eia.gov/dnav/ng/ng_pri_sum_dcu_nus_a.htm
EIA.2016b.ElectricityDataBrowser.Accessedat:http://www.eia.gov/electricity/data/browser/#/topic/7?agg=0,1&geo=g&endsec=vg&linechart=~ELEC.PRICE.US‐COM.A~~ELEC.PRICE.US‐IND.A&columnchart=ELEC.PRICE.US‐ALL.A~ELEC.PRICE.US‐RES.A~ELEC.PRICE.US‐COM.A~ELEC.PRICE.US‐IND.A&map=ELEC.PRICE.US‐ALL.A&freq=A&ctype=linechart<ype=pin&rtype=s&pin=&rse=0&maptype=0
EPC(EnergyProgramsConsortium).2016.Table1A:QualifiedEnergyConservationBondsKnownIssuedbyState(asofFebruary29,2016).Accessedat:http://www.energyprograms.org/2016/02/qecb‐papers/

U.S. Energy Service Company Industry: Recent Market Trends │45
FEMP(FederalEnergyManagementProgram).2015.M&VGuidelines:MeasurementandVerificationforPerformance‐BasedContractsVersion4.0.November.Accessedat:http://energy.gov/sites/prod/files/2016/01/f28/mv_guide_4_0.pdf
Goldman,C.A.,E.Stuart,I.Hoffman,M.C.Fuller,M.A.Billingsley.2011.InteractionsbetweenEnergyEfficiencyProgramsfundedundertheRecoveryActandUtilityCustomer‐fundedEnergyEfficiencyPrograms.LawrenceBerkeleyNationalLaboratory4322E.March.
Hopper,N.,C.Goldman,D.Gilligan,T.Singer,D.Birr.2007.“ASurveyoftheU.S.ESCOIndustry:MarketGrowthandDevelopmentfrom2000to2006.LawrenceBerkeleyNationalLaboratory62679.May.
JohnsonControls.2010,2011,2012,2013,2014,2015.SEC10‐KfilingstotheU.S.SecuritiesandExchangeCommission.Accessedat:https://www.sec.gov/edgar/searchedgar/companysearch.html.
JohnsonControls.2013b.“JohnsonControlsandYgreneEnergyFundsignnation’slargestPACEEnergyUpgradeProject[Pressrelease].”Accessedat:http://www.johnsoncontrols.com/media‐center/news/press‐releases/2013/08/01/johnson‐controls‐and‐ygrene‐energy‐fund‐sign‐nations‐largest‐pace‐energy‐upgrade‐project‐with‐metzler‐real‐estate.
Larsen,P.,C.A.Goldman,A.Satchwell.2012.“EvolutionoftheU.S.EnergyServiceCompanyIndustry:MarketSizeandProjectPerformancefrom1990‐2008.”EnergyPolicy,50,802‐820.
Larsen,P.,C.A.Goldman,D.Gilligan,T.E.Singer.2012b.“IncorporatingNon‐EnergyBenefitsintoEnergySavingsPerformanceContracts.”ProceedingsoftheACEEE2012SummerStudyonEnergyEfficiencyinBuildings.August.Accessedat:
Larsen,P.,E.Stuart,C.A.Goldman,D.Gilligan.2014.CurrentPoliciesandPracticesRelatedtotheIncorporationofNon‐energyBenefitsinEnergySavingPerformanceContractProjects.ProceedingsoftheACEEE2014SummerStudyonEnergyEfficiencyinBuildings.August.Accessedat:http://aceee.org/files/proceedings/2014/data/papers/8‐320.pdf
Linstone,H.A.,andM.Turoff(Eds.),1975.TheDelphimethod:TechniquesandApplications.London:Addison‐Wesley.
NASEO(NationalAssociationofStateEnergyOffices).2015.NASEO2014membersurvey.
NCSL(NationalConferenceofStateLegislatures).2013.StateEnergyPerformanceContractingwebpage.November.Accessedat:http://www.ncsl.org/research/energy/state‐energy‐savings‐performance‐contracting.aspx.
NORESCO.2016.PerformanceContracting[webpage].Accessedat:http://www.noresco.com/energy‐services/en/us/solutions/Energy‐Efficiency‐Retrofits‐

U.S. Energy Service Company Industry: Recent Market Trends │46
Modernization/Performance‐Contracting/.
OMB(OfficeofManagementandBudget).September28,2012.MemorandumforHeadsofExecutiveDepartmentsandAgencies:AddendumtoOMBMemorandumM‐98‐13onFederalUseofEnergySavingsPerformanceContracts(ESPCs)andUtilityEnergyServiceContracts(UESCs)[PublicationM‐12‐21].Washington,D.C.ExecutiveOfficeofthePresident.Accessedat:https://www.whitehouse.gov/sites/default/files/omb/memoranda/2012/m‐12‐21.pdf
ORNL(OakRidgeNationalLaboratory).2016.PerformanceContractingByState.OakRidgeNationalLaboratory.Accessedat:http://web.ornl.gov/info/esco/legislation/newesco.shtml.
PaceNation.2016.“Q12016C‐PACEMarketUpdate.”Accessedat:http://www.pacenation.us/wp‐content/uploads/2016/06/Market‐update‐Q1‐2016.pdf.
PewCharitableTrust.2015.Fiscal50:StateTrendsandAnalysis.Accessedat:http://www.pewtrusts.org/en/multimedia/data‐visualizations/2014/fiscal‐50#ind4
Randazzo,R.2015.Arizonashuttersenergyprogram;remainingworkersfired.ArizonaRepublic.November2.Accessedat:http://www.azcentral.com/story/money/business/energy/2015/11/03/arizona‐shutters‐energy‐program‐remaining‐workers‐fired/75063004/
Rockwell,K.2016.President’sPerformanceContractingChallenge:PerformanceTowardNew$4BillionGoal.U.S.DepartmentofEnergyFederalEnergyManagementProgram.Washington,D.C.May15.Accessedat:http://energy.gov/eere/femp/downloads/presidential‐performance‐contracting‐challenge‐performance‐toward‐new‐4‐billion
Sacks,H.2016,March1.PersonalcommunicationwithHowardSacks,StateofCaliforniaDepartmentofGeneralServices.
Satchwell,A.,C.Goldman,P.Larsen,D.Gilligan,andT.Singer.2010.“ASurveyoftheU.S.EnergyServicesCompany(ESCO)Industry:MarketGrowthandDevelopmentfrom2008to2011.”LawrenceBerkeleyNationalLaboratory3479‐E.June.
StuartE.,Larsen,P.,Goldman,C.A.&Gilligan,D.2013.CurrentSizeandRemainingMarketPotentialoftheU.S.EnergyServiceCompanyIndustry.LawrenceBerkeleyNationalLaboratory6300E.August.
Stuart,E.,Larsen,P.,Goldman,C.A.,&Gilligan,D.2014.AmethodtoestimatethesizeandremainingmarketpotentialoftheU.S.ESCO(energyservicecompany)industry.Energy,77(December),362‐371.doi:10.1016/j.energy.2014.009.003.
TheStreet.2011.Amerescoreportsfourthquarterandfullyear2010financialresults.February17.Accessedat:https://www.thestreet.com/story/11013767/1/ameresco‐reports‐fourth‐

U.S. Energy Service Company Industry: Recent Market Trends │47
quarter‐and‐full‐year‐2010‐financial‐results.html.
TheWhiteHouse,OfficeofthePressSecretary.2011.PresidentialMemorandum–ImplementationofEnergySavingsProjectsandPerformance‐BasedContractingforEnergySavings.December2.Accessedathttp://www.whitehouse.gov/the‐press‐office/2011/12/02/presidential‐memorandum‐implementation‐energy‐savings‐projects‐and‐perfo.
TheWhiteHouse,OfficeofthePressSecretary.2014.PresidentObamaAnnouncesCommitmentsandExecutiveActionstoAdvanceSolarDeploymentandEnergyEfficiency[factsheet].Accessedat:https://www.whitehouse.gov/the‐press‐office/2014/05/09/fact‐sheet‐president‐obama‐announces‐commitments‐and‐executive‐actions‐a.
Vine,E.Nakagami,H.,&Murakoshi,C.1999.TheevolutionoftheU.S.energyservicecompany(ESCO)industry:fromESCOtosuperESCO.Energy24,no.6(June),479‐492.Doi:10.1016/S0360‐5442(99)00009‐2.

U.S. Energy Service Company Industry: Recent Market Trends │48
Data Tables Appendix A.
Table A ‐ 1. ESCO industry revenue (nominal $) by market segment for 2008, 2011 and 2014
Market 2008 (n=29)
($ million)
2011 (n=35)
($ million)
2014 (n=43)
($ million)
Federal Govt. $ 583 $1,102 $1,073
State/Local Govt. $ 872 $1,233 $1,314
K–12 Schools $ 847 $ 995 $1,219
Univ./College $ 614 $ 702 $ 504
Healthcare $ 238 $ 302 $ 304
Housing/Other $ 356 $ 385 $ 342
Commercial/Industrial $ 277 $ 419 $ 409
TOTAL $3,786 $5,138 $5,165
Table A ‐ 2. ESCO industry revenue share by market segment for 2008, 2011 and 2014
Market 2008 (n=29) 2011 (n=35) 2014 (n=43)
Federal Govt. 15.4% 21.4% 20.7%
State/Local Govt. 23.0% 24.0% 25.4%
K–12 Schools 22.4% 19.4% 23.5%
Univ./College 16.2% 13.7% 10.0%
Healthcare 6.3% 5.9% 5.9%
Housing/Other 9.4% 7.5% 6.6%
Commercial/Industrial 7.3% 8.1% 7.9%
TOTAL 100.0% 100.0% 100.0%