erosion control technical guide - caltrans - california ... · pdf filethe big picture...
TRANSCRIPT

Key Concepts Of Sustainable Erosion Control Technical Guide
______________________________ November 2010

Table of Contents
OnlineTechGuide.doc i November 2010
Table of Contents
1.0 The Big Picture ................................................................ 1 1.1 Sustainable Erosion Control .................................................................. 1
1.1.1 Soil ............................................................................................. 1 1.1.2 Vegetation .................................................................................... 1 1.1.3 Water .......................................................................................... 2
1.2 How Soil, Vegetation and Water Relate to Sustainable Erosion Control ........ 2
2.0 The Decision-Making Process .......................................... 3 2.1 Step 1: Coordinate with Appropriate Functional Units ............................... 3
2.1.1 Functional Unit Considerations ......................................................... 4 2.1.2 Interdisciplinary Team Considerations ............................................... 4
2.2 Step 2: Identify Sustainable Erosion Control Objectives ............................ 4 2.3 Step 3: Collect Site-Specific Data .......................................................... 6
2.3.1 Step 3a: Desktop Study .................................................................. 6 2.3.2 Step 3b: Site Reconnaissance and Data Collection ............................. 14
2.4 Step 4: Assess Erosion Potential ........................................................... 17 2.4.1 Erosion Prediction ......................................................................... 17 2.4.2 Revised Universal Soil Loss Equation (RUSLE) ................................... 18 Revised Universal Soil Loss Equation, Version 2 (RUSLE2) ............................. 23
2.5 Step 5: Evaluate and Select Best Management Practices .......................... 24 2.5.1 Caltrans-Approved Best Management Practices (BMPs) ...................... 24 2.5.2 Earthwork (Soil Preparation) .......................................................... 24 2.5.3 Erosion Control............................................................................. 25 2.5.4 Runoff Control .............................................................................. 26 2.5.5 Why BMPs Fail .............................................................................. 27 2.5.6 How to Prevent Failure .................................................................. 27
2.6 Step 6: Evaluate and Select Sustainable Vegetation ................................ 27 2.6.1 What Should Be Grown? ................................................................ 28 2.6.2 What Can Be Grown? .................................................................... 30 2.6.3 What are the Project Requirements and Expectations? ....................... 31 2.6.4 What Is Available? ........................................................................ 32 2.6.5 How Is It Accomplished? ................................................................ 33
3.0 Other Resources ............................................................ 36 3.1 Non-Department Certifications ............................................................. 36 3.2 Publications ....................................................................................... 36 3.3 Websites ........................................................................................... 36
4.0 Reference Material ........................................................ 37

Table of Contents
OnlineTechGuide.doc ii November 2010
Tables
Table 1. Site Succession Timeline. .................................................................... 5 Table 2. Erosion Types. .................................................................................. 14 Table 3. Project Site Reconnaissance and Data Collection Tasks. .......................... 16 Table 4. Reference Site Reconnaissance Criteria and Data Collection Tasks. ........... 17 Table 5. Soil Preparation Order of Execution. .................................................... 24 Table 6. Project Preparation BMP. .................................................................... 25 Table 7. Erosion Control BMPs for Organics. ...................................................... 25 Table 8. Erosion Control BMPs-Hydraulically Applied. .......................................... 26 Table 9. Erosion Control BMPs-Rolled Erosion Control Products (RECP). ................. 26 Table 10. Erosion Control BMPs-Other Stormwater SSPs. .................................... 26 Table 11. Erosion Control BMPs-Planting. .......................................................... 26 Table 12. Runoff Control BMPs. ....................................................................... 26 Table 13. Early and Late Ecosystem Succession. ................................................ 28 Table 14. Vegetation Options and SSPs. ........................................................... 32 Table 15. Example Seed Mix. .......................................................................... 32 Table 16. Summary: How to Evaluate and Select Sustainable Vegetation. ............. 34
Figures
Figure 1. Sustainability Triangle. ...................................................................... 1 Figure 2. Six-Step Decision-Making Process. ...................................................... 3 Figure 3. California Topographic Map. ............................................................... 8 Figure 4. California Soils Map. .......................................................................... 9 Figure 5. Physiographic Provinces of California. ................................................. 10 Figure 6. California Annual Rainfall Erosivity. ..................................................... 11 Figure 7. Western Regional Climate Center Website, View 1. ............................... 12 Figure 8. Western Regional Climate Center Website, View 2. ............................... 12 Figure 9. Western Regional Climate Center Website, View 3. ............................... 13 Figure 10. Western Regional Climate Center Website, View 4. ............................. 13 Figure 11. Erodibility Scale. ............................................................................ 19 Figure 12. Slope Length and Steepness. ........................................................... 20 Figure 13. Cover Management Factors. ............................................................ 21 Figure 14. Practice Factor P. ........................................................................... 22 Figure 15. Example of RUSLE2 Software. .......................................................... 23 Figure 16. California Vegetation Habitat Region. ................................................ 29 Figure 17. transPLANT Welcome Screen. .......................................................... 31
Appendices
Appendix A. Soils References Appendix B. Sample Problems

The Big Picture
OnlineTechGuide.doc 1 November 2010
1.0 The Big Picture
1.1 Sustainable Erosion Control
This technical guide offers tools to aid the decision-making process in designing sustainable erosion controls on project sites. Soil, water and vegetation must all be considered to achieve successful, self-sufficient erosion control at a project site. Figure 1 shows the three sides of the sustainability triangle.
Soil
WaterVegetation
Soil
WaterVegetation
Figure 1. Sustainability Triangle.
The goals of sustainable erosion control are to meet or exceed stormwater quality requirements and minimize life cycle costs by:
Creating long-term soil health
Establishing the most appropriate vegetation
Achieving permanent soil stabilization.
Sustainable erosion control objectives for each component of the sustainability triangle are listed below. These objectives help achieve the goals listed above:
1.1.1 Soil
Optimal infiltration
Adequate organic matter
Sufficient water holding capacity
Favorable soil biology and healthy microbes
1.1.2 Vegetation
Healthy plant communities
Diverse species composition
Optimal rooting depth
The Big Picture
OnlineTechGuide.doc 2 November 2010
1.1.3 Water
Surface erosion reduction
Runoff reduction
Water quality
1.2 How Soil, Vegetation and Water Relate to Sustainable
Erosion Control
Each component of the sustainability triangle (soil, water, and vegetation) contributes to balancing the roadside eco-system, and is equally important for achieving permanent soil stabilization.
Soil provides a medium for vegetation to become established and water to infiltrate. Healthy soil can greatly reduce invasive plants and the amount of water a project site requires for vegetation to thrive. It can also increase the quality of water leaving the site by supporting a sustainable vegetative community. Refer to Appendix A (Soil References) to determine which fundamentals of soil apply most directly to your work.
A sustainable vegetative community can slow water movement over the soil and, along with the established root structure increases infiltration and soil structure while minimizing soil loss. Using appropriate vegetation will help to establish a sustainable plant community and minimize life cycle costs. Refer to Step 6 for more information about evaluating and selecting sustainable vegetation for erosion control. Both soil and vegetation are important factors for meeting or exceeding stormwater quality requirements. Together, they can reduce runoff, reduce soil loss, and increase water quality.
The Decision-Making Process
OnlineTechGuide.doc 3 November 2010
2.0 The Decision-Making Process
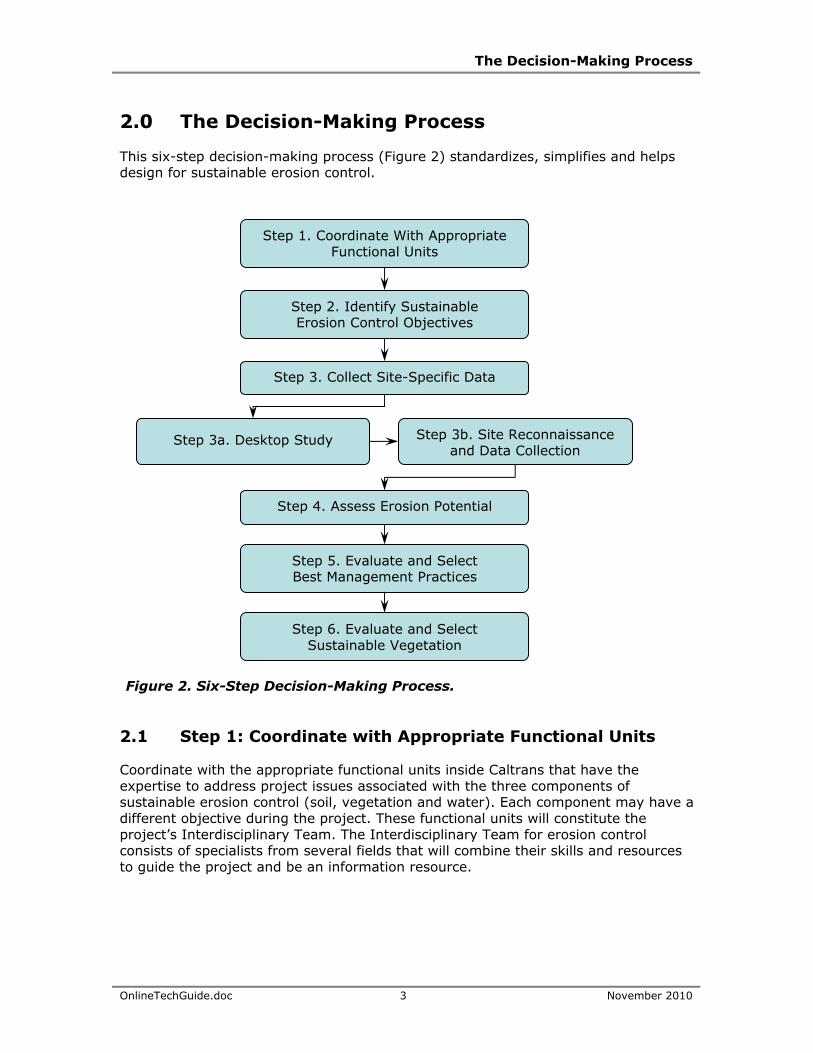
This six-step decision-making process (Figure 2) standardizes, simplifies and helps design for sustainable erosion control.
Figure 2. Six-Step Decision-Making Process.
2.1 Step 1: Coordinate with Appropriate Functional Units
Coordinate with the appropriate functional units inside Caltrans that have the expertise to address project issues associated with the three components of sustainable erosion control (soil, vegetation and water). Each component may have a different objective during the project. These functional units will constitute the project’s Interdisciplinary Team. The Interdisciplinary Team for erosion control consists of specialists from several fields that will combine their skills and resources to guide the project and be an information resource.
Step 2. Identify Sustainable Erosion Control Objectives
Step 1. Coordinate With Appropriate Functional Units
Step 3. Collect Site-Specific Data
Step 4. Assess Erosion Potential
Step 5. Evaluate and Select Best Management Practices
Step 3b. Site Reconnaissance and Data Collection
Step 3a. Desktop Study
Step 6. Evaluate and Select Sustainable Vegetation

The Decision-Making Process
OnlineTechGuide.doc 4 November 2010
2.1.1 Functional Unit Considerations
It is recommended that the functional unit specialist (e.g., Landscape Architect Biologist, Geotechnical Engineer, etc.), consider the points described below prior to joining and participating on the Interdisciplinary Team.
Early involvement is crucial. The Project Initiation Document (PID) Process is an opportunity for each discipline to identify project concerns and design accordingly.
Review the scope of work and communicate with the Project Engineer to ensure the essential functional units are represented on the team
2.1.2 Interdisciplinary Team Considerations
Accommodate health and safety needs.
Consult Project Development Procedures Manual (PDPM). Develop scope, cost estimate and schedule.
Develop and consider design alternatives.
Evaluate and/or develop permitting and agreements.
Evaluate and document environmental issues.
Consider construction and maintenance operations.
At a minimum, the Interdisciplinary Team should include the following key disciplines:
Project Engineer Landscape Architect Geotechnical Engineer Hydraulic Engineer Biologist/Botanist
2.2 Step 2: Identify Sustainable Erosion Control Objectives
The objectives outlined below add a time element to the sustainable erosion control objectives described on Pages 1 and 2. These objectives are organized into a succession. A succession is a predictable and orderly set of changes in the composition or structure of an ecological community over time. The list below also shows the stages of a standard erosion control project.
When planning a project, first determine the final stage of succession that is appropriate for the project (e.g., grassland, mixed shrubs, woodland). Then, design the project so objectives are met at each stage of succession up to the final stage for the project. Refer to the objectives often to determine whether the project is on the correct path and review the goals from several perspectives to ensure all project stakeholders’ needs and goals are considered. When establishing objectives, remember the sustainability triangle and the big-picture sustainable erosion control goals.

The Decision-Making Process
OnlineTechGuide.doc 5 November 2010
Table 1 illustrates sustainable erosion control objectives related to soil, water and vegetation anticipated to occur at each stage of succession from the first storm at a project site through the 10th year of the project.
Table 1. Site Succession Timeline.
Stage Sustainability Component
Sustainability Objectives
1st Storm
Soil Optimal infiltration
Vegetation Diverse species composition Emergence of early succession species
Water Surface erosion reduction Reduce rain drop impact
Surface runoff reduction (volume and velocity)
1st Year
Soil Optimal infiltration
Adequate organic matter
Vegetation Diverse species composition Established surface cover
Optimal rooting depth Increases soil strength
Water Surface erosion reduction Reduce rain drop impact
3rd Year
Soil Optimal infiltration Increased rates to pre-project levels
Adequate organic matter Established duff layer
Sufficient water holding capacity
Favorable soil biology and healthy microbes Improved soil aggregation Long term nutrient supply
Vegetation Healthy plant communities Vigorous and dense stand of native grasses and forbs
Diverse species composition Emergence of native shrubs and trees
Optimal rooting depth Increased root strength including some tap roots
Water Increased water quality
10th Year and Beyond (Perpetuity)
Soil Optimal infiltration Increased rates to pre-project levels
Adequate organic matter Well developed duff layer
Sufficient water holding capacity
The Decision-Making Process
OnlineTechGuide.doc 6 November 2010
Table 1. Site Succession Timeline.
Stage Sustainability Component
Sustainability Objectives
Favorable soil biology and healthy microbes Improved soil structure to pre-project levels (or more)
Vegetation Healthy plant communities Maximum natural density of native grasses and forbs
Diverse species composition Increased canopy cover from native shrubs and trees
Optimal rooting depth Increased root strength with well developed tap roots
Water Increased water quality
Sustainable erosion control objectives will vary based on the habitat where the project occurs. For instance, if the project occurs within existing grasslands, then the objectives will include meeting the requirements of grasslands as the climax (stable/balanced) community.
2.3 Step 3: Collect Site-Specific Data
2.3.1 Step 3a: Desktop Study
Performing a desktop study requires collecting pertinent site information prior to a site visit and helps during reconnaissance efforts. Based on availability, use the resources listed below when conducting a desktop study.
Environmental. Review Preliminary Environmental Analysis Report (PEAR) along with the Project Approval/Environmental Document (PA/ED) and complete the Environmental Studies Checklist (Step 3 Desktop Study Sample Project SR 76, Appendix B).
Maintenance. Interview maintenance supervisor and determine maintenance issues.
Geotechnical. Review Geotechnical Design Report.
Aerial Map. Review the vegetation and other land cover.
Topographic Map. Review slope steepness and drainage flow patterns (Figure 3).
Soils Map. Determine soil types. This may vary if material is brought onto the project site (Figure 4).
Geology Map. Determine slope stability (Figure 5).

The Decision-Making Process
OnlineTechGuide.doc 7 November 2010
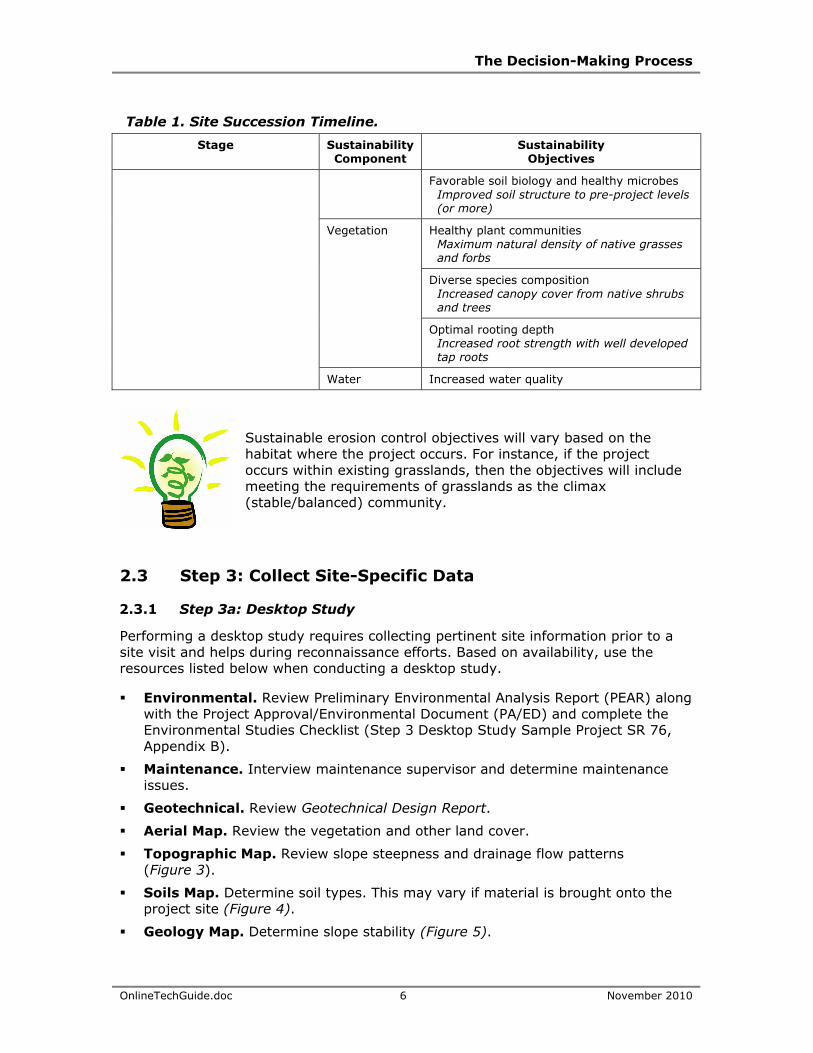
Local Annual Rainfall. Determine the amount and intensity of local annual rainfall (Figures 6 and 7).
Erosivity. Obtain R-Values from USDA-NRCS National RUSLE2 Database online at: http://fargo.nserl.purdue.edu/rusle2_dataweb/RUSLE2_Index.htm. Explanation of the Revised Universal Soil Loss Equation Version 2 (RUSLE2) can be found on Page 22 of this Technical Guide.
Vegetation. Refer to Figure 16 and the transPLANT tool (Step 6).
Project History. Review any previous projects and studies of the project site.
Figures 3 through 7 (see below) show samples of California’s diverse ecological composition.

The Decision-Making Process
OnlineTechGuide.doc 8 November 2010
Figure 3. California Topographic Map.

The Decision-Making Process
OnlineTechGuide.doc 9 November 2010
Figure 4. California Soils Map.

The Decision-Making Process
OnlineTechGuide.doc 10 November 2010
Figure 5. Physiographic Provinces of California.

The Decision-Making Process
OnlineTechGuide.doc 11 November 2010
Figure 6. California Annual Rainfall Erosivity.
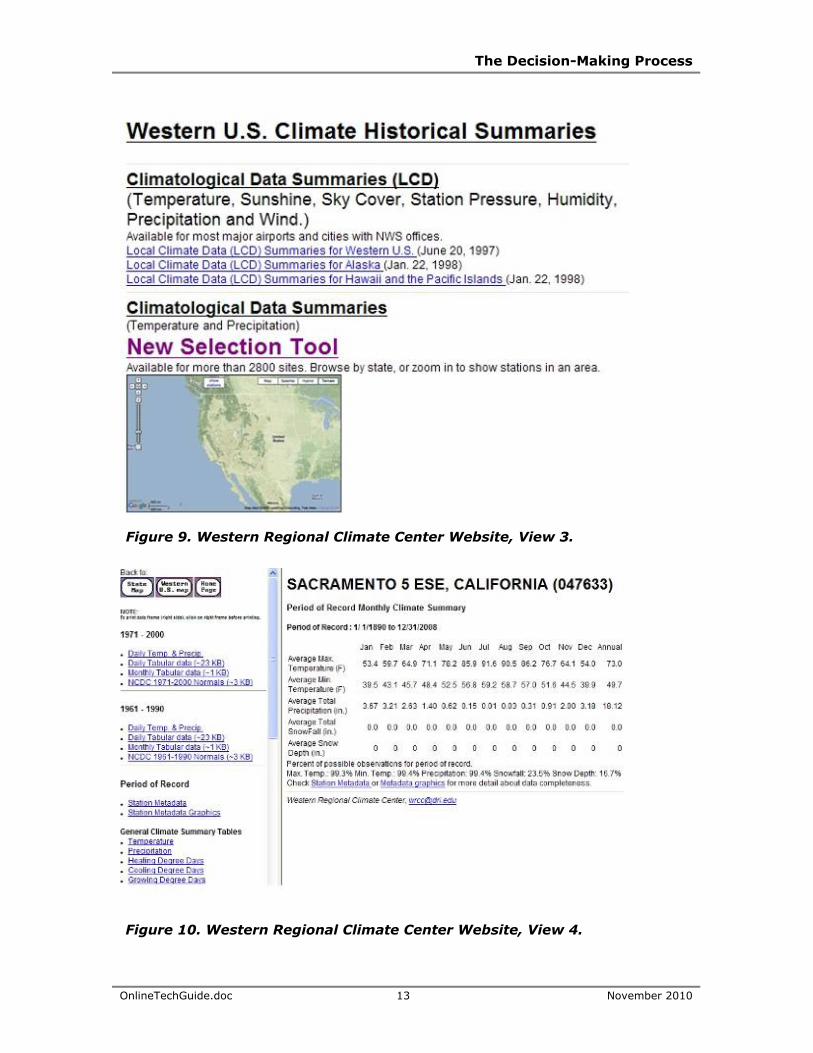
Refer to Figure 7 through 10 for local climate data from the Western Regional Climate Center.
The Decision-Making Process
OnlineTechGuide.doc 12 November 2010
Figure 7. Western Regional Climate Center Website, View 1. This information can be found online at: http://www.wrcc.dri.edu/index.html
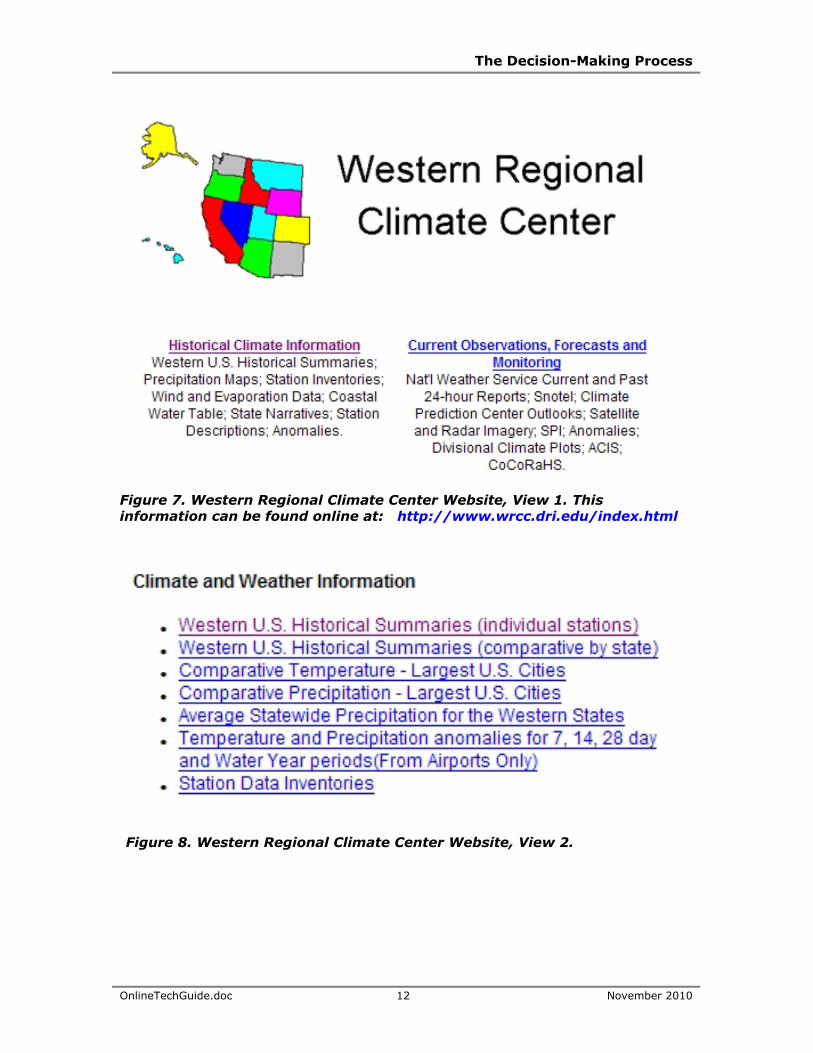
Figure 8. Western Regional Climate Center Website, View 2.
The Decision-Making Process
OnlineTechGuide.doc 13 November 2010
Figure 9. Western Regional Climate Center Website, View 3.
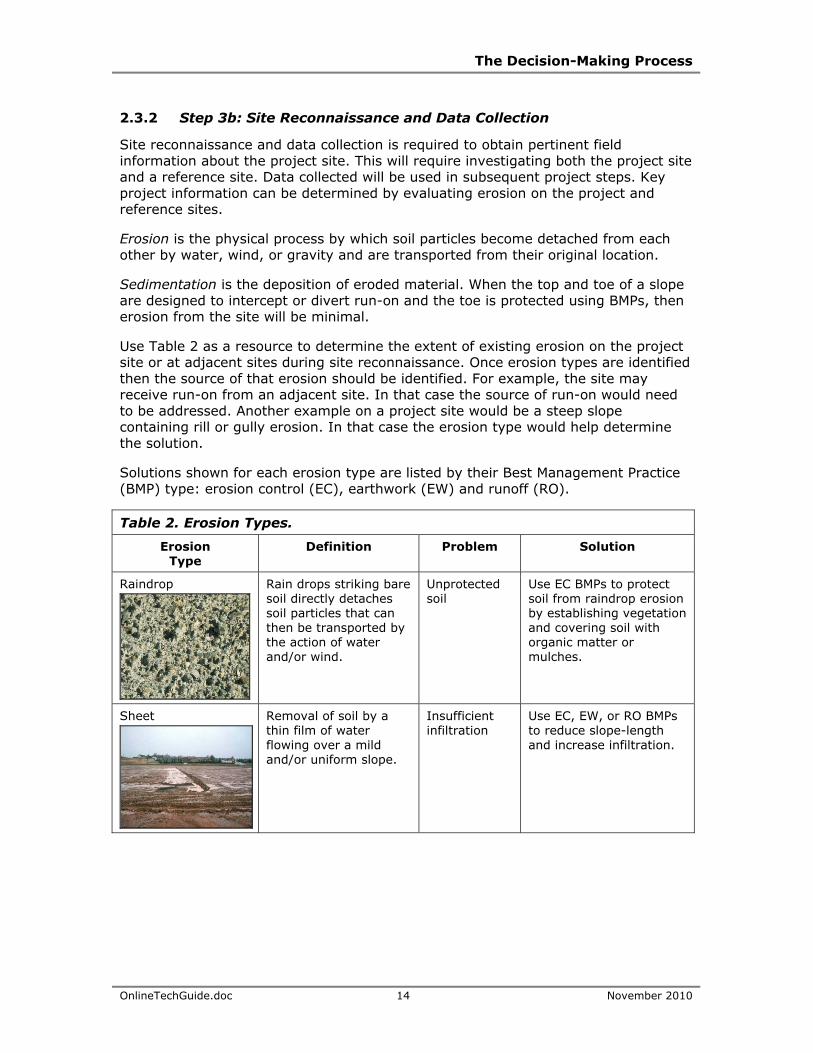
Figure 10. Western Regional Climate Center Website, View 4.
The Decision-Making Process
OnlineTechGuide.doc 14 November 2010
2.3.2 Step 3b: Site Reconnaissance and Data Collection
Site reconnaissance and data collection is required to obtain pertinent field information about the project site. This will require investigating both the project site and a reference site. Data collected will be used in subsequent project steps. Key project information can be determined by evaluating erosion on the project and reference sites.
Erosion is the physical process by which soil particles become detached from each other by water, wind, or gravity and are transported from their original location.
Sedimentation is the deposition of eroded material. When the top and toe of a slope are designed to intercept or divert run-on and the toe is protected using BMPs, then erosion from the site will be minimal.
Use Table 2 as a resource to determine the extent of existing erosion on the project site or at adjacent sites during site reconnaissance. Once erosion types are identified then the source of that erosion should be identified. For example, the site may receive run-on from an adjacent site. In that case the source of run-on would need to be addressed. Another example on a project site would be a steep slope containing rill or gully erosion. In that case the erosion type would help determine the solution.
Solutions shown for each erosion type are listed by their Best Management Practice (BMP) type: erosion control (EC), earthwork (EW) and runoff (RO).
Table 2. Erosion Types.
Erosion Type
Definition Problem Solution
Raindrop
Rain drops striking bare soil directly detaches soil particles that can then be transported by the action of water and/or wind.
Unprotected soil
Use EC BMPs to protect soil from raindrop erosion by establishing vegetation and covering soil with organic matter or mulches.
Sheet
Removal of soil by a thin film of water flowing over a mild and/or uniform slope.
Insufficient infiltration
Use EC, EW, or RO BMPs to reduce slope-length and increase infiltration.

The Decision-Making Process
OnlineTechGuide.doc 15 November 2010
Table 2. Erosion Types.
Erosion Type
Definition Problem Solution
Rill
Shallow surface flows that become concentrated. Well-defined tiny channels. The rate of rill erosion can be approximately 10 times greater than sheet erosion.
Increased velocity from concentrated flow
Use EC or EW BMPs to minimize slope length and slope inclination, maximize surface roughness.
Gully
Large, deep cuts in soil. Often too large to step across. Several rills may form throughout a slope and eventually may join together to form Gullies. The rate of gully erosion can be approximately 100 times greater than rill erosion.
Large volume of concentrated flow
Use EC, EW or RO BMPs to divert or address concentrated flows, consult Hydraulic Engineer.
Channel
Occurs in areas where tributaries, storm drains and or culverts flow into unprotected channels. Increases volume, velocity and duration of flow.
High volume or velocity in unprotected channels
Use EC or RO BMPs to vegetate or protect channels through energy dissipaters, consult Hydraulic Engineer.
Mass Wasting
Slumps – Rotational movement along a concave, spoon-shaped surface of failure.
Slides – Downslope slippage along a planer surface of failure.
Slope instability
Use EW BMPs to stabilize slope, consult Geotechnical Engineer.
The shape of the channel indicates the type of material being eroded:
V-shaped channel=Sand
-shaped channel=Clay
U-shaped channel=Silt

The Decision-Making Process
OnlineTechGuide.doc 16 November 2010
Table 3 lists project site reconnaissance tasks and what types of data to collect for each sustainability component. The goal of project site reconnaissance is to determine existing soil, water and vegetation conditions at the project site.
Table 3. Project Site Reconnaissance and Data Collection Tasks.
Sustainability component
Project Site Reconnaissance Tasks
Project Site Data Collection Tasks
Soil Inspect eroded areas Inspect fills and cuts Locate discharge point(s) Identify topsoil location and
depth Review potential disturbed
soil area (DSAs)
Collect soil samples; see complete guidance for soil testing1
See Appendix A for additional soil information about: Texture. Refer to Fig.A-1 Soil triangle Fertility. See Fig.A-2. Common Plant
Nutrient Deficiency Indicators Structure. See Fig.A-3. Examples of
Soil Structure Types and Fig.A-4 Soil Structure Triangle Biology. See Fig.A-5 Soil Food Web
Water Identify run-on and runoff areas and direction of sheet and concentrated flow.
Perform field mapping
Vegetation Inspect existing vegetation Identify litter/duff location
and depth
Document plants and plant communities on site (take photographs and collect specimens)
Perform transects to determine vegetation density, consult Biologist
Measure plant size and assess vigor Data collected at this step will be used
in Section 6. Evaluate and Select Sustainable Vegetation
Other Considerations
Identify potential Environmentally Sensitive Areas (ESA)
Record observations, verify ESAs with Environmental
1http://www.dot.ca.gov/hq/LandArch/policy/pdf/SoilTestingGuidanceCombo.pdf
The Decision-Making Process
OnlineTechGuide.doc 17 November 2010
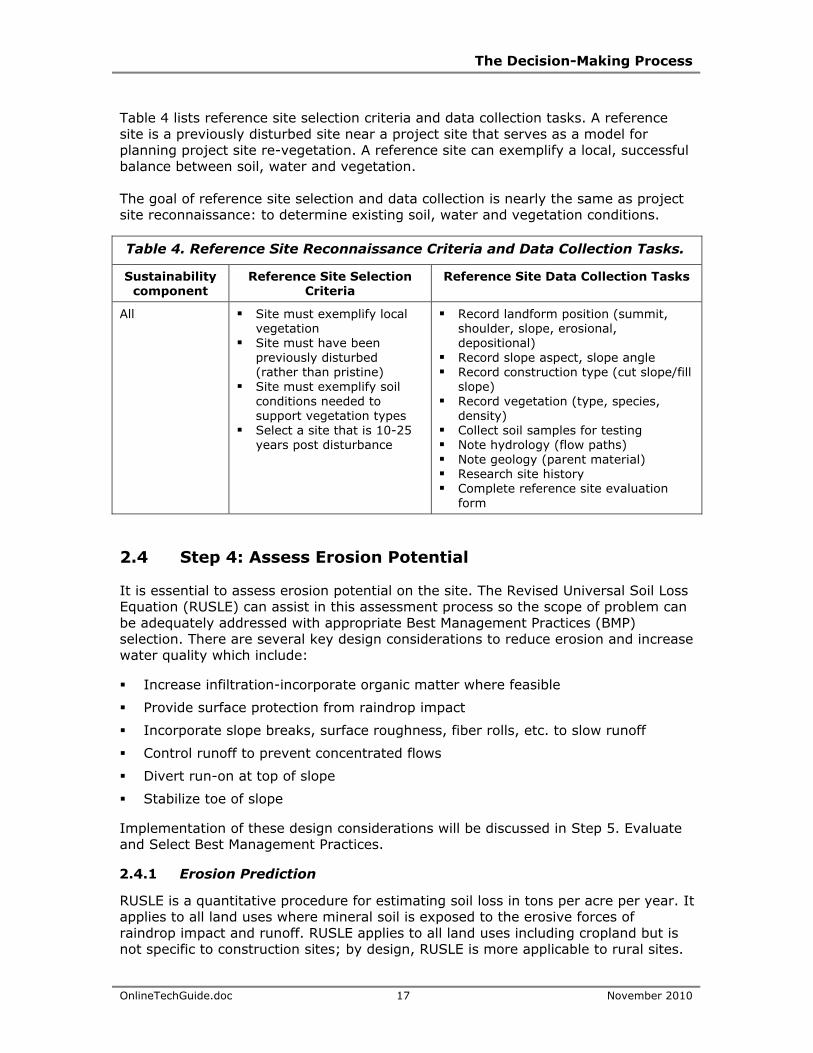
Table 4 lists reference site selection criteria and data collection tasks. A reference site is a previously disturbed site near a project site that serves as a model for planning project site re-vegetation. A reference site can exemplify a local, successful balance between soil, water and vegetation. The goal of reference site selection and data collection is nearly the same as project site reconnaissance: to determine existing soil, water and vegetation conditions.
Table 4. Reference Site Reconnaissance Criteria and Data Collection Tasks.
Sustainability component
Reference Site Selection Criteria
Reference Site Data Collection Tasks
All Site must exemplify local vegetation
Site must have been previously disturbed (rather than pristine)
Site must exemplify soil conditions needed to support vegetation types
Select a site that is 10-25 years post disturbance
Record landform position (summit, shoulder, slope, erosional, depositional)
Record slope aspect, slope angle Record construction type (cut slope/fill
slope) Record vegetation (type, species,
density) Collect soil samples for testing Note hydrology (flow paths) Note geology (parent material) Research site history Complete reference site evaluation
form
2.4 Step 4: Assess Erosion Potential
It is essential to assess erosion potential on the site. The Revised Universal Soil Loss Equation (RUSLE) can assist in this assessment process so the scope of problem can be adequately addressed with appropriate Best Management Practices (BMP) selection. There are several key design considerations to reduce erosion and increase water quality which include:
Increase infiltration-incorporate organic matter where feasible
Provide surface protection from raindrop impact
Incorporate slope breaks, surface roughness, fiber rolls, etc. to slow runoff
Control runoff to prevent concentrated flows
Divert run-on at top of slope
Stabilize toe of slope
Implementation of these design considerations will be discussed in Step 5. Evaluate and Select Best Management Practices.
2.4.1 Erosion Prediction
RUSLE is a quantitative procedure for estimating soil loss in tons per acre per year. It applies to all land uses where mineral soil is exposed to the erosive forces of raindrop impact and runoff. RUSLE applies to all land uses including cropland but is not specific to construction sites; by design, RUSLE is more applicable to rural sites.

The Decision-Making Process
OnlineTechGuide.doc 18 November 2010
RUSLE must be used as a predictive tool only. Basic information about RUSLE is described below. The information below can also be found online at: http://www.iwr.msu.edu/rusle/
Additionally, RUSLE is an important tool to use when documenting erosion decisions in Caltrans’ Storm Water Data Report (SWDR) (Caltrans, 2007). As BMPs are selected, RUSLE should be used to justify decisions made to reduce erosion to the maximum extent practicable. The SWDR is an appropriate place to document these decisions.
2.4.2 Revised Universal Soil Loss Equation (RUSLE)
A = R x K x LS x C x P
A = Average annual soil loss (tons/acre/year)
There are five major factors influencing erosion that are used to calculate average annual soil loss (A).
R = Rainfall erosivity
The rainfall erosivity factor is the average 30 minute maximum rainfall intensity multiplied by the total storm kinetic energy
Obtain rainfall intensity from NRCS
Soil loss is directly proportional to R
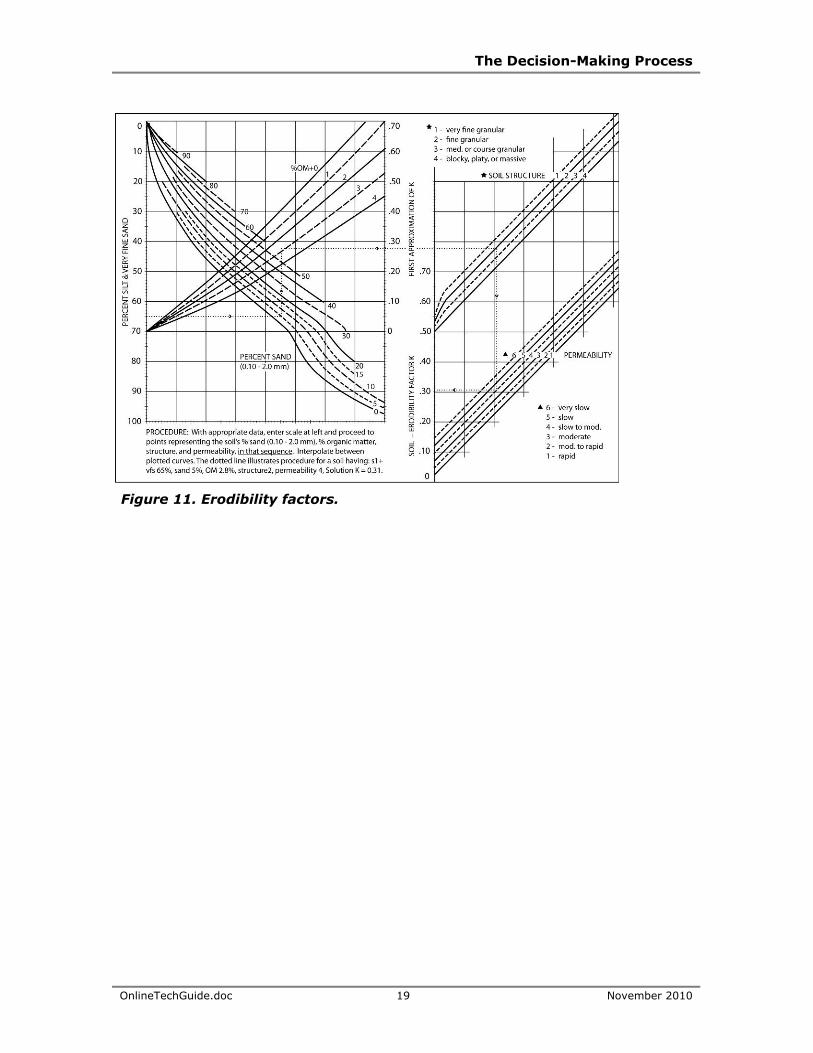
K = Soil erodibility (Figure 11)
The soil erodibility factor is the ease with which soil is detached
Soil loss is per unit of applied external force
L/S = Slope length and steepness (Figure 12)
L = Slope length
S = Slope steepness
These account for the effect of topography on erosion
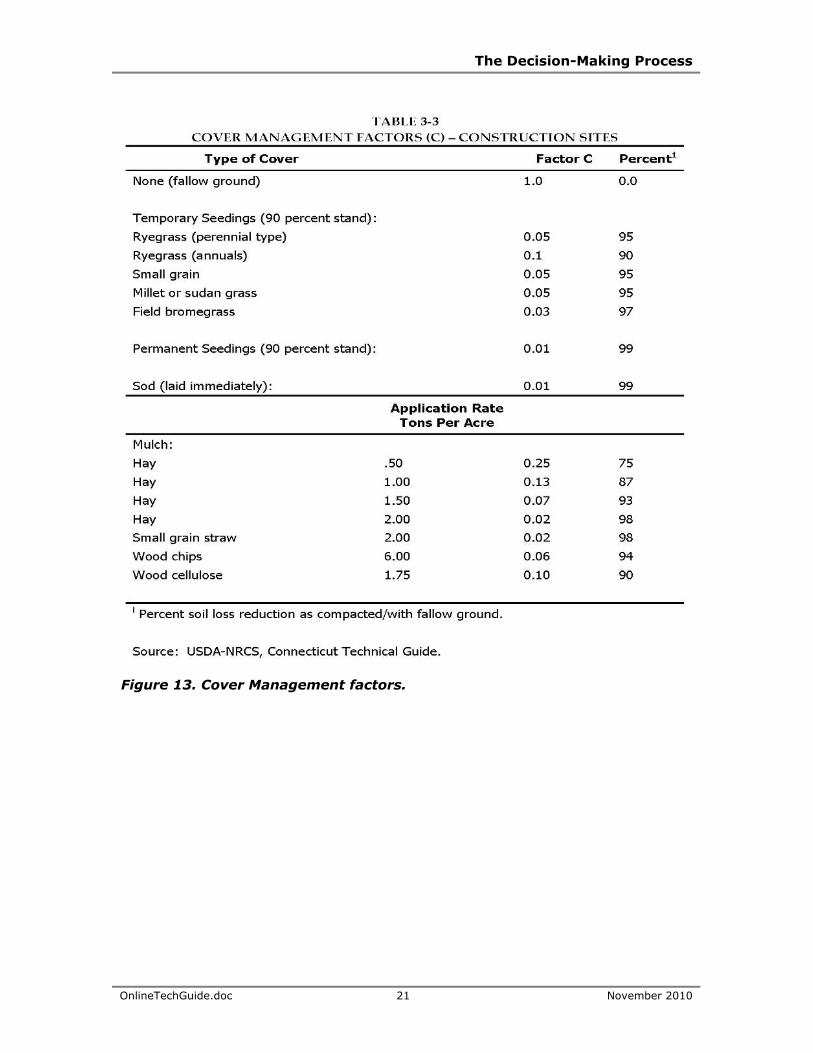
C = Soil cover management (Figure 13)
Used to reflect the effect of plant cover and management practices on erosion rates
Default C value = 1
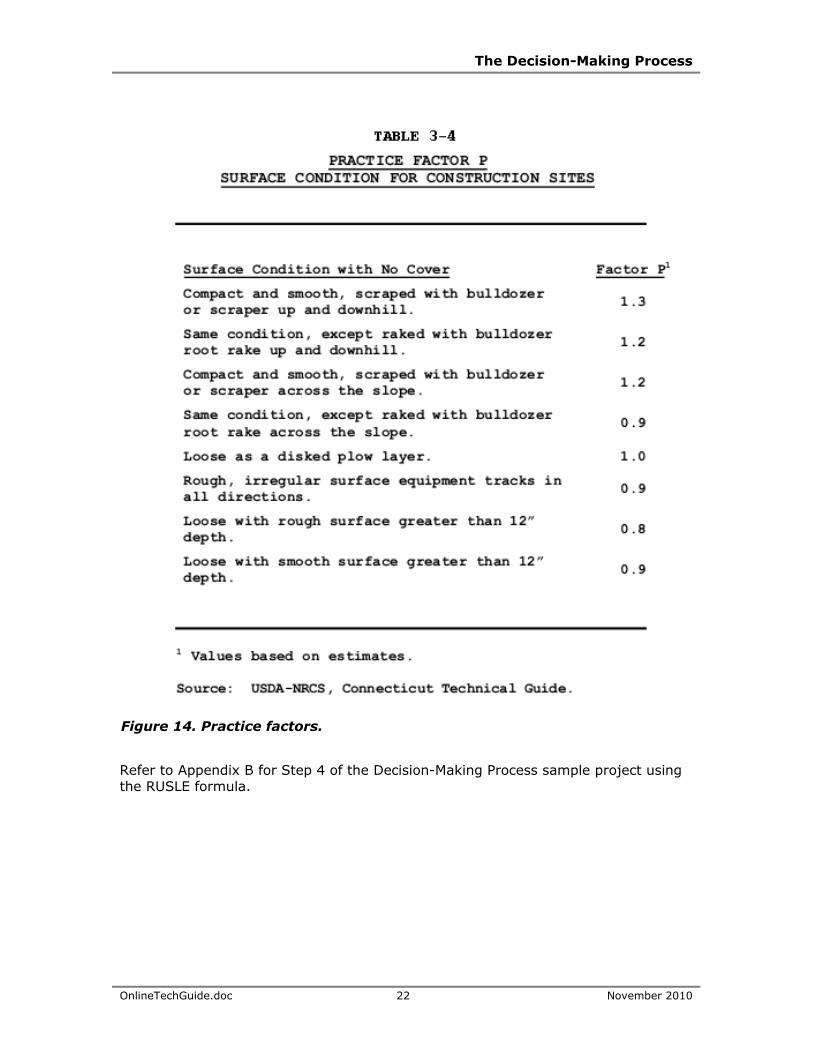
P = Practice (Figure 14)
Included to account for the effect of conservation practices
May include contour tillage, terraces, and grass waterways
Default P value = 1
The Decision-Making Process
OnlineTechGuide.doc 19 November 2010
Figure 11. Erodibility factors.

The Decision-Making Process
OnlineTechGuide.doc 20 November 2010
Figure 12. Slope Length and Steepness factors.
The Decision-Making Process
OnlineTechGuide.doc 21 November 2010
Figure 13. Cover Management factors.
The Decision-Making Process
OnlineTechGuide.doc 22 November 2010
Figure 14. Practice factors.
Refer to Appendix B for Step 4 of the Decision-Making Process sample project using the RUSLE formula.

The Decision-Making Process
OnlineTechGuide.doc 23 November 2010
Revised Universal Soil Loss Equation, Version 2 (RUSLE2) RUSLE2 is a computer-based model of the original RUSLE formula. It is applicable to urban environments and predicts soil loss according to BMP selection. RUSLE2 will be the tool Caltrans uses to comply with the Construction General Permit issued by the State Water Resources Control Board. The benefits and limitations of RUSLE2 include:
Caltrans has modified RUSLE2 for highway applications
RUSLE2 helps document site data needed for analyses
RUSLE2 can help the designer justify an erosion control strategy
Selecting BMPs in RUSLE2 is an iterative process
RUSLE2 does not provide BMP specifications, cost, or absolute effectiveness indicators (BMP data sheets provide this information)
To use RUSLE2 on the web and determine erosion potential, go online to: http://fargo.nserl.purdue.edu/rusle2_dataweb/RUSLE2_Index.htm
Figure 15. Example of RUSLE2 Software.

The Decision-Making Process
OnlineTechGuide.doc 24 November 2010
Design Pollution Prevention BMP Tool Box
Earthwork Erosion Control
Runoff Control
2.5 Step 5: Evaluate and Select Best Management Practices
2.5.1 Caltrans-Approved Best Management Practices (BMPs)
BMPs are structural, non-structural and management practices that are recognized to be the most effective and practical means of controlling soil loss and reducing water quality degradation. This guide focuses on Design Pollution Prevention BMPs for erosion control, while other Caltrans resources focus on Construction Site BMPs and Treatment BMPs.
Design Pollution Prevention (DPP) BMPs
DPP BMPs are permanent water quality controls used to reduce pollutant discharges by preventing erosion. DPP BMPs are separated into three categories:
Earthwork (Soil Preparation). Provides increased infiltration, slows runoff and incorporates soil amendments. See Table 5 below.
Erosion Control. Protects against raindrop and surface erosion. See Tables 6 through 11 below.
Runoff Control. Protects against damage from concentrated flow. See Table 10 below.
Detailed data sheets for each DPP BMP can be found on the Landscape Architecture Program website at: http://www.dot.ca.gov/hq/LandArch/ec/index.htm.
During the design process, use BMPs that address both detachment and transport of sediment.
2.5.2 Earthwork (Soil Preparation)
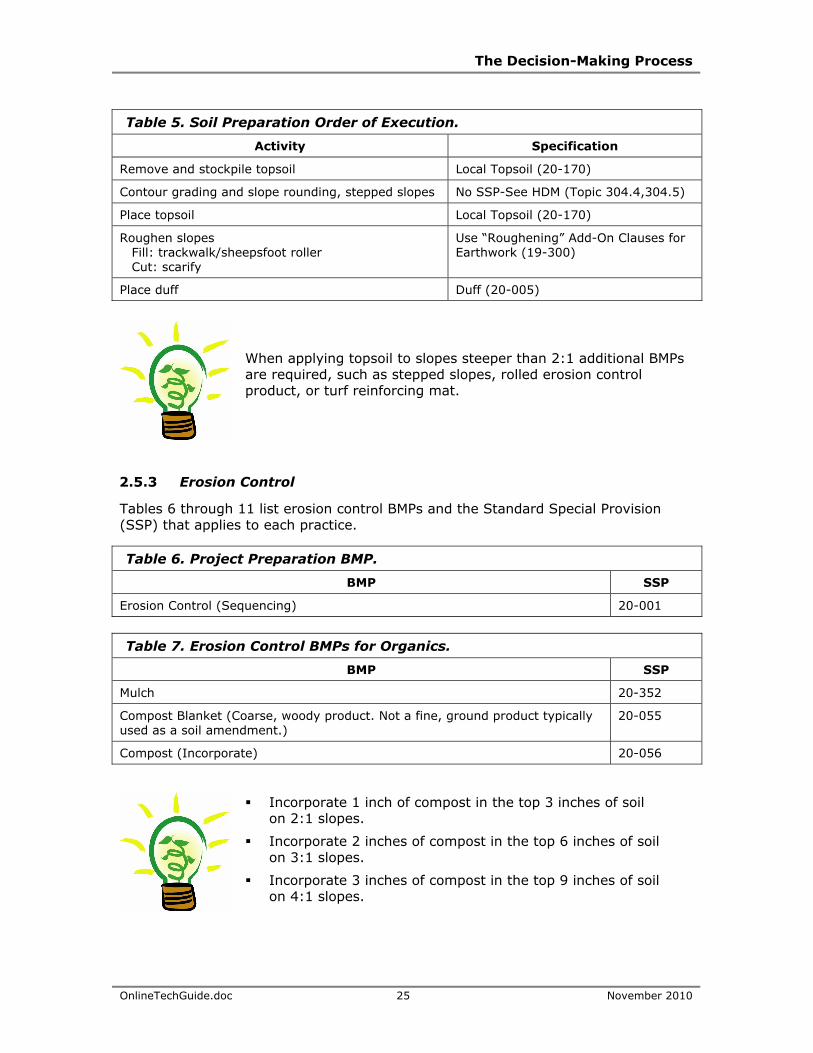
Table 5 summarizes earthwork/soil preparation BMPs and their order of execution. Specifications and related information resources are also listed.
Table 5. Soil Preparation Order of Execution.
Activity Specification
Preserve existing vegetation/soils ESA Fence (07-446)
Clearing and Grubbing Clearing and Grubbing (16-020)
Chip and stockpile cleared material (harvest duff) Duff (20-005)
The Decision-Making Process
OnlineTechGuide.doc 25 November 2010
Table 5. Soil Preparation Order of Execution.
Activity Specification
Remove and stockpile topsoil Local Topsoil (20-170)
Contour grading and slope rounding, stepped slopes No SSP-See HDM (Topic 304.4,304.5)
Place topsoil Local Topsoil (20-170)
Roughen slopes Fill: trackwalk/sheepsfoot roller Cut: scarify
Use “Roughening” Add-On Clauses for Earthwork (19-300)
Place duff Duff (20-005)
When applying topsoil to slopes steeper than 2:1 additional BMPs are required, such as stepped slopes, rolled erosion control product, or turf reinforcing mat.
2.5.3 Erosion Control
Tables 6 through 11 list erosion control BMPs and the Standard Special Provision (SSP) that applies to each practice.
Table 6. Project Preparation BMP.
BMP SSP
Erosion Control (Sequencing) 20-001
Table 7. Erosion Control BMPs for Organics.
BMP SSP
Mulch 20-352
Compost Blanket (Coarse, woody product. Not a fine, ground product typically used as a soil amendment.)
20-055
Compost (Incorporate) 20-056
Incorporate 1 inch of compost in the top 3 inches of soil on 2:1 slopes.
Incorporate 2 inches of compost in the top 6 inches of soil on 3:1 slopes.
Incorporate 3 inches of compost in the top 9 inches of soil on 4:1 slopes.

The Decision-Making Process
OnlineTechGuide.doc 26 November 2010
Table 8. Erosion Control BMPs-Hydraulically Applied.
BMP SSP
Erosion Control (Hydraulically Applied Materials) No SSP
Erosion Control (Punched Straw) 20-030
Erosion Control (Hydroseed) 20-040
Erosion Control (Polymer Stabilized Fiber Matrix) 20-047
Erosion Control (Bonded Fiber Matrix) 20-041
Table 9. Erosion Control BMPs-Rolled Erosion Control Products (RECP).
BMP SSP
Rolled Erosion Control Product (Jute Mesh) 20-356
Rolled Erosion Control Product (Netting) 20-015
Rolled Erosion Control Product (Blanket) 20-010
Table 10. Erosion Control BMPs-Other Stormwater SSPs.
BMP SSP
Fiber Rolls 20-060
Compost Sock 20-062
Table 11. Erosion Control BMPs-Planting.
BMP SSP
Erosion Control (Drill Seed) 20-050
Willow Cutting (Plant Group W) 20-090
Erosion Control (Seeding) 20-049
Liner (Plant Group M) 20-502
Seedling (Plant Group S) 20-070
2.5.4 Runoff Control
Table 12 lists a runoff control BMP and SSP that are frequently proposed by Landscape Architects.
Table 12. Runoff Control BMPs.
BMP SSP
Rolled Erosion Control Product (Turf Reinforcing Mat) 20-042

The Decision-Making Process
OnlineTechGuide.doc 27 November 2010
Assist Project Engineer with selecting BMPs in streams or channels below the 100-year base flood elevation.
2.5.5 Why BMPs Fail
Application. The incorrect BMP was chosen for the type of erosion control needed.
Installation. BMP was not installed properly. BMPs are not applied in the correct sequence to be effective.
Inspection. BMP was not inspected or maintained following installation (only for BMPs that require periodic inspection and maintenance).
2.5.6 How to Prevent Failure
Ensure proper BMP implementation/installation through coordination with Resident Engineer.
Ensure erosion control design takes into account the appropriate storm intensity.
Ensure Resident Engineer has appropriate product information for materials specified.
2.6 Step 6: Evaluate and Select Sustainable Vegetation
Selecting appropriate plants is critical to achieving a sustainable erosion control design that stabilizes disturbed soil areas and helps promote succession. Succession seeks to re-establish natural stages of vegetation growth by providing early successional species as initial plant cover and creating conditions that support the establishment of later successional species.
Many disturbed sites are naturally “colonized” by early succession plants such as annual grasses and are then later supported by a more diverse cover of perennials, woody shrubs and trees. Selecting a balance of early and late succession plants in the project design is appropriate. The project’s selected reference site will help identify climax species and determine which early and late succession plants will be most successful.
There are many potential site constraints that might inhibit the succession process. These include but are not limited to drought, poor soils and noxious weed infestations on or near the project site. Sustainability objectives provided in Step 2, Table 1, should be based on what is reasonably obtainable, considering potential site constraints.
Table 13 summarizes how to evaluate and select sustainable vegetation.

The Decision-Making Process
OnlineTechGuide.doc 28 November 2010
2.6.1 What Should Be Grown?
2.6.1.1 Ecosystem Succession
Table 13. Early and Late Ecosystem Succession.
Ecosystem Succession Vegetation Type Characteristics
Early Succession (Pioneer species)
Forbs, grasses, mixed herbaceous plants, sub-shrubs
Excellent for initial erosion control Sun-loving Grow quickly Spread easily Good soil coverage
Not long-lived
Late Succession (Climax)
Grasses, woody shrubs, trees
Excellent for long-term stability Long-living Larger canopy
Extensive root systems
Figure 16 below illustrates the wide diversity of vegetation in California and emphasizes the importance of using a reference site.

The Decision-Making Process
OnlineTechGuide.doc 29 November 2010
Figure 16. California Vegetation Habitat Region.

The Decision-Making Process
OnlineTechGuide.doc 30 November 2010
2.6.1.2 Establishing Sustainable Vegetation
Things to consider:
Root type and root depth. Fine spreading roots have superior “pullout resistance” (i.e., the measured resistance of root structure to be pulled out of the ground) while tap roots can grow large and extensively, providing drought resistance.
Degree of soil protection during establishment period. Is the soil reliant solely on vegetation or does it have other means of soil protection (e.g., netting or compost blanket)?
Annuals and perennials. When applying annuals and perennials in combination, be mindful of the ratio of annuals to perennials. Perennials require time to establish while annuals tend to be quite vigorous initially and may out-compete perennials.
Grasses and forbs. Grasses allow natural recruitment of trees and shrubs while forbs provide aesthetic value and habitat. Consider combining grasses and forbs.
Time to establishment. Some species establish more rapidly than others.
Tolerance. Select sun-loving, shade-tolerant or a combination of both depending on the needs of the project site; give consideration as to whether selected vegetation is moisture-loving or drought-resistant. Select vegetation for nutrient-rich or nutrient-poor growing mediums.
Characteristics. Are the chosen plants early or late successional characteristics described in Table 13 above?
2.6.2 What Can Be Grown?
2.6.2.1 transPLANT
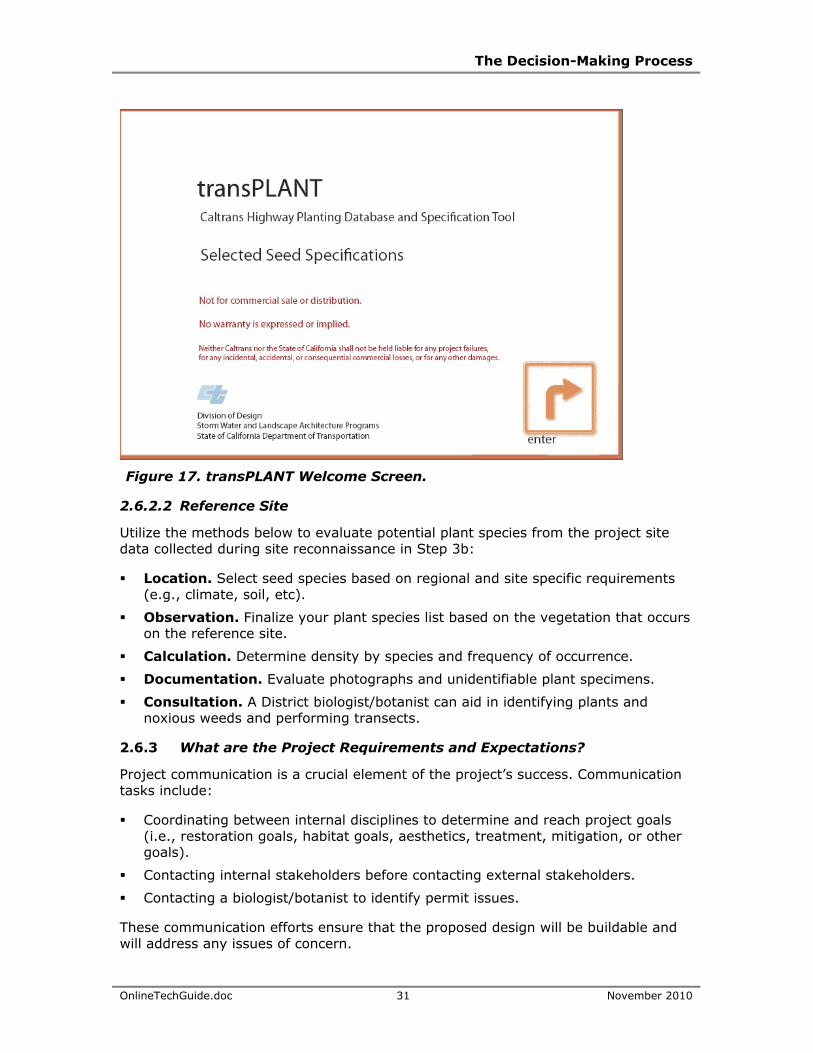
transPLANT is an online tool that provides District and region specific data to assist Caltrans Landscape Architects in selecting appropriate plant species for erosion control, re-vegetation, bio-filtration, and other highway planting situations. Prior to recommending grasses, forbs and other plants, transPLANT evaluates factors like a project site’s elevation, rainfall, soil type and regional plant communities. transPLANT can be found on the Landscape Architecture Program website at: http://www.dot.ca.gov/hq/LandArch/transplant
transPLANT is intended to supplement, not replace, the knowledge of Caltrans District personnel. Using transPLANT in conjunction with project site reconnaissance is recommended before selecting plant material. Plant materials included in the transPLANT database are primarily species that are commercially available as either seed or live plants.
The Decision-Making Process
OnlineTechGuide.doc 31 November 2010
Figure 17. transPLANT Welcome Screen.
2.6.2.2 Reference Site
Utilize the methods below to evaluate potential plant species from the project site data collected during site reconnaissance in Step 3b:
Location. Select seed species based on regional and site specific requirements (e.g., climate, soil, etc).
Observation. Finalize your plant species list based on the vegetation that occurs on the reference site.
Calculation. Determine density by species and frequency of occurrence.
Documentation. Evaluate photographs and unidentifiable plant specimens.
Consultation. A District biologist/botanist can aid in identifying plants and noxious weeds and performing transects.
2.6.3 What are the Project Requirements and Expectations?
Project communication is a crucial element of the project’s success. Communication tasks include:
Coordinating between internal disciplines to determine and reach project goals (i.e., restoration goals, habitat goals, aesthetics, treatment, mitigation, or other goals).
Contacting internal stakeholders before contacting external stakeholders.
Contacting a biologist/botanist to identify permit issues.
These communication efforts ensure that the proposed design will be buildable and will address any issues of concern.

The Decision-Making Process
OnlineTechGuide.doc 32 November 2010
2.6.4 What Is Available?
2.6.4.1 Vegetation Types
Consider selecting a variety of annuals, perennials, forbs, woody shrubs and trees for the project. Table 14 lists some options and their SSPs.
Table 14. Vegetation Options and SSPs.
Vegetation Form
Options SSP (Refer to BMP data sheets for details)
Seed Grasses, forbs or legumes. Drill Seed (SSP 20-050) Seeding (SSP 20-049)
Seedlings Small perennial or woody shrubs.
Seedling Plants (Plant Group S) (SSP 20-070)
Containers Small perennial or woody shrubs.
Liner Plants (Plant Group M) (SSP 20-502)
Cuttings Willows. Willow Cuttings (Plant Group W) (SSP 20-090)
The development of a native seed mix is crucial for successful, sustainable revegetation. The species, quantity and size of seed, and the interaction of species in the seed mix itself are major factors to consider when developing a seed mix.
A typical native seed mix might contain:
A small amount of annual seeds for quick cover. Too many annuals can dominate and out-compete perennials.
A variety of perennial grasses and forbs indigenous to the area (i.e., in the reference site, where native grasses might allow natural recruitment of conifers and oaks).
Nurse crops that can provide protection for surrounding vegetation for the first year (six-weeks fescue).
Forbs for aesthetics and wildlife habitat.
Table 15 gives an example seed mix for erosion control.
Table 15. Example Seed Mix.
Species California Native?
Annual or Perennial?
Pounds per Acre
Six-weeks fescue No Annual 3
Purple needlegrass Yes Perennial 15
Blue wildrye Yes Perennial 12
California Brome Yes Perennial 10
Total 40
Note: Designer is required to verify germination rates prior to specification. Germination rates vary depending on seed lot; check with seed distributor. Six-week fescue seeds are very small (nearly 300,000 seeds/pound); there is proportionally much less six-week fescue in a typical native seed mix.

The Decision-Making Process
OnlineTechGuide.doc 33 November 2010
2.6.4.2 Information from Vendors
Seek information from vendors about:
Species selection based on regional and site-specific requirements (e.g., climate, soil, etc.).
Availability of species cultivars, cost and acceptable substitutions if particular species are unavailable.
Short shelf life seed species.
Commonly used seed species.
Predominant species characteristics and nomenclature.
Purity and germination of each species.
Quantity of seeds per pound.
Storage accommodations.
Cost per pound of PLS.
Be cautious as vendors may:
Recommend species based on cost (to increase their profit) and not what is most beneficial to the project site.
Recommend species the vendor needs to move (overstock).
Use incorrect specification nomenclature (taxonomy and cultivars).
Recommend species without pertinent site information (i.e., soil type or microclimate).
Remember to compare the final design to the Reference Site Objective.
2.6.5 How Is It Accomplished?
2.6.5.1 Calculations
Refer to Step 6. of the Decision-Making Process: Plant Selection in the Sample Problems located in Appendix B for information on calculations.
Calculate seed application rate.
Calculate bulk seed quantity and pure live seed.
Calculate bulk seed quantity and germination.
Calculate pure live seed and cost.
2.6.5.2 Seed Glossary
Purity: The percentage of desired seed in a seed mix.
Weed: Non-desirable plant species as defined by the California Department of Food and Agriculture and the California Code of Regulations.
Germination: The percentage of maximum plant producing potential of a seed lot, i.e., the capability to germinate and produce a normal seedling under favorable conditions.

The Decision-Making Process
OnlineTechGuide.doc 34 November 2010
Dormancy: An inactive state, when growth and development slow or cease in order to survive adverse environmental conditions.
Hard Seed: Viable seed that germinates over a period of time. Differences in the ability of the seed coat to allow water into the seed, to start the germination process, result in delayed germination.
Viability: The ability of a seed to germinate or develop normally. Viability of a seed is its ability to germinate, but does not take into account dormancy or the condition of the seed once germinated.
Pure Live Seed (PLS): The percentage of live seed that will germinate in an overall lot.
Higher purity mixtures may be more expensive but are considered desirable because they have less weed seed.
2.6.5.3 Seed Formulas
Pure Live Seed (PLS) = Germination (G) x Purity (P)
100
Bulk Seeding Rate/ac = Pounds PLS recommended rates per ac
Percent PLS
Price per pound (PLS) = Price per pound bulk
Percent PLS
2.6.5.4 Irrigation
If species are selected that are adapted to the local rainfall and microclimate conditions, supplemental irrigation may not be necessary for establishment. However, irrigation may be required for liner plants, seedlings and cuttings when planted during summer months. When construction windows allow planting to occur during the wet season, irrigation can be avoided.
Table 16. Summary: How to Evaluate and Select Sustainable Vegetation.
Questions to Ask Sources for Answers
What should be grown? The goal is ecosystem succession Establish sustainable vegetation
What can be grown? transPLANT Survey the selected reference site; establish reference
site with assistance from a Botanist/Biologist

The Decision-Making Process
OnlineTechGuide.doc 35 November 2010
Table 16. Summary: How to Evaluate and Select Sustainable Vegetation.
Questions to Ask Sources for Answers
What are the project requirements and expectations?
Project communication Specialists (internal and external)
(Note: Contact internal specialists first) Stakeholders (identify their goals)
Permit agencies
What is available? Vegetation types Information from vendors
How is it accomplished? Calculations -Seed application rate -Sulk seed quantity and pure live seed -Bulk seed quantity and germination -Pure live seed and cost
Seed Glossary Seed formulas
Irrigation
Other Resources
OnlineTechGuide.doc 36 November 2010
3.0 Other Resources
3.1 Non-Department Certifications
Certified Professional in Erosion and Sediment Control (CPESC)
CPESC, Inc. has developed standards and procedures for certifying persons qualified to practice in the field of erosion and sediment control. Individuals are certified based on thorough examination and review of the person’s education and experience in both the public and private sector.
Additional information on this process can be found online at: http://www.cpesc.net/ 3.2 Publications Manual of California Vegetation (MCV), Sawyer and Keeler-Wolf
At time of posting, a web-based version of this manual exists and is maintained through the University of California at Davis. The program continues to update and improve this query-able tool. This program can be found online at: http://davisherb.ucdavis.edu/cnpsActiveServer/index.html
The MCV 2nd Edition is now available through the California Native Plant Society (CNPS) in hard copy only. CNPS intends to establish a new web-based version of the manual by the end of 2010 to bring in all the new information from the second edition. California Department of Fish and Game (CDFG) will require adherence to the 2nd Edition when documenting for agency related issues.
A list of other publications can be found on the Landscape Architecture Program website at: http://www.dot.ca.gov/hq/LandArch/pubs/index.htm 3.3 Websites
Caltrans Landscape Architecture Program-Erosion Control Toolbox: http://www.dot.ca.gov/hq/LandArch/ec/index.htm
Caltrans’ Soil Testing Guidance (pdf format): http://www.dot.ca.gov/hq/LandArch/policy/pdf/SoilTestingGuidanceCombo.pdf
transPLANT: http://www.dot.ca.gov/hq/LandArch/transplant
Manual of California Vegetation: http://davisherb.ucdavis.edu/cnpsActiveServer/index.html
Western Regional Climate Center: http://www.wrcc.dri.edu/index.html
Reference Material
OnlineTechGuide.doc 37 November 2010
4.0 Reference Material
Agricultural Research Service, United States Department of Agriculture. RUSLE: http://www.ars.usda.gov/Research/docs.htm?docid=5971
Roadside Revegetation, An Integrated Approach to Establishing Native Plants: http://www.nativerevegetation.org/learn/manual/ch_10_3.aspx#10_3_1
Hickman, J. C. (Editor). 1993. The Jepson Manual: Higher Plants of California. University of California Press.
Ouyang, Dr. Da. RUSLE On-line Soil Erosion Control Assessment Tool: http://www.iwr.msu.edu/rusle/
The Cooperative Soil Survey: http://soils.missouri.edu/index.asp Sierra Business Council. 2009. Sediment Source Control Handbook, Vegetative
Treatments: http://www.dot.ca.gov/hq/LandArch/ec/references/hogan_tahoe/SSCH2008.pdf#page=131
Singer, M.J., and Munns, D.N. (2002). Soils: An Introduction. Fifth Edition. Pearson Education, Inc.

Appendix A
Appendix A Soils Reference

Soils Reference
OnlineTechGuide.doc A-1 November 2010
Soils Reference
Soil Texture
Soil texture varies depending on its content of sand, silt and clay (the three percentages added will equal 100 percent). If sand, silt, and clay percentages are known, the textural triangle can be used to find the textural class name (for example sandy loam). Visit the NRCS website at: http://soils.usda.gov/education/resources/k_12/lessons/texture/ to learn more about how to use the textural triangle.
Sand particles are larger than those of silt and clay (0.05 to 2.0mm USDA). Because of their size and relatively low surface area to volume ratio, they are generally less reactive, tend to be a poor source of nutrients for vegetation, and are less susceptible to water erosion.
Silt particles are smaller than sand and larger then clay (0.002 to 0.05 mm USDA). Because they have a higher surface area to volume ratio than sand (medium in relative terms), they tend to be more easily detached and transported. They are moderately reactive, provide a medium to high nutrient supply, and are highly susceptible to water erosion.
Clay particles are smaller than sand and silt (less than 0.02 mm USDA) and have a much higher surface area to volume ratio than either. Though their small size makes them easily transported, they are less easily detached because the particles cohere tightly to one another. This makes clays less susceptible to water erosion if they are aggregated, but more susceptible if there is little soil structure. Because of their high exchange capacity, they are more reactive and provide an excellent source of nutrients.
Note that these are rules of thumb. Particle erosivity is also a function of site conditions (climate, topography, management, etc.), structure, mineralogy, and soil binding materials (organic matter, Fe and Al Oxides, etc.) to name a few.
Figure A-18. Soil Triangle.

Soils Reference
OnlineTechGuide.doc A-2 November 2010
Soil Fertility
Figure A-19. Common Plant Nutrient Deficiency Indicators.
All sites have a minimum threshold level of nutrients that must be met for vegetation to establish and become self-sustaining. Nutrients are essential for plant growth and development. If possible, soils should be sent to a lab to be tested for:
Texture
Bulk Density
Organic Matter Content
pH
Salinity
Sodium
Boron
Nitrogen
Phosphorus
Potassium
Recommended amendments
These results will identify soil nutrient availability and indicate possible toxicities. For more information on soil testing, visit the Landscape Architecture Program website at: http://www.dot.ca.gov/hq/LandArch/policy/pdf/SoilTestingGuidanceCombo.pdf
Soils Reference
OnlineTechGuide.doc A-3 November 2010
If a site is nutrient deficient, a variety of treatments may be used to increase fertility. These include:
Local Topsoil (SSP 20-170)
Duff (SSP 20-005)
Mulch (SSP 20-352)
Compost Blanket (SSP 20-055)
Compost Incorporate (SSP 20-056)
Organic or commercial fertilizer
More information on soil nutrients can be found on the Landscape Architecture Program website at: http://www.dot.ca.gov/hq/LandArch/ec/details/ec_nutrients.htm
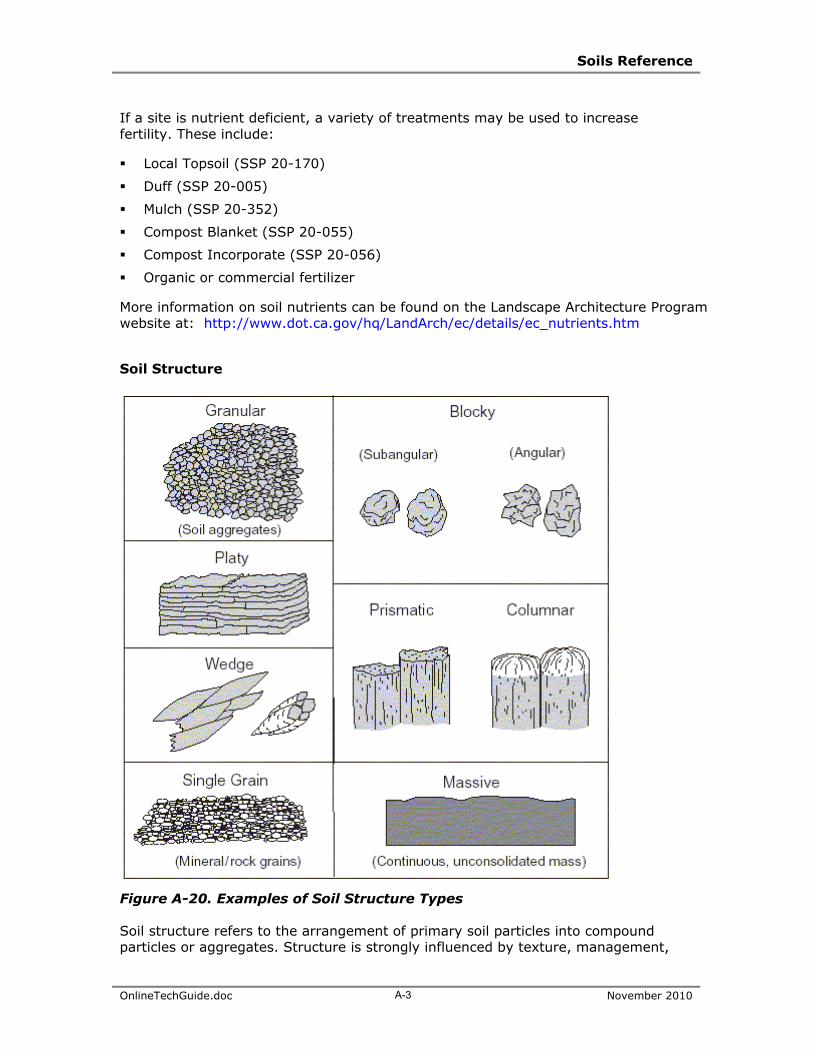
Soil Structure
Figure A-20. Examples of Soil Structure Types Soil structure refers to the arrangement of primary soil particles into compound particles or aggregates. Structure is strongly influenced by texture, management,

Soils Reference
OnlineTechGuide.doc A-4 November 2010
organic matter, compaction, drainage status, soil development and biological activity. Maintaining good soil structure can:
Increase water holding capacity
Promote root growth
Maintain aeration and drainage
Reduce potential for erosion
Figure A-4. Examples of Soil Structure
Soil Biology
Soil biology directly impacts:
Rates of erosion
Run-off
Sedimentation
Compaction
Soil water content
Soil structure
Water Quality
Plant Fertility
Soils Reference
OnlineTechGuide.doc A-5 November 2010
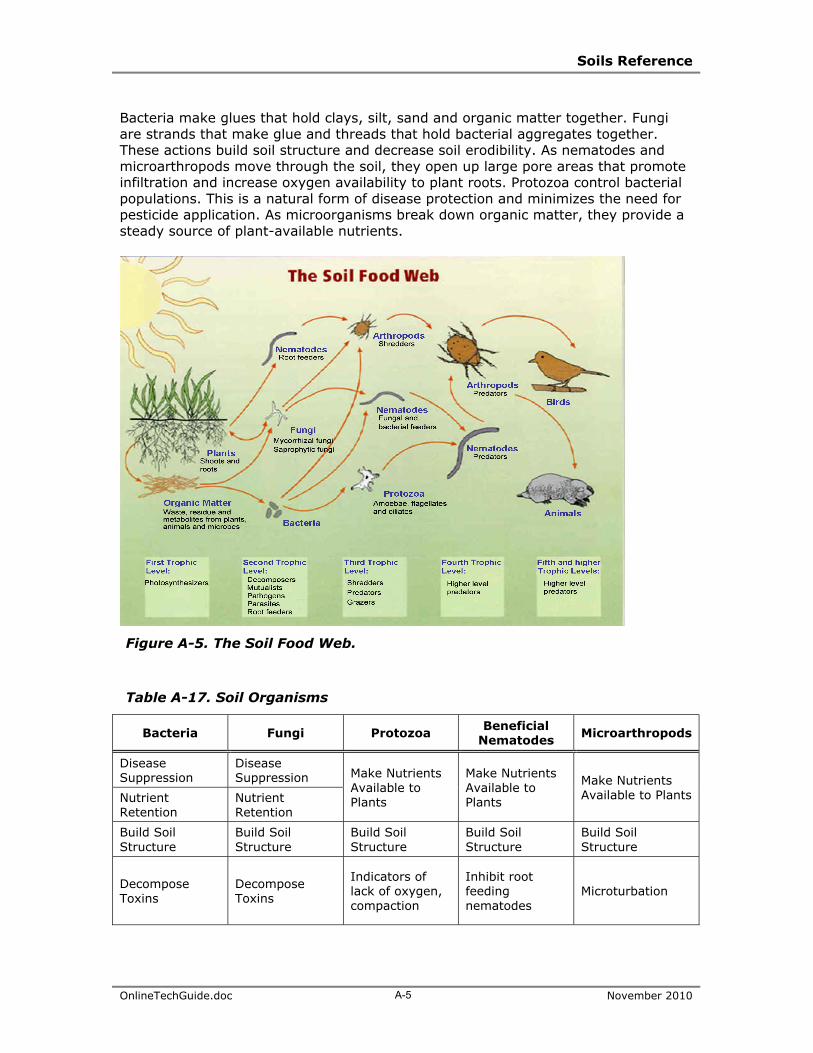
Bacteria make glues that hold clays, silt, sand and organic matter together. Fungi are strands that make glue and threads that hold bacterial aggregates together. These actions build soil structure and decrease soil erodibility. As nematodes and microarthropods move through the soil, they open up large pore areas that promote infiltration and increase oxygen availability to plant roots. Protozoa control bacterial populations. This is a natural form of disease protection and minimizes the need for pesticide application. As microorganisms break down organic matter, they provide a steady source of plant-available nutrients.
Figure A-5. The Soil Food Web.
Table A-17. Soil Organisms
Bacteria Fungi Protozoa Beneficial
Nematodes Microarthropods
Disease Suppression
Disease Suppression Make Nutrients
Available to Plants
Make Nutrients Available to Plants
Make Nutrients Available to Plants Nutrient
Retention Nutrient Retention
Build Soil Structure
Build Soil Structure
Build Soil Structure
Build Soil Structure
Build Soil Structure
Decompose Toxins
Decompose Toxins
Indicators of lack of oxygen, compaction
Inhibit root feeding nematodes
Microturbation

Appendix B
Appendix B Sample Problems
Sample Problems-Step 2
OnlineTechGuide.doc B-1 November 2010
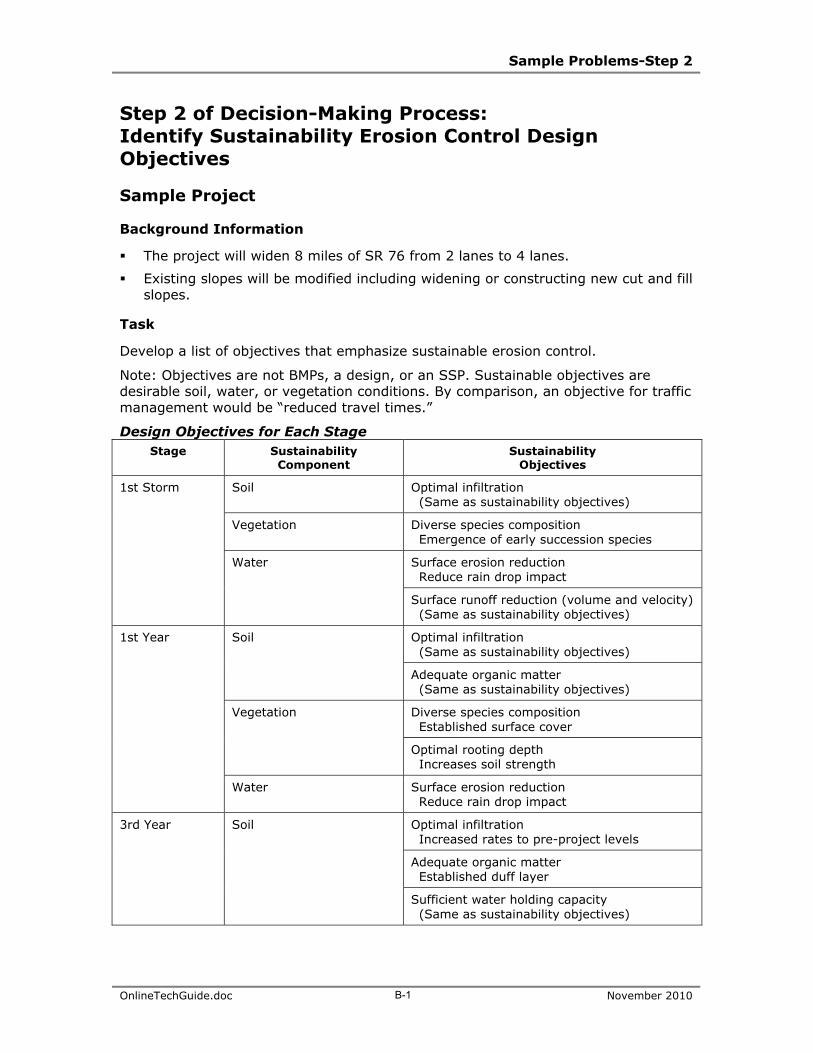
Step 2 of Decision-Making Process: Identify Sustainability Erosion Control Design Objectives
Sample Project
Background Information
The project will widen 8 miles of SR 76 from 2 lanes to 4 lanes.
Existing slopes will be modified including widening or constructing new cut and fill slopes.
Task
Develop a list of objectives that emphasize sustainable erosion control.
Note: Objectives are not BMPs, a design, or an SSP. Sustainable objectives are desirable soil, water, or vegetation conditions. By comparison, an objective for traffic management would be “reduced travel times.”
Design Objectives for Each Stage Stage Sustainability
Component Sustainability
Objectives
1st Storm Soil Optimal infiltration (Same as sustainability objectives)
Vegetation Diverse species composition Emergence of early succession species
Water Surface erosion reduction Reduce rain drop impact
Surface runoff reduction (volume and velocity) (Same as sustainability objectives)
1st Year Soil Optimal infiltration (Same as sustainability objectives)
Adequate organic matter (Same as sustainability objectives)
Vegetation Diverse species composition Established surface cover
Optimal rooting depth Increases soil strength
Water Surface erosion reduction Reduce rain drop impact
3rd Year Soil Optimal infiltration Increased rates to pre-project levels
Adequate organic matter Established duff layer
Sufficient water holding capacity (Same as sustainability objectives)
Sample Problems-Step 2
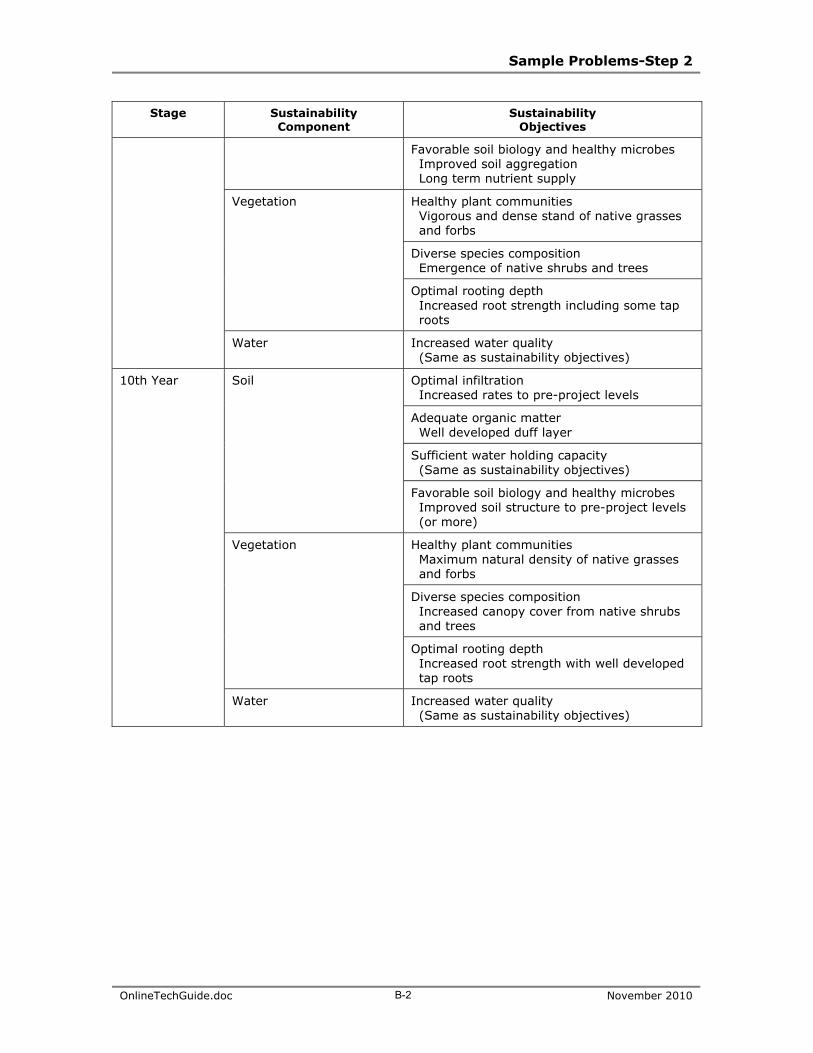
OnlineTechGuide.doc B-2 November 2010
Stage Sustainability Component
Sustainability Objectives
Favorable soil biology and healthy microbes Improved soil aggregation Long term nutrient supply
Vegetation Healthy plant communities Vigorous and dense stand of native grasses and forbs
Diverse species composition Emergence of native shrubs and trees
Optimal rooting depth Increased root strength including some tap roots
Water Increased water quality (Same as sustainability objectives)
10th Year Soil Optimal infiltration Increased rates to pre-project levels
Adequate organic matter Well developed duff layer
Sufficient water holding capacity (Same as sustainability objectives)
Favorable soil biology and healthy microbes Improved soil structure to pre-project levels (or more)
Vegetation Healthy plant communities Maximum natural density of native grasses and forbs
Diverse species composition Increased canopy cover from native shrubs and trees
Optimal rooting depth Increased root strength with well developed tap roots
Water Increased water quality (Same as sustainability objectives)

Sample Problems-Step 3
OnlineTechGuide.doc B-3 November 2010
Step 3 of Decision-Making Process: Collect Site-Specific Data – Step 3a: Desktop Study
Sample Project (SR 76)
1. Environmental Review (PEAR – Preliminary Environmental Analysis Report)
PEAR Environmental Studies Checklist (Rev. 11/08) Environmental Studies for PA&ED Checklist
Not
anticipated Memo to file
Report required
Risk* L M H
Comments
Land Use L Growth L Farmlands/Timberlands L Community Impacts L Community Character and Cohesion L Relocations L Environmental Justice L Utilities/Emergency Services L Visual/Aesthetics L Cultural Resources: L
Archaeological Survey Report L Historic Resources Evaluation Report L Historic Property Survey Report L Historic Resource Compliance Report L Section 106 / PRC 5024 & 5024.5 L Native American Coordination L Finding of Effect L Data Recovery Plan L Memorandum of Agreement L Other: L
Hydrology and Floodplain L Water Quality and Stormwater Runoff L Geology, Soils, Seismic and Topography L Paleontology L
PER L PMP L
Hazardous Waste/Materials: L ISA (Additional) L PSI L Other: L
Air Quality L Noise and Vibration L Energy and Climate Change L Biological Environment L
Natural Environment Study L Section 7: L
Formal L Informal L No effect L
Section 10: L USFWS Consultation L NMFS Consultation L
Species of Concern (CNPS, USFS, BLM, S, F)
L
Sample Problems-Step 3
OnlineTechGuide.doc B-4 November 2010
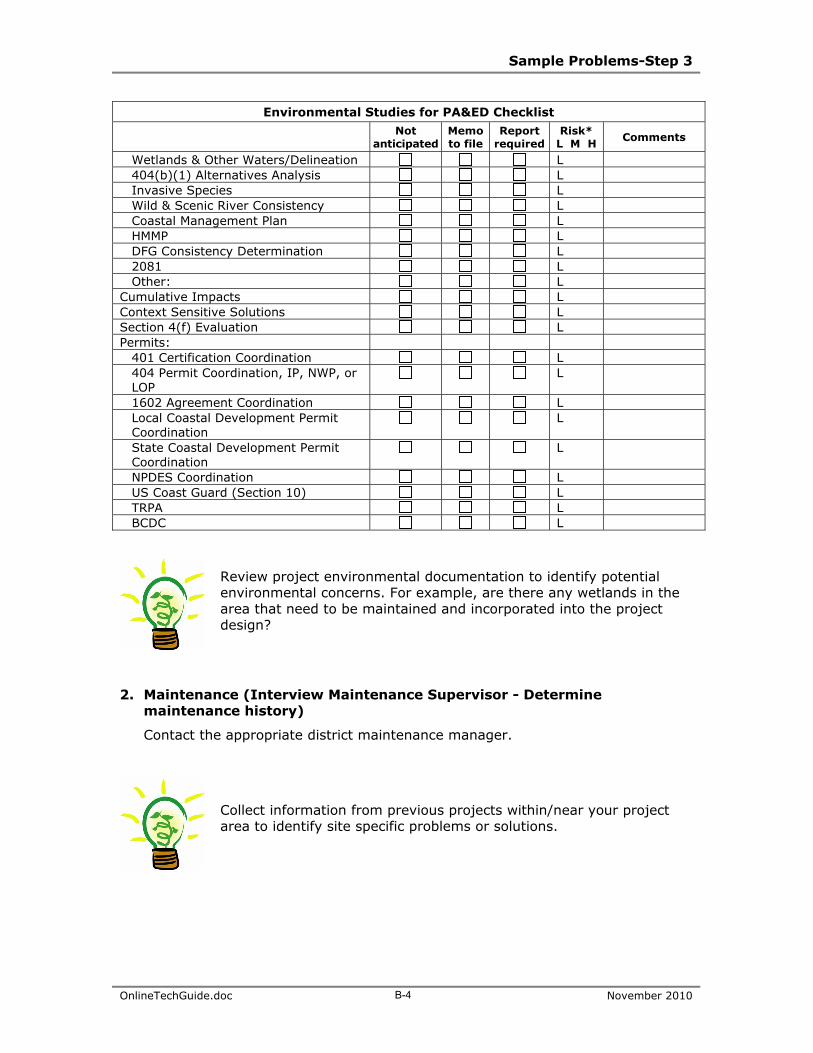
Environmental Studies for PA&ED Checklist
Not
anticipated Memo to file
Report required
Risk* L M H
Comments
Wetlands & Other Waters/Delineation L 404(b)(1) Alternatives Analysis L Invasive Species L Wild & Scenic River Consistency L Coastal Management Plan L HMMP L DFG Consistency Determination L 2081 L Other: L
Cumulative Impacts L Context Sensitive Solutions L Section 4(f) Evaluation L Permits:
401 Certification Coordination L 404 Permit Coordination, IP, NWP, or LOP
L
1602 Agreement Coordination L Local Coastal Development Permit Coordination
L
State Coastal Development Permit Coordination
L
NPDES Coordination L US Coast Guard (Section 10) L TRPA L BCDC L
Review project environmental documentation to identify potential environmental concerns. For example, are there any wetlands in the area that need to be maintained and incorporated into the project design?
2. Maintenance (Interview Maintenance Supervisor - Determine maintenance history)
Contact the appropriate district maintenance manager.
Collect information from previous projects within/near your project area to identify site specific problems or solutions.

Sample Problems-Step 3
OnlineTechGuide.doc B-5 November 2010
3. Geotechnical (Review Geotechnical Design Report)
During October 2003, pre-construction soil testing was performed at 4 borings near the proposed alignment. The following is a summary of existing soil conditions from ground surface to within 5 m of profile grade, and depth to groundwater.
Boring 1 (Station 288+66): surface elevation: 91.8 m MSL; native soils, sandy silt; groundwater not encountered at 85.8 m MSL.
Boring 2 (Station 290+42): surface elevation: 89.5 m MSL; native soils, silty sand to sandy silt; groundwater not encountered at 85.8 m MSL.
Boring 3 (Station 293+76): surface elevation: 82.0 m MSL; native soils, silty sand; groundwater encountered at 77.4 m MSL.
Boring 4 (Station 294+56): surface elevation: 82.5 m MSL; fill, lean clay; groundwater encountered at 76.0 m MSL.
Review Geotechnical data from the project area to identify site specific soil characteristics. For example, Boring 4 indicates the presence of fill material which may negate the soil characteristics as mapped by the NRCS (for that location).

Sample Problems-Step 3
OnlineTechGuide.doc B-6 November 2010
4. Topographic Map
Use topographic information to identify slope features (such as aspect and steepness) and understand flow paths/natural drainage patterns.
Sample Problems-Step 3
OnlineTechGuide.doc B-7 November 2010
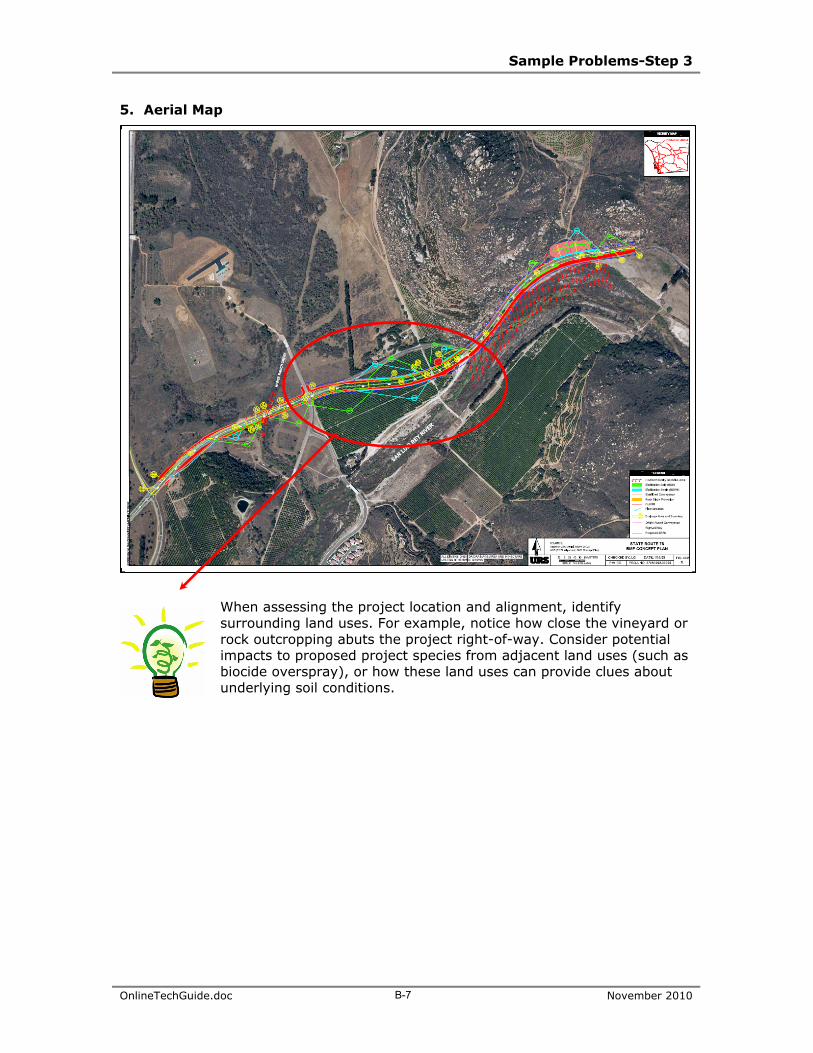
5. Aerial Map
When assessing the project location and alignment, identify surrounding land uses. For example, notice how close the vineyard or rock outcropping abuts the project right-of-way. Consider potential impacts to proposed project species from adjacent land uses (such as biocide overspray), or how these land uses can provide clues about underlying soil conditions.

Sample Problems-Step 3
OnlineTechGuide.doc B-8 November 2010
6. Geology Map
Use USGS Quad maps to understand the Geology of the area. Is your site on alluvial material or underlain by bedrock? Is there any Serpentine in the area? Relate the geologic information to the aerial map to get a better understanding of the site’s natural systems.

Sample Problems-Step 3
OnlineTechGuide.doc B-9 November 2010
7. Soils Map
Use the online soil survey to identify project area soil features (texture, water holding capacity, permeability, and RUSLE K factor).

Sample Problems-Step 3
OnlineTechGuide.doc B-10 November 2010
8. Annual Rainfall
From the County of San Diego Hydrology we know the 85th percentile precipitation is 0.8 inches. This is the rainfall amount that is used to design volume based water quality Best Management Practice
Use available climate data to identify precipitation extent, distribution and type. Wind data may also be useful when developing a project’s plant palette.

Sample Problems-Step 3
OnlineTechGuide.doc B-11 November 2010
9. Erosivity
See K factor of soils report or calculate with:
Use alternate resources to identify project area parameters when primary resources are not available.

Sample Problems-Step 3
OnlineTechGuide.doc B-12 November 2010
10. Vegetation
Use Transplant as a digital Reference Site to identify and design a successful plant palate for your project area.
11. Project History
Contact the appropriate district maintenance manager.
Collect information from previous projects within/near your project area to identify site specific problems or solutions.

Sample Problems-Step 4
OnlineTechGuide.doc B-13 November 2010
Step 4 of Decision-Making Process: RUSLE
Sample Project
The SR 76 project will be built in 3 steps. The first step will be the bare soil exposed to the elements without vegetation cover or physical practices, the second step will be the physical practices that will be incorporated to the site and the third step will be the establishment of vegetation upon conclusion of the project. Calculate the total amount of potential sediment that may come off this site for the three steps.
Remember that A (tons/acre/year) = RKLSCP
R You contacted NRCS and determined that your site has an R factor is 40.
K You looked up the K factor for the soil you have on the soils map within the Custom Soil Resource Report for soil type Cieneba and determined the K factor is 0.40.
LS You looked on the topography map and located your site and determined that the length of the slope to be 100 feet and the slope to be 50 percent. The LS table has the LS factor to be 9.13.
P The bare soil without any preparation would have a P factor of 1. If the soil is compacted the P factor can be >1 and if roughened up the P factor can be <1. The physical practices used will be the seed preparation for permanent vegetation which includes “loose with rough surface greater than 12 inches in depth” for a P factor to be 0.8.
C The bare soil would have a C factor of 1. This indicates there is no effect from vegetation. Upon completion of the project, the permanent vegetation will be seeded with a goal of 90 percent cover for a C factor to be 0.01.
The beginning first step calculation is:
A = 40 x 0.40 x 9.13 x 1 x 1 = 146.08 Tons/acre/year
The second step would include the physical practice of 0.8 in the calculation. The formula would be:
A = 40 x 0.40 x 9.13 x 1 x 0.8 = 116.86 Tons/acre/year
The third step would include the vegetation and physical factor the calculation. The formula would then be:
A = 40 x 0.40 x 9.13 x 0.01 x 0.8 = 1.17 Tons/acre/year
The physical practices will decrease the potential erosion. However, a good stand of vegetation will really decrease the erosion potential.
EC Question: What would happen if we cut the slope length in half and temporarily used field bromegrass before the permanent vegetation is established?
A = 40 x 0.40 x 5.16 x 0.03 x 0.8 = 1.98 Tons/acre/year

Sample Problems-Step 5
OnlineTechGuide.doc B-14 November 2010
Step 5 of Decision-Making Process: Evaluate and Select BMPs
Sample Project (SR 76)
Task
On the project to widen 8 miles of SR 76 from 2 lanes to 4 lanes, evaluate and select BMPs for an erosion control strategy for the cut and fill slope on shown on the figure.
Your selections should meet the objectives you listed in Step 2 – Identify Sustainability Objectives.
Your selections should be based on the data you collected in Step 3 – Collect Site-Specific Data.
Keep in mind the information you already have in relation to:
— WATER
Rainfall data, site history, erosivity.
— SOIL
Geotechnical data, soil map and associated data, site history, erosivity.
— VEGETATION
Manual of California Vegetation, site history.
Choose from the following BMPs, SSPs and Activities:
Runoff Control
Earthwork Erosion Control
TRMs Property Preservation/ Temporary Fence
Sequencing Netting
Clearing and Grubbing Mulch Blanket
Chip and Stockpile Material/Duff Compost Blanket Fiber Rolls
Remove and Stockpile Topsoil/Local Topsoil
Compost (Incorporate)
Compost Sock
Slope Rounding/Stepped Slopes Punched Straw Drill Seed
Place Topsoil/Local Topsoil Hydroseed Willow Cuttings
Roughen Slopes Polymer Stabilized Fiber Matrix
Seeding
Place Duff/Duff Bonded Fiber Matrix Liner
Jute Mesh Seedling
What other things would you do as part of your design?
Use a reference site for plant species.

Sample Problems-Step 5
OnlineTechGuide.doc B-15 November 2010
Sample Problems-Step 6
OnlineTechGuide.doc B-16 November 2010
Step 6 of Decision-Making Process: Evaluate and Select Sustainable Vegetation
Sample Project (SR 76)
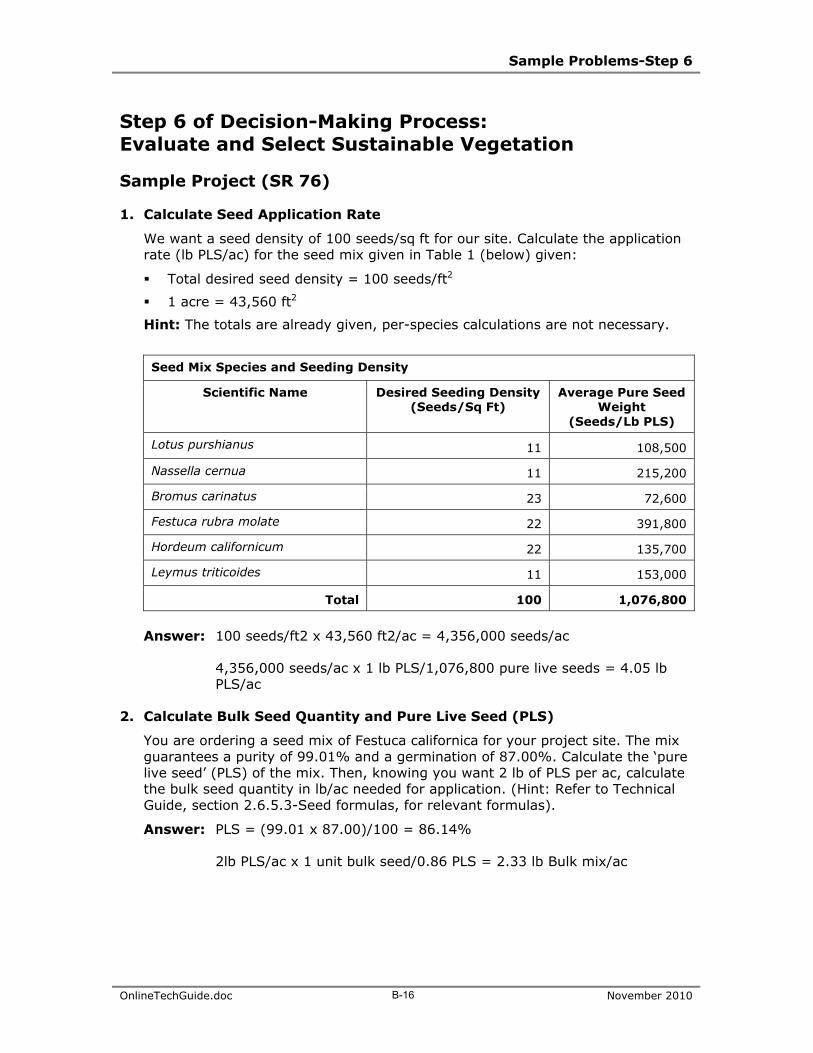
1. Calculate Seed Application Rate
We want a seed density of 100 seeds/sq ft for our site. Calculate the application rate (lb PLS/ac) for the seed mix given in Table 1 (below) given:
Total desired seed density = 100 seeds/ft2
1 acre = 43,560 ft2
Hint: The totals are already given, per-species calculations are not necessary.
Seed Mix Species and Seeding Density
Scientific Name Desired Seeding Density (Seeds/Sq Ft)
Average Pure Seed Weight
(Seeds/Lb PLS)
Lotus purshianus 11 108,500
Nassella cernua 11 215,200
Bromus carinatus 23 72,600
Festuca rubra molate 22 391,800
Hordeum californicum 22 135,700
Leymus triticoides 11 153,000
Total 100 1,076,800
Answer: 100 seeds/ft2 x 43,560 ft2/ac = 4,356,000 seeds/ac
4,356,000 seeds/ac x 1 lb PLS/1,076,800 pure live seeds = 4.05 lb PLS/ac
2. Calculate Bulk Seed Quantity and Pure Live Seed (PLS)
You are ordering a seed mix of Festuca californica for your project site. The mix guarantees a purity of 99.01% and a germination of 87.00%. Calculate the ‘pure live seed’ (PLS) of the mix. Then, knowing you want 2 lb of PLS per ac, calculate the bulk seed quantity in lb/ac needed for application. (Hint: Refer to Technical Guide, section 2.6.5.3-Seed formulas, for relevant formulas).
Answer: PLS = (99.01 x 87.00)/100 = 86.14%
2lb PLS/ac x 1 unit bulk seed/0.86 PLS = 2.33 lb Bulk mix/ac
Sample Problems-Step 6
OnlineTechGuide.doc B-17 November 2010
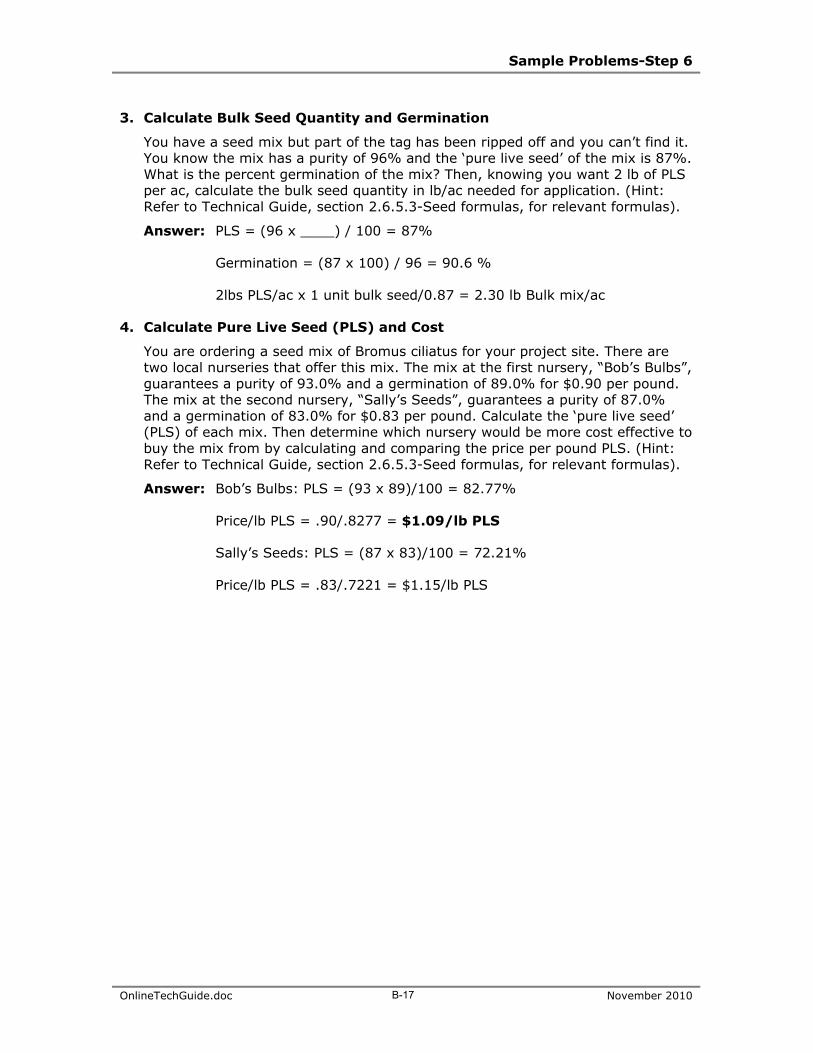
3. Calculate Bulk Seed Quantity and Germination
You have a seed mix but part of the tag has been ripped off and you can’t find it. You know the mix has a purity of 96% and the ‘pure live seed’ of the mix is 87%. What is the percent germination of the mix? Then, knowing you want 2 lb of PLS per ac, calculate the bulk seed quantity in lb/ac needed for application. (Hint: Refer to Technical Guide, section 2.6.5.3-Seed formulas, for relevant formulas).
Answer: PLS = (96 x ____) / 100 = 87%
Germination = (87 x 100) / 96 = 90.6 %
2lbs PLS/ac x 1 unit bulk seed/0.87 = 2.30 lb Bulk mix/ac
4. Calculate Pure Live Seed (PLS) and Cost
You are ordering a seed mix of Bromus ciliatus for your project site. There are two local nurseries that offer this mix. The mix at the first nursery, “Bob’s Bulbs”, guarantees a purity of 93.0% and a germination of 89.0% for $0.90 per pound. The mix at the second nursery, “Sally’s Seeds”, guarantees a purity of 87.0% and a germination of 83.0% for $0.83 per pound. Calculate the ‘pure live seed’ (PLS) of each mix. Then determine which nursery would be more cost effective to buy the mix from by calculating and comparing the price per pound PLS. (Hint: Refer to Technical Guide, section 2.6.5.3-Seed formulas, for relevant formulas).
Answer: Bob’s Bulbs: PLS = (93 x 89)/100 = 82.77%
Price/lb PLS = .90/.8277 = $1.09/lb PLS
Sally’s Seeds: PLS = (87 x 83)/100 = 72.21%
Price/lb PLS = .83/.7221 = $1.15/lb PLS