erp appendixes my 1949 4
TRANSCRIPT
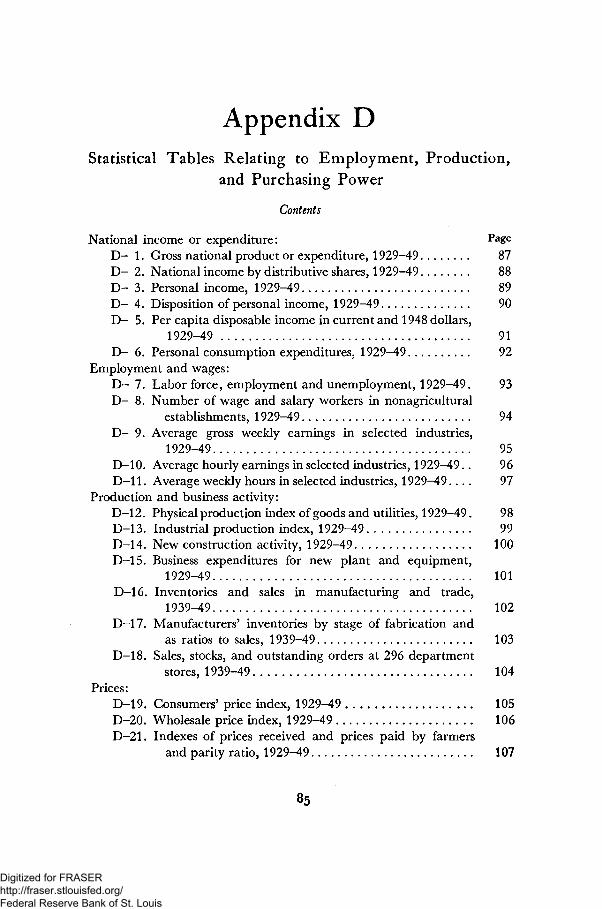
Appendix DStatistical Tables Relating to Employment, Production,
and Purchasing Power
Contents
National income or expenditure: P ag e
D - 1. Gross national product or expenditure, 1929-49 87D - 2. National income by distributive shares, 1929-49 88D - 3. Personal income, 1929-49 89D - 4. Disposition of personal income, 1929-49 90D - 5. Per capita disposable income in current and 1948 dollars,
1929-49 91D - 6. Personal consumption expenditures, 1929-49 92
Employment and wages:D - 7. Labor force, employment and unemployment, 1929-49. 93D - 8. Number of wage and salary workers in nonagricultural
establishments, 1929-49 94D - 9. Average gross weekly earnings in selected industries,
1929-49 95D-10. Average hourly earnings in selected industries, 1929-49. . 96D - l l . Average weekly hours in selected industries, 1929-49. . . . 97
Production and business activity:D-12. Physical production index of goods and utilities, 1929-49. 98D-13. Industrial production index, 1929-49 99D-14. New construction activity, 1929-49 100D-15. Business expenditures for new plant and equipment,
1929-49 101D-16. Inventories and sales in manufacturing and trade,
1939-49 102D-17. Manufacturers' inventories by stage of fabrication and
as ratios to sales, 1939-49 103D-18. Sales, stocks, and outstanding orders at 296 department
stores, 1939-49 104Prices:
D-19. Consumers' price index, 1929-49 105D-20. Wholesale price index, 1929-49 106D-21. Indexes of prices received and prices paid by farmers
and parity ratio, 1929-49 107
Digitized for FRASER http://fraser.stlouisfed.org/ Federal Reserve Bank of St. Louis

Money, banking, and credit: PageD-22. Consumer credit outstanding, 1929-49 108D-23. Loans and investments of all commercial banks and
weekly reporting member banks, 1929-49 109D-24. Adjusted deposits of all banks and currency outside
banks, 1929-49 110D-25. Estimated ownership of Federal securities, 1939-49. . . . I l lD-26. Bond yields and interest rates, selected years, 1929-49. . 112
Corporate profits and finance:D-27. Profits before and after taxes, all private corporations,
1929-49 113D-28. Sales and profits of large manufacturing corporations,
1939-49 114D-29. Relation of profits before and after taxes to investment,
private manufacturing corporations, by industrygroups, 1947-49 115
D-30. Relation of profits before and after taxes to sales, privatemanufacturing corporations, by industry groups,1947-49 116
D-31. Relation of profits before and after taxes to investmentand to sales, all private manufacturing corporations,by size classes, 1947-49 117
D-32. Sources and uses of corporate funds, 1947-49 117International transactions:
D-33. The international transactions of the United States,1946-49 118
D—34. United States Government aid to foreign countries,1946-49 119
D-35. United States merchandise exports, including reexports,by areas, 1936-38 quarterly average, and 1947-49.. 120
D-36. United States domestic merchandise exports, by economicclasses, 1936-38 quarterly average, and 1947-49. . . . 121
D-37. Indexes of quantity and unit value of United States do-mestic merchandise exports, by economic classes, 1936-38 quarterly average, and 1947-49 122
D-38. United States general merchandise imports, by areas,1936-38 quarterly average, and 1947-49 123
D-39. United States merchandise imports for consumption, byeconomic classes, 1936-38 quarterly average, and1*947-49. . . . . . . . . . . ; . . . . . . . . . 124
D-40. Indexes of quantity and unit value of United States mer-chandise imports for consumption, by economic classes,1936-38 quarterly average, and 1947-49 125
Summary:D-41. Changes in selected economic series since 1939 and 1948. 125
86
Digitized for FRASER http://fraser.stlouisfed.org/ Federal Reserve Bank of St. Louis
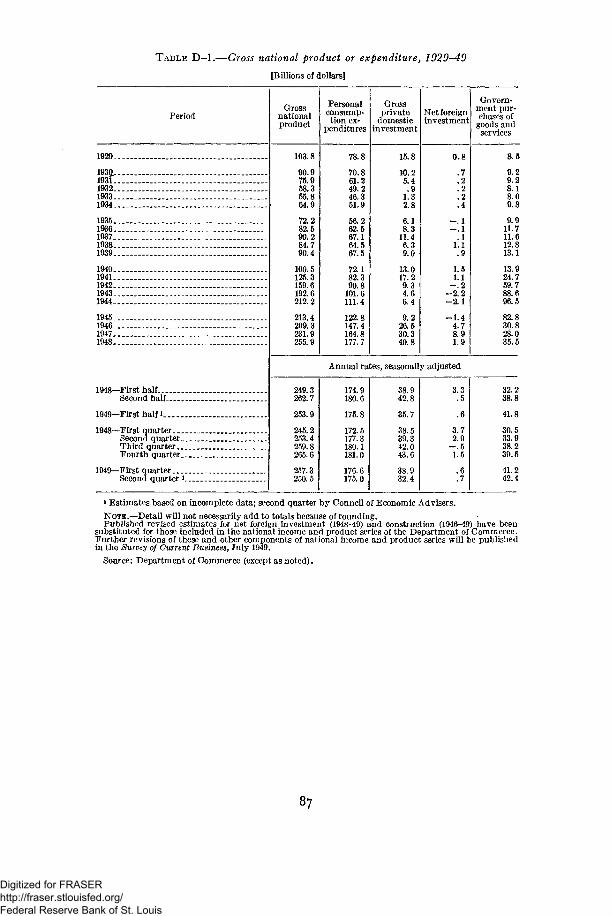
TABLE D—1.—Gross national product or expenditure, 1929—49
[Billions of dollars]
Period
1929.
1930-1931.1932.1933.1934.
1935.1936.1937.1938.1939.
1940.1941-1942.1943.1944.
1945.1946.1947.1948.
1948—First half.Second half
1949—First half i
1948—First quarter..Second quarterThird quarter.Fourth quarter
1949—First quarterSecond quarter
Grossnationalproduct
103.8
90.975.958.355.864.9
72.282.590.284.790.4
100.5125.3159.6192.6212.2
213.4209.3231.9255.9
Personalconsump-tion ex-
penditures
249.3262.7
253.9
245.2253.4259.8265.6
257.3250.5
78.8
70.861.249.246.351.9
56.262.567.164.567.5
72.182.390.8
101.6111.4
122.8147.4164.8177.7
Grossprivate
domesticinvestment
15.8
10.25.4.9
1.32.8
6.18.3
11.46.39.0
13.017.29.34.66.4
9.226.530.340.8
Net foreigninvestment
0.8
.7
.2
.2
.2
.4
- . 1- . 1
.11.1
1.51.1
- . 2- 2 . 2- 2 . 1
-1 .44.78.91.9
Govern-ment pur-chases of
goods andservices
Annual rates, seasonally adjusted
174.9180.6
175.8
172.5177.3180.1181.0
176.6175.0
42.8
35.7
38.539.342.043.6
38.932.4
3.3.5
3.72.9
- . 51.5
.7
8.5
9.29.28.18.09.8
9.911.711.612.813.1
13.924.759.788.696.5
82.830.828.035.5
32.238.8
41.8
30.5
38.239.5
41.242.4
i Estimates based on incomplete data; second quarter by Council of Economic Advisers.
NOTE.—Detail will not necessarily add to totals because of rounding.Published revised estimates for net foreign investment (1948-49) and construction (1946-49) have been
substituted for those included in the national income and product series of the Department of Commerce.Further revisions of these and other components of national income and product series will be publishedin the Survey of Current Business, July 1949.
Source: Department of Commerce (except as noted).
Digitized for FRASER http://fraser.stlouisfed.org/ Federal Reserve Bank of St. Louis
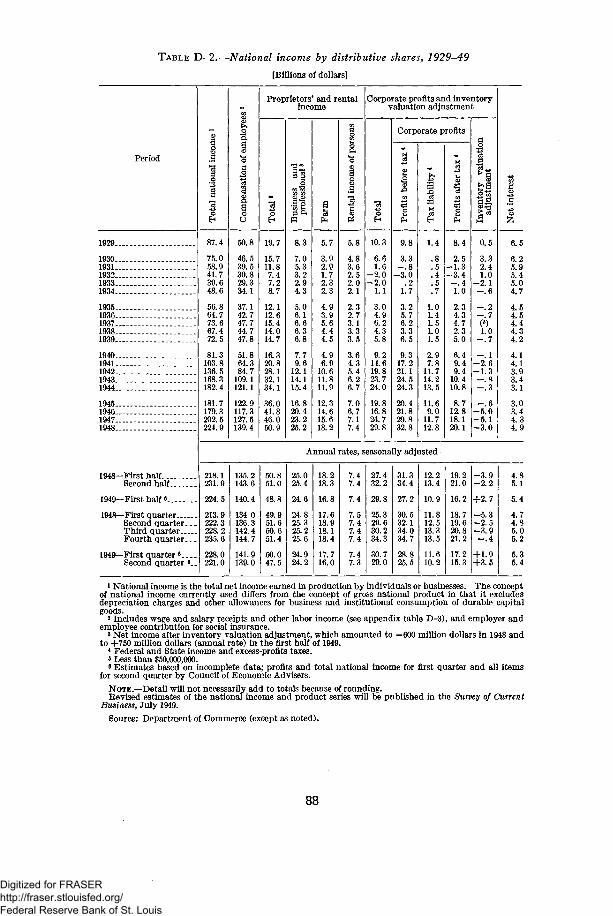
TABLE D-2.—National income by distributive shares, 1929-49
[Billions of dollars]
Period
a
Proprietors' and rentalincome
Corporate profits and inventoryvaluation adjustment
Corporate profits
1929.
1930.1931.1932.1933.1934.
1935.1936.1937.1938.1939.
1940.1941.1942.1943.1944.
1945.1946.1947.1948.
1948—First half
Second half
1949—First half •
1948—First quarterSecond quarter . . .Third quarterFourth quarter . . .
L949—First quarter«. . .Second quarter «_
87.4
75.058.941.739.648.6
56.864.773.667.472.5
81.3103.8136. 5168.3182.4
181.7179.3202.5224.9
50.8
46.539.530.829.334.1
37.142.747.744.747.8
51.864.384.7
109.1121.1
122.9117.3127.5139.4
19.7
15.711.87.47.28.7
12.112.615.414.014.7
16.320.828.132.134.1
36.041.846.050.9
8.3
7.05.33.22.94.3
5.06.16.66.36.8
7.79.6
12.114.115.4
16.820.423.225.2
5.7
3.92.91.72.32.3
4.93.95.64.44.5
4.96.9
10.611.811.9
12.314.615.618.2
5.8
4.83.62.52.02.1
2.32.73.13.33.5
3.64.35.46.26.7
7.06.77.17.4
10.3
6.61.6
-2 .0-2 .0
1.1
3.04.96.24.35.8
9.214.619.823.724.0
19.816.824.729.8
3.3- . 8
-3 .0.2
1.7
3.25.76.23.36.5
9.317.221.124.524.3
20.421.829.832.8
1.4
.5
.4
.5
.7
04505
2.97.8
11.714.213.5
11.69.0
11.712.8
8.4
2.5- 1 . 3-3 .4- . 41.0
2.34.34.72.35.0
6.49.49.4
10.410.8
8.712.818.120.1
0.5
3.32.41.0
- 2 . 1
- . 2- . 7(5)1.0
- . 7
- . 1-2.6-1.3- . 8- . 3
-5.0-5.1-3.0
Annual rates, seasonally adjusted
218.1231.9
224.5
213.9222.3228.2235.6
228.0221.0
135.2143.6
140.4
134.0136.3142.4144.7
141.9139.0
50.851.0
48.8
49.951.650.651.4
50.047.5
25.025.4
24.6
24.825.325.225.6
24.924.2
18.218.3
16.8
17.618.918.118.4
17.716.0
7.47.4
7.4
7.57.47.47.4
7.47.3
27.432.2
29.8
25.329.630.234.3
30.729.0
31.334.4
27.2
30.532.134.034.7
28.825.5
12.213.4
10.9
11.812.513.313.5
11.610.2
19.221.0
16.2
18.719.620.821.2
17.215.3
- 3 . 9- 2 . 2
+2.7
—5.3- 2 . 5- 3 . 9- . 4
+1.9+3.5
6.5
6.25.95.45.04.7
4.54.54.44.34.2
4.14.13.93.43.1
3.03.44.34.9
4.85.1
5.4
4.74.85.05.2
5.35.4
1 National income is the total net income earned in production by individuals or businesses. The conceptof national income currently used differs from the concept of gross national product in that it excludesdepreciation charges and other allowances for business and institutional consumption of durable capitalgoods.
2 Includes wage and salary receipts and other labor income (see appendix table D-3), and employer andemployee contribution for social insurance.
3 Net income after inventory valuation adjustment, which amounted to —600 million dollars in 1948 andto +750 million dollars (annual rate) in the first half of 1949.
4 Federal and State income and excess-profits taxes.« Less than $50,000,000.• Estimates based on incomplete data; profits and total national income for first quarter and all items
for second quarter by Council of Economic Advisers.
NOTE.—Detail will not necessarily add to totals because of rounding.Revised estimates of the national income and product series will be published in the Survey of Current
Business, July 1949.
Source: Department of Commerce (except as noted).
88
Digitized for FRASER http://fraser.stlouisfed.org/ Federal Reserve Bank of St. Louis
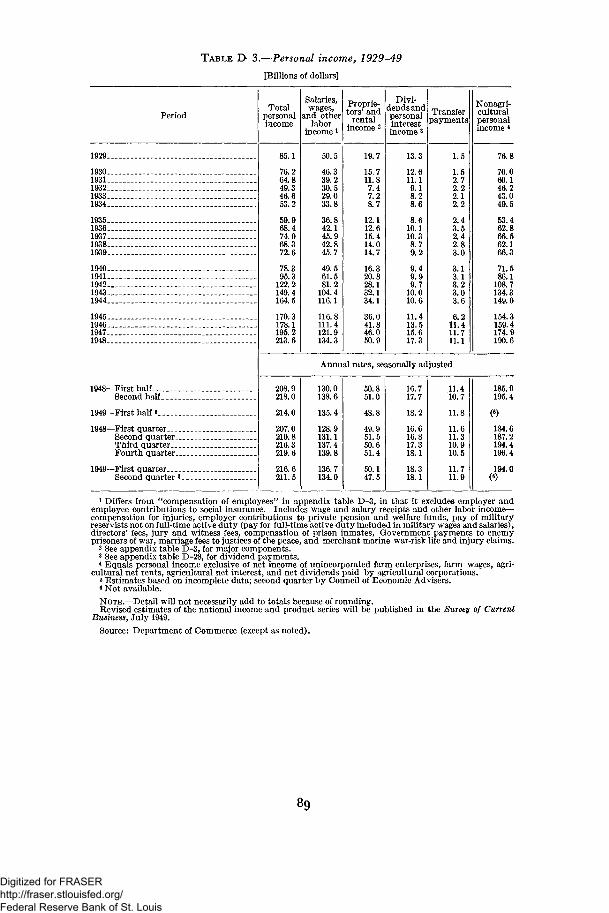
TABLE D-3.—Personal income, 1929-49[Billions of dollars]
PeriodTotal
personalincome
85.1
76.264.849.346.653.2
59.968.474.068.372.6
78.395.3
122.2149.4164.5
170.3178.1195.2213.6
Salaries,wages,
and otherlabor
income !
50.5
46.339.230.529.033.8
36.842.145.942.845.7
49.561.581.2
104.4116.1
116.8111.4121.9134.3
Proprie-tors' and
rentalincome 2
19.7
15.711.8
7.47.28.7
12.112.615.414.014.7
16.320.828.132.134.1
36.041.846.050.9
Divi-dends andpersonalinterestincome 3
13.3
12.611.19.18.28.6
8.610.110.38.79.2
9.49.99.7
10.010.6
11.413.515.617.3
Transferpayments
1.5
1.52.72.22.12.2
2.43.52.42.83.0
3.13.13.23.03.6
6.211.411.711.1
Nonagri-culturalpersonalincome 4
1929.
1930.1931.19321933.1934
1935.1936193719381939
1940.19411942.19431944
194519461947.1948.
1948—First halfSecond half
1949—First half s
1948—First quarterSecond quarterThird quarter..Fourth quarter
1949—First quarterSecond quarter
76.8
70.060.146.243.049.5
53.462.866.562.166.3
71.586.1
108.7134.3149.0
154.3159.4174.9190.6
Annual rates, seasonally adjusted
208.9218.0
214.0
207.0210.8216.3219.6
216.6211.5
130.0138.6
135.4
128.9131.1137.4139.8
136.7134.0
50.851.0
48.8
49.951.550.651.4
50.147.5
16.717.7
18.2
16.616.817.318.1
18.318.1
11.410.7
11.8
11.611.310.910.5
11.711.9
185.9195.4
184.6187.2194.4196.4
194.0()
1 Differs from "compensation of employees" in appendix table D-3, in that it excludes employer andemployee contributions to social insurance. Includes wage and salary receipts and other labor income-compensation for injuries, employer contributions to private pension and welfare funds, pay of militaryreservists not on full-time active duty (pay for full-time active duty included in military wages and salaries),directors' fees, jury and witness fees, compensation of prison inmates, Government payments to enemyprisoners of war, marriage fees to justices of the peace, and merchant marine war-risk life and injury claims.
2 See appendix table D-3, for major components.3 See appendix table D-28, for dividend payments.4 Equals personal income exclusive of net income of unincorporated farm enterprises, farm wages, agri-
cultural net rents, agricultural net interest, and net dividends paid by agricultural corporations.s Estimates based on incomplete data; second quarter by Council of Economic Advisers.• Not available.
NOTE.—Detail will not necessarily add to totals because of rounding.Revised estimates of the national income and product series will be published in the Survey of Current
Business, July 1949.
Source: Department of Commerce (except as noted).
Digitized for FRASER http://fraser.stlouisfed.org/ Federal Reserve Bank of St. Louis
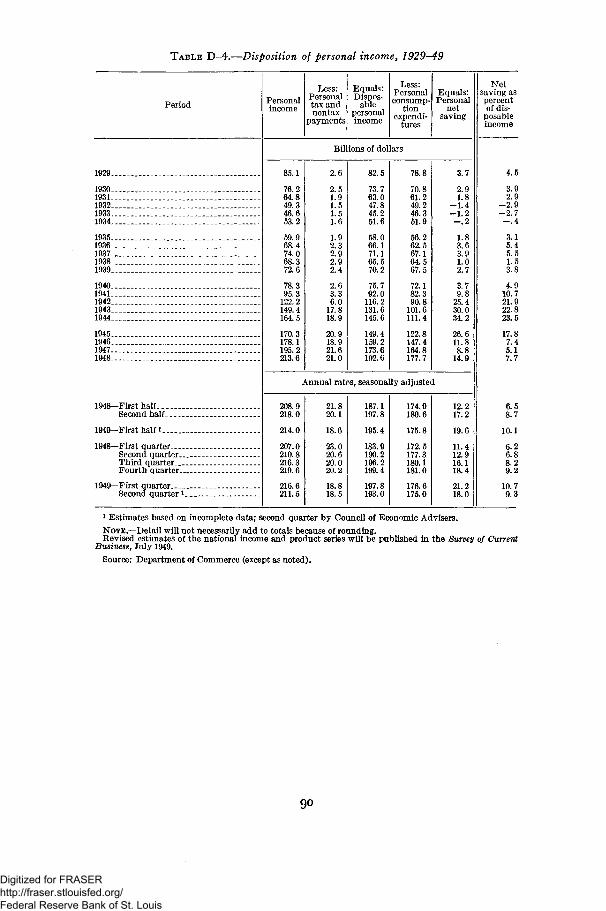
TABLE D-4.—Disposition of personal income, 1929-49
Period Personalincome
Less:Personaltax andnontax
payments
Equals:Dispos-
ablepersonalincome
Less:Personalconsump-
tion Iexpendi-
tures
Equals:Personal
netsaving
Netsaving aspercentof dis-
posableincome
Billions of dollars
1929
19301931 _ _ _193219331934
1935193619371938 __„.1939
19401941 ._.194219431944
1945. _ _194619471948
85.1
76.264.849.346.653.2
59.968.474.068.372.6
78.395.3122.2149.4164.5
170.3178.1195.2213.6
2.6
2.51.91.51.51.6
1.92.32.92.92.4
2.63.36.017.818.9
20.918.921.621.0
82.5
73.763.047.845.251.6
58.066.171.165.570.2
75.792.0116.2131.6145.6
149.4159.2173.6192.6
78.8
70.861.249.246.351.9
56.262.567.164.567.5
72.182.390.8101.6111.4
122.8147.4164.8177.7
Annual rates, seasonally adjusted
1948—First halfSecond half
1949—First half i
1948—First quarterSecond quarter-Third quarter...Fourth quarter. .
1949—First quarterSecond quarter V
208.9218.0
214.0
207.0210.8216.3219.6
216.6211.5
21.820.1
18.6
23.020.620.020.2
18.818.5
187.1197.8
195.4
183.9190.2196.2199.4
197.8193.0
174.9180.6
175.8
172.5177.3180.1181.0
176.6175.0
3.7
2.91.8
- 1 . 4-1 .2- . 2
1.83.63.91.02.7
3.79.8
25.430.034.2
26.611.88.8
14.9
12.217.2
19.6
11.412.916.118.4
21.218.0
4.5
3.92.9
- 2 . 9- 2 . 7- . 4
3.15.45.51.53.8
4.910.721.922.823.5
17.87.45.17.7
6.5
8.7
10.1
6.26.88.29.2
10.79.3
1 Estimates based on incomplete data; second quarter by Council of Economic Advisers.
NOTE.—Detail will not necessarily add to totals because of rounding.Revised estimates of the national income and product series will be published in the Survey of Current
Business, July 1949.
Source: Department of Commerce (except as noted).
Digitized for FRASER http://fraser.stlouisfed.org/ Federal Reserve Bank of St. Louis
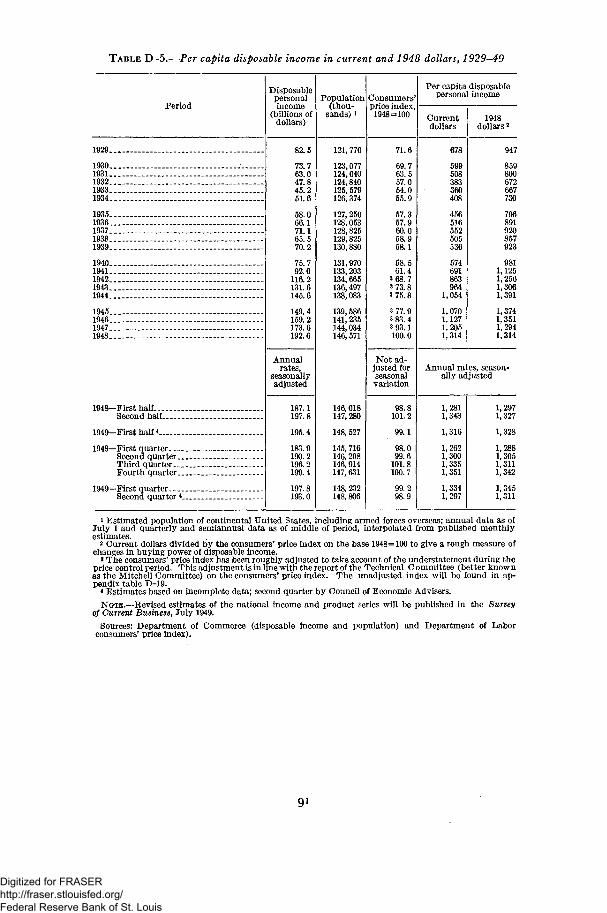
TABLE D-5.—Per capita disposable income in current and 1948 dollars, 1929-49
Period
1929.
1930.1931.1932.1933.1934.
1935.1936.1937.1938.1939.
1940.1941.1942.1943.1944.
1945.1946.1947.1948.
1948—First halfSecond half
1949— First half *
1948—First quarterSecond quarter..Third quarter. _.Fourth quarter..
1949—First quarterSecond quarter *.
Disposablepersonalincome
(billions ofdollars)
82.5
73.763.047.845.251.6
58.066.171.165.570.2
75.792.0
116.2131.6145.6
149.4159.2173.6192.6
Annualrates,
seasonallyadjusted
187.1197.8
195.4
183.9190.2196.2199.4
197.8193.0
Population(thou-
sands) *
121,770
123,077124,040124,840125,579126,374
127, 250128,053128,825129,825130,880
131,970133,203134,665136,497138,083
139,586141, 235144,034146,571
146,018147,280
148, 527
145, 716146, 298146,914147, 631
148, 232148,806
Consumers'price index,1948=100
71.6
69.763.557.054.055.9
57.357.960.058.958.1
58.561.4
3 68.73 73.83 75.8
3 77.93 83.43 93.1100.0
Not ad-justed forseasonalvariation
98.8101.2
99.1
98.099.6
101.8100.7
99.2
Per capita disposablepersonal income
Currentdollars
678
599508383360
456516552505536
574691863964
1,054
1,0701,1271,2051,314
1948dollars2
947
859800672667730
796891920857923
9811,1251,2561,3061,391
1,3741,3511,2941,314
Annual rates, season-ally adjusted
1,2811,343
1,316
1,2621,3001,3351,351
1,3341,297
1,2971,327
1,328
1,2881,3051,3111,342
1,3451,311
1 Estimated population of continental United States, including armed forces overseas; annual data as ofJuly 1 and quarterly and semiannual data as of middle of period, interpolated from published monthlyestimates.
2 Current dollars divided by the consumers' price index on the base 1948=100 to give a rough measure ofchanges in buying power of disposable income.
3 The consumers' price index has been roughly adjusted to take account of the understatement during theprice control period. This adjustment is in line with the report of the Technical C ommittee (better knownas the Mitchell Committee) on the consumers' price index. The unadjusted index will be found in ap-pendix table D-19.
* Estimates based on incomplete data; second quarter by Council of Economic Advisers.
NOTE.—Revised estimates of the national income and product series will be published in the Surveyof Current Business, July 1949.
Sources: Department of Commerce (disposable income and population) and Department of Laborconsumers' price index).
Digitized for FRASER http://fraser.stlouisfed.org/ Federal Reserve Bank of St. Louis
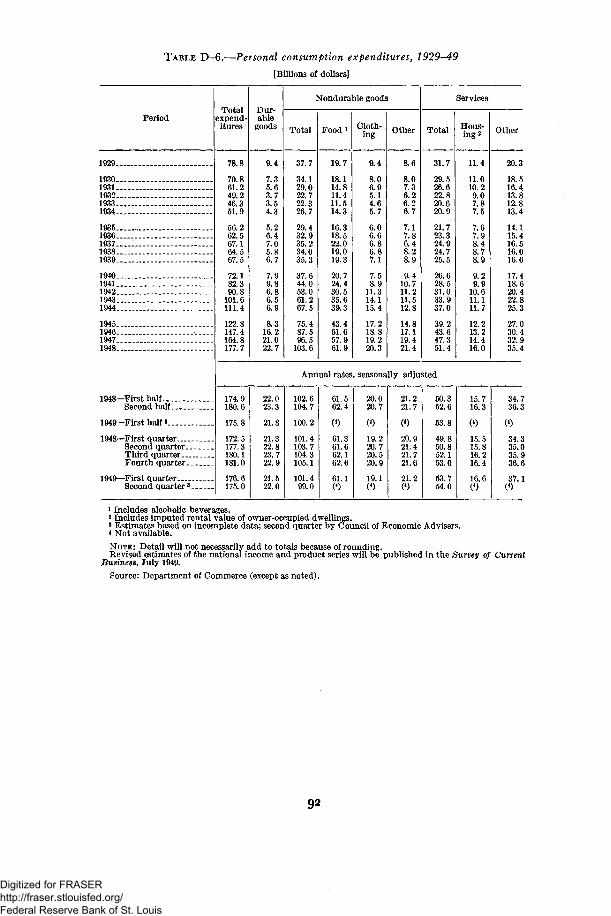
TABLE D-6.—Personal consumption expenditures, 1929-49
[Billions of dollars]
PeriodTotal
expend-itures
Dur-able
goods
Nondurable goods
Total Food i Cloth-ing Other
Services
Total Hous-ing 2 Other
1929.
1930.1931.1932.1933.1934.
1935.1936.1937.1938.1939.
1940.1941.1942.1943.1944.
1945.1946.1947.1948.
1948—First half....Second half .
1949—First half 3_.
1948—First quarter....Second quarter..Third quarter. _.Fourth quarter .
1949—First quarterSecond quarter3
78.8
70.861.249.246.351.9
56.262.567.164.567.5
72.182.390.8
101.6111.4
122.8147.4164.8177.7
9.4
7.35.63.73.54.3
5.26.47.05.86.7
7.99.86.86.56.9
8.316.221.022.7
37.7
34.129.022.722.326.7
29.432.935.234.035.3
37.644.053.061.267.5
75.487.596.5
103.6
19.7
18.114.811.411.514.3
16.318.522.019.019.3
20.724.430.535.639.3
43.451.657.961.9
9.4
8.06.95.14.65.7
6.06.66.86.87.1
7.58.9
11.314.115.4
17.218.819.220.3
8.6
8.07.36.26.26.7
7.17.86.48.28.9
9.410.711.211.512.8
14.817.119.421.4
31.7
29.526.622.820.620.9
21.723.324.924.725.5
26.628.531.033.937.0
39.243.647.351.4
Annual rates, seasonally adjusted
11.4
11.010.29.07.87.5
7.67.98.48.78.9
9.29.9
10.611.111.7
12.213.214.416.0
174.9180.6
175.8
172.5177.3180.1181.0
176.6175.0
22.023.3
21.8
21.322.823.722.9
21.522.0
102.6104.7
100.2
101.4103.7104.3105.1
101.499.0
61.562.4
(4)
61.361.662.162.6
61.1(4)
20.020.7
(4)
19.220.720.520.9
19.1(4)
21.221.7
(4)
20.921.421.721.6
21.2(4)
50.352.6
53.8
49.850.852.153.0
53.754.0
15.716.3
(4)
15.515.816.216.4
16.6(4)
20.3
18.516.413.812.813.4
14.115.416.516.016.6
17.418.620.422.825.3
27.030.432.935.4
34.736.3
34.335.035.936.6
37.1(4)
1 Includes alcoholic beverages.2 Includes imputed rental value of owner-occupied dwellings.3 Estimates based on incomplete data; second quarter by Council of Economic Advisers.* Not available.
NOTE: Detail will not necessarily add to totals because of rounding.Revised estimates of the national income and product series will be published in the Survey of Current
Business, July 1949.
Source: Department of Commerce (except as noted).
Digitized for FRASER http://fraser.stlouisfed.org/ Federal Reserve Bank of St. Louis
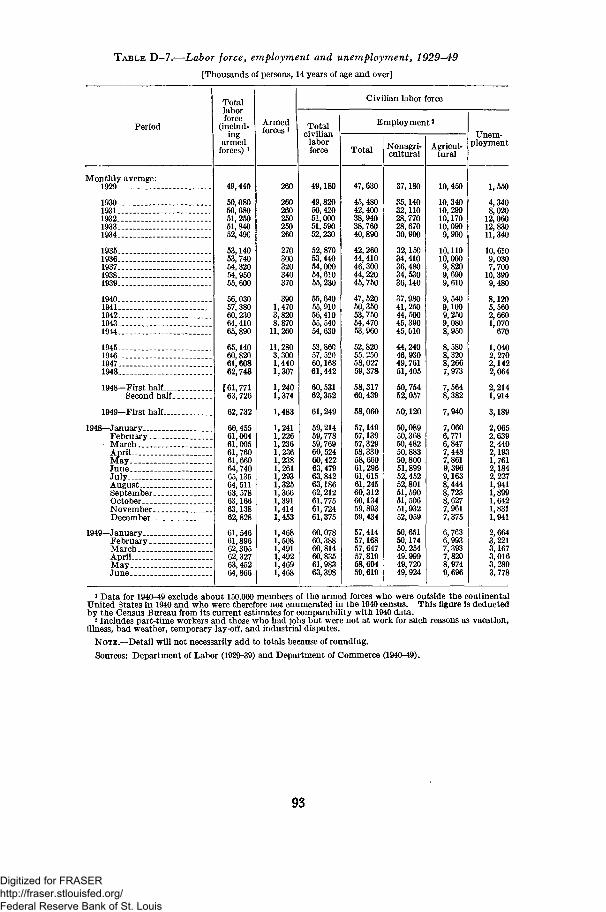
TABLE D—7.—Labor force, employment and unemployment, 1929—49[Thousands of persons, 14 years of age and over]
Period
Monthly average:1929
1930193119321933 . . .1934
19351936193719381939
19401941194219431944 . . . _
1945194619471948 .
1948—First halfSecond half _
1949—First half
1948—JanuaryFebruaryMarch . .AprilMayJune . _ _ _JulyAugustSeptemberOctober. . . . . . .NovemberDecember
1949—January..FebruaryMarch _. .AprilMay.. _.June
Totallaborforce
(includ-ing
armedforces) l
49,440
50,08050, 68051, 25051,84052,49G
53,14053, 74054,32054,95055,600
56,03057,38060,23064,41065,890
65,14060,82061.60862,748
[61,77163,726
62,732
60,45561,00461,00561,76061,66064,74065,13564,51163,57863,16663,13862,828
61,54661,89662,30562,32763,45264,866
Armedforces i
260
260260250250260
270300320340370
3901,4703,8208,870
11,260
11, 2803, 3001,4401,307
1,2401,374
1,483
1,2411,2261,2361,2361,2381,2611,2931,3251,3661,3911,4141,453
1,4681,5081,4911,4921,4691,468
Civilian labor force
Totalcivilian
laborforce
49,180
49,82050,42051,00051, 59052,230
52, 87053,44054,00054,61055, 230
55,64055, 91056,41055, 54054,630
53,86057, 52060,16861,442
60,53162,352
61,249
59,21459,77859,76960,52460,42263,47963,84263,18662,21261, 77561,72461,375
60,07860,38860,81460,83561,98363,398
Employment2
Total
47,630
45,48042,40038,94038,76040,890
42,26044,41046,30044, 22045,750
47, 52050,35053,75054,47053,960
52,82055, 25058,02759,378
58,31760,439
58,060
57,14957,13957,32958,33058,66061,29661,61561,24560,31260,13459,89359,434
57,41457,16857,64757,81958,69459,619
Nonagri-cultural
37,180
35,14032,11028,77028, 67030,990
32,15034,41036, 48034,53036,140
37,98041, 25044, 50045,39045,010
44,24046, 93049,76151,405
50,75452,057
50,120
50,08950,36850,48250,88350,80051,89952,45252,80151,59051,50651,93252,059
50,65150,17450,25449,99949,72049,924
Agricul-tural
10,450
10,34010,29010,17010,0909,900
10,11010,0009,8209,6909,610
9,5409,1009,2509,0808,950
8,5808,3208,2667,973
7,5648,382
7,940
7,0606,7716,8477,4487,8619,3969,1638,4448,7238,6277,9617,375
6,7636,9937,3937,8208,9749,696
Unem-ployment
1,550
4,3408,020
12,06012, 83011,340
10, 6109,0307,700
10,3909,480
8,1205,5602,6601,070
670
1,0402,2702,1422,064
2,2141,914
3,189
2,0652,6392,4402,1931,7612,1842,2271,9411,8991,6421,8311,941
2,6643,2213,1673,0163,2893,778
1 Data for 1940-49 exclude about 150,000 members of the armed forces who were outside the continentalUnited States in 1940 and who were therefore not enumerated in the 1940 census. This figure is deductedby the Census Bureau from its current estimates for comparability with 1940 data.
2 Includes part-time workers and those who had jobs but were not at work for such reasons as vacation,illness, bad weather, temporary lay-off, and industrial disputes.
NOTE.—Detail will not necessarily add to totals because of rounding.
Sources: Department of Labor (1929-39) and Department of Commerce (1940-49).
93
Digitized for FRASER http://fraser.stlouisfed.org/ Federal Reserve Bank of St. Louis
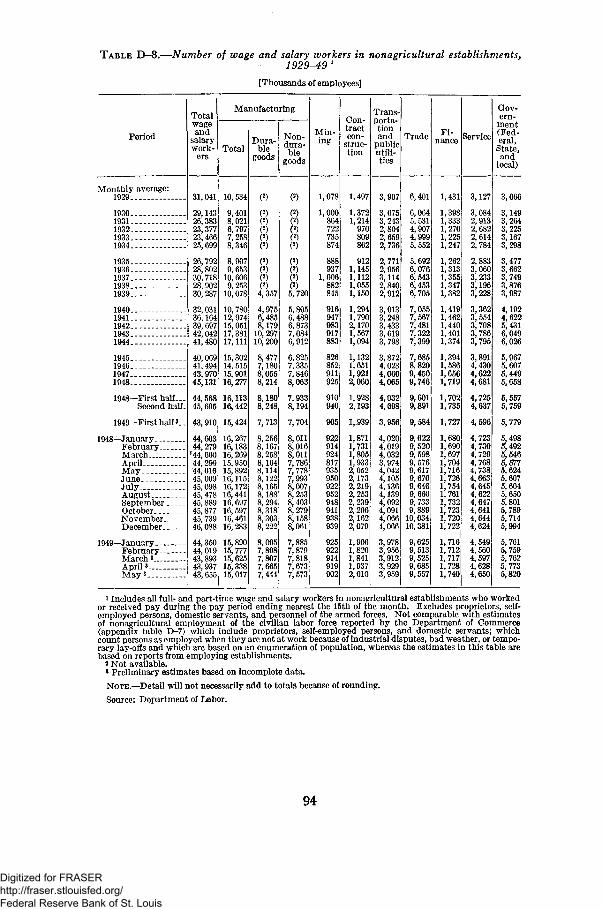
TABLE D—8.—Number of wage and salary workers in nonagricultural establishments,1929^9 x
[Thousands of employees]
Period
Monthly average:1929
1930 _1931.1932.1933.1934.
1935.1936.1937.1938.1939.
1940.1941.1942.1943.1944.
1945.1946.1947.1948-
1948—First half-Second half.
1949—First half3. -
1948—JanuaryFebruaryMarchAprilMayJuneJulyAugustSeptember _ _OctoberNovember... .December.._
1949—JanuaryFebruaryMarch 3AprilsMay3
Totalwageand
salarywork-
ers
31.041
29,14326,38323,37723,46625,699
26,79228,80230, 71828,90230, 287
32,03136,16439, —42.04241,480
40, 06941, 49443,97045,131
44, 56845, 695
43, 910
44,60344,279'44,60044,29944, 61645, 00945, '45,47845,88945,87745,739
44,35044,01943,89343,93743,655
Manufacturing
Total
10,534
9,4018,0216,7977,2588,346
8,9079,65310, 6069,25310,078
10,78012,97415,05117,38117, 111
15,30214,51515,90116,277
16,11316> 442
15,424
16, 26716,18316, 26915,95015,89216,11516,17216,44116,69716,59716,46116, 283
15,89015, 77715,62515,33815,017
Dura-ble
goods
()4,3574,9756,4858,17910, 29710, 200
8,4777,1808,0558,214
8,1808,248
7,713
8,2568,1678,2588,1648,1148,1228,1658,1888,2948,3188,3038,222
8,0057,8987,8077,6657,444
Non-dura-ble
goods
()5,720
5,8056,4886,8737,0846,912
6,8257,3357,8468,063
7,9338,194
7,704
8,0118,0168,0117,7867,7787,9938,0078,2538,4038,2798,1588,061
7,8857,8797,8187,6737,573
Min-ing
1,078
1,000864722735874
9371,006882845
916947983917
852911925
910940
905
922914924817935950922952948941938939
925922914919902
Con-tractcon-
struc-tion
1,497
1,3721,214970809862
9121,1451,1121,0551,150
1,2941,7902,1701,5671,094
1,1321,6511,9212,060
1,9282,193
1,.939
1,8711,7311,8051,9332,0522,1732,2192,2532,2392,2062,1622,079
1,9061,8201,8411,9372,010
Trans-porta-tionand
publicutilities
3,907
3,6753,2432,8042,6592,736
2,7712,9563,1142,8402,912
3,0133,2483,4333,619
3,8724,0234,0604,065
4,0324,G~~
3,956
4,0204,0194,0323,9744,0424,1054,1364,1394,0924,0914,0664,066
3,9783,9563,9123,9293,959
Trade
6,401
6,0645,5314,9074,9995,552
5,6926,0766,5436,4536,705
7,0557,5677,4817,3227,r~7,6858,8209,4509,746
9,6019,891
9,584
9,6229,5209,5989,5769,6179,6709,6469,6609,7339,889
10,03410,381
9,6259,5139,5259,6859,557
Fi-nance
1,431
1,3981,3331,2701,2251,247
1,2621,3131,3551,3471,382
1,4191,4621,4401,4011,374
1,3941,5861,6561,719
1,7021,735
1,727
1,680L,6901,697L, 704L,7161,726,754
1,7611,7321,7231,7201,722
1,7161,7121,7171,728] ,740
Service
3,127
3,0842,9132,6822,6142,784
2,8833,0603,2333,1963,228
3,3623,5543,7083,7863,795
3,8914,4304,6224,681
4,7254,637
4,596
4,7234,7304,7294,7684,7384,6634,6454,6224,6474,6414,6444,624
4,5494,5604,5974,6284,650
Gov-ern-ment(Fed-eral,State,and
local)
3,066
3,1493,2643,2253,1673,298
3,4773,6623,7493,8763,987
4,1924,6225,4316,049
5,9675.6075,4495,658
5,5575,759
5,779
5,498S4925,5465,5775,6245,6075,6045,6505,8015,7895,7145,994
5,7615,7595,7625,7735,820
* Includes all full- and part-time wage and salary workers in nonagricultural establishments who workedor received pay during the pay period ending nearest the 15th of the month. Excludes proprietors, self-employed persons, domestic servants, and personnel of the armed forces. Not comparable with estimatesof nonagricultural employment of the civilian labor force reported by the Department of Commerce(appendix table D-7) which include proprietors, self-employed persons, and domestic servants; whichcount persons as employed when they are not at work because of industrial disputes, bad weather, or tempo-rary lay-offs and which are based on an enumeration of population, whereas the estimates in this table arebased on reports from employing establishments.
2 Not available.3 Preliminary estimates based on incomplete data.
NOTE.—Detail will not necessarily add to totals because of rounding.
Source: Department of Labor.
94
Digitized for FRASER http://fraser.stlouisfed.org/ Federal Reserve Bank of St. Louis
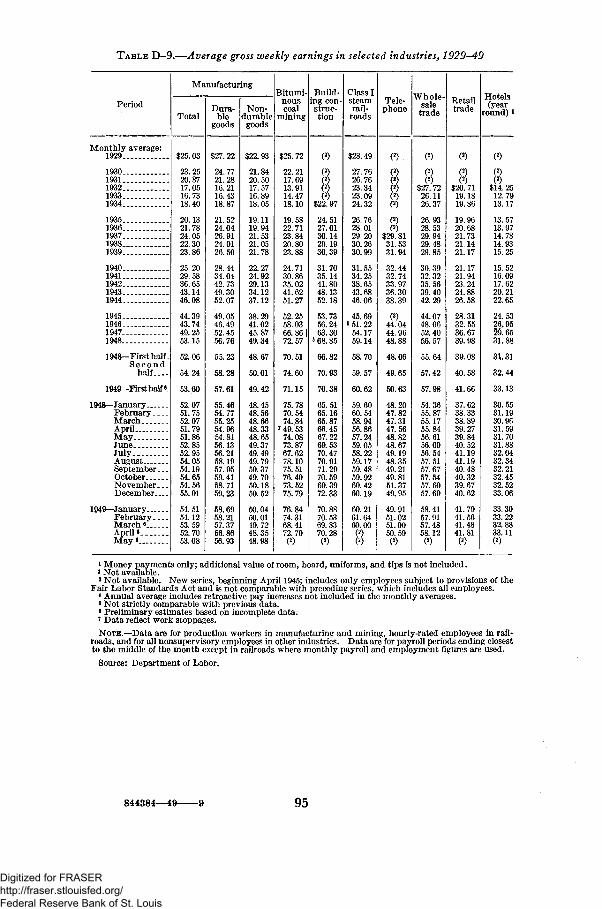
TABLE D-9.—Average gross weekly earnings in selected industries, 1929-49
Period
Manufacturing
Total
$25.03
23.2520.8717.0516.7318.40
20.1321.7824.0522.3023.86
25.2029.5836.6543.1446.08
44.3943.7449.2553.15
52.06
54.24
53.60
52.0751.7552.0751.7951.8652.8552.9554.0554.1954.6554.5655.01
54.5154.1253.5952.7053.08
Dura-ble
goods
$27. 22
24.7721.2816.2116.4318.87
21.5224.0426.9124.0126.50
28.4434.0442.7349.3052.07
49.0546.4952.4556.76
55.23
58.28
57.61
55.4654.7755.2554.9654.8156.1356.2158.1957.9559.4158.7159.23
58.6958.2157.3756.8656.93
Non-durablegoods
$22.93
21.8420.5017.5716.8918.05
19.1119.9421.5321.0521.78
22.2724.9229.1334.1237.12
38.2941.0245.8749.34
48.67
50.01
49.42
48.4548.5648.6648.3348.6549.3749.4949.7950.3749.7050.1850.52
50.0450.0149.7248.3548.98
Bitumi-nouscoal
mining
$25.72
22.2117.6913.9114.4718.10
19.5822.7123.8420.8023.88
24.7130.8635.0241.6251.27
52.2558.0366. 86 j72.57
70.51
74.60
71.15
75.7870.5474.84
7 49.5374.0873.8767.6278.1075.5176.4073.5275.79
76.8474.3168.4172.70(2)
Build-ing con-struc-tion
(2)
(2)(2)(2)(2)
$22.97
24.5127.0130.1429.1930.39
31.7035.1441.8048.1352.18
53.7356.2463.30
5 68.85
66.82
70.93
70.38
65.5165.1665.8766.4567.2269.5370.4770.9171.2970.5969.3972.33
70.8870.5369.8370.28(2)
Class Isteamrail-
roads
$28.49
27.7626.7623.3423.0924.32
26.7628.0129.2030.2630.99
31.5534.2538.6543.6846.06
45.69< 51. 22
54.1759.14
58.70
59.57
60.62
59.6060.5458.9456.8657.2459.0558.2259.1759.4859.9260.4260.19
60.2161.6460.00
(2)(2)
Tele-phone
(2)
(2)(2)(2)(2)(2)
(2)(2)
$29.8131.5331.94
32.4432.7433.9736.3038.39
(3)44.0444.9648.88
48.06
49.65
50.63
48.2047.8247.3147.5648.8248.6749.1948.3549.2149.8151.3749.95
49.9151.0251.0050.59(2)
TTT-U - 1 .
w noie-saletrade
(2)
(2)(2)
$27. 7226.1126.37
26.9328.5329.9429.4829.85
30.3932.3235.5639.4042.29
44.0748.0652.405,6.57
55.64
57.42
57.98
54.3655.8755.1755.8456.6156.0056.5457.5157.6757.5457.6057.69
58.4157.9157.4858.12(2)
Retailtrade
(2)
(2)(2)
$20.7119.1819.86
19.9620.6821.7321.1421.17
21.1721.9423. 2424.8826.58
28.3132.5536.6739.98
39.08
40.58
41.66
37.6238.3338.8939.2739.8440.5241.1941.1940.4840.3239.6740.62
41.7941.5641.4841.81(2)
Hotels(year
round) *
Monthly average:1929
1930._._ _19311932 .._.19331934.. _..
193519361937._ _.__19381939____
19401941194219431944
1945194619471948
1948—First half.Second
half..-,
1949—First half*.
1948—JanuaryFebruaryMarchAprilMayJuneJulyAugustSeptember...OctoberNovember...December
1949—JanuaryFebruaryMarch6
April«._May 8
()$14. 2512.7913.17
13.5713.9714.7814.9315.25
15.5216.0917.6220.2122.65
24.5326,9529.6531.88
31.31
32.44
33.13
30.5531.1930.9631.5931.7031.8832.0432.3432.2132.4532.5233.06
33.3033.2232.8833.11
1 Money payments only; additional value of room, board, uniforms, and tips is not included.2 Not available.3 Not available. New series, beginning April 1945; includes only employees subject to provisions of the
Fair Labor Standards Act and is not comparable with preceding series, which includes all employees.* Annual average includes retroactive pay increases not included in the monthly averages.5 Not strictly comparable with previous data.6 Preliminary estimates based on incomplete data.7 Data reflect work stoppages.
NOTE.—Data are for production workers in manufacturing and mining, hourly-rated employees in rail-roads, and for all nonsupervisory employees in other industries. Data are for payroll periods ending closestto the middle of the month except in railroads where monthly payroll and employment figures are used.
Source: Department of Labor.
844384—49 95
Digitized for FRASER http://fraser.stlouisfed.org/ Federal Reserve Bank of St. Louis
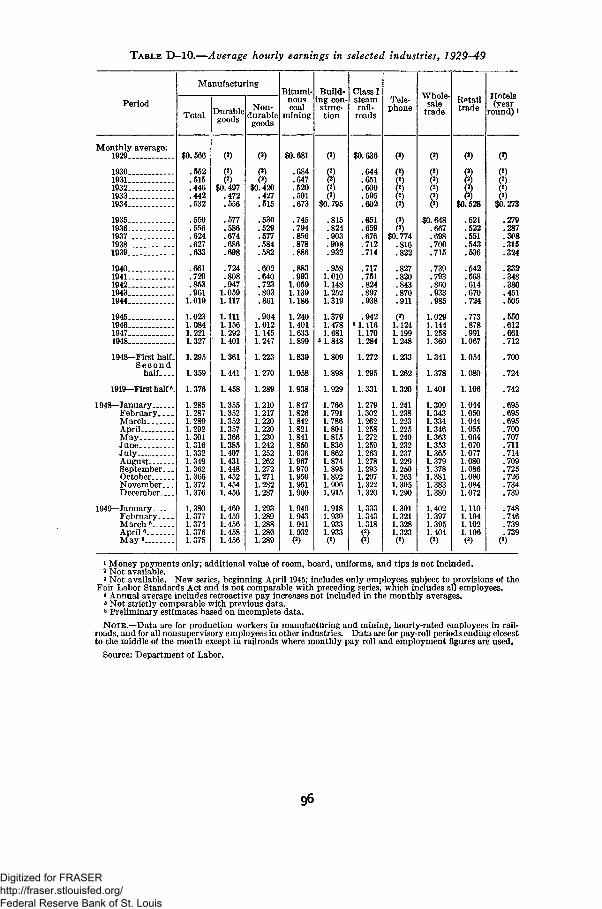
TABLE D-10.—Average hourly earnings in selected industries, 1929-49
Period
Manufacturing
Total Durablegoods
Non-durablegoods
Bitumi-nouscoal
mining
Build-ing con-struc-tion
Class Isteamrail-
roads
Tele-phone
Whole-sale
tradeRptailtrade
Hotels(year
round)!
Monthly average:1929.
19301931193219331934...
1935.193619371938.1939
19401941-...-194219431944
194519461947—.1948
1948—First half.S e c o n d
half....
1949—First half«.
1948—JanuaryFebruaryMarchAprilMayJuneJuly.. . .AugustSeptember. __OctoberNovemberDecember
1949—JanuaryFebruaryMarch 6
April«May 6
$0.566
.552
.515
.446
.442
.532
.550
.556
.624
.627
.633
.661
.729
.853
.9611.019
1.0231.0841.2211.327
1.295
1.359
1.376
1.2851.2871.2891.2921.3011.3161.3321.3491.3621.3661.3721.376
1.3801.3771.3741.3761.375
()$0.497
.472
.556
.577
.586
.674
.724
.808
.9471.0591.117
1.1111.1561.2921.401
1.361
1.441
1.458
1.3551.3521.3521.3571.3661.3851.4071.4311.4481.4521.4541.456
1.4601.4591.4561.4581.456
8$0,420
.427
.515
.530
.529
.577
.584
.582
.602
.640
.723
.803
.861
.9041.0121.1451.247
1.223
1.270
210217220220230242252262272271282287
293
$0,681
.684
.647
.520
.501
.673
.745
.794
.856
.878
.883
.9931.0591.1391.186
1.2401.4011.6331.899
1.839
1.938
1.8471.8261.8421.8211.8411.8501.9361.9671.9701.9591.9511.960
1.9491.9431.9411.932
()
8(2)$0.795
.815
.824
.903
.908
.932
.9581.0101.1481.2521.319
1.3791.4781.681
• 1. 848
1.809
1.929
1.7661.7911.7861.8041.8151.8361.8621.8741.8951.8921.9061.915
1.9181.9301.9331.933
$0,636
.644
.651
.600
.595
.602
.651
.659
.676
.712
.714
.717
.751
.824
.897
.942* 1.1161.1701.284
1.272
1.295
1.331
1.2791.3021.2621.2581.2721.2591.2631.2781.2931.2971.3221.320
1.3331.3431.318
)$0.774.816.822
.827
.820
.843
.870
.911
(*)1.1241.1991.248
1.233
1.262
1.320
1.2411.2381.2231.2251.2401.2321.2371.2291.2501.2631.3051.290
1.3011.3211.3281.323
()(2)
8$0,648
.667
.698
.700
.715
.739
.793
.860
.933
.985
1.0291.1441.2581.360
1.341
1.378
1.401
1.3091.3431.3341.3461.3631.3531.3651.3791.3781.3811.3831.380
1.4021.3971.3951.404
()$0,528
.521
.522
.551
.543
.536
.542
.568
.614
.670
.724
.773
.878
.9911.067
1.054
1.106
1.0441.0501.0441.0551.0641.0701.0771.0801.0861.0801.0841.072
1.1101.1041.1021.106
<*>
(2)
8(2)$0,273
.279
.287
.308
.315
.324
.332
.348
.386
.451
.505
.550
.612
.661
.712
.700
.724
.742
.700
.707
.711
.714
.709
.725
.726
.734
.739
.748
.746
.739
.739
1 Money payments only; additional value of room, board, uniforms, and tips is not included.2 Not available.3 Not available. New series, beginning April 1945; includes only employees subject to provisions of the
Fair Labor Standards Act and is not comparable with preceding series, which includes all employees.4 Annual average includes retroactive pay increases not included in the monthly averages.8 Not strictly comparable with previous data.• Preliminary estimates based on incomplete data.NOTE.—Data are for production workers in manufacturing and mining, hourly-rated employees in rail-
roads, and for all nonsupervisory employees in other industries. Data are for pay-roll periods ending closestto the middle of the month except in railroads where monthly pay roll and employment figures are used.
Source: Department of Labor.
Digitized for FRASER http://fraser.stlouisfed.org/ Federal Reserve Bank of St. Louis
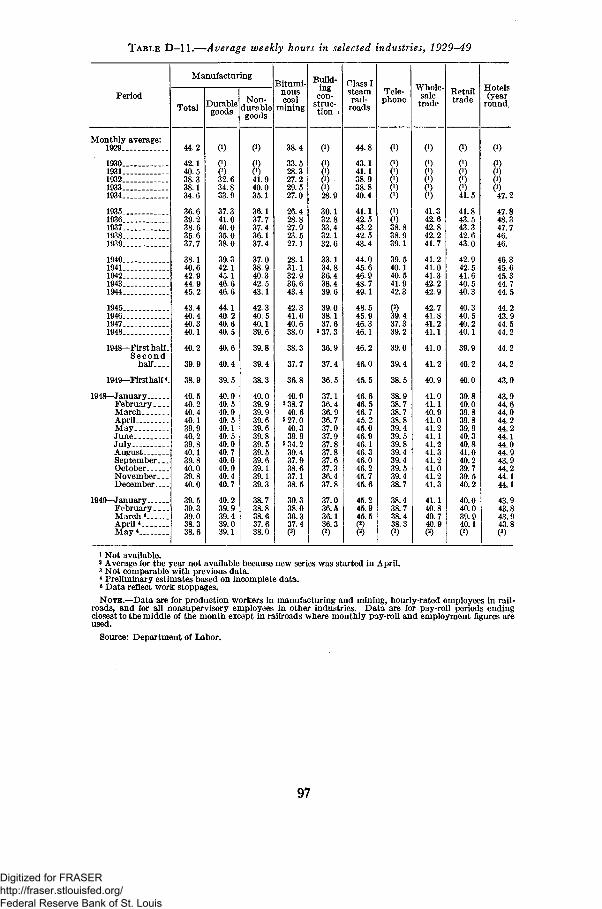
TABLE D—11.—Average weekly hours in selected industries, 1929-49
Period
Manufacturing
Total Durablegoods
Non-durablegoods
Bitumi-nouscoal
mining
Build-ing
con-struc-tion i
Class Isteamrail-
roads
Tele-phone
Whole-sale
tradeRetailtrade
Hotels(year
round.
Monthly average:1929
19301931193219331934
19351936193719381939
194019411942..__19431944
1945194619471948
1948—First half.Second
half....
1949—Firsthalff
1948—JanuaryFebruaryMarchAprilMayJune.. _.JulyAugustSeptember...OctoberNovember...December
1949—JanuaryFebruaryMarch*April *May *
44.2
42.140.538.338.1
36.639.238.635.637.7
38.140.642.944.945.2
43.440.440.340.1
40.2
38.9
40.540.240.440.139.940.239.840.139.840.039.840.0
39.539.339.038.338.6
(0
0 )C1)32.634.833.9
37.341.040.035.038.0
39.342.145.146.646.6
44.140.240.640.5
40.6
40.4
39.5
40.940.540.940.540.140.540.040.740.040.940.440.7
40.239.939.439.039.1
0)
C1)0 )41.940.035.136.137.737.436.137.4
37.038.940.342.543.1
42.340.540.139.6
39.8
39.4
38.3
40.039.939.939.639.639.839.539.539.639.139.139.3
38.738.838.637.638.0
38.4
33.528.327.229.527.0
26.428.827.923.527.1
28.131.132.936.643.4
42.341.640.638.0
38.3
37.7
36.8
40.95 38.7
40.65 27.0
40.339.9
5 34.239.437.938.637.138.5
39.338.036.337.4
28.9
30.132.833.432.132.6
33.134.836.438.439.6
39.038.137.6
«37.3
36.9
37.4
36.5
37.136.436.936.737.037.937.837.837.637.336.437.8
37.036.536.136.3(
44.8
43.141.138.938.840.4
41.142.543.242.543.4
44.045.646.948.749.1
48.545.946.346.1
46.2
46.0
45.5
46.646.546.745.245.046.946.146.346.046.245.745.6
45.245.945.5(
C1)
0)
88838.838.939.139.540.140.541.942.3
()39.437.339.2
39.0
39.4
38.5
38.938.738.738.839.439.539.839.439.439.539.438.7
38.438.738.438.3(
0)
0)
8841.342.642.842.241.7
41.241.041.342.242.9
42.741.841.241.1
41.0
41.2
40.9
41.041.140.941.041.241.141.241.341.241.041.241.3
41.140.840.740,9()
0)
80)41.5
41.843.543.342.643.0
42.942.541.640.540.3
40.340.540.240.1
39.9
40.2
40.0
39.840.039.839.839.940.340.841.040.239.739.540.2
40.040.039.940.1
0)
0)0)0)0)
47.2
47.848.347.746.46.
46.345.645.344.744.5
44.243.944.544.2
44.2
44.2
43.9
43.944.644.044.244.244.144.044.943.944.244.144.1
43.943.843.943.8
1 Not available.2 Average for the year not available because new series was started in April.3 Not comparable with previous data.* Preliminary estimates based on incomplete data.« Data reflect work stoppages.
NOTE.—Data are for production workers in manufacturing and mining, hourly-rated employees in rail-roads, and for all nonsupervisory employees in other industries. Data are for pay-roll periods endingclosest to the middle of the month except in railroads where monthly pay-roll and employment figures areused.
Source: Department of Labor.
97
Digitized for FRASER http://fraser.stlouisfed.org/ Federal Reserve Bank of St. Louis
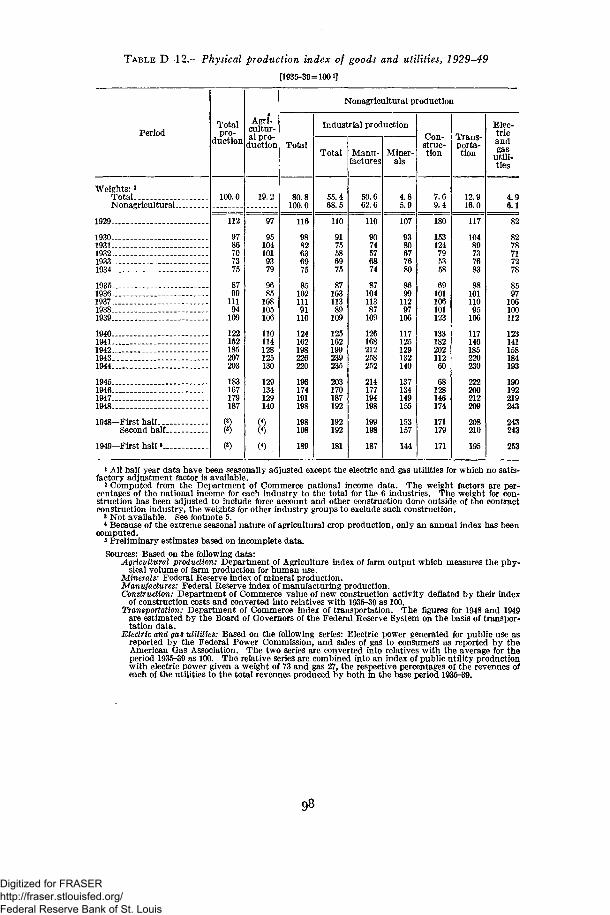
TABLE D-12.—Physical production index of goods and utilities, 1929-A9
[1935-39=1001]
Period
Weights:2
TotalNonagricultural . . .
1929
19301931 -19321933 -- .-1934 -
1935 . _1936193719381939
1940 . __194119421943 -1944
1945194619471948
1948—First halfSecond half
1949—First n a if s
Totalpro-
duction
100.0
112
9786707375
8799
11194
109
122152185207203
183167179187
00(3)eo
Agri-cultur-al pro-
duction
19.2
97
951041019379
9685
108105106
110114128125130
129134129140
(4)
w(4)
Nonagricultural production
Total
80.8100.0
116
9882636975
8510211191
110
124162198226220
196174191198
198198
189
Industrial production
Total
55.468.5
110
9175586975
8710311389
109
125162199239235
203170187192
192192
181
Manu-factures
50.662.6
110
9074576874
8710411387
109
126168212258252
214177194198
199198
187
Miner-als
4.85.9
107
9380677680
8699
11297
106
117125129132140
137134149155
153157
144
Con-struc-tion
7.69.4
180
153124795358
69101106101123
13318220211260
68128146174
171179
171
Trans-porta-tion
12.916.0
117
10489737683
88101no95
106117146185220230
222200212209
208210
195
Elec-tricandgas
utili-ties
4.96.1
82
8278717278
8597
106100112
123141158184193
190192219243
243243
253
1 All half year data have been seasonally adjusted except the electric and gas utilities for which no satis-factory adjustment factor is available.
2 Computed from the Department of Commerce national income data. The weight factors are per-centages of the national income for each industry to the total for the 6 industries. The weight for con-struction has been adjusted to include force account and other construction done outside of the contractconstruction industry, the weights for other industry groups to exclude such construction.
3 Not available. See footnote 5.* Because of the extreme seasonal nature of agricultural crop production, only an annual index has been
computed.« Preliminary estimates based on incomplete data.
Sources: Based on the following data:Agricultural production: Department of Agriculture index of farm output which measures the phy-
sical volume of farm production for human use.Minerals: Federal Reserve index of mineral production.Manufactures: Federal Reserve index of manufacturing production.Construction: Department of Commerce value of new construction activity deflated by their index
of construction costs and converted into relatives with 1935-39 as 100.Transportation: Department of Commerce index of transportation. The figures for 1948 and 1949
are estimated by the Board of Governors of the Federal Reserve System on the basis of transpor-tation data.
Electric and gas utilities: Based on the following series: Electric power generated for public use asreported by the Federal Power Commission, and sales of gas to consumers as reported by theAmerican Gas Association. The two series are converted into relatives with the average for theperiod 1935-39 as 100. The relative series are combined into an index of public utility productionwith electric power given a weight of 73 and gas 27, the respective percentages of the revenues ofeach of the utilities to the total revenues produced by both in the base period 1935-39.
Digitized for FRASER http://fraser.stlouisfed.org/ Federal Reserve Bank of St. Louis
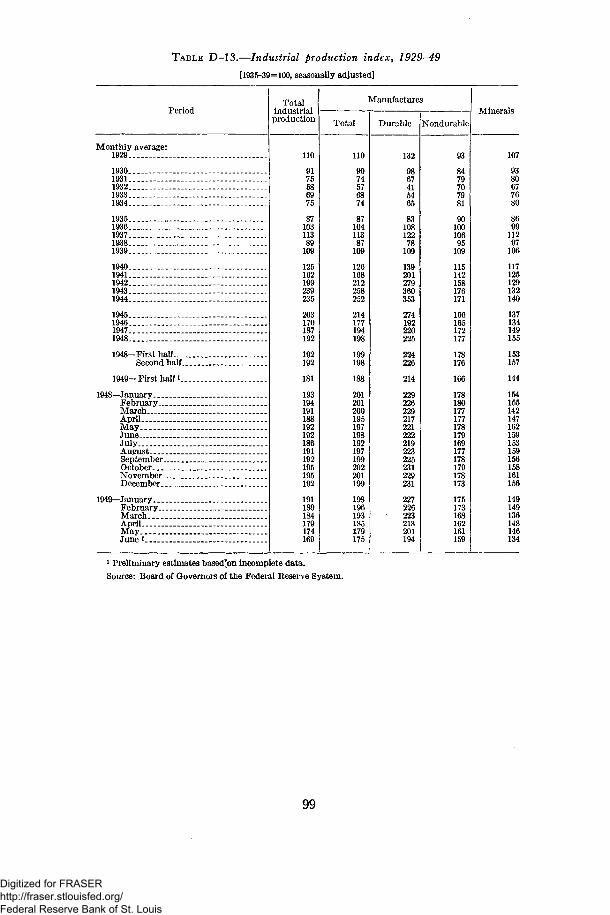
TABLE D-13.—Industrial production index, 1929-49
[1935-39=100, seasonally adjusted]
Period
Monthly average:1929
193019311932 _ -19331934 _ _.
1935 __- _1936193719381939
1940 .1941 ._-19421943. _.1944
1945194619471948
1948—First halfSecond half
1949— First half *
1948—January. _ _FebruaryMarchApril _MayJuneJulyAugustSeptember _October _NovemberDecember
1949—January. _ . .FebruaryMarchAprilMayJune'
Totalindustrialproduction
110
9175586975
8710311389
109
125162199239235
203170187192
192192
181
193194191188192192186191192195195192
191189184179174169
Manufacture
Total
110
9074576874
8710411387
109
126168212258252
214177194198
199198
188
201201200195197198192197199202201199
198196193185179175
Durable
132
9867415465
8310812278
109
139201279360353
274192220225
224226
214
229226229217221222219223225231229231
227226223213201194
3
Nondurable
93
8479707981
9010010695
109
115142158176171
166165172177
178176
166
178180177177178179169177178179178173
175173168162161159
Minerals
107
9380677680
8699
11297
106
117125129132140
137134149155
153157
144
154155142147162159153159156158161156
149149136148146134
1 Preliminary estimates based'on incomplete data.Source: Board of Governors of the Federal Reserve System.
99
Digitized for FRASER http://fraser.stlouisfed.org/ Federal Reserve Bank of St. Louis
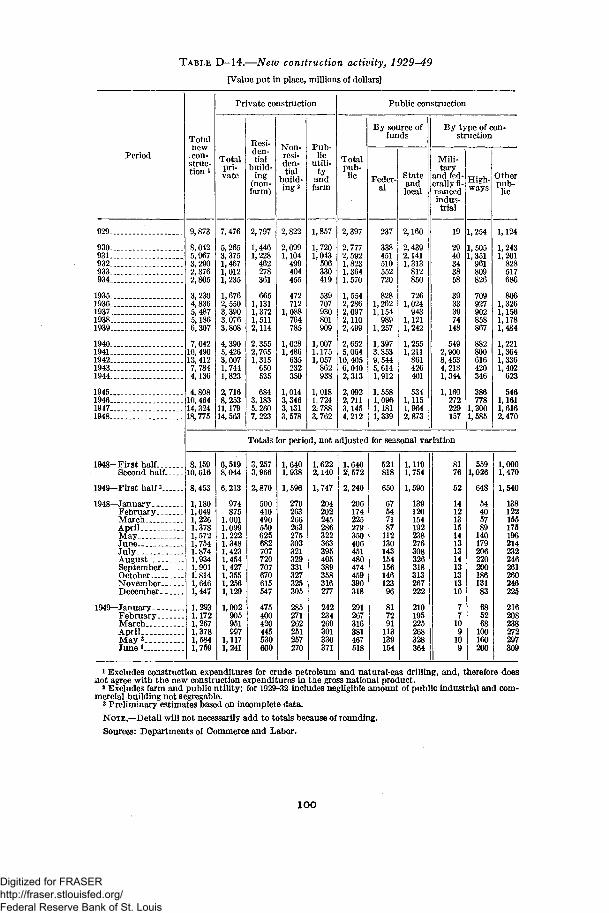
TABLE D-14.—New construction activity, 1929^-9
[Value put in place, millions of dollars]
Period
Totalnew
. con-struc-tion i
Private construction
Totalpri-vate
Resi-den-tial
build-ing
(non-farm)
Non-resi-den-tial
build-ing 2
Pub-lic
utili-ty
andfarm
Public construction
Totalpub-lic
By source offunds
Feder-al
Stateandlocal
By type of con-struction
Mili-tary
and fed-erally fi-nancedindus-trial
High-ways
Otherpub-lic
929
930— _ .931932933934
19351936193719381939
1940 . . .19411942.. _19431944
1945194619471948
1948-FirsthalL.
9,873
8,0425,9673,2902,3762,805
3,2304,8365,4875,1866,307
7,04210,49013,4127,7844,136
4,80810,46414,32418, 775
7,476
5,2653,3751,4671,0121,235
1,6762,5503,3903,0763,808
4,3905,4263,0071,7441,823
2,7168,25311,17914,563
2,797
1,4461,228462278361
6651,1311,3721,5112,114
2,3552,7651,315650535
6843,1835,2607,223
2,822
2,0991,104499404455
472712
1,088764785
1,0281,486635232350
1,0143,3463,1313,578
1,857
1,7201,043
506330419
539707930801
1,0071,1751,057862938
1,0181,7242,- 7883,762
2,397
2,7772,5921,8231,3641, 570
1,5542,2862,0972,1102,499
2,6525,06410, 4056,0402,313
2,0922,2113,1454,212
237
338451510552720
1,2621,154989
1,257
1,3973.8539,5445,6141,912
1,5581,0961,1811,339
2,160
2,4392,1411,313812850
7261,024943
1,1211,242
1,2551,211861426401
5341,1151,9642,873
19
2940343858
39333974148
5492,9008,4534,2181,344
1,160272229157
1,254
1,5051, 351961809826
709927902858867
800616420
7781,3001,585
Totals for period, not adjusted for seasonal variation
Second half
1949—First half 3
1948—JanuaryFebruaryMarchAprilMayJuneJulyAugustSeptemberOctoberNovemberDecember. __
1949—January. _February.March _._._AprilMay a.—June 3
8,15910,616
8,453
1,1801,0491,2261,3781,5721,7541,8741,9341,9011,8141,6461,447
1,2931,1721,2671,3781,5841,759
1,124
1,2431,201828517
1,3261,1561,1781,484
1,2211,3641,3361,402623
5461,1611,6162,470
6,5198,044
6,213
974875
1,0011,0991,2221,3481,4231,4541,4271.3551,2561,129
1,002905951997
1,1171,241
3,2573,966
2,870
500410490550625682707720707670615547
475400420445530600
1,6401,938
1,596
270263266263275303321329331327325305
285271262251257270
1,6222,140
1,747
204202245286322363395405389358316277
242234269301330371
1,6402,572
2,240
206174225279350406451480474459390318
291267316381467518
521818
650
67547187
112130143154156146123
96
817291
113139154
1,1191,754
1,590
139120154192238276308326318313267222
210195225268328364
8176
52
141213151413131413131310
77
109
109
5591,026
648
54405789
140179206220200186131
83
685268
100160200
1,0001,470
1,540
138122155175196214232246261260246225
216208238272297309
1 Excludes construction expenditures for crude petroleum and natural-gas drilling, and, therefore doesnot agree with the new construction expenditures in the gross national product.
2 Excludes farm and public utility; for 1929-32 includes negligible amount of public industrial and com-mercial building not segregable.
3 Preliminary estimates based on incomplete data.
NOTE.—Detail will not necessarily add to totals because of rounding.
Sources: Departments of Commerce and Labor.
xoo
Digitized for FRASER http://fraser.stlouisfed.org/ Federal Reserve Bank of St. Louis
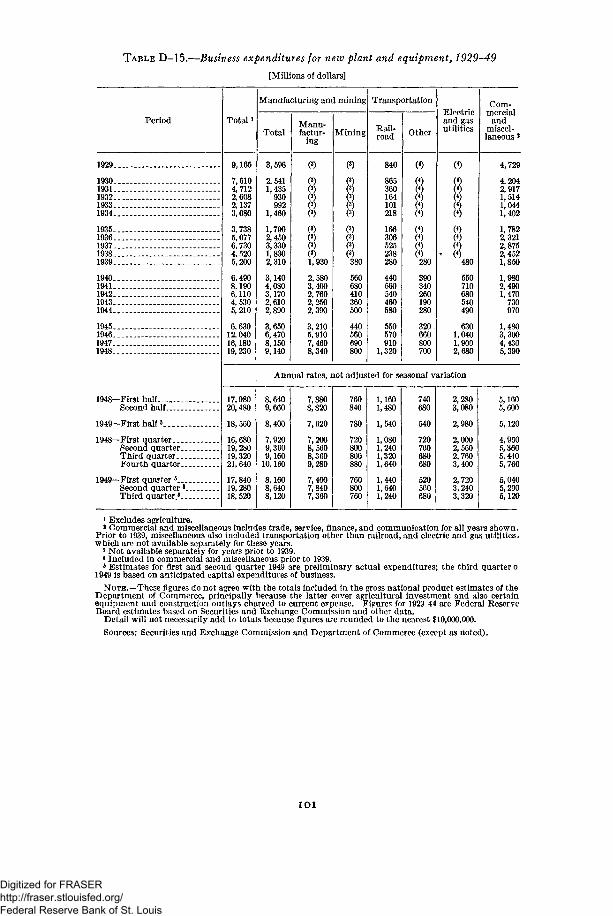
TABLE D-15.—Business expenditures for new plant and equipment, 1929-49
[Millions of dollars]
Period Total
Manufacturing and mining
Total
3,596
2,5411,435
930992
1,460
1,7902,4503,3301,8302,310
3,1404,0803,1702,6102,890
3,6506,4708,1509,140
Manu-factur-
ing
(3)
(3)
8(3)(3)(3)(3)(3)(3)1,930
2,5803,4002,7602,2502,390
3,2105,9107,4608,340
Mining
(3)
(3)
(3)(3)(3)(3)
(3)
(3)(3)
(3)380
560680410360500
440560690800
Transportation
Rail-road
840
865360164101218
166306525238280
440560540460580
550570910
1,320
Other
(<)
(4)(4)
(*)
8(4)<«)(4)(4)280
390340260190280
320660800700
Hiiectricand gasutilities
(4)(4)
(4)
(4(4(4
. (4480
550710680540490
6301,0401,9002,680
Com-mercial
andmiscel-laneous 2
1929.
1930.1931.1932.1933.1934.
1935.1936.1937-1938.1939.
1940.1941.1942..1943.1944..
1945..1946..1947..1948..
9,165
7,6104,7122,6082,1373,080
3,7385,0776,7304, 5205,200
6,4908,1906,1104,5305,210
6.63012,04016,18019,230
Annual rates, not adjusted for seasonal variation
1948—First half
Second half
1949—First half 8_
1948—First quarterSecond quarter..Third quarter...Fourth quarter..
1949—First quarter 8__.Second quarter J.Third quarter.5..
17,98020,480
18,560
16,68019,28019,32021,640
17,84019,28018, 520
4,729
4,2042,9171,5141,0441,402
1,7822,3212,8752,4521,850
1,9802,4901,470730970
1,4803,3004,4305,390
8,6409,660
8,400
7,9209,3609,160
10,160
8,1608,6408,120
7,8808,820
7,620
7,2008,5608,3609,280
7,4007,8407,360
760840
780
720800800880
760800760
1,1601,480
1,540
1,0801,2401,3201,640
1,4401,6401,240
740680
540
720760680680
5205fi0680
2,2803,080
2,980
2,0002,5602,7603,400
2,7203,2403,320
5,1605,600
5,120
4,9605,3605,4405,760
5,0405,2005,120
iExcludes agriculture.* Commercial and miscellaneous includes trade, service, finance, and communication for all years shown.
Prior to 1939, miscellaneous also included transportation other than railroad, and electric and gas utilities.which are not available separately for these years.
3 Not available separately for years prior to 1939.4 Included in commercial and miscellaneous prior to 1939.J Estimates for first and second quarter 1949 are preliminary actual expenditures; the third quarter o
1949 is based on anticipated capital expenditures of business.
NOTE.—These figures do not agree with the totals included in the gross national product estimates of theDepartment of Commerce, principally because the latter cover agricultural investment and also certainequipment and construction outlays chareed to current expense. Figures for 1929-44 are Federal ReserveBoard estimates based on Securities and Exchange Commission and other data.
Detail will not necessarily add to totals because figures are rounded to the nearest $10,000,000.
Sources: Securities and Exchange Commission and Department of Commerce (except as noted).
I O I
Digitized for FRASER http://fraser.stlouisfed.org/ Federal Reserve Bank of St. Louis

TABLE D-16.—Inventories and sales in manufacturing and trade, 1939-49
[Not adjusted for seasonal variation]
Period
1939
19401941194219431944
1945194619471948
1948—First halfSecond half
1948—JanuaryFebruaryMarch.AprilMayJuneJulyAugustSeptemberOctoberNovemberDecember...
1949—JanuaryFebruaryMarchAprilMay,4
Manufacturing
Millions ofdollars
Inven-tories i
11,516
12,87317,02419, 22119,89719,122
17,92423,43528,02031,713
29, 72731,713
28, 50128,76829,06429,16129,43729, 72730,23630,42930, 71030,84831,22531,713
32,06232,07031,79331, 26630,823
Sales 2
5,112
5,8598,17210,34612,60313,402
12,37112,02015,67117, 587
17,12818,045
16,55216,22518,11717, 22916,77717, 87116,403
18, 78118,80717,98018,130
16,69116,42418,10716,76316,190
Ratio ofaverageinven-
tories tomonthly
sales8
2.11
2.061.781.781.521.46
1.501.681.671.70
1.701.71
1.711.761.601.691.751.661.831.671.631.641.731.74
1.911.951.761.881.92
Wholesale
Millions ofdollars
Inven-tories i
3,200
3,3574,1513,7023,5773,686
4,2165,8237,5458,315
7,9538,315
7,8507,8857,8697,7777,8017,9537,9308,1008,2438,4008,5178,315
8,5278,5678,4458,1527,884
Sales 2
2,505
2,7903,6504,0164,3304,505
4,7776,1387,3047,867
7,5588,176
7,6927,1217,7267,6527,3897,7667,7968,1618,2868,3768,2428,196
7,1636,8027,4896,9597,094
Ratio ofaverageinven-
tories tomonthly
1.21
1.171.041.01.82.83
.79
.78
.951.02
1.041.01
1.001.101.021.021.051.011.02.98.99.99
1.031.03
1.181.261.141.191.13
Retail trade
Millions ofdollars
Inven-tories i
5,285
5,7677,2627,3076,8726,906
7,04910,59112,42613,938
13,63713,938
12, 77913,62514,28014,16413,99213,63713,49813,97214, 69515,28415,65213,938
13, 53813,85514, 53414, 34413,831
Sales 2
3,504
3,8664,6244,8035,3105,798
6,3878,3999,86010,829
10,28811,371
9,6848,94810, 73410, 70510,78210,87410,73810,67411,05811,54211,01913,194
9,4168,91810, 52511,11710,805
Ratio ofaverageinven-
tories tomonthly
sales 8
1.53
1.481.481.721.371.29
1.191.101.221.30
.34
.28
.30
.48
.30
.33
.31
.27
.26
.291.301.301.401.12
1.461.541.351.301.30
1 Book value end of period.2 Monthly average shown for year and half year and total for month.3 Book value based on centered averages of month-end figures.4 Preliminary estimates based on incomplete data.NOTE.—The inventory figures in this table do not agree with the estimates of "change in business inven-
tories" included in the gross national product since they cover only manufacturing and trade rather thanall business, and show inventories in terms of current book value without adjustment for revaluationor seasonal variation.
Detail will not necessarily add to totals because of rounding.Source: Department of Commerce.
IO2
Digitized for FRASER http://fraser.stlouisfed.org/ Federal Reserve Bank of St. Louis
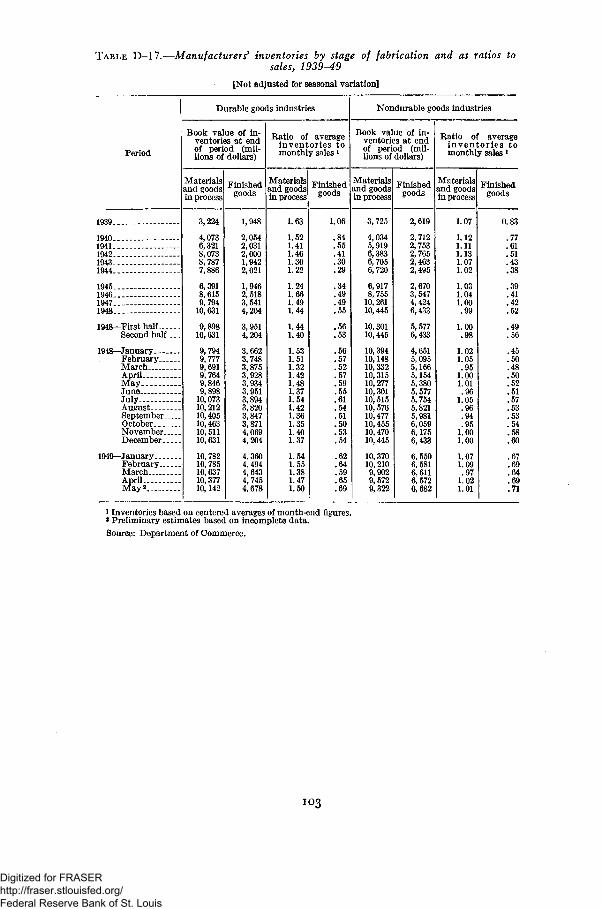
TABLE D-17.—Manufacturers' inventories by stage of fabrication and as ratios tosales, 1939-49
[Not adjusted for seasonal variation]
Period
Materialsand goodsin process
Durable goods industries
Book value of in-ventories at endof period (mil-lions of dollars)
Finishedgoods
Materialsand goodsin process
Ratio of averageinventories tomonthly sales l
Finishedgoods
Materialsand goodsin process
Nondurable goods industries
Book value of in-ventories at endof period (mil-lions of dollars)
Finishedgoods
Materialsand goodsin process
Ratio of averageinventor ies tomonthly sales *
Finishedgoods
1939..
1940..1941..1942..1943..1944..
1945..1946.1947.1948.
1948—First half--Second half—
1948—JanuaryFebruary-MarchApril -MayJuneJulyAugustSeptember-OctoberNovember. _December..
1949—JanuaryFebruary...MarchApril.Maya
3,224
4,0736,3218,0738,7877,886
6,3918,6159,794
10,631
9,89810,631
9,7949,7779,6919,7649,8469,89810,07310,21210,40510,46310,51110,631
10,78210,78510,63710,37710,142
1,948
2,0542,0312,0001,9422,021
1,9462,5183,5414,204
3,9514,204
3,6623,7483,8753,9283,9343,9513,8943,8203,8473,8714,0694,204
4,3604,4944,6434,7454,678
1.63
1.521.411.461.301.22
1.241.661.491.44
1.441.40
1.531.511.321.421.481.371.541.421.361.351.401.37
1.541.551.381.471.50
1.06
.84
.55
.41
.30
.29
.34
.49
.49
.55
.56
.53
.56
.57
.52
.57
.59
.55
.61
.54
.51
.50
.53
.54
.62
.64
.59
.65
3,725
4,0345,9196,3836,7056,720
6,9178,75510,26110,445
10,30110,445
10,39410,14810,33210,31510,27710,30110,51510,57610,47710,45510,47010,445
10,37010,2109,9029,5729,322
2,619
2,7122,7532,7652,4632,495
2,6703,5474,4246,433
5,5776,433
4,6515,0955,1665,1545,3805,5775,7545,8215,9816,0596,1756,433
6,5506,5816,6116,5726,682
1.07
1.121.111.131.071.02
1.031.041.00
1.00
1.021.05.95
1.001.01.96
1.05.96.94.95
1.001.00
1.071.09.97
1.021.01
0.83
.77
.61
.51
.43
.38
.39
.41
.42
.52
.49
.56
.45
.50
.48
.50
.52
.51
.57
.53
.53
.54
.58
.67
.69
.64
.69
.71
1 Inventories based on centered averages of month-end figures.2 Preliminary estimates based on incomplete data.Source: Department of Commerce.
IO3
Digitized for FRASER http://fraser.stlouisfed.org/ Federal Reserve Bank of St. Louis
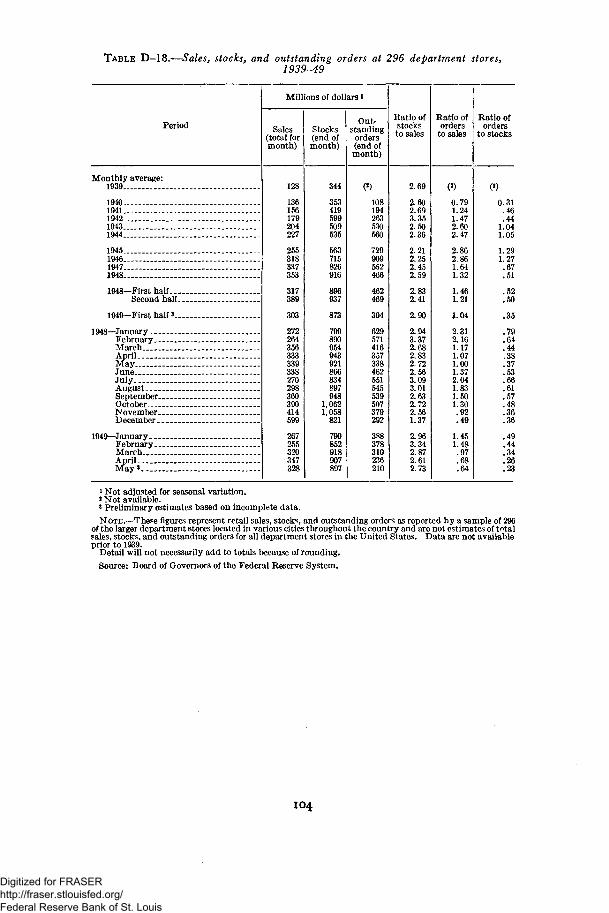
TABLE D—18.—Sales, stocks, and outstanding orders at 296 department stores,1939-49
Period
Millions of dollars i
Sales(total formonth)
128
136156179204227
255318337353
317389
303
272264356333339338270298360390414599
267255320347328
Stocks(end ofmonth)
344
353419599509535
563715826916
896937
873
799890954943921866834897948
1,0621,058
821
790852918907897
Out-standingorders(end ofmonth)
(2)
108194263530560
729909552466
462469
304
629571416357338462551545539507379292
388378310236210
Ratio ofstocksto sales
2.69
2.602.693.352.502.36
2.212.252.452.59
2.832.41
2.90
2.943.372.682.832.722.563.093.012.632.722.561.37
2.963.342.872.612.73
Ratio oforders
to sales
(2)
0.791.241.472.602.47
2.862.861.641.32
1.461.21
1.04
2.312.161.171.071.001.372.041.831.501.30
.92
.49
1.451.48
.97
.68
.64
Ratio oforders
to stocks
Monthly average:1939
1940-194119421943. „.1944
19451946.—19471948
1948—First half._.Second half.
1949—First half»..
1948—JanuaryFebruaryMarchAprilMayJune—JulyAugust-.SeptemberOctoberNovemberDecember
1949—JanuaryFebruaryMarchAprilMay»._ _.
(*)
0.31.46.44
1.041.05
1.291.27.67.51
.52
.50
.35
.79
.64
.44
.38
.37
.53
.66
.61
.57
.48
.36
.36
.49
.44
.34
.26
.23
1 Not adjusted for seasonal variation.2 Not available.• Preliminary estimates based on incomplete data.
NOTE.—These figures represent retail sales, stocks, and outstanding orders as reported by a sample of 296of the larger department stores located in various cities throughout the country and are not estimates of totalsales, stocks, and outstanding orders for all department stores in the United States. Data are not availableprior to 1939.
Detail will not necessarily add to totals because of rounding.
Source: Board of Governors of the Federal Reserve System.
IO4
Digitized for FRASER http://fraser.stlouisfed.org/ Federal Reserve Bank of St. Louis
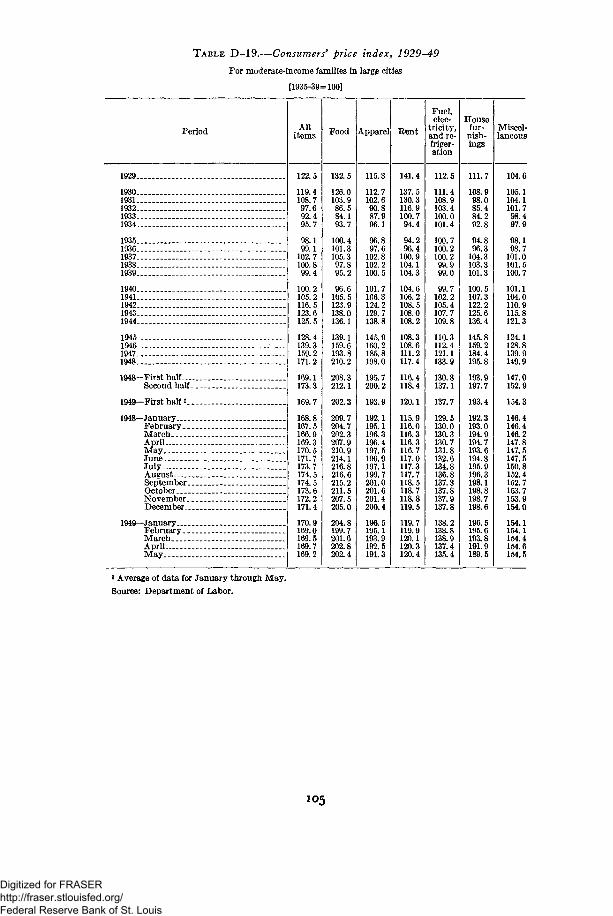
TABLE D-19.—Consumers' price index, 1929-49
For moderate-income families in large cities
[1935-39=100]
Period Allitems
122.5
119.4108.797.692.495.7
98.199.1
102.7100.899.4
100.2105.2116.5123.6125.5
128.4139.3159.2171.2
169.1173.3
169.7
168.8167.5166.9169.3170.5171.7173.7174.5174.5173.6172.2171.4
170.9169.0169.5169.7169.2
Food
132.5
126.0103.986.584.193.7
100.4101.3105.397.895.2
96.6105.5123.9138.0136.1
139.1159.6193.8210.2
208.3212.1
202.3
209.7204.7202.3207.9210.9214.1216.8216.6215.2211.5207.5205.0
204.8199.7201.6202.8202.4
Apparel
115.3
112.7102.690.887.996.1
96.897.6
102.8102.2100.5
101.7106.3124.2129.7138.8
145.9160.2185.8198.0
195.7200.2
193.9
192.1195.1196.3196.4197.5196.9197.1199.7201.0201.6201.4200.4
196.5195.1193.9192.5191.3
Rent
141.4
137.5130.3116.9100.794.4
94.296.4
100.9104.1104.3
104.6106.2108.5108.0108.2
108.3108.6111.2117.4
116.4118.4
120.1
115.9116.0116.3116.3116.7117.0117.3117.7118.5118.7118.8119.5
119.7119.9120.1120.3120.4
Fuel,elec-
tricity,and re-friger-ation
112.5
111.4108.9103.4100.0101.4
100.7100.2100.299.999.0
99.7102.2105.4107.7109.8
110.3112.4121.1133.9
130.8137.1
137.7
129.5130.0130.3130.7131.8132.6134.8136.8137.3137.8137.9137.8
138.2138.8138.9137.4135.4
Housefur-
nish-ings
111.7
108.998.085.484.292.8
94.896.3
104.3103.3101.3
100.5107.3122.2125.6136.4
145.8159.2184.4195.8
193.9197.7
193.4
192.3193.0194.9194.7193.6194.8195.9196.3198.1198.8198.7198.6
196.5195.6193.8191.9189.5
Miscel-laneous
1929
19301931193219331934
1935._._ __..1936193719381939
19401941194219431944
1945194619471948—_ -
1948—First half—Second half
1949—First half K
1948—JanuaryFebruary._MarchAprilMay __JuneJulyAugustSeptember.OctoberNovember.December _.
1949—JanuaryFebruary. _MarchAprilMay
104.6
105.1104.1101.798.497.9
98.198.7
101.0101.5100.7
101.1104.0110.9115.8121.3
124.1128.8139.9149.9
147.0152.9
154.3
146.4146.4146.2147.8147.5147.5150.8152.4152.7153.7153.9154.0
154.1154.1154.4154.6154.5
* Average of data for January through May.
Source: Department of Labor.
105
Digitized for FRASER http://fraser.stlouisfed.org/ Federal Reserve Bank of St. Louis
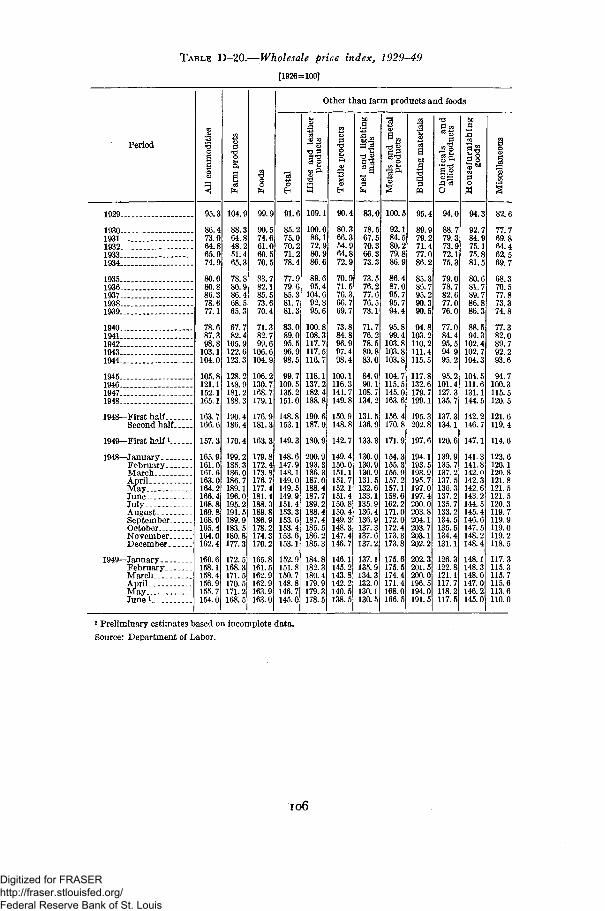
TABLE D-20.—Wholesale price index, 1929-49
[1926=100]
Period
Other than farm products and foods
11.103
1929..
19301931193219331934... - .
19351836....1937...19381939
1940 __194119421943.—1944....
1945194619471948
1948—First half
Second half
1949—First half»
1948—JanuaryFebruaryMarchAprilMayJuneJulyAugustSeptemberOctoberNovember ._December
1949—JanuaryFebruaryMarchAprilMayJune 1
95.
86.473.064.865.974.9
80.080.886.378.677.1
78.687.398.8
103.1104.0
105.8121.1152.1165.1
163.7166.6
157.3
165.9161.0161.163.0164.2166.4168.8169.8168.9165.4164.0162.4
160.6158.1158.4156.9155.7154.0
104.9
64.848.51.465.3
78.880.986.468.565.3
67.782.4
105.9122.6123.3
128.2148.181.2188.3
190.4186.4
170.4
199.2185.3186.0186.7189.1196.0195.2191.5189.9183.5180.8177.3
172.5168.3171.5170.5171.2168.5
99.9
90.574.661.060.570.5
83.82.185.573.670.4
71.382.799.6
106.6104.9
106.2130.7168.7179.1
176.9181.3
163.3
179.8172.4173.8176.7177.4181.4188.3189.8186.9178.2174.3170.2
165.8161.5162.9162.9163.9163.0
91.6
85.275.070.271.278.4
77.979.685.381.781.3
83.089.095.596.998.5
99.7109.5135.2151.0
148.8153.1
149.3
148.6147.9148.1149.0149.5149.9151.4153.3153.6153.4153.6153.1
152.9151.150.7148.8146.7145.0
109.1
100.086.172.980.986.6
89.695.4
104.92.895.6
100.8108.3117.7117.5116.7
118.1137.2182.4188.8
190.1187.0
180.9
200.9193.3186.3187.0188.4187.7189.2188.4187.4185.5186.2185.3
184.8182.3180.4179.9179.3178.5
90.4
80.366.354.964.872.9
70.971.576.366.769.7
73.884.896.997.498.4
100.1116.3141.7149.8
150.9148.!
142.7
149.4150.0151.1151. 7152.1151.4150.8150.4149.3148.3147.4146.7
146.1145.2143.8142.2140.5138.5
83.0
78.567.70.366.373.3
73.76.277.76.573.1
71.776.278.580.883.0
84.090.1
108.7134.2
131. 5136.9
133.3
130.0130.9130.9131.5132.6133.1135.9136.4136.9137.3137.6137.2
137.1135.9134.3132.0130.1130.5
100.5
92.184.580.279.886.9
86.487.095.795.794.4
95.899.4
103.8103.8103.8
104.7115.5145.0163. 6
156.4170.8
171.9
154.3155.3155.9157.2157.1158.6162.2171.0172.0172.4173.3173.8
175.6175.5174.4171.4168.0166.5
95.4
89.979.71.477.0
85.386.795.290.390.5
94.8103. 2110.2111.4115.5
117.8132.6179.7199.1
195.3202.8
197.6
194.1193.5193.9195.7197.0197.4200.0203.8204.1203.7203.1202.2
202.3201.5200.0196.5194.0191.5
94.0
88.779.373.972.175.3
79.078.782.677.076.0
77.084.495.594.995.2
95.2101.4127.3135.7
137.3134.1
120.6
139.9135.7137.2137.5136.3137.2135. 7133.2134.5135.5134.4131.1
126.3122.8121.1117.7118.2117.5
94.3
92.784.975.175.881.5
80.681.789.786.886.3
88.594.3
102.4102.7104.3
104.5111.6131.1144.5
142.2146.7
147.1
141.3141.8142.0142.3142.143.2144. 5145.4146.6147.5148.2148.4
148.1148.3148.0147.0146.2145.0
82.6
77.769.864.462.569.7
68.370.577.873.374.8
77.382.089.792.293.6
94.7100.3115.5120.5
121.6119.4
114.6
123.6120.1120.8121.8121. 5121.5120.3119.7119.9119.0119.2118.5
117.3115.3115.7115.6113.6110.0
1 Preliminary estimates based on incomplete data.Source: Department of Labor.
IO6
Digitized for FRASER http://fraser.stlouisfed.org/ Federal Reserve Bank of St. Louis
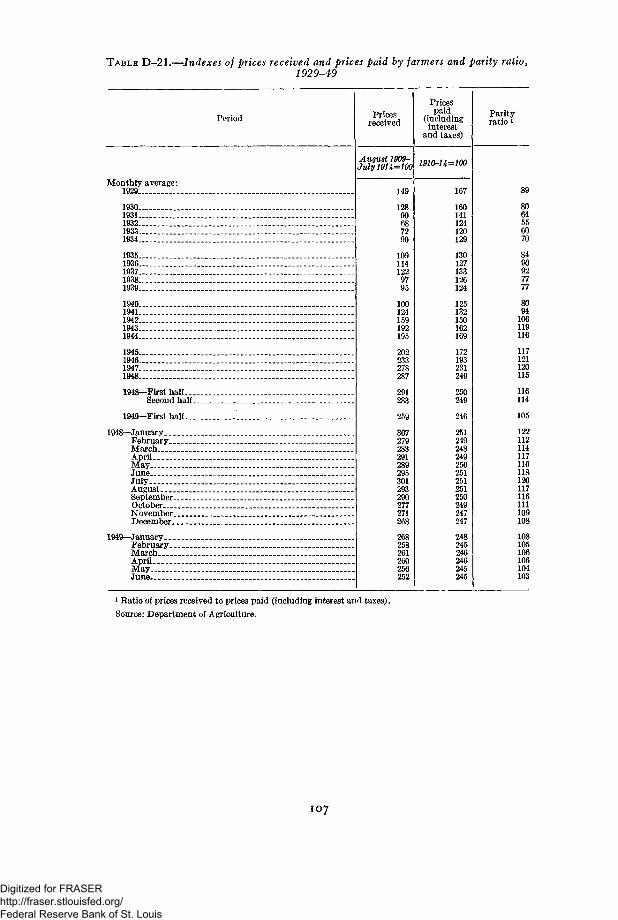
TABLE D-21.—Indexes of prices received and prices paid by farmers and parity ratio,1929-49
Monthly average:1929 .
1930 . .19311932 .19331934
19351936 .19371938 . . .1939
19401941 .1942 _19431944
1945194619471948 .
1948—First halfSecond half
1949—First half.
1948—JanuaryFebruaryMarchAprilMayJuneJuly .AugustSeptemberOctober. .NovemberDecember
1949—JanuaryFebruaryMarchApril . . .M a yJune __ __
Period Pricesreceived
August 1909-July 19U=100
149
12890687290
1091141229795
100124159192195
202233278287
291283
259
307279283291289295301293290277271268
268258261260256252
Pricespaid
(includinginterest
and taxes)
1910-1^100
167
160141124120129
130127133126124
125132150162169
172193231249
250249
246
251249248249250251251251250249247247
248245246246245245
Parityratio l
89
8064556070
8490927777
8094
106119116
117121120115
116114
105
122112114117116118120117116111109108
108105106106104103
1 Ratio of prices received to prices paid (including interest and taxes).
Source: Department of Agriculture.
107
Digitized for FRASER http://fraser.stlouisfed.org/ Federal Reserve Bank of St. Louis
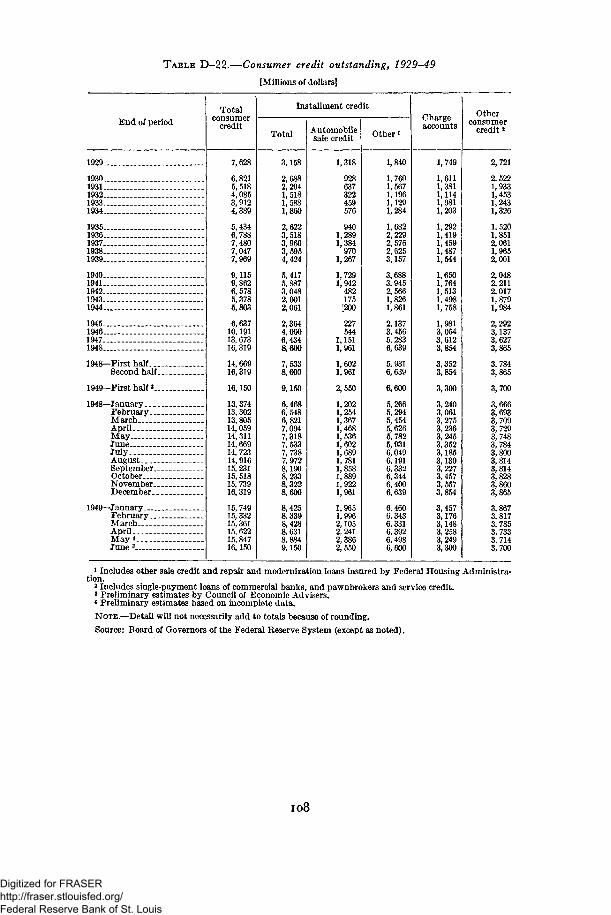
TABLE D-22.—Consumer credit outstanding, 1929-49
[Millions of dollars]
End of periodTotal
consumercredit
Installment credit
TotalAutomobilesale credit Other i
Chargeaccounts
Otherconsumer
credit 2
1929
1930193119321933.1934 ...
193519361937. _..19381939
19401941194219431944
1945194619471948-
1948—First half-..Second half.
1949—First half *..
1948—JanuaryFebruary. _.MarchAprilMay __.JuneJulyAugust-, . . .September-OctoberNovember,.December..
1949—JanuaryFebruary...MarchAprilMay *June 3
7,628
6,8215,5184,0853,9124,389
5,434
7,4807,0477,969
9,1159,8626,5785,3785,803
6,63710,19113, 67316,319
14, 66916,319
16,150
13,37413,30213, 80514,05914,31114, 66914,72314, 91615, 23115, 51815, 73916,319
15, 74915, 33215,36115,62215,84716,150
3,158
2,6882,2041,5181,5881,860
2,6223,5183,9603,5954,424
5,4175,8873,0482,0012,061
2,3644,0006,4348,600
7,5338,600
9,150
6,4686,5486,8217,0947,3187,5337,7387,9728,1908,2338,3228,600
8,4258,3398,4288,6318,8849,150
1,318
928637322459576
9401,2891,384970
1,267
1,7291,942482175[200
227544,̂151,961
,602,961
2,550
,202,254,367,468,536,602,689,781
,922,961
,965,996
2,1052,2412,3862,550
1,840
1,7601,5671,1961,1291,284
1,6822,2292,5762,6253,157
3,6883,9452,5661,8261,861
2,1373,4565,2836,639
5.9316,639
6,600
5,2665,2945,4545,6265,7825,9316,0496,1916,3326,3446,4006,639
6,4606,3436,3316,3926,4986,600
1,749
1,6111,3811,1141,0811,203
1,2921,4191,4591,4871,544
1,6501,7641,5131,4981,758
1,9813,0543,6123,854
3,3523,854
3,300
3,2403,0613,2753,2363,2453,3523,1853,1303,2273,4573,5573,854
3,4573,1763,1483,2583,2493,300
2,721
2.5221,9331,4531,2431,326
1,5201,8512,0611,9652,001
2,0482,2112,0171,8791,984
2,2923,1373,6273,865
3,7843,865
3,700
3,6663,6933,7093,7293,7483,7843,8003,8143,8143,8283,8603,865
3,8673,8173,7853,7333,7143,700
1 Includes other sale credit and repair and modernization loans insured by Federal Housing Administra-tion.
2 Includes single-payment loans of commercial banks, and pawnbrokers and service credit.3 Preliminary estimates by Council of Economic Advisers.4 Preliminary estimates based on incomplete data.
NOTE.—Detail will not necessarily add to totals because of rounding.
Source: Board of Governors of the Federal Reserve System (except as noted).
IO8
Digitized for FRASER http://fraser.stlouisfed.org/ Federal Reserve Bank of St. Louis
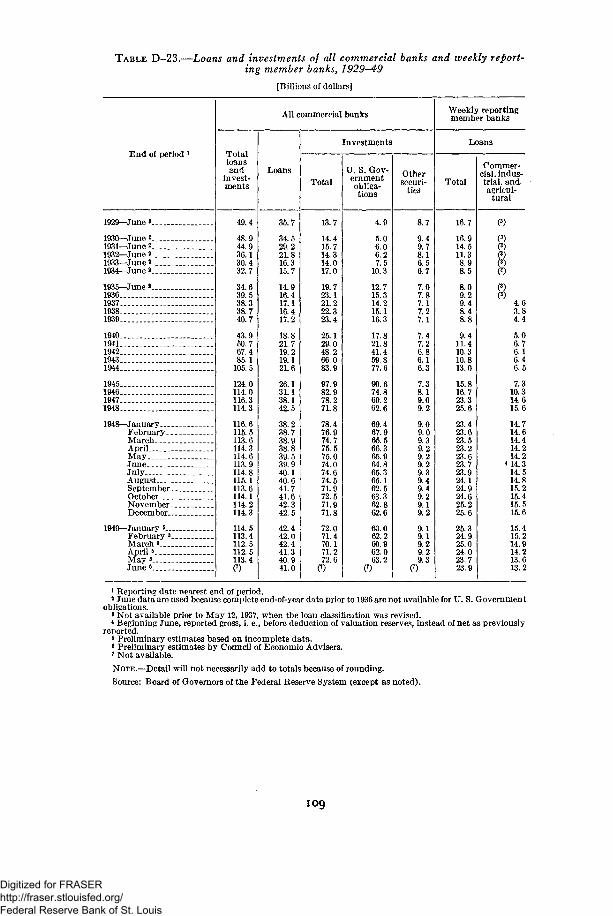
TABLE D-23.—Loans and investments of all commercial banks and weekly report-ing member banks, 1929-49
[Billions of dollars]
End of period 1
1929—June2-
1930—June 2 _ .1931—June2 _1932—June 2 _.1933—June2
1934—June2 _ .
1935—June 3
1936 . ._ . . .193719381939 . - .
19401941 _ _194219431944 .
19451946 .19471948
1948—JanuaryFebruary _MarchApril .May._JuneJuly . .AugustSeptember. .OctoberNovemberDecember.-. . _
1949—January 8
February 'March fi.April5
May fi.__ .June 6_
All commercial banks
Totalloansand
invest-ments
49.4
48.944.936.130.432.7
34.639.538.338.740.7
43.950.767.485.1
105.5
124.0114.0116.3114.3
116.6115.5113.6114.3114.6113.9114.8115.1113.6114.1114.2114.3
114.5113.4112.5112.5113.4
Loans
35.7
34.529.221.816.315.7
14.916.417.116 417.2
18 821.719.219.121.6
26 131.138.142.5
38.238.738.938 839.539.940.140 641.741.642.342.5
42.442.042.441.340.941.0
Total
13.7
14.415.714.314.017.0
19.723.121.222.323.4
25.129.048.266.083.9
97.982.978.271.8
78.476.974.775.575.074.074.674.571.972.571.971.8
72.071.470.171.272.6
Investments
U. S. Gov-ernmentobliga-tions
4.9
5.06.06.27.5
10.3
12.715.314.215.116.3
17.821.841.459.877.6
90.674.869.262.6
69.467.965.566.365.964.865.365.162.563.362.862.6
63.062.260.962.063.2
Othersecuri-
ties
8.7
9.49.78.16.56.7
7.07.87.17.27.1
7.47.26.86.16.3
7.38.19.09.2
9.09.09.39.29.29.29.39 49.49.29.19.2
9.19.19.29.29.3
Weekly reportingmember banks
U
Total
16.7
16.914.511.38.98.5
8.09.29.48.48.8
9.411.410.310.813.0
15.816.723.325.6
23.423.623.523.223.623.723.924.124.924.625.225.6
25.324.925.024.023.723.9
)ans
Commer-cial, indus-trial, and,agricul-
tural
(3)
(3)(3)(8)
4.63.84.4
5.06.76.16.46.5
7.310.314.615.6
14.714.614.414.214.2
* 14.314.514.815.215.415.515.6
15.415.214.914.213.613.2
1 Reporting date nearest end of period.2 June data are used because complete end-of-year data prior to 1936 are not available for U. S. Government
obligations.3 Not available prior to May 12, 1937, when the loan classification was revised.* Beginning June, reported gross, i. e., before deduction of valuation reserves, instead of net as previously
reported.5 Preliminary estimates based on incomplete data.6 Preliminary estimates by Council of Economic Advisers.7 Not available.
NOTE.—Detail will not necessarily add to totals because of rounding.
Source: Board of Governors of the Federal Reserve System (except as noted).
log
Digitized for FRASER http://fraser.stlouisfed.org/ Federal Reserve Bank of St. Louis
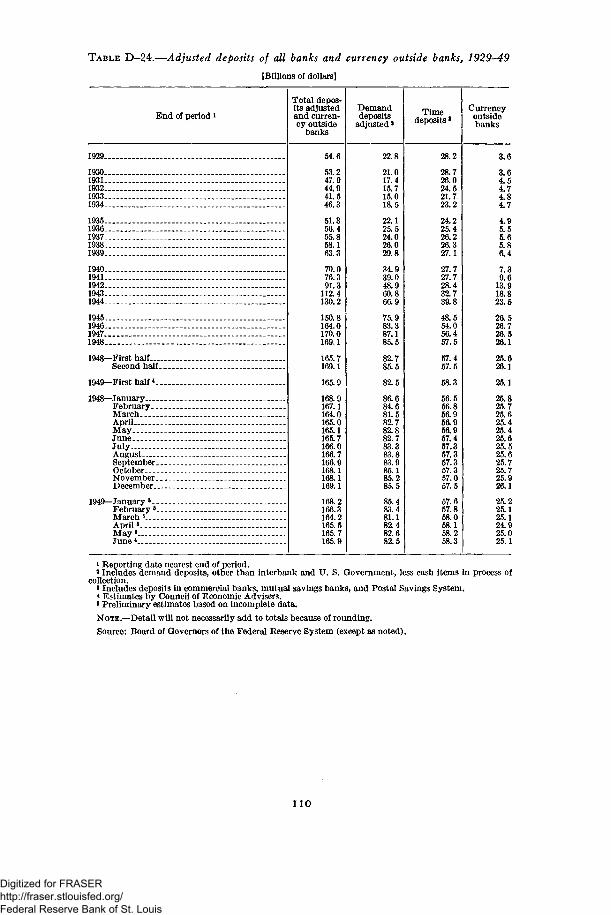
TABLE D-24.—Adjusted deposits of all banks and currency outside banks, 1929-49
[Billions of dollars]
End of period *
1929 _
193O._._ __.1931193219331934
1935. ._1936-.._193719381939.
1940-. .1941194219431944
1945194619471948 -
1948—First half—Second half.
1949—First half *.
1948—JanuaryFebruary..MarchAprilMayJuneJulyAugustSeptember.OctoberNovember.December.-
1949—January 6-_February 5_March 5
April*May 8
June 4
Total depos-its adjustedand curren-cy outside
banks
54.6
53.247.944.941.546.3
51.356.455.858.163.3
70.076.391.3
112.4130.2
150.8164.0170.0169.1
165.7169.1
165.9
168.9167.1164.0165.0165.1165.7166.0166.7166.9168.1168.1169.1
168.2166.3164.2165.5165.7165.9
Demanddeposits
adjustedJ
22.8
21.017.415.715.018.5
22.125.524.026.029.8
34.939.048.960.866.9
75.983.387.185.5
82.785.5
82.5
86.684.681.582.782.882.783.383.883.985.185.285.5
85.483.481.182.482.682.5
Timedeposits *
28.2
28.726.024.521.723.2
24.225.426.226.327.1
27.727.728.432.739.8
48.554.056.457.5
57.457.5
58.3
56.556.856.956.956.957.457.357.357.357.357.057.5
57.657.858.058.158.258.3
Currencyoutsidebanks
3.6
3.64.54.74.84.7
4.95.55.65.86.4
7.39.6
13.918.823.5
26.526.726.526.1
25.626.1
25.1
25.825.725.625.425.425.625.525.625.725.725.926.1
25.225.125.124.925.025.1
i Reporting date nearest end of period.»Includes demand deposits, other than interbank and 17. S. Government, less cash items in process of
collection.3 Includes deposits in commercial banks, mutual savings banks, and Postal Savings System.4 Estimates by Council of Economic Advisers.5 Preliminary estimates based on incomplete data.
NOTE.—Detail will not necessarily add to totals because of rounding.
Source: Board of Governors of the Federal Reserve System (except as noted).
I I O
Digitized for FRASER http://fraser.stlouisfed.org/ Federal Reserve Bank of St. Louis
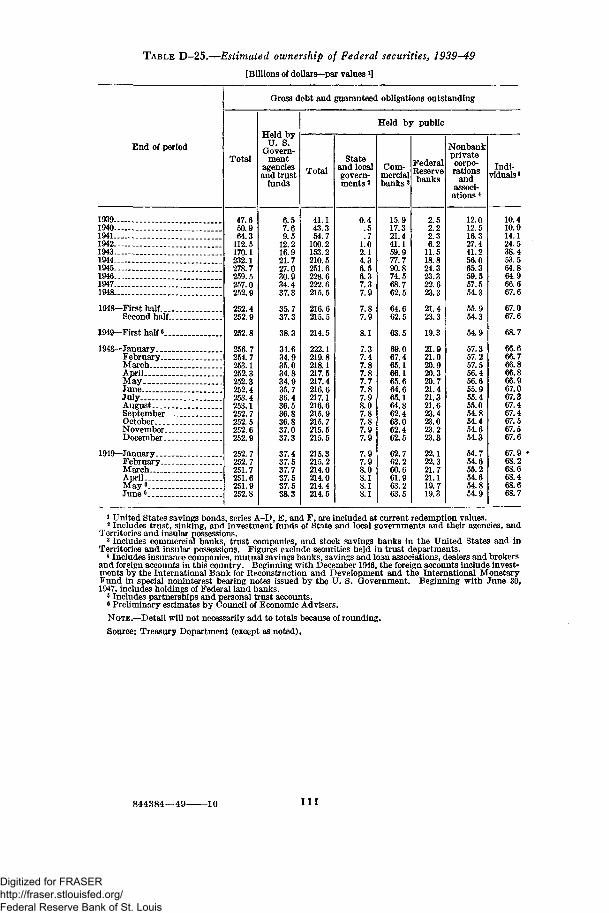
TABLE D-25.—Estimated ownership of Federal securities, 1939-49
[Billions of dollars—par values *]
End of period
193919401941 __1942.-.1943.1944-. _.194519461947 __1948-
1948—First half _Second half
1949—First half •
1948—JanuaryFebruary.. _MarchApril __May_JuneJuly _August __ _ .SeptemberOctober-November _ _.December
1949—JanuaryFebruary. _ __MarchApril _.May 6 _.June6
Gross debt and guaranteed obligations outstanding
Total
47.650.964.3
112.5170.1232.1278.7259 5257.0252.9
252.4252.9
252.8
256 7254.7253.1252.3252.3252 4253.4253.1252.7252.5252.6252.9
252.7252.7251 7251.6251.9252.8
Held byU. S.
Govern-ment
agenciesand trust
funds
6.57.69 5
12.216.921.727.030 934.437.3
35.737.3
38.3
34 634.935.034.834.935 736.436.536.836.837.037.3
37.437.537.737.537.538.3
Total
41.143.354.7
100.2153.2210.5251.6228 6222.6215.5
216.6215.5
214.5
222.1219.8218.1217.5217.4216 6217.1216.6215.9215.7215.5215.5
215.3215.2214.0214.0214.4214.5
Stateand localgovern-ments *
0.4.5.7
1.02.14.36.56.37.37.9
7.87.9
8.1
7 37.47.87.87.77.87.98.07.87.87.97.9
7.97.98.08.18.18.1
Held bj
Com-mercialbanks 3
15.917.321.441.159.977.790.874.568.762.5
64.662.5
63.5
69.067.465.166.165.664.665.164.862.463.062.462.5
62.762.260.661.963.263.5
r public
FederalReservebanks
2.52.22.36.2
11.518.824.323.322.623.3
21.423.3
19.3
21.921.020.920.320.721.421.321.623.423.023.223.3
22.122.321.721.119.719.3
Nonbankprivatecorpo-rations
andassoci-ations *
12.012.516.327.441.256.065.359.557.554.3
55.954.3
54.9
57.357.257.556.456.655.955.455.054.854.454.654.3
54.754.655.254.654.854.9
Indi-viduals •
10.410.914.124.538.453.564.864.966.667.6
67.067.6
68.7
66.666.766.866.866.967.067.367.467.467.567.567.6
67.968.268.668.468.668.7
1 United States savings bonds, series A-D, E, and F, are included at current redemption values.2 Includes trust, sinking, and investment funds of State and local governments and their_agencies, and
Territories and insular possessions.3 Includes commercial banks, trust companies, and stock savings banks in the United States and in
Territories and insular possessions. Figures exclude securities held in trust departments.4 Includes insurance companies, mutual savings banks, savings and loan associations, dealers and brokers
and foreign accounts in this country. Beginning with December 1946, the foreign accounts include invest-ments by the International Bank for Reconstruction and Development and the International MonetaryFund in special noninterest bearing notes issued by the U. S. Government. Beginning with June 30,1947, includes holdings of Federal land banks.
8 Includes partnerships and personal trust accounts.• Preliminary estimates by Council of Economic Advisers.
NOTE.—Detail will not necessarily add to totals because of rounding.
Source: Treasury Department (except as noted).
844384—49 I I I
Digitized for FRASER http://fraser.stlouisfed.org/ Federal Reserve Bank of St. Louis
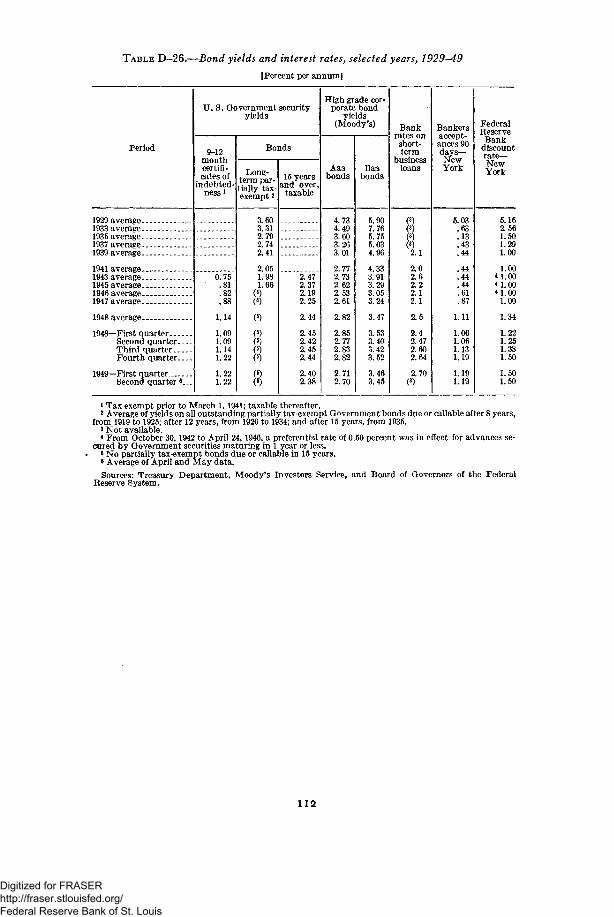
TABLE D-26.—Bond yields and interest rates} selected years, 1929-49
[Percent per annum]
Period
U. S. Government securityyields
9-12monthcertifi-cates of
indebted-ness1
Bonds
Long- Iterm par-tially tax-exempt 2
15 yearsand over,
taxable
High grade cor-porate bond
yields(Moody's)
Aaabonds
Baabonds
Bankrates onshort-term
businessloans
(3)(3)(3)(3)2.1
2.02.62.22.12.1
2.5
2.42.472.602.64
2.70(3)
Bankersaccept-ances 90d a y s -NewYork
5.03.63.13.43.44
.44
.44
.44
.61
.87
1.11
1.061.061.131.19
1.191.19
FederalReserve
Bankdiscountr a t e -NewYork
1929 average.1933 average .1935 average .1937 average .1939 average.
1941 average .1943 average.1945 average.1946 average.1947 average .
1948 average .
3.603.31
1948—First quarterSecond quarter.Third quarterFourth quarter.
1949—First quarter....Second quarter e
0.75.81.82
1.14
1.091.091.141.22
1.221.22
2.792.742.41
2.051.981.66
82.472.372.192.25
2.44
2.452.422.452.44
2.402.38
4.734.493.603.263.01
2.772.732.622.532.61
2.82
2.852.772.832.82
2.712.70
5.907.765.755.034.96
4.333.913.293.053.24
3.47
3.533.403.423.52
3.463.45
5.162.561.501.291.00
1.00* 1.00<1.00U.00
1.00
1.34
.22
.25
.38
.50
.50..50
1 Tax exempt prior to March 1,1941; taxable thereafter.2 Average of yields on all outstanding partially tax-exempt Government bonds due or callable after 8 years,
from 1919 to 1925; after 12 years, from 1926 to 1934; and after 15 years, from 1935.3 Not available.* From October 30,1942 to April 24, 1946, a preferential rate of 0.50 percent was in effect for advances se-
cured by Government securities maturing in 1 year or less.* No partially tax-exempt bonds due or callable in 15 years.* Average of April and May data.Sources: Treasury Department, Moody's Investors Service, and Board of Governors of the Federal
Reserve System.
1 1 2
Digitized for FRASER http://fraser.stlouisfed.org/ Federal Reserve Bank of St. Louis
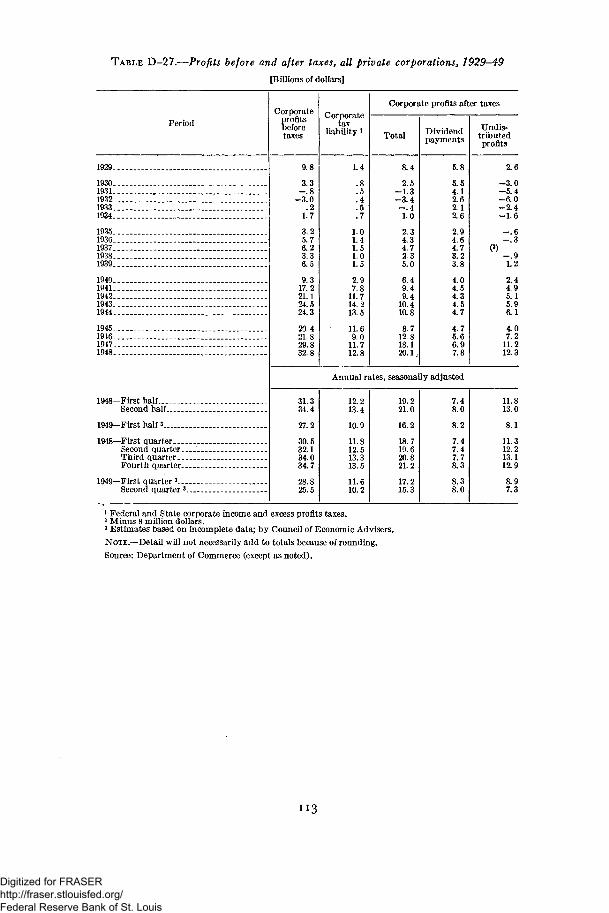
TABLE D-27.—Profits before and after taxes, all private corporations, 1929-49[Billions of dollars]
PeriodCorporate
profitsbeforetaxes
Corporatetax
liability l
Corporate profits after taxes
Total Dividendpayments
Undis-tributedprofits
1929.
1930193119321933.1934.
19351936193719381939
19401941194219431944
1945194619471948
1948—First half.Second half
1949—First half 3
1948—F irst quarter. _.Second quarter.Third quarter..Fourth quarter.
1949—First quarter *_.Second quarter
3.3- . 8
-3 .0.2
1.7
3.25.76.23.36.5
9.317.221.124.524.3
20.421.829.832.8
31.334.4
27.2
30.532.134.034.7
28.825.5
1.4
.5
.4
.5
.7
1.01.41.51.01.5
2.97.8
11.714.213.5
11.69.0
11.712.8
8.4
2.5- 1 . 3- 3 . 4- . 41.0
2.34.34.72.35.0
6.49.49.4
10.410.8
8.712.818.120.1
5.8
5.54.12.62.12.6
2.94-64.73.23.8
4.04.54.34.54.7
4.75.66.97.8
Annual rates, seasonally adjusted
12.213.4
10.9
11.812.513.313.5
11.610.2
19.221.0
16.2
18.719.620.821.2
17.215.3
7.48.0
8.2
7.47.47.78.3
8.38.0
2.6
- 3 . 0-5 .4- 6 . 0-2 .4- 1 . 6
- . 6- . 3
1.2
2.44.95.15.96.1
4.07.2
11.212.3
11.813.0
8.1
11.312.213.112.9
8.97.3
3 Federal and State corporate income and excess profits taxes.2 Minus 8 million dollars.3 Estimates based on incomplete data; by Council of Economic Advisers.
NOTE.—Detail will not necessarily add to totals because of rounding.
Source: Department of Commerce (except as noted).
Digitized for FRASER http://fraser.stlouisfed.org/ Federal Reserve Bank of St. Louis
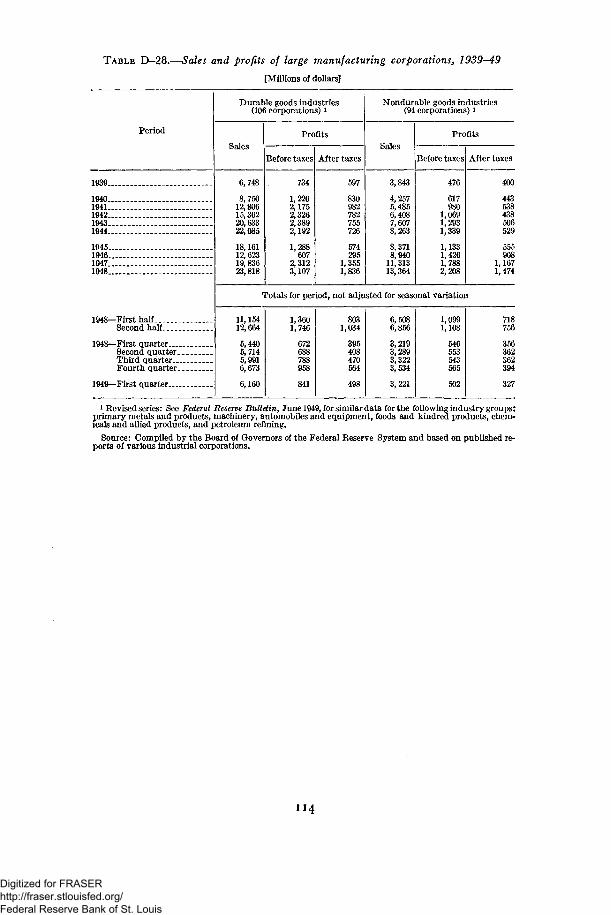
TABLE D-28.—Sales and profits of large manufacturing corporations3 1939-49
[Millions of dollars]
Period
1939 _. .-
19401941 _.194219431944 .
1945 . _ _194619471948
1948—First halfSecond half
1948—First quarter ___Second quarterThird quarter.Fourth quarter
1949—First quarter
Durable goods industries(106 corporations) i
Sales
6,748
8,75012,80615,36220,63322,085
18,16112,62319, 83623,818
Profits
Before taxes
734
1,2262,1752,3262,3892,192
1,288607
2,3123,107
After taxes
597
830982782755726
574295
1,3551,836
Nondurable goods industries(94 corporations) *
Sales
3,843
4,2575,4856,4087,6078,263
8,3718,940
11,31313,364
Profits
Before taxes
476
617980
1,0691,2931,339
1,1331,4261,7882,208
After taxes
400
443538438506529
555908
1,1671,474
Totals for period, not adjusted for seasonal variation
11,15412,664
5,4405,7145,9916,673
6,160
1,3601,746
672688788958
841
8031,034
395408470564
498
6,5086,856
3,2193,2893,3223,534
3,221
1,0991,108
546553543565
502
718756
356362362394
327
1 Revised series: See Federal Reserve Bulletin, June 1949, for similar data for the following industry groups;primary metals and products, machinery, automobiles and equipment, foods and kindred products, chem-icals and allied products, and petroleum refining.
Source: Compiled by the Board of Governors of the Federal Reserve System and based on published re-ports of various industrial corporations.
" 4
Digitized for FRASER http://fraser.stlouisfed.org/ Federal Reserve Bank of St. Louis
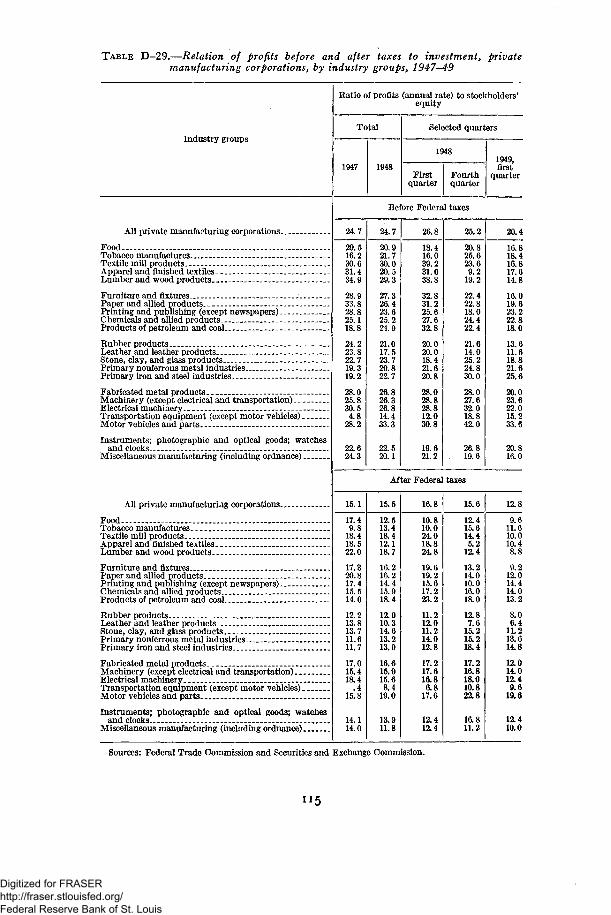
TABLE D-29.—Relation of profits before and after taxes to investment, privatemanufacturing corporations, by industry groups, 1947—49
Industry groups
Ratio of profits (annual rate) to stockholders'equity
Total
1947 1948
Selected quarters
1948
Firstquarter
Fourthquarter
1949,first
quarter
All private manufacturing corporations
Food .-- -_.Tobacco manufacturesTextile mill products - _Apparel and finished textiles.Lumber and wood products
Furniture and fixtures. -Paper and allied products _Printing and publishing (except newspapers)Chemicals and allied products.Products of petroleum and coal -
Rubber products..-Leather and leather products..Stone, clay, and glass productsPrimary nonferrous metal industriesPrimary iron and steel industries
Fabricated metal productsMachinery (except electrical and transportation) __Electrical machineryTransportation equipment (except motor vehicles)Motor vehicles and parts
Instruments; photographic and optical goods; watchesand clocks
Miscellaneous manufacturing (including ordnance)
All private manufacturing corporations...
Food _Tobacco manufactures, _ _ -Textile mill products _Apparel and finished textilesLumber and wood products
Furniture and fixturesPaper and allied productsPrinting and publishing (except newspapers)Chemicals and allied products..Products of petroleum and coal
Rubber productsLeather and leather productsStone, clay, and glass productsPrimary nonferrous metal industries. _Primary iron and steel industries
Fabricated metal products _Machinery (except electrical and transportation)Electrical machineryTransportation equipment (except motor vehicles)Motor vehicles and parts
Instruments; photographic and optical goods; watchesand clocks
Miscellaneous manufacturing (including ordnance)
Before Federal taxes
24.7
29.516.230.631.434.9
28.933.828.825.118.8
24.223.822.719.319.2
28.025.830.5
4.828.2
22.624.3
24.7
20.921.730.020.529.3
27.326.423.625.224.9
21.017.523.720.822.7
26.826.326.814.433.3
22.520.1
26.8
18.416.039.231.638.8
32.831.225.627.632.8
20.020.018.421.620.8
28.028.828.812.030.8
19.621.2
25.2
20.825.623.69.2
19.2
22.422.818.024.422.4
21.614.025.224.830.0
28.027.632.018.842.0
26.819. 6
After Federal taxes
15.1
17.49.8
18.418.522.0
17.320.817.415.514.0
12.213.813.711.611.7
17.015.418.4
.415.8
14.114.0
15.5
12.513.418.412.118.7
16.216.214.415.918.4
12.010.314.613.213.9
16.615.915.68.4
19.0
13.911.8
16.8
10.810.024.018.824.8
19.619.215.617.223.2
11.212.011.214.012.8
17.217.616.86.8
17.6
12.412.4
15.6
12.415.614.45.2
12.4
13.214.010.016.018.0
12.87.6
15.215.218.4
17.216.818.010.822.8
16.811.2
20.4
16.818.416.817.614.8
16.019.623.222.818.0
13.611.618.821.625.6
20.023.622.015.2
20.816.0
12.8
9.611.610.010.48.8
9.212.014.414.013.2
8.06.4
11.213.614.8
12.014.012.49.6
19.6
12.410.0
Sources: Federal Trade Commission and Securities and Exchange Commission.
Digitized for FRASER http://fraser.stlouisfed.org/ Federal Reserve Bank of St. Louis
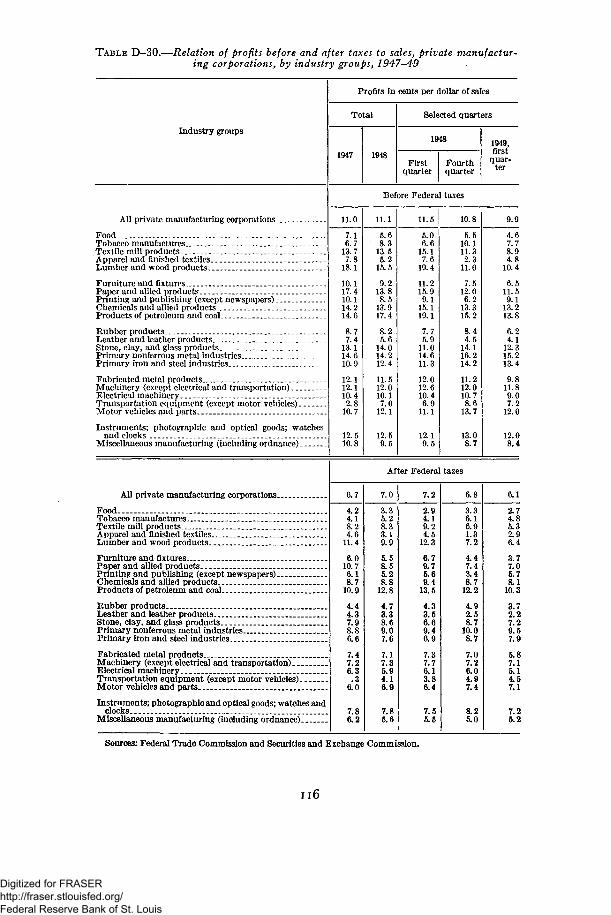
TABLE D-30.—Relation of profits before and after taxes to sales, private manufactur-ing corporations, by industry groups, 1947-49
Industry groups
Profits in cents per dollar of sales
Total
1947 1948
Selected quarters
1948
Firstquarter
Fourthquarter
1949,first
quar-ter
Before Federal taxes
All private manufacturing corporations
FoodTobacco manufactures.Textile mill productsApparel and finished textilesLumber and wood products
Furniture and fixtures...Paper and allied productsPrinting and publishing (except newspapers)Chemicals and allied products...Products of petroleum and coal
Rubber products.Leather and leather productsStone, clay, and glass productsPrimary nonferrous metal industriesPrimary iron and steel industries
Fabricated metal products.Machinery (except electrical and transportation)Electrical machineryTransportation equipment (except motor vehicles)Motor vehicles and parts
Instruments; photographic and optical goods; watchesand clocks
Miscellaneous manufacturing (including ordnance)
11.0
7.16.7
13.77.8
18.1
10.117.410.114.214.6
8.77.4
13.114.610.9
12.112.110.42.8
10.7
12.510.8
11.1
5.68.3
13.55.2
15.5
9.213.88.5
13.917.4
8.25.6
14.014.212.4
11.512.010.17.0
12.1
12.59.5
11.5
5.06.6
15.17.6
19.4
11.215.99.1
15.119.1
7.75.9
11.014.611.3
12.012.610.46.9
11.1
12.19.5
10.8
5.510.111.32.3
11.0
7.512.06.2
13.315.2
8.44.5
14.116.214.2
11.212.010.78.6
13.7
13.08.7
9.9
4.67.78.94.8
10.4
6.511.59.1
13.213.8
6.24.1
12.315.213.4
9.811.89.07.2
12.0
12.08.4
After Federal taxes
All private manufacturing corporations..
FoodTobacco manufactures-Textile mill products ._Apparel and finished textiles..Lumber and wood products..
Furniture and fixturesPaper and allied productsPrinting and publishing (except newspapers).Chemicals and allied productsProducts of petroleum and coal __
Rubber products _Leather and leather products.Stone, clay, and glass productsPrimary nonferrous metal industriesPrimary iron and steel industries. _
Fabricated metal productsMachinery (except electrical and transportation)...Electrical machineryTransportation equipment (except motor vehicles).Motor vehicles and parts
Instruments; photographic and optical goods; watches andclocks
Miscellaneous manufacturing (including ordnance).
6.7
4.24.18.24.6
11.4
6.010.76.18.7
10.9
4.44.37.98.86.6
7.47.26.3
. 36.0
7.86.2
7.0
3.35.28.33.19.9
5.58.55.28.8
12.8
4.73.38.69.07.6
7.17.35.94.16.9
7.85.6
7.2
2.94.19.24.5
12.3
6.79.75.69.4
13.5
4.33.56.69.46.9
7.37.76.13.86.4
7.55.5
6.8
3.36.16.91.37.2
4.47.43.48.7
12.2
4.92.58.7
10.08.7
7.07.26.04.97.4
8.25.0
6.1
2.74.85.32.96.4
3.77.05.78.1
10.3
3.72.27.29.57.9
5.87.15.14.57.1
7.25.2
Sources: Federal Trade Commission and Securities and Exchange Commission.
n6
Digitized for FRASER http://fraser.stlouisfed.org/ Federal Reserve Bank of St. Louis
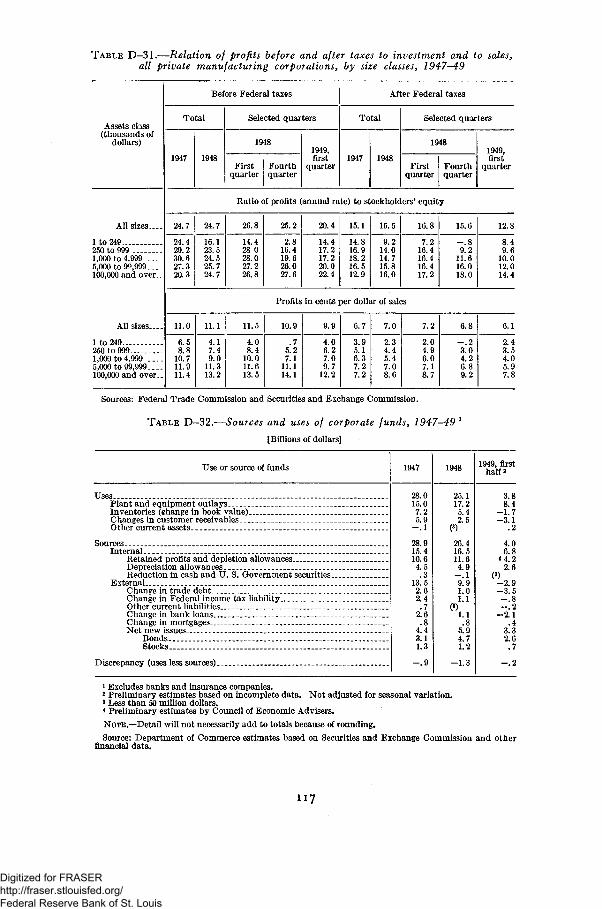
TABLE D—31.—Relation of profits before and after taxes to investment and to sales,all private manufacturing corporations, by size classes, 1947—49
Assets class(thousands of
dollars)
All sizes—.
1 to 249250 to 9991,000 to 4,9995,000 to 9P,999100,000 and over.-
All sizes
1 to 249250 to 9991,000 to 4.9995,000 to 99,999100,000 and over..
Before Federal taxes
Total
1947 1948
Selected quarters
1948
Firstquarter
Fourthquarter
1949,first
quarter
After Federal taxes
Total
1947 1948
Selected quarters
1948
Firstquarter
Fourthquarter
1949,first
quarter
Ratio of profits (annual rate) to stockholders' equity
24.7
24.429.230.627.320.3
24.7
16.123.524.525.724.7
26.8
14.428 028.027.226.8
25.2
2.816.419.626.027.6
20.4
14.417.217.220.022.4
15.1
14.816.918.216.512.9
15.5
9.214.014.715.816.0
16.8
7.216.416.416.417.2
15.6
- . 89.2
11.616.018.0
12.8
8.49.6
10.012.014.4
Profits in cents per dollar of sales
11.0
6.58.8
10.711.911.4
11.1
4.17.49.0
11.313.2
11.5
4.08.4
10.011.613.5
10.9
.75.27.1
11.114.1
9.9
4.06.27.09.7
12.2
6.7
3.95.16.37.27.2
7.0
2.34.45.47.08.6
7.2
2.04.96.07.18.7
6.8
- . 23.04.26.89.2
6.1
2.43.54.05.97.8
Sources: Federal Trade Commission and Securities and Exchange Commission.
TABLE D-32.—Sources and uses of corporate funds, 1947-49 1
[Billions of dollars]
Use or source of funds 1947
28.015.0
7.25.9
- . 1
28.915.410.64.5
.313.5
2.62.4
.72.6
o4.43.11.3
- . 9
1948
25.117.2
5.42.5
(3)
26.416.511.64.9
- . 19.91.01.1
(3)1.1
Q
5.94.71.2
- 1 . 3
1949, firsthalf 2
UsesPlant and equipment outlaysInventories (change in book value)Changes in customer receivablesOther current assets
SourcesInternal
Retained profits and depletion allowancesDepreciation allowancesReduction in cash and U. S. Government securities
ExternalChange in trade debtChange in Federal income tax liability..Other current liabilitiesChange in bank loansChange in mortgagesNet new issues _
BondsStocks
Discrepancy (uses less sources) _.
3.88.4
- 1 . 7- 3 . 1
.2
4.06.8
<4.22.6
00- 2 . 9- 3 . 5- . 8- . 2
- 2 . 1.4
3.32.6.7
- . 2
1 Excludes banks and insurance companies.2 Preliminary estimates based on incomplete data. Not adjusted for seasonal variation.3 Less than 50 million dollars.4 Preliminary estimates by Council of Economic Advisers.
NOTE.—Detail will not necessarily add to totals because of rounding.
Source: Department of Commerce estimates based on Securities and Exchange Commission and otherfinancial data.
117
Digitized for FRASER http://fraser.stlouisfed.org/ Federal Reserve Bank of St. Louis
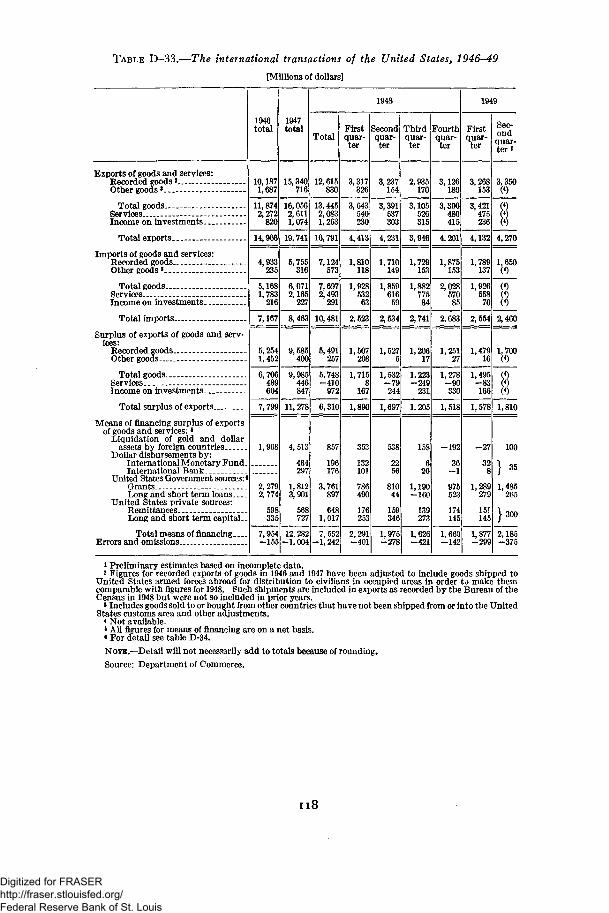
TABLE D-33.—The international transactions of the United States, 1946-49
[Millions of dollars]
Exports of goods and services:Recorded coods'Other goods3
Total goodsServices --Income on investments
Total exports.
Imports of goods and services:Recorded goodsOther goods3
Total goodsServicesIncome on investments
Total imports.—
Surplus of exports of goods and serv-ices:
Recorded goodsOther goods
Total goodsServices _Income on investments
Total surplus of exports
Means of financing surplus of exportsof goods and services:5
Liquidation of gold and dollarassets by foreign countries
Dollar disbursements by:International Monetary Fund.International Bank
United States Government sources:«Grants .._ _.Long and short term loans
United States private sources:RemittancesLong and short term capital._
Total means of financingErrors and omissions
1946total
10,1871,687
11,8742,272
820
14,966
4,933235
5,1681,783
216
7,167
5,2541,452
6,706489604
7,799
1,968
2,2792,774
598335
7,954-155
1947total
15,340716
16,0562,6111,074
19,741
5,755316
6,0712,165
227
8,463
9,585400
9,985446847
11,278
4,513
464297
1,8123,901
568727
12, 282-1,004
1948
Total
12,615830
13,4452,0831,263
16,791
7,124573
7,6972,493
291
10,481
5,491257
5,748-410
972
6,310
857
196176
3,761897
6481,017
7,552-1,242
Firstquar-ter
3,317326
3,643540230
4,413
1,810118
1,92853263
2,523
1,507208
1,7158
167
1,890
353
132101
786490
176253
2,291-401
Secondquar-ter
3,237154
3,391537303
4,231
1,710149
1,859616
59
2,534
1,5275
1,532- 7 9244
1,697
538
2256
81044
159346
1,975-278
Thirdquar-ter
2,935170
3,105526315
3,946
1,729153
1,88277584
2,741
1,20617
1,223-249
231
1,205
158
620
1,190—160
139273
1,626-421
Fourthquar-ter
3,126180
3,306480415
4,201
1,875153
2,02857085
2,683
1,25127
1,278- 9 0330
1,518
-192
36—1
975523
174145
1.660-142
1949
Firstquar-ter
3,268153
3,421475236
4,132
1,789137
1,92655870
2,554
1,47916
1,495- 8 3166
1,578
- 2 7
328
1,289279
151145
1,877-299
Sec-ondquar-ter i
3,350
14,270
1,650
82,460
1,700
I1,810
100
1,485265
} 300
2,185-375
» Preliminary estimates based on incomplete data.2 Figures for recorded exports of goods in 1946 and 1947 have been adjusted to include goods shipped to
United States armed forces abroad for distribution to civilians in occupied areas in order to make themcomparable with figures for 1948. Such shipments are included in exports as recorded by the Bureau of theCensus in 1948 but were not so included in prior years.
»Includes goods sold to or bought from other countries that have not been shipped from or into the UnitedStates customs area and other adjustments.4 Not available.
• All figures for means of financing are on a net basis.• For detail see table D-34.NOTE.—Detail will not necessarily add to totals because of rounding.Source: Department of Commerce.
118
Digitized for FRASER http://fraser.stlouisfed.org/ Federal Reserve Bank of St. Louis
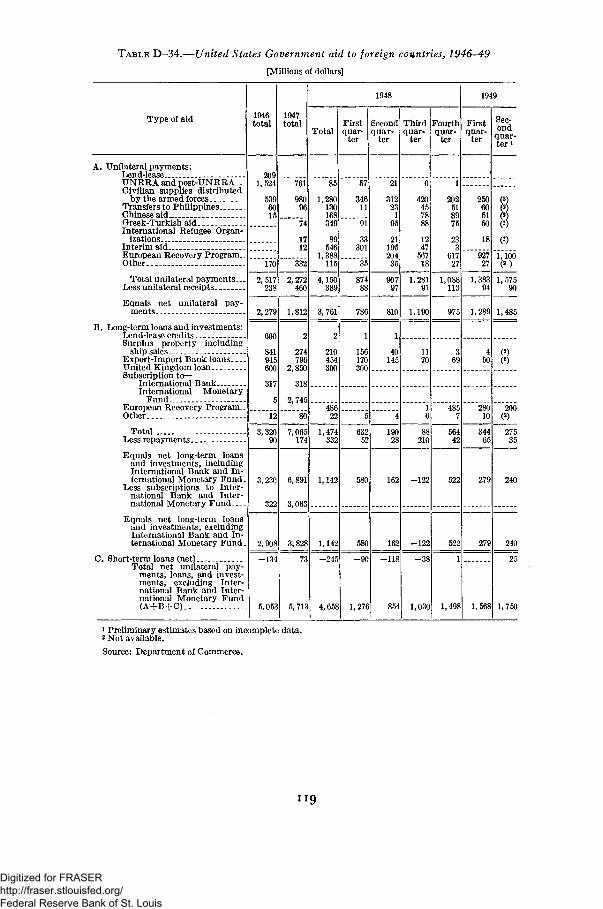
TABLE D-34.—United States Government aid to foreign countries, 1946-49
[Millions of dollars]
Type of aid
A. Unilateral payments:Lend-leaseUNRRA and post-UNRRA...Civilian supplies distributed
by the armed forcesTransfers to PhilippinesChinese aidGreek-Turkish aidInternational Refugee Organ-
izationsInterim aid- _ _European Recovery Program..Other
Total unilateral payments.—Less unilateral receipts
Equals net unilateral pay-ments
B. Long-term loans and investments:Lend-lease creditsSurplus property including
ship salesExport-Import Bank loansUnited Kingdom loanSubscription t o -
International BankInternational Monetary
FundEuropean Recovery ProgramOther —
Total.Less repayments
Equals net long-term loansand investments, includingInternational Bank and In-ternational Monetary Fund.
Less subscriptions to Inter-national Bank and Inter-national Monetary Fund
Equals net long-term loansand investments, excludingInternational Bank and In-ternational Monetary Fund.
0. Short-term loans (net)Total net unilateral pay-
ments, loans, and invest-ments, excluding Inter-national Bank and Inter-national Monetary Fund(A+B+C)
1946total
2091,524
5396015
170
2,517238
2,279
600
841945600
317
5
12
3,32090
3,230
322
2,908
-134
5,053
1947total
761
98096
74
1712
332
2,272460
1,812
2
274796
2,850
318
2,745
80
7,065174
6,891
3,063
3,828
73
5,713
1948
Total
85
1,280130168349
89546
1,388115
4,150389
3,761
2
210454300
48622
1,474332
1,142
1,142
-245
4,658
Firstquar-
ter
57
34611
91
33301
35
87488
786
1
156170300
5
63252
580
580
- 9 0
1,276
Secondquar-
ter
21
31223
195
21195204
35
90797
810
1
40145
4
19028
162
162
-118
854
Thirdquar-
ter
6
420457888
1247
56718
1,28191
1,190
1170
16
88210
-122
-122
- 3 8
1,030
Fourthquar-
ter
1
202518975
233
61727
1,088113
975
369
4857
56442
522
522
1
1,498
1949
Firstquar-
ter
250605150
18
92727
1,38394
1,289
450
28010
34465
279
279
1,568
Sec-ond
quar-ter i
(2)
(2)
1,166
1,57590
1,485
200
27535
240
240
25
1,750
1 Preliminary estimates based on incomplete data.2 Not available.Source: Department of Commerce.
Digitized for FRASER http://fraser.stlouisfed.org/ Federal Reserve Bank of St. Louis
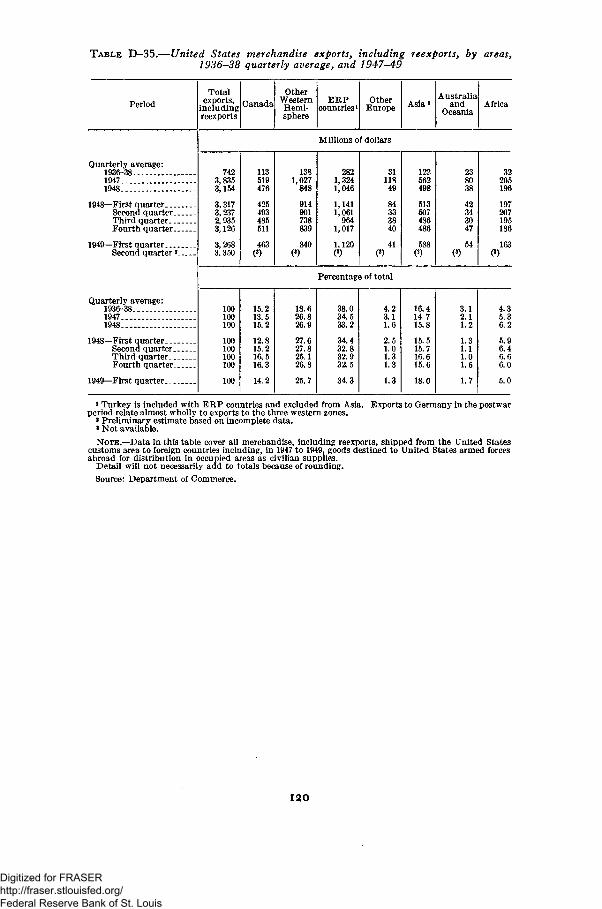
TABLE D—35.—United States merchandise exports, including reexports, by areas,1936-38 quarterly average, and 1947-49
PeriodTotal
exports,includingreexports
CanadaOther
WesternHemi-sphere
E R Pcountries1
OtherEurope Asia*
Australiaand
OceaniaAfrica
Millions of dollars
Quarterly average:1936-3819471948
1948—First quarter.. _Second quarter.Third quarter..Fourth quarter.
1949—First quarter.._Second quarter 2
Quarterly average:1936-3819471948
1948—First quarter...Second quarter.Third quarter..Fourth quarter.
1949—First quarter...
7423,8353,154
3,3173,2372,9353,126
3,2683,350
113519476
425493485511
463(8)
1381,027
848
914901738839
840(3)
2821,3241,046
1,1411,061
9641,017
1.120(3>
3111849
84333840
41(3)
122562498
513507486486
588(3)
238038
42343047
54(3)
Percentage of total
100100100
100100100100
100
15.213.515.2
12.815.216.516.3
14.2
18.626.826.9
27.627.825.126.8
25.7
38.034.533.2
34.432.832.932.5
34.3
4.23.11.6
2.51.01.31.3
1.3
16.414.715.8
15.515.716.615.6
18.0
3.12.11.2
1.31.11.01.5
1.7
32205196
197207195186
163
4.35.36.2
5.96.46.66.0
5.0
1 Turkey is included with ERP countries and excluded from Asia. Exports to Germany in the postwarperiod relate almost wholly to exports to the three western zones.
2 Preliminary estimate based on incomplete data.8 Not available.
NOTE.—Data in this table cover all merchandise, including reexports, shipped from the United Statescustoms area to foreign countries including, in 1947 to 1949, goods destined to United States armed forcesabroad for distribution in occupied areas as civilian supplies.
Detail will not necessarily add to totals because of rounding.
Source: Department of Commerce.
I 2 O
Digitized for FRASER http://fraser.stlouisfed.org/ Federal Reserve Bank of St. Louis
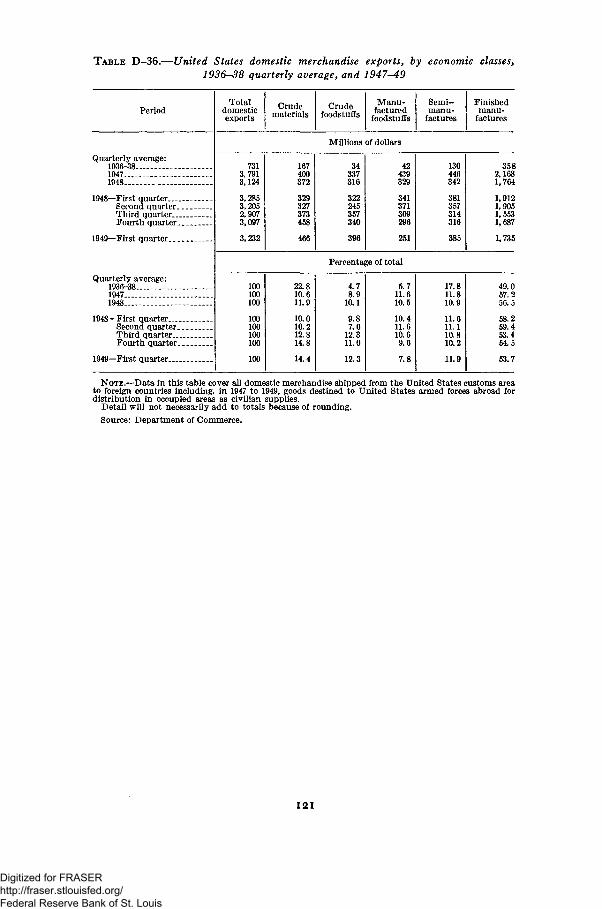
TABLE D-36.—United States domestic merchandise exports, by economic classes,1936-38 quarterly average, and 1947-49
Period
Quarterly average:1936-3819471948
1948—First quarterSecond quarterThird quarterFourth quarter
1949—First quarter
Quarterly average:1936-3819471948
1948—First quarterSecond quarter _Third quarterFourth quarter
1949—First quarter. . . . _.
Totaldomesticexports
Crudematerials
Crudefoodstuffs
Manu-factured
foodstuffs
Semi-manu-
factures
Finishedmanu-
factures
Millions of dollars
7313,7913,124
3,2853,2052,9073,097
3,232
167400372
329327373458
466
34337316
322245357340
396
42439329
341371309296
251
130446342
381357314316
385
3582,1681,764
1,9121,9051,5531,687
1,735
Percentage of total
100100100
100100100100
100
22.810.611.9
10.010.212.814.8
14.4
4.78.9
10.1
9.87.6
12.311.0
12.3
5.711.610.5
10.411.610.69.6
7.8
17.811.810.9
11.611.110.810.2
11.9
49.057.256.5
58.259.453.454.5
53.7
NOTE.—Data in this table cover all domestic merchandise shipped from the United States customs areato foreign countries including, in 1947 to 1949, goods destined to United States armed forces abroad fordistribution in occupied areas as civilian supplies.
Detail will not necessarily add to totals because of rounding.
Source: Department of Commerce.
1 2 1
Digitized for FRASER http://fraser.stlouisfed.org/ Federal Reserve Bank of St. Louis

TABLE D-37.—Indexes of quantity and unit value of United States domestic mer-chandise exports, by economic classes, 1936-38 quarterly average, and 1947-49
[1936-38=100]
PeriodTotal
domesticexports
Crudematerials
Crudefoodstuffs
Manu-factured
foodstuffs
Semi-manu-
factures
Finishedmanu-
factures
Quarterly average:1936-381947...1948
1948—First quarter. .Second quarter.Third quarter..Fourth quarter
1949—First quarter..
Quarterly average:1936-3819471948 -
1948—First quarter. _.Second quarter.Third quarter..Fourth quarter
1949—First quarter. _
100275213
220217197216
229
100123100
8786100124
129
Quantity indexes
100397362
323265407429
494
100478351
353390319335
314
100203143
160149130131
161
100332256
275275225246
254
Unit value indexes
100188200
204202201196
193
100195223
227229223220
216
100248255
290269256231
234
100218223
230226230209
190
100169184
184185186186
184
100182193
194194193191
191
NOTE.—The indexes of quantity are a measure of the volume of trade after the influence on value of changesin average prices has been eliminated. The indexes of unit value provide a measure of change in the averageprices at which trade transactions are reported in official foreign trade statistics, including change in averageprices that result from changes in the commodity composition of trade. The indexes for 1947 to 1949 arebased on data which include goods destined to the United States armed forces abroad for distribution tocivilians in occupied areas.
Source: Department of Commerce.
1 2 2
Digitized for FRASER http://fraser.stlouisfed.org/ Federal Reserve Bank of St. Louis
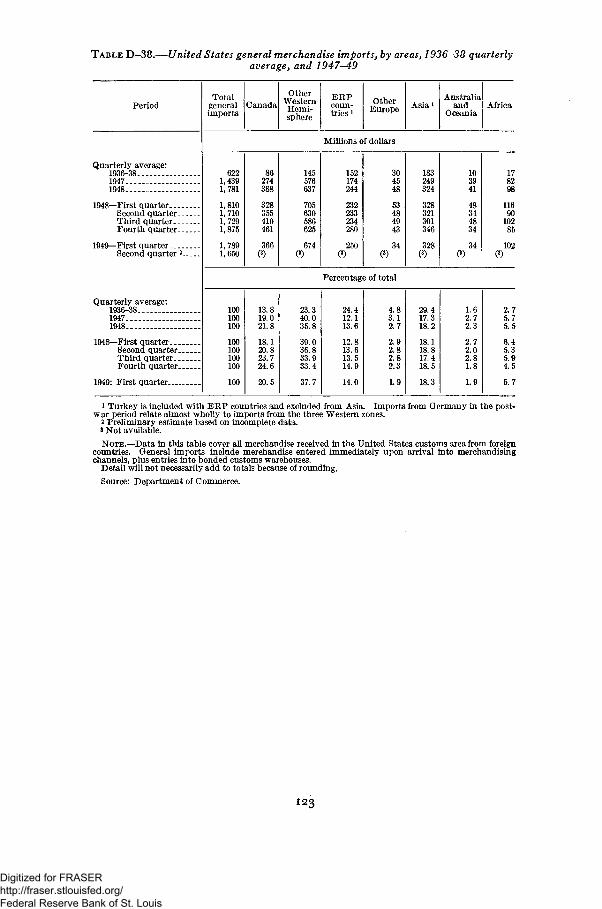
TABLE D-38.—United States general merchandise imports, by areas,1936-38 quarterlyaverage, and 1947-49
PeriodTotal
generalimports
CanadaOther
WesternHemi-sphere
E R Pcoun-tries l
OtherEurope Asia1
Australiaand
OceaniaAfrica
Millions of dollars
Quarterly average:1936-3819471948
1948—First quarter.._Second quarter-Third quarter. _Fourth quarter.
1949—First quarter - _ _Second quarter 2
Quarterly average:1936-3819471948
1948—First quarter...Second quarter.Third quarter..Fourth quarter.
1949: First quarter....
6221,4391,781
1,8101,7101,7291,875
1,7891,650
86274388
328355410461
366(3)
145576637
705630586625
674(3)
152174244
232233234280
250(3)
304548
53484943
3400
183249324
328321301346
328(3)
103941
48344834
34(3)
1782
1169010285
102
Percentage of total
100100100
100100100100
100
13.819.021.8
18.120.823.724.6
20.5
23.340.035.8
39.036.833.933.4
37.7
24.412.113.6
12.813.613.514.9
14.0
4.83.12.7
2.92.82.82.3
1.9
29.417.318.2
18.118.817.418.5
18.3
1.62.72.3
2.72.02.81.8
1.9
2.75.75.5
6.45.35.94.5
5.7
1 Turkey is included with ERP countries and excluded from Asia. Imports from Germany in the post-war period relate almost wholly to imports from the three Western zones.
2 Preliminary estimate based on incomplete data.3 Not available.
NOTE.—Data in this table cover all merchandise received in the United States customs area from foreigncountries. General imports include merchandise entered immediately upon arrival into merchandisingchannels, plus entries into bonded customs warehouses.
Detail will not necessarily add to totals because of rounding.
Source: Department of Commerce.
123
Digitized for FRASER http://fraser.stlouisfed.org/ Federal Reserve Bank of St. Louis
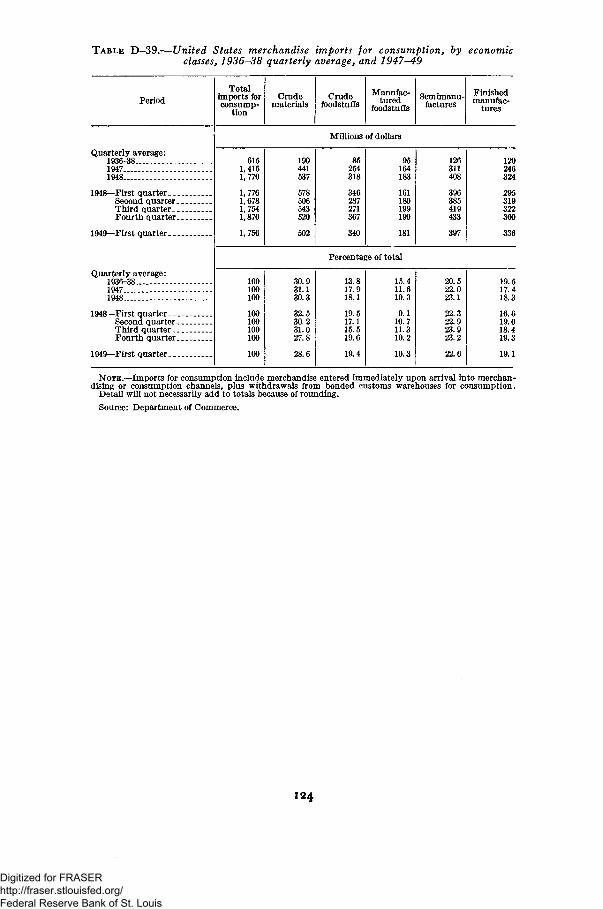
TABLE D-39.—United States merchandise imports for consumption, by economicclasses, 1936-38 quarterly average, and 1947-49
PeriodTotal
imports forconsump-
tion
Crudematerials
Crudefoodstuffs
Manufac-tured
foodstuffsSemimanu-
facturesFinishedmanufac-
tures
Millions of dollars
Quarterly average:1936-3819471948
1948—First quarter. _Second quarter.Third quarter-.Fourth quarter.
1949—First quarter. _
Quarterly average:1936-3819471948
1948—First quarter. _Second quarterThird quarter .Fourth quarter
1949—First quarter. _
6151,4161,770
1,7761,6781,7541,870
1,756
190441537
578506543520
502
85254318
346287271367
340
95164183
161180199190
181
126311408
396385419433
397
120246324
295319322360
336
Percentage of total
100100100
100100100100
100
30.931.130.3
32.530.231.027.8
28.6
13.817.918.1
19.517.115.519.6
19.4
15.411.610.3
9.110.711.310.2
10.3
20.522.023.1
22.322.923.923.2
22.6
19.517.418.3
16.619.018.419.3
19.1
NOTE.—Imports for consumption include merchandise entered immediately upon arrival into merchan-dising or consumption channels, plus withdrawals from bonded customs warehouses for consumption.
Detail will not necessarily add to totals because of rounding.
Source: Department of Commerce.
124
Digitized for FRASER http://fraser.stlouisfed.org/ Federal Reserve Bank of St. Louis
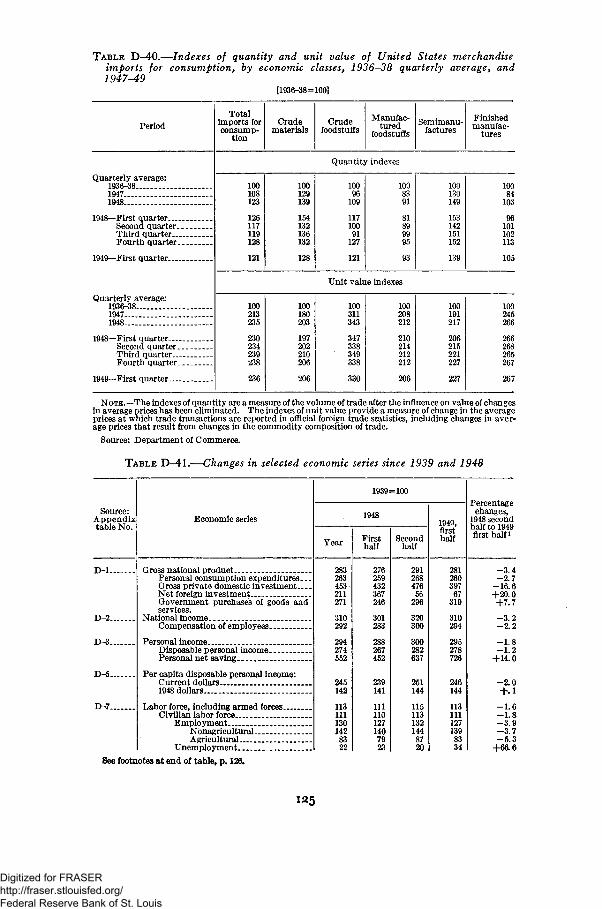
TABLE D-40.—Indexes of quantity and unit value of United States merchandiseimports for consumption, by economic classes, 1936-38 quarterly average, and1947-49
[1936-38=100]
Period
Quarterly average:1936-3819471948
1948—First quarter _.Second quarterThird quarterFourth quarter
1949—First quarter
Quarterly average:1936-3819471948 —
1948—First quarterSecond quarter. _Third quarterFourth quarter.
1949—First quarter
Totalimports forconsump-
tion
Crudematerials
Crudefoodstuffs
Manufac-tured
foodstuffs
Semimanu-factures
Finishedmanufac-
tures
Quantity indexes
100108123
126117119128
121
100129139
154132136132
128
10096
109
11710091
127
121
1008391
81899995
93
100130149
153142151152
139
10084
103
96101102113
105
Unit value indexes
100213235
230234239238
236
100180203
197202210206
206
100311343
347338349338
330
100208212
210214212212
206
100191217
206215221227
227
100245266
266268265267
267
NOTE.—The indexes of quantity are a measure of the volume of trade after the influence on value of changesin average prices has been eliminated. The indexes of unit value provide a measure of change in the averageprices at which trade transactions are reported in official foreign trade statistics, including changes in aver-age prices that result from changes in the commodity composition of trade.
Source: Department of Commerce.
TABLE D-41.—Changes in selected economic series since 1939 and 1948
Source:Appendixtable No.
Economic series
1939=100
1948
Year Firsthalf
Secondhalf
1949,firsthalf
Percentagechanges,
1948 secondhalf to 1949first half1
D-2..
D-3-.
D-5-.
D-7..
Gross national productPersonal consumption expenditures...Gross private domestic investmentNet foreign investmentGovernment purchases of goods andservices.
National income ___Compensation of employees
Personal incomeDisposable personal income-Personal net saving
Per capita disposable personal income:Current dollars1948 dollars
Labor force, including armed forces..Civilian labor force
EmploymentNbnagriculturalAgricultural
Unemployment
283263453211271
310292
294274552
245142
1131111301428322
276259432367
301
267452
239141
1111101271407923
29126847656296
320300
300282637
251144
1151131321448720
28126039767319
310294
295278726
246144
1131111271398334
-3.4-2.7
-16.6+20.0+7.7
-3 .2-2 .2
- 1 . 8- 1 . 2
+14.0
-2.0+.1
-1.6-1.8-3.9-3.7-5.3
+66.6See footnotes at end of table, p. 126.
125
Digitized for FRASER http://fraser.stlouisfed.org/ Federal Reserve Bank of St. Louis
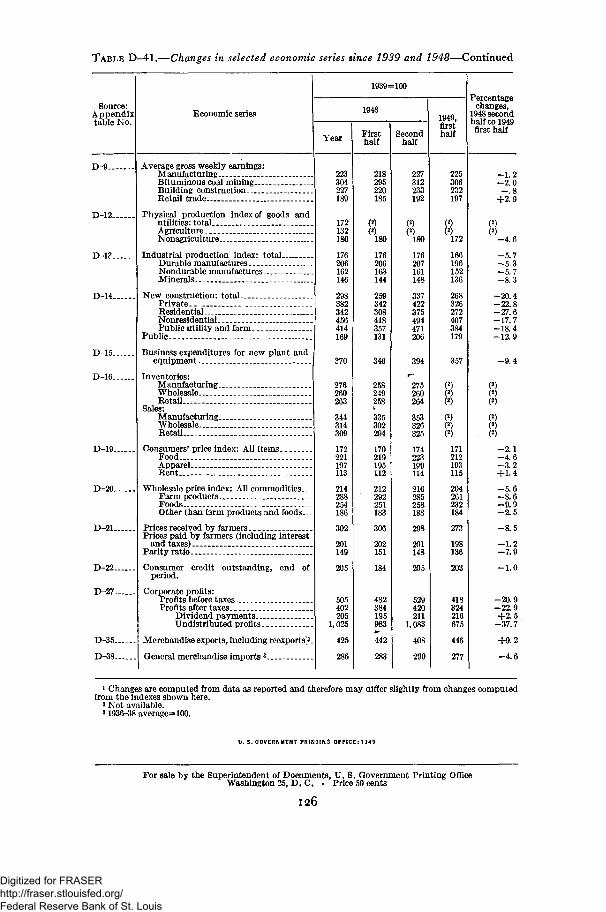
TABLE D-41.—Changes in selected economic series since 1939 and 1948—Continued
Source:Appendixtable No.
Economic series
1939=100
1948
YearFirsthalf
Secondhalf
1949,firsthalf
Percentagechanges,
1948 secondhalf to 1949first half
D-9.
D-12
D-l?
D-14
D-15-.
D-16.
D-19
D-20-.
D-21
D-22..
D-27.
D-35..
D-38-
Average gross weekly earnings:Manufacturing...Bituminous coal miningBuilding construction.Retail trade
Physical production index of goods andutilities: totalAgricultureNonagriculture-.
1 pr<Durable manufacturesNondurable manufactures..Minerals.
New construction: totalPrivateResidential—NonresidentialPublic utility and farm.
Public
Business expenditures for new plant andequipment
Inventories:Manufacturing..WholesaleRetail
Sales:Manufacturing..WholesaleRetail
Consumers' price index: All items.FoodApparelRent
Wholesale price index: All commodities. __Farm productsFoodsOther than farm products and foods...
Prices received by farmersPrices paid by farmers (including interest
and taxes).Parity ratio.
Consumer credit outstanding, end ofperiod.
Corporate profits:Profits before taxes-Profits after taxes
Dividend payments.._Undistributed profits .
Merchandise exports, including reexports]3
General merchandise imports3
223304227189
172132180
176206162146
382342456414169
370
276260263
344314309
172221197113
214288254186
302
201149
205
505402205
1,025
425
286
218295220185
()180
176206163144
259342308418357131
346
258249258i.
335302294
170219195112
212292251183
306
202151
184
482384195983(*•"442
283
227312233192
180
176207161148
337422375494471206
394
275260264
353326325
174223199114
216285258
201148
205
529420211
1,083
408
290
225306232197
()172
166196152136
268326272407384179
357
()
8171212193115
204261232184
273
136
203
418324216675
446
277
- 1 . 2- 2 . 0- . 8
+2.9
)-4.6- 5 . 7- 5 . 3- 5 . 7- 8 . 3
-20.4-22.8-27.6-17.7-18.4-12.9
-9 .4
- 2 . 1- 4 . 6-3 .2+1.4
- 5 . 6- 8 . 6- 9 . 9- 2 . 5
- 8 . 5
- 1 . 2- 7 . 9
- 1 . 0
-20.9-22.9+2.5
-37. 7
+9.2
- 4 . 6
1 Changes are computed from data as reported and therefore may aiffer slightly from changes computedfrom the indexes shown here.
2 Not available.31936-38 average=100.
For sale by the Superintendent of Documents, U. S. Government Printing OflQceWashington 25, D. C. • Price 50 cents
126
Digitized for FRASER http://fraser.stlouisfed.org/ Federal Reserve Bank of St. Louis