erp implementation projects: risk analysis and management
TRANSCRIPT

ERP Implementation Projects:
Risk Analysis and Management
Mirmigkos Konstantinos
SCHOOL OF SCIENCE AND TECHNOLOGY
A thesis submitted for the degree of
Master of Science (MSc) in Strategic Product Design
February 2020
Thessaloniki – Greece

Student Name: Mirmigkos Konstantinos
SID: 1106180015
Supervisor: Assistant Professor Dr. Charisios Achillas
I hereby declare that the work submitted is mine and that where I have made use of
another’s work, I have attributed the source(s) according to the Regulations set in the
Student’s Handbook.
February 2020
Thessaloniki - Greece

-i-
Abstract
This dissertation was written as part of the MSc in Strategic Product Design at the
International Hellenic University. The purpose of this study is to identify the critical risk
factors during the implementation of an enterprise resource planning (ERP) system and
further delineate the factors which have a negative impact on the outcome of such a
project. ERP systems appear as the backbone of many business infrastructures, thereby
providing essential information to managers to enhance decision making and create a
competitive advantage for the organization. Despite the fact that the topic of ERP
implementation is well researched, the success rate of such projects remains at low levels,
justifying the importance of this research topic.
To fulfill the objective that was described above, this research is divided into two sections.
The first section reviews the literature, and in particular, an investigation is conducted
related to the risk factors during the implementation phase of an ERP system. A
categorization is undertaken, which assists in tracking the most significant risk categories,
and after further analysis is identified, the association with the most critical risk factors
which can occur at all stages of the ERP implementation. In the second section of the
research is designed a survey to identify the probability and the impact of the most
significant risks that have been identified in the first part. A cross-sectional e-mail survey
was sent to individuals with relevant experience in the implementation of ERP systems.
To further analyze the collected data, there are also discussed the concepts of risk
management and risk analysis, so that a comparison can be established between whatever
is mentioned in the literature and what was stated by the survey respondents.
The results of this study provide evidence that factors associated with the project
management and business processes are considered dangerous during the implementation
stage, and at the same time, essential to the success of an ERP project. Risks correlated
to senior management and executive commitment can also be deemed critical to the
outcome of the project, as their probability of occurrence was very high in both literature
and the survey. The analysis of the answers of the respondents offers some fresh insights
into the current practice of ERP implementation.
Keywords: Risk Management, Enterprise Recourse Planning System, ERP,
Implementation, Risk Factors

-ii-
Acknowledgment
This dissertation was the concluding part of the Master’s degree in Strategic Product
Design, which provided me precious knowledge, experience, and an extensive network.
One academic year full of challenges, creativity, brainstorming, teamwork, and growth.
Useful ingredients both for my professional and personal development. As part of this
dissertation, I feel obliged to thank some people for the cooperation, for providing the
appropriate guidance, and direct and efficient assistance during its construction, and
throughout my studies.
First of all, I want to thank the professors of the program who, through their years of
experience, have been able to impart valuable knowledge successfully, stimulate my
interests, and contribute to my improvement. More specifically, I would like to thank Mr.
Charisios Achillas, Assistant Professor at the International Hellenic University,
supervising this thesis for his useful comments, his effort to keep me on the right track,
and his guidance in such an interesting subject that fully meets my scientific interests.
I would also like to thank my friend and colleague Lefteris for the cooperation and mutual
support during the studies, the productive time, and the useful experiences and knowledge
he shared with me, which helped me to improve further. Additionally, I would like to
thank Viktoria for her continuous support and motivation through the process of
researching and producing this thesis, for believing me and for providing me the proper
advice that helped me complete this project.
Last but not least, I would like to express my exceptional thankfulness to my family for
their constant support on my decisions, and the power they have given me over the years
to move forward, fulfill my goals, and aim higher. This accomplishment would not have
been possible without them.

-iii-
Contents
ABSTRACT ..................................................................................................................... I
ACKNOWLEDGMENT ...............................................................................................II
CONTENTS ................................................................................................................. III
CHAPTER 1: INTRODUCTION.................................................................................. 5
RESEARCH QUESTION ................................................................................................... 5
THE RESEARCH METHODOLOGY OF DATA COLLECTION ................................................ 5
CHAPTER 2: LITERATURE REVIEW ..................................................................... 7
OVERVIEW OF THE ERP SYSTEMS................................................................................ 7
THE EVOLUTION OF ERP SYSTEM ................................................................................ 7
THE IMPLEMENTATION LIFE CYCLE MODEL OF ERP SYSTEMS ...................................... 9
Phase 1: Initiation .............................................................................................. 9
Phase 2: Planning ............................................................................................... 9
Phase 3: Development ....................................................................................... 9
Phase 4: Testing and Training ........................................................................... 9
Phase 5: Feedback and Review ........................................................................ 10
Phase 6: Deployment and Go-Live .................................................................. 10
Phase 7: Sustain ............................................................................................... 10
IMPLEMENTATION RISKS - FREQUENCY ANALYSIS ...................................................... 11
CHAPTER 3: CRITICAL RISK FACTORS OF ERP IMPLEMENTATIONS .... 13
STRATEGIC INITIATIVES ............................................................................................. 13
BUSINESS PROCESS .................................................................................................... 14
CHANGE MANAGEMENT ............................................................................................ 15
EXECUTIVE COMMITMENT ......................................................................................... 16
PROJECT MANAGEMENT AND PROJECT TEAM ............................................................ 17
PROJECT LEADER ....................................................................................................... 19
TRAINING ................................................................................................................... 20
COMMUNICATIONS AND TECHNICAL SUPPORT .......................................................... 22
CHAPTER 4: RESEARCH APPROACH .................................................................. 24
DATA COLLECTION .................................................................................................... 24

-iv-
RESEARCH SCOPES AND LIMITATIONS ....................................................................... 24
QUESTIONNAIRE DESIGN ............................................................................................ 25
SAMPLE DEMOGRAPHICS - RESPONDENT AND FIRM PROFILES................................... 26
CHAPTER 5: RISK MANAGEMENT....................................................................... 28
RISK ANALYSIS .......................................................................................................... 28
Qualitative Data Analysis ................................................................................ 28
Quantitative Data Analysis .............................................................................. 29
ASSUMPTIONS ............................................................................................................ 31
RISK MANAGEMENT STRATEGY ................................................................................ 34
CHAPTER 6: RESULTS AND DISCUSSIONS ........................................................ 36
BIBLIOGRAPHY ......................................................................................................... 38
APPENDIX ...................................................................................................................... 1

-5-
Chapter 1: Introduction
In today's unpredictable business world, organizations face an exponential increase in
data and quick changes in the economy. To cope with these modifications, organizations
seek solutions to improve their capabilities to adjust their business processes to these fast
changes to ensure their survival. ERP systems seem to be a solution to this dilemma, and
they are becoming omnipresent in big corporations. Even small and medium-sized
companies are considering implementing them to survive today's tough competitive
world, and also in the hope of receiving competitive advantage through automation and
information flow (Markkanen, 2018).
ERP projects are perceived as the most protracted, most expensive, and the most
demanding IT-projects that an organization can undertake. According to Panorama
Consulting's annual study, companies spend, on average, over a year on implementing an
ERP system. Even the long time spend on ERP project does not guarantee success, but
the exact opposite, an ERP project is more likely to fail than succeed (Markkanen, 2018).
It is clear that an incomplete implementation of the ERP system generates can even lead
to a certain reduction in business performance. For that reason, the failure of ERP system
implementation has been a popular study subject studied in the past.
Research question
This research tries to identify the risk factors associated with the stage of implementation
of an ERP software and analyze them to give a coherent picture of these factors as well
as the areas within the organization, which could be harmful to the outcome of such a
project.
The research methodology of data collection
To accomplish the objective that was outlined above, this research is divided into two
parts. The first part is exploratory research and focuses on studying the problem and on
reaching to an understanding of the different variables concerning the issue. The
characteristic of the exploratory research is that it is flexible and can be modified when
new data and insights related to the subject appear. This could be described as a funnel
approach when asking a broad question, and the problem gets narrower as the research
advances, and more information and data are revealed. As the question, "Which are the
critical risk factors that influence the outcome of an ERP project?" is extensive, the
exploratory research methodology is suitable to obtain more information on the subject
and evaluate the risks from different angles. In the second part of the investigation, a
survey is designed to identify the probability and the impact of the most significant risks.
Secondary data were used for data collection in the first part. ERP systems are an essential
part of modern business, and therefore, they have been widely researched. With
secondary data, this research identifies both raw and aggregated data, useful for further
investigation to gain a better understanding and different perspectives on the research
topic. The secondary data of this research have been obtained by conducting extended
analysis and focusing on relevant literature, case studies, journals, and books published
by a trusted party in recent decades. In the second part, as it was mentioned above, a
questionnaire survey was designed, which was forwarded by e-mail to people with

-6-
relevant experience in the implementation of ERP systems. Extensive analysis regarding
the questionnaire design and data collection process is conducted on the fourth chapter.

-7-
Chapter 2: Literature Review
This chapter is an introduction to the subject of research and, more specifically, refers to
the concepts of the enterprise resource planning (ERP) systems, their evolution
throughout the years, and their implementation phases, as they were outlined in the
literature. A brief description is conducted related to the risk factors which were identified
during the exploratory research, allowing us to detect the most critical risks, as they were
described by various authors.
Overview of the ERP Systems
When an organization starts to grow, the intensity of management gets more complicated.
The organizational information increases day by day, making it more challenging to retain
proper management. In such a circumstance, it is beneficial to possess an information
system that will be able to collect, save, and process that information faster and better
than a group of people. Oxford dictionary (2018) defines ERP systems as an integrated
computer system to manage all information and resources in relation to company's
operations. An ERP is a valuable system to organize activities, decisions, and data flow
across multiple different departments and functions within an organization. ERP
applications affect all functional areas within the organization, such as accounting, human
resources, finance, warehouse, sales, marketing, and production.
ERP systems record and collect all business activities, wherever they come from, meaning
that information is available in real-time at all organization levels. They handle the
majority of an enterprise's system requirements, and at the same time, provide integrated
information solutions for better and more efficient management and planning of
resources. By eliminating cross-functional coordination issues in the business process,
the business is allowed to function in a coordinated way, guided by the information it
receives from its environment. Thus, a firm implementing an ERP system can have
benefits such as fast and accurate information gathering, quick decision making, low
inventory cost, and general reduction of the overall costs, improved product quality, and,
most importantly, improved interaction with its customers and suppliers.
The evolution of ERP system
The evolution of the currently known ERP system dates back to 1960. In the 1960s, when
the primary source of competitiveness was cost, companies turned their attention to the
computerized support to manage more efficiently their complex operations, minimize
production cost, focus on high-volume production and manage efficiently large
inventories. More specifically, the introduction of a computerized Reorder Point System
(ROP) was enough to satisfy basic manufacturing planning and control. Thus, during this
decade, the concept of Material Requirements Planning (MRP) came into life, which
formed the basis of what later would be known as ERP.
The MRP system - the predecessor of Manufacturing Resource Planning (MRP II) and
ERP - was developed to manage inventories in production, plan, and calculate when and
how much material was needed to ensure smooth production flow for complex
manufacturing processes. MRP was essential for implementing the materials planning
concept in production management and control, but until the early 1970s, it was used only

-8-
by some US companies. Then, sales, capacity planning, and operations planning
functionalities were affixed to the system, so it began to become a widely used tool for
production. Gradually, in the 1980s, it expanded to the so-called MRP II or
Manufacturing Resources Planning. MRP II emphasizes optimizing manufacturing
processes by synchronizing materials with production requirements. With the shift in the
scope of software applications, a change in manufacturing theory appeared as well, where
competitive firms started to focus more on quality. MRP II systems had a few inherent
drawbacks, such as limited focus to manufacturing activities, forecasting of mass
production needs, and poor budgetary controls. The shortcomings of MRP II led to the
development of a wholly integrated solution called Enterprise Resource Planning (ERP).
In the early 1990s, Gartner Inc., an American technology consulting company, introduced
the term Enterprise Resource Planning (ERP). According to Gartner, the fundamentals of
ERP are the same as with MRP II, while the main differences between ERP and MRP II
are technological rather than functional, and are mainly evolving to client/server
architecture, using graphical environments (GUIs). A key function of the ERP is the way
users can design the application to make it easy to use. Additionally, ERP, as a set of
business processes, is broader in scope and more effective in dealing with multiple
business units, while at the same time, it is connected to all departments in a firm. All
ERP packages started the same way down, including functions such as finance and
accounting, logistics, database management, project management, and human resources
management. However, in the 1990s, there were some functional innovations, such as the
development of specialized software for specific functions. These included SCP (Supply
Chain Planning), PDM (Product Data Management) and CRM (Customer Relationship
Management).
ERP systems focused on back-office functions, but front office functions such as CRM,
e-business systems, or supplier relationship management (SRM), became integrated by
using Electronic Data Interchange (EDI) systems. The manufacturing process is extended
to the entire supply chain across the firm, allowing both employees and their partners,
such as customers and suppliers, to have real-time access to the system. ERP II was
designed to integrate the firm's business processes to create a seamless information flow
beginning with suppliers, going through the manufacturing process, and finally ending
with the customer (Summer, 2005). Figure 1 shows the historical evolution of ERP
systems in detail.
Figure 1. The historical evolution of ERP systems

-9-
The implementation life cycle model of ERP systems
The implementation process of ERP in any organization has several stages. It is starting
with the project Initiation, and the next steps are related to Planning and Development.
When these are completed, start the "Testing & Training" and "Review & Improve"
phases before going live. The final level of the implementation life cycle is related to the
Sustainability of the system. The details of the various stages are given below.
Phase 1: Initiation
The first phase of the implementation is related to the ERP project's approval within the
organization. At the beginning must be created the needed documents, such as the project
charter, which are going to address the objectives, tasks, goals, and deliverables of the
project in each phase. Also, the business logic behind the implementation project, the
investment details, the members of the first project team, their roles and responsibilities,
should be clearly defined in a draft project plan. After the approval of the project charter
by the project champion, the project manager can schedule a project kick-off meeting.
Phase 2: Planning
Planning (also referred to as the "Design" phase in the literature) is a critical stage in ERP
implementation. Proper investigation and analysis must be undertaken within the
organization regarding both its external and internal environments; the project team
should select the appropriate ERP package for the organization, satisfying the current and
future requirements. User requirements, best practice requirements, and Business Process
Reengineering (BPR) requirements must be adequately defined. Gaps need to be analyzed
to understand the current status and future position of the organization. Besides, analysis
has to be performed concerning hardware and infrastructure specifications. Finally, a
detailed project plan with schedules and cash flows should be adjusted.
Phase 3: Development
The purpose of the software development phase is to prepare the entire system for going
live. Multiple activities are involved in this stage, such as completing any necessary
customizations, developing user training, and importing data. Some organization
processes might require to be heavily customized, and some may request the full adoption
of the software vendor modules. Considerable effort is demanded to integrate existing
applications and databases into new software and hardware systems. All developments
require functionality testing to ensure the adequacy of ERP systems.
Phase 4: Testing and Training
One of the most significant reasons for ERP failure is that the installed products are not
meeting the stakeholders' expectations. In the fourth step of the ERP implementation plan,
end-user training begins. Structured training must be provided to the end-users so that
their feedback will be useful for improvements. Until this point, the core implementation
team has been developing and proving out the new processes. At this time, all other users
are involved in the system and check the quality of the implemented product.

-10-
Phase 5: Feedback and Review
This phase is about the collection of feedback from various users. Reviewing their claims
and making required changes is an essential part of this step. This also helps the project
team with the evaluation of the deployment plan, so they will be able to finalize the
deployment method.
Phase 6: Deployment and Go-Live
When all the pieces are in place, and the pilot runs have been completed, the project and
implementation team will evaluate the project and make the final go or no-go decision,
introducing the new ERP solution to the organization. Before going live, the final data
must be loaded and validated. Post-implementation re-review shall be undertaken after
they go live. Afterward, the project team can deliver the project to the support team. Prior
to the initiation of the project termination procedure, the project team must be sure that
employees have been appropriately trained, they are able to start working with the new
system, and completely stop using the old one.
Phase 7: Sustain
This phase consists of additional activities like enhancements, adjustments, system
configurations, and bug fixing. The support team should run continuous status reports
validating that the correct procedures are being followed, ensuring that the organization
will derive the maximum values from the ERP system. ERP implementation success
should be measured in years–not days, weeks, or months. Anyone can be successful
immediately after going live on a new solution. The true measure of achievement is how
well the processes hold up over the years and withstand inevitable changes, such as
employee turnover, business expansion and mergers, and other potentially unsettling
events.
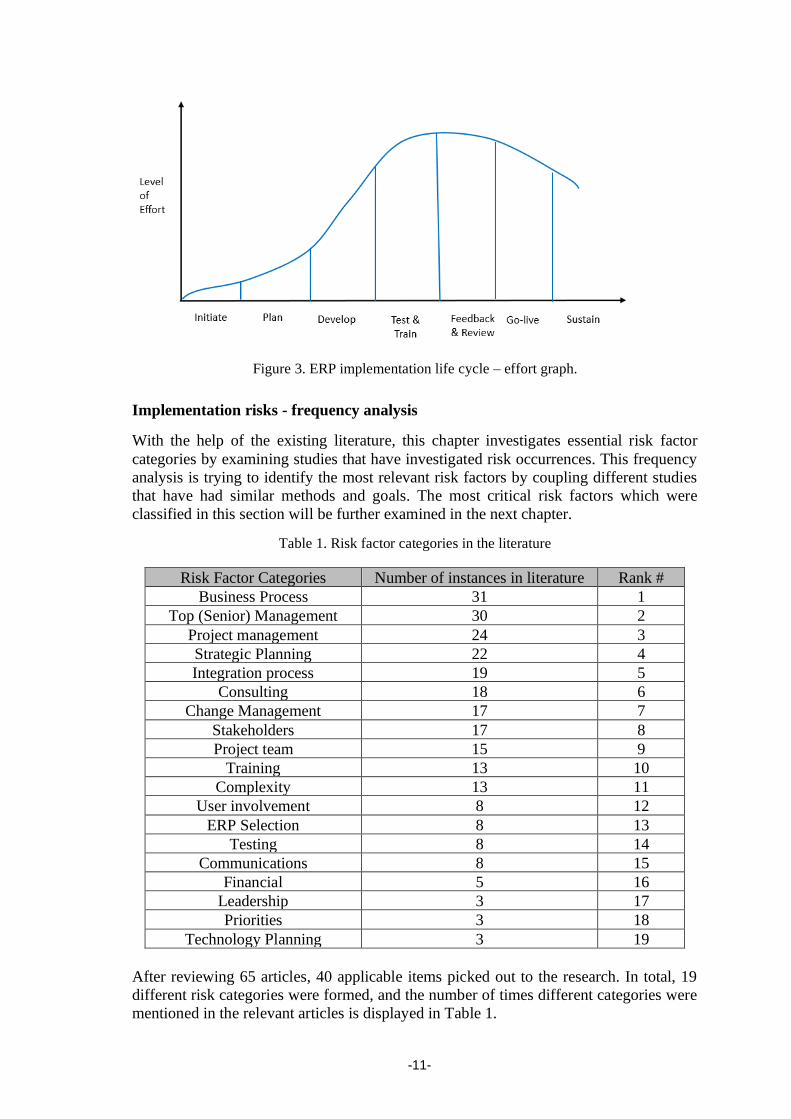
The complete ERP implementation life-cycle is illustrated in Figure 2. The efforts needed
by the project team during various phases of the ERP implementation life cycle are
depicted in Figure 3.
Figure 2. ERP implementation life cycle framework.
-11-
Figure 3. ERP implementation life cycle – effort graph.
Implementation risks - frequency analysis
With the help of the existing literature, this chapter investigates essential risk factor
categories by examining studies that have investigated risk occurrences. This frequency
analysis is trying to identify the most relevant risk factors by coupling different studies
that have had similar methods and goals. The most critical risk factors which were
classified in this section will be further examined in the next chapter.
Table 1. Risk factor categories in the literature
Risk Factor Categories Number of instances in literature Rank #
Business Process 31 1
Top (Senior) Management 30 2
Project management 24 3
Strategic Planning 22 4
Integration process 19 5
Consulting 18 6
Change Management 17 7
Stakeholders 17 8
Project team 15 9
Training 13 10
Complexity 13 11
User involvement 8 12
ERP Selection 8 13
Testing 8 14
Communications 8 15
Financial 5 16
Leadership 3 17
Priorities 3 18
Technology Planning 3 19
After reviewing 65 articles, 40 applicable items picked out to the research. In total, 19
different risk categories were formed, and the number of times different categories were
mentioned in the relevant articles is displayed in Table 1.

-12-
The business process appears as the most cited risk factor. Business process re-
engineering and re-design related to ERP are the areas with the most significant risks.
Also, support from top management, the commitment, and involvement of the senior
management are quite important during the ERP implementation process, and the
potential risks from these sections could be quite harmful for the organization. Within the
strategic planning category were included risks related to lack of strategic goals and
inconsistencies related to business analysis.
Some of the studies explored in this paper may have used similar articles as a data source.
Therefore, the result of the study may not be precisely accurate, but it offers a solid base
for a literature study, even though it only examined 40 sources. It gives a strong indication
that the business processes and the top management include multiple risks and have a
vital role in the successful implementation of an ERP project. Figure 4 shows that
business processes and top (or senior) management were cited in over than half of the
literature reviewed. Project management and Strategic Planning were also listed often,
and several authors, e.g., Muscatello and Chen, (2008) and Chakravorty, Dulaney, and
Franza (2016), emphasized their meaning to ERP project outcome even though they
might not have reached the highest frequency.
Figure 4. Risk factor instances in literature
Within the third chapter will be conducted an extensive analysis of the critical risk factors.
In the fourth and fifth chapter, after analyzing the data of a survey, is going to be detected
if the risk factors, as discussed earlier, have a significant impact on the overall outcome
or ERP project, as it has according to the frequency analysis conducted in the literature
review.
76% 73%
59%54%
46% 44% 41% 41%37%
32% 32%
20% 20% 20% 20%
12%7% 7% 7%
0%
10%
20%
30%
40%
50%
60%
70%
80%
90%
100%
Percentage (%) of instances in the literature

-13-
Chapter 3: Critical Risk Factors of ERP implementations
This segment identifies critical risk factors of ERP implementations based on a critical
analysis of scholarly and managerial literature. Within each element, extended reference
is conducted regarding the potential risks which may come up during the implementation
phase of an ERP project. These sections include strategic initiatives, business process,
executive commitment, project management, project team, project leadership, training,
communications, and technical support.
Strategic Initiatives
Business success is not necessarily assured when the organization's internal functions are
integrated prosperously, but the company can define its strategic goals clearly and
whether the system would help to achieve these aims or not (Tarhini et al., 2015). The
organization should be able to use the needed information to improve profitability,
efficiency, and to drive to successful integration. The size and complexity of the efforts
are influenced by whether the implementation is focused on the value chain, and therefore
involves sales and distribution, materials management, and production planning modules,
or whether it is focused on supporting the value chain, and therefore includes financials
and human resources modules. The size and complexity of the implementation are further
influenced by the strategy chosen to roll out the modules (Berchet and Habchi, 2005).
Furthermore, the implementing organization needs to prioritize having a clear
understanding of the strategic goals for ERP system implementation and key people
everywhere the organization needs to have a clear, compelling vision of the organization's
operations about the implementation procedures (Reitsma, Hilletofth and Mukhtar, 2018).
To measure the impact of the ERP system on the company's strategic goals, the
organization should also have to develop performance measurements (Eckartz et al.,
2009).
ERP projects require cross-functional teams who have different goals and for
international projects in different cultures and languages (Hong and Kim, 2002).
Therefore, conscious effort to manage the communication between the project group and
a transparent business model of how the company should operate during the
implementation phase are essential and allow firms to have strategic goals in place before
undertaking an ERP implementation (Fui‐Hoon Nah, Lee‐Shang Lau and Kuang, 2001).
Additionally, throughout the ERP life cycle, a clear business plan and vision are required
to steer the direction of the project. A business plan that outlines recommended strategic
and tangible benefits, a timeline, and an analysis regarding the potential risks, costs, and
the needed resources are critical. Eckartz et al. (2009) also stated in their article that a
lack of guidelines could have a negative impact on achieving specific goals related to the
information system. On the other hand, the existence of the before-mentioned plans
allows the organization to maintain its focus on business benefits and provide the type of
business intelligence that is required to achieve the expected business growth.

-14-
Risks related to the strategic initiatives are displayed in Table 2.
Table 2. Risks factors related to the Strategic Initiatives
No. Risk Name Description
1 The organization
does not have clear
strategic IT goals
The organization does not have proper strategic IT goals.
2 The ERP is not
related to the
business goals
The organization does not have a clear relationship between
the ERP system and its strategic and business goals.
Therefore, ERP does not support the organization’s goals.
3 Lack of strategic
guidelines
regarding the IT
planning
Written guidelines do not exist to structure the strategic IT
planning in the organization.
4 Lack of continuous
evaluation of the
strategic goals
The organization does not analyze to measure the impact of
ERP on the company’s strategic objectives.
5 An analysis of risks,
costs, and resources
has not been
conducted
An investigation regarding the potential risks, costs, and the
necessary resources has not been coordinated before the
implementation.
Business Process
Companies implementing ERP systems do not understand well the relationship between
their existing business processes and how they are going to be affected by the ERP. As
Jarrar, Mudimigh and Zairi (2000) mentioned in their journal, companies may discover
that the software does not support one of their essential business processes. At that point,
there are two options. They can either adjust the business processes to accommodate the
software (Selvakumar, 2011), which means significant changes in long-established ways
of doing business, or they can modify the software to fit the process, an action that is not
suggested by the ERP vendors (Jarrar, Mudimigh and Zairi, 2000). So, significant BPR
(Business Process Re-engineering) might be required if the ERP is to realize its full
potential, and, as Marsh (2000) suggested, this procedure should focus on identifying and
improving the efficiency of critical operations, on restructuring important non-value-
adding activities, and to eliminate inefficient processes.
Reengineering should be undertaken to ensure that the strategic objectives mentioned in
the previous section are feasible and to create a uniform response from all aspects of the
business. Selvakumar (2011), and Scott and Vessey (2002), stated that during the design
and implementation of new business processes, multiple company users should be
involved, structuring a project team with common goals. Within the project team should
be included both internal managers and staff members with experience of the old internal
systems and vital knowledge of cross-functional business relationships. Improvement
becomes a shared task when the whole team shares the same goals. The organizations
should also have a Business Blueprint, so they would be able to recur on a detailed
documentation with the required activities that have to be completed, and the deliverables
of each phase of the implementation (Boltena and Gomez, 2012). Using reengineering

-15-
methods to develop a homogeneous vision representing the company's processes after the
ERP implementation, a firm is more likely to reduce uncertainty and achieve success.
To achieve such results, change management is essential, starting at the project phase and
continuing throughout the entire life cycle. As it was mentioned by Selvakumar (2011),
many companies make assumptions of how implementation will affect the culture and the
structure of their organization, while people are not ready or not willing to change.
Cultural changes related either to the human cost element, or human psyche, do not occur
magically and must be handled by all managers with the utmost care, responsibility, and
precision, to control members' resistance to change (Aladwani, 2001).
Change Management
Change management involves effectively balancing authorities in favor of a change over
forces of resistance. Organizations, groups, or individuals resist the changes that they
either recognize as a threat or believe that will affect their habits negatively. Employees
are unwilling to learn new techniques, or the IT department is reluctant to change due to
attachment to its product. For the end-users, the implementation of an ERP system means
that their computer-related tasks are going to be performed in a different computer
environment (Jarrar, Mudimigh and Zairi, 2000).
Moreover, from an organizational point of view, the organization structure might be
impacted while implementing an ERP solution for the firm. To achieve this structure
transformation, change management techniques are required, involving changing of roles,
procedures, and policies within the company (Tarhini et al., 2015). As (Motwani,
Subramanian and Gopalakrishna, 2005) noted, an organizational culture where the
employees share common values and goals and are receptive to change is most likely to
succeed in ERP implementation. However, change management has to be structured
within an overall Business Process Management methodology to achieve its goals (Jarrar,
Mudimigh and Zairi, 2000). From the business perspective, the need for Business Process
Reengineering (BPR) to fit system functionalities or already embedded business
processes could be considered as the most critical effect of implementing ERP solutions
(Tarhini et al., 2015).
As part of the change management efforts, formal education and training should be
provided to users who are involved in the design and implementation of business
processes and the ERP system, depending on the experience and level of each employee
(Selvakumar, 2011). Project progress and succession are critically dependent on their
team members. The main body of the project team should come from the company itself,
but also some cross-functional and multi-skilled users are required in the implementation
team to be involved in the design and implementation of new processes.
Moreover, user training, education, and support should be available and highly
encouraged from the beginning of the project. The existence of a performance system to
monitor the progress of ERP change management efforts is quite important (Aladwani,
2001), and change agents also play a significant role in the implementation to facilitate
change and communication (Motwani, Subramanian and Gopalakrishna, 2005). The main
approaches to achieve this, sought-after, people involvement, and commitment is an open
environment, characterized by open communication and trust (Berchet and Habchi,
2005).

-16-
Risks related to the business processes and change management techniques are displayed
in Table 3.
Table 3. Risks factors related to the Business Processes, and Change Management
No. Risk Name Description
6 Business processes
are modified during
the implementation
of the ERP system
The organization does not understand well the relationship
between their existing business processes and how they are
going to be affected by the implementation of the new ERP
system.
7 Leadership does not
support BPR
(Business Process
Reengineering)
The administration is not willing to change part of the
business processes to fit the ERP software.
8 Cross-functional
members are not
involved in BPR
team
The business process redesign team does not include cross-
functional and multi-skilled company users that have vital
knowledge of the organization.
9 Employees reject
changes
Employees do not share common values, goals, and are not
receptive to change.
10 Employees do not
understand how their
actions impact the
organization
Employees are not aware of how their actions impact the
operations of other functions within the organization.
Executive Commitment
To ensure that the implementation is going to be performed successfully, top management
is advised to look beyond the technical specifications of the project, to the organizational
requirements. Senior management ought to perceive before the implementation efforts
how the enterprise will be benefited from this procedure and acknowledge the need for
long-term support throughout the implementation of this new technology (Sherer and
Alter, 2004). The degree to which executives understand the specific benefits of an ERP
system and encourage the implementation of new policies and ideas for the implementing
ERP system is referred to as top management support (Woosang, 2011). Top management
support, commitment, and leadership have been identified in the literature as the most
important critical success factors in organizations embarking on ERP implementations,
as they ensure a stable system rollout and smooth change management (Al-Mashari, Al-
Mudimigh and Zairi, 2003).
Managers and executives believe that ERP systems help their organization achieve
greater business benefits. However, when it comes to the design, implementation, and
management of the ERP project, they seem to be mystified regarding what business needs
the ERP system must meet and which decisions must be taken to be prepared for the
implementation, maintenance and user support (Muscatello and Chen, 2008). They must
be committed with their own involvement and willingness to allocate valuable resources
to the implementation effort (Sherer and Alter, 2004). The needed people should be
provided for the implementation and the appropriate amount of time to complete each
task and each step of the application should be given to the project team (Jarrar,
Mudimigh and Zairi, 2000). Depending on the changes in the schedule and the completion

-17-
of milestones and deliverables, senior management should also be able to legitimize new
goals and objectives (Umar et al., 2016).
Multiple executives are having a hard time understanding that ERP implementation is not
merely a package installation. As Al-Mashari, Al-Mudimigh and Zairi (2003) noted, ERP
implementation is about people, not processes or technology. Unlike any other software
scheme, an ERP system does not merely amendment employees' computer screens, as the
previous generations of software packages did; it transforms the way they do their jobs
and how the company does business (Muscatello and Chen, 2008). The organization goes
through a significant transformation, and the management of this change has to be
carefully planned from a strategic viewpoint as the implementation scheme is a long
journey of fine-tuning, upgrading, and continual learning. Top management must
completely understand the degree of the changes which will happen within the
organization, support the new project and be comfortable with the fact that the decisions
their planners address can have an intense impact on the entire organization's supply chain
(Chen, 2001).
Risks related to the top management and executive commitment are displayed in Table 4.
Table 4. Risks factors related to the Top Management, and the Executive Commitment
No. Risk Name Description
11 Top Management is
doubtful regarding
ERP investment
Upper management is sure they wish to invest in an ERP
system.
12 Top Management is
unaware of the ERP
system benefits
Senior management does not invest the time needed time
to understand the benefits of the ERP system.
13 Top Management
resist change and
smooth system rollout
Senior management ensures smooth change management
and system rollout.
14 Top Management
undervalues the need
for long term support
for the ERP System
Senior management recognizes the need for long term
ERP support for the implementation of new technology.
15 Top Management does
not provide the
required time and
resources
Senior management is willing to allocate valuable
resources and give the appropriate amount of time to the
implementation effort.
Project Management and Project Team
The structure of the project team is essential and must convey the strong will to ensure
the existence of representatives of various company functions (Motwani, Subramanian
and Gopalakrishna, 2005). Within the project team should be included internal managers
and staff that have vital knowledge of cross-functional business associations and a good
understanding of the old internal systems (Boltena and Gomez, 2012). The project team
must be able to adapt and deal with the different kinds of problems that occur during the
implementation process. Well-designed strategic targets help to keep the project team on
track throughout the entire implementation process (Al-Mashari, Al-Mudimigh and Zairi,
2003). As Muscatello and Chen (2008) mentioned, anyone who can access the

-18-
documentation of a large-scale ERP project will detect that unanticipated and late-
breaking circumstances almost always shape the final product. Changes such as adding a
new process, module, or department after the project has been scoped and started may
lead to a "never-ending" project.
To prevent scope problems, the implementation teams should take a disciplined approach
to project management, including a clear definition of objectives, development of a work
plan, and establishment of a resource requirement plan (Huang et al., 2004). Furthermore,
change control procedures must be clearly defined by the firms, and everyone must be
held attached to them, or else, tension might be caused between the project team and those
who do not get the changes they want. If adequate attention is not given to this manner,
then the system implementation may take longer to be completed, and the resulting
misalignment may inhibit the use and acceptance of the system (Holland and Light, 1999).
Improvement can be achieved with more regular meetings and reviews, more precise
scheduling of delivery for system modules, and other means for exercising tighter control
over projects (Motwani et al., 2002). Most of all, organizations need to make sure that a
project charter or mission statement exists, and appropriate project evaluation measures
are included during ERP implementation (Huang et al., 2004). There should be proper
follow up of all company requirements, and the specified demands should be mapped into
the system. It is paramount to nail down the project specifications and have them
documented and signed by the senior management and users. User acceptance testing
and quality inspections to track the completion status of project milestones and
deliverables are signs of proper project management (Umar et al., 2016).
The success of any project depends critically on its team members. The ERP project team
needs to consist of the best people of the organization and within it, must be involved a
project champion and members of different functions, (Reitsma, Hilletofth and Mukhtar,
2018) both with business and technical knowledge (Selvakumar, 2011). It is also essential
to understand the need of external consultants when team members lack experience, or a
part of expertise is missing internally. The organization should establish a knowledge
transfer mechanism, by which, consultants' role is defined clearly, and their skills and
expertise are acquired and transferred adequately to the IT members, so they will be able
to solve any problems without the help of the external consultants after the completion of
the installation. The reinforcement of a "team environment" is crucial to the overall
progress of an ERP implementation. Members of the project team should be encouraged
to support each other and strive toward common goals (Woosang, 2011). The project
should also be divided into manageable sub-projects that can be worked on separately
from the entire project (Motwani et al., 2002), and put more attention on the critical
management aspects while managing the project (Boltena and Gomez, 2012).
-19-
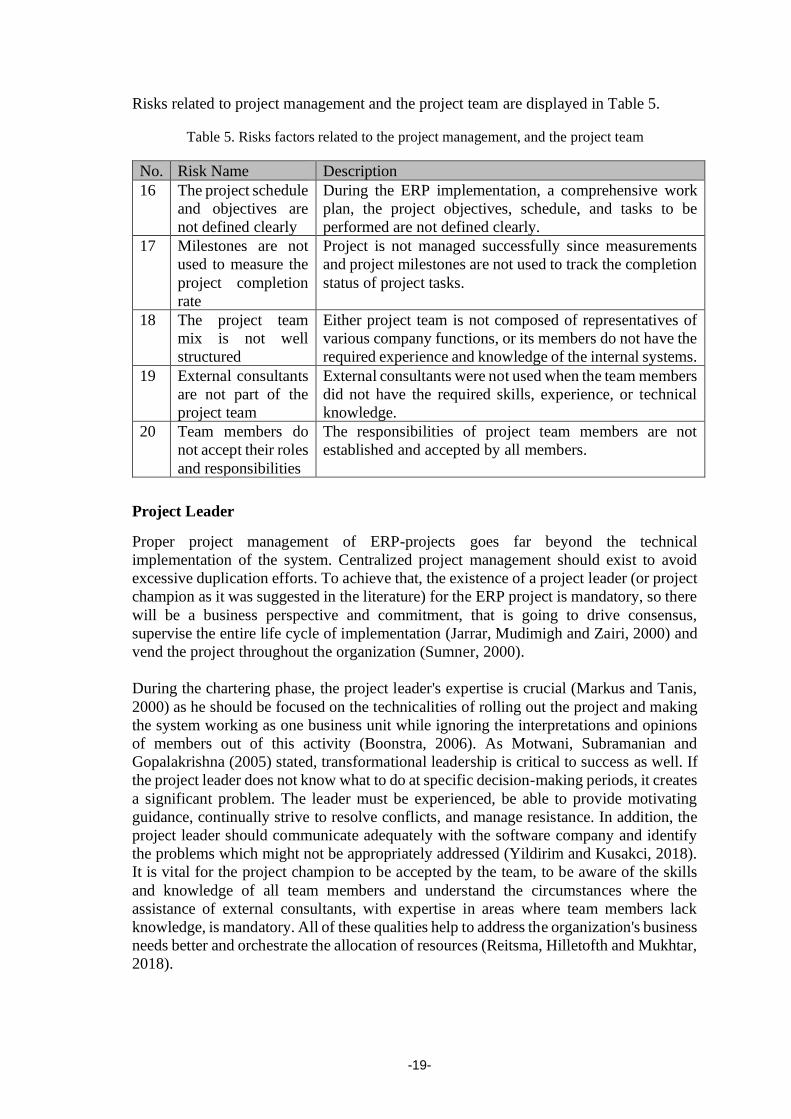
Risks related to project management and the project team are displayed in Table 5.
Table 5. Risks factors related to the project management, and the project team
No. Risk Name Description
16 The project schedule
and objectives are
not defined clearly
During the ERP implementation, a comprehensive work
plan, the project objectives, schedule, and tasks to be
performed are not defined clearly.
17 Milestones are not
used to measure the
project completion
rate
Project is not managed successfully since measurements
and project milestones are not used to track the completion
status of project tasks.
18 The project team
mix is not well
structured
Either project team is not composed of representatives of
various company functions, or its members do not have the
required experience and knowledge of the internal systems.
19 External consultants
are not part of the
project team
External consultants were not used when the team members
did not have the required skills, experience, or technical
knowledge.
20 Team members do
not accept their roles
and responsibilities
The responsibilities of project team members are not
established and accepted by all members.
Project Leader
Proper project management of ERP-projects goes far beyond the technical
implementation of the system. Centralized project management should exist to avoid
excessive duplication efforts. To achieve that, the existence of a project leader (or project
champion as it was suggested in the literature) for the ERP project is mandatory, so there
will be a business perspective and commitment, that is going to drive consensus,
supervise the entire life cycle of implementation (Jarrar, Mudimigh and Zairi, 2000) and
vend the project throughout the organization (Sumner, 2000).
During the chartering phase, the project leader's expertise is crucial (Markus and Tanis,
2000) as he should be focused on the technicalities of rolling out the project and making
the system working as one business unit while ignoring the interpretations and opinions
of members out of this activity (Boonstra, 2006). As Motwani, Subramanian and
Gopalakrishna (2005) stated, transformational leadership is critical to success as well. If
the project leader does not know what to do at specific decision-making periods, it creates
a significant problem. The leader must be experienced, be able to provide motivating
guidance, continually strive to resolve conflicts, and manage resistance. In addition, the
project leader should communicate adequately with the software company and identify
the problems which might not be appropriately addressed (Yildirim and Kusakci, 2018).
It is vital for the project champion to be accepted by the team, to be aware of the skills
and knowledge of all team members and understand the circumstances where the
assistance of external consultants, with expertise in areas where team members lack
knowledge, is mandatory. All of these qualities help to address the organization's business
needs better and orchestrate the allocation of resources (Reitsma, Hilletofth and Mukhtar,
2018).

-20-
The leader should be working closely with the team members to involve users with the
implementation process and business process reengineering (BPR) from each department
that is engaged in the implementation procedure. A research has been conducted by
Selvakumar (2011) in a multinational manufacturing corporation, where it was observed
that the organization selected several persons and a leader among themselves and called
them power users. Power users were selected from the most knowledgeable and
authoritative personnel and starting from the first days of the implementation, the needed
training and education was provided to them, so they will be prepared for doing BPR and
implementing ERP modules. An extensive analysis of users' training is going to be
conducted in the next chapter.
Risks related to the project leader and project team are displayed in Table 6.
Table 6. Risks factors related to the project leader
No. Risk Name Description
21 ERP project leader is
inexperienced and
unaware of business
goals.
The ERP Project leader is not experienced enough, and he
is not able to address the organization's business needs.
22 The ERP project
leader is unable to
provide motivating
leadership.
The ERP Project leader is not able to provide motivating
leadership to the team.
23 EPR project leader is
unable to resolve
conflicts and manage
resistance.
The ERP Project leader is not able to resolve conflicts and
manage resistance.
24 ERP project leader is
unaware of the team’s
skills and knowledge
The ERP project leader is not working closely with all the
team members, and he is not aware of the team member's
skills and knowledge. Therefore, he can not understand
the cases where the expertise of external consultants is
required.
25 ERP project leader is
not accepted by all
team members.
All team members do not commonly accept the ERP
project leader and do not have trust in his skills and
experience.
Training
ERP skills are in acute shortage attributable to the high demand for individuals with a
decent understanding of business and ERP systems. The fundamental process changes
brought about by the ERP implementation have made providing sufficient and timely
training to project persons, managers, and users, a crucial requirement (Kumar,
Maheshwari and Kumar, 2003). An evaluation regarding the training needs usually
uncovers several education and skills deficiencies. Rectification of training deficiencies
can be achieved in three possible ways: reassignment and outsourcing of some operations,
or replacement of staff and hiring of new personnel with substantial knowledge in ERP
systems, or education of managerial staff and key employees.

-21-
Before the user could use an ERP system efficiently, he needs to learn the business
processes that were revised during the system implementation. As Sarkis and Sundarraj
(2003) stated, in most cases, firms engage in two types of training: fundamental ERP
systems education and technical training in the usage of the ERP software. The training
should contain operation skills of the new system, procedural training, revised business
process, and management change. The user training should not only focus on software
procedures but also the management changes and the concepts of process-orientation.
Both managers (as users) and end-users must have a common perception of the purpose
of the training, which is provided as part of the implementation process and will improve
their confidence and understanding of the ERP system. Before managers design an
appropriate education program, they must understand the difference between theirs and
the end-users' perceptions about what is being proposed. The study of Seng Woo (2007),
points out that users regard training as not essential, and they only attend because they
get forced by senior managers. Not having a clear view of how training works for them
does not allow them to understand the purpose of training (Reitsma, Hilletofth and
Mukhtar, 2018). The most considerable differences between end-users and user-managers
have a significant relation to the training mechanisms, the length, and detail of the training
and the users' confidence level after the completion of the entire training program
(Amoako‐Gyampah, 2004).
There were many challenges in training the project team members and the users as well.
Organizations might face difficulties in finding enough people from their functional
groups to conduct the training. Training material (documentation) should be well-
constructed, and the time period that the training sessions will be scheduled must be
scrutinized. Formal education and training should be provided from the beginning of the
implementation to the users who are involved in the business process redesign procedure
(Sherer and Alter, 2004). In addition, a proper investigation should be carried out
regarding the training costs, as they are often underestimated and might be multiple times
greater than initially anticipated. Training users for a more extended period might be cost-
prohibitive, or training users too early might lead to forgetfulness. Besides, other
implementation activities might hinder an organization's ability to process the needed
training (Amoako‐Gyampah, 2004).

-22-
Risks related to the training are displayed in Table 7.
Table 7. Risks factors related to the training
No. Risk Name Description
26 User training needs are
not appropriately
identified
User training needs have not been adequately identified
early in the implementation of the training materials, and
training sessions have not been customized for each
specific job.
27 Training content and
length are not designed
well
A formal education program has not been developed
appropriately to meet the users’ requirements regarding
the purpose, duration, and detail of the training.
28 User training has been
conducted either too
early or too late
The organization does not have a clear view of which is
the best time period for users to attend the training.
Training users, either too early or too late, might lead to
forgetfulness or education and skills deficiencies.
29 Users are not aware of
the importance of their
training
Users do not have a clear view of how important it is to
attend and how they will benefit from their training.
30 User training stops
after the end of the
project
ERP training stops after the completion of the project.
Therefore, education is not an ongoing procedure, and
users are not able to refresh their skills.
Communications and Technical Support
As Kumar, Maheshwari and Kumar (2003) stated, managers have found ERP
implementation projects as the most difficult system development projects. Within the
"Business Process" section was declared that organizations fail to reconcile the
technological imperatives of the enterprise systems with their business needs; the logic
of the system may collide with the philosophy of business processes. People are naturally
resistant to change, and it is not very easy to implement a system within an organization
without the required cooperation.
Thus, upfront and ongoing communication to all organizational employees affected by
the new ERP system is necessary to keep them informed of how the system can help them
do their jobs better. Multiple researchers pointed out the effective management of the
communications between project members and continuous support as critical success
factors that lead to successful ERP implementation (Tarhini et al., 2015). A shared vision
of the organization and the role of the new system and structures should be delivered to
all employees. Effective communication tells everyone in advance what is happening,
including the scope, objectives, and activities of the project (Berchet and Habchi, 2005).
Also, maintaining an open information policy for the project and close communication
and collaboration between external consultants and employees is a way to avoid the
various communication failures and have a significant impact on the success of such a
project.
To ensure success, organizations should run pilot testing and debugging of hardware and
software (Sherer and Alter, 2004) by populating the technical system with organizational
data before going live (Singla and Goyal, 2007). The literature recognizes that a common
problem among ERP applications is to assume that the ERP implementation finishes after

-23-
the system goes live and disband the implementation project team after the system goes
live (Ahmad and Pinedo Cuenca, 2013). The organizations should set-up a dedicated QA
environment which will remain active and functional even after the completion of the
implementation, to resolve any issues that may arise after the installation of the ERP
system and ensure accuracy and preciseness of data.
Risks related to the communications and technical support are displayed in Table 8.
Table 8. Risks factors related to the communications, and the technical support
No. Risk Name Description
31 Miscommunication
regarding the role of
the I.S. to all or any
staff members
All employees do not have a clear view of the new
system’s purpose and its relation to the organization’s
vision. There might also be a miscommunication
regarding the scope, objectives, and tasks of the ERP
implementation project.
32 Lack of culture with
shared values and
common aims
Lack of a common organizational culture has an impact
on the implementation team’s ability to share
knowledge and perspectives across diverse functions
during the implementation.
33 The organization does
not promote open
communications
The organization does not support Enterprise-wide open
communication and information sharing policies.
34 Adequate testing has
not been conducted
before the ERP system
goes live
Lack of proper testing could degrade the efficiency or
effectiveness of the ERP system if the hardware and
software contain serious bugs.
35 The project team is
disbanded when the
ERP system goes live
The implementation team should remain active and
functional after the system goes live, and the IT staff
should be able to resolve any issue that may arise after
the installation of the ERP system.

-24-
Chapter 4: Research Approach
This chapter presents the methodology used to collect the required data, the limitations
which were identified related to either the collection process or the people involved, as
well as part of the findings that have been derived from the research.
Data Collection
The method which was selected for primary data collection was a questionnaire survey
that has been emailed to the participants. Unlike the interviews, where the data is
generally collected by means of note-taking on open-ended questions, questionnaires
provide a predetermined set of questions that do not differ from person to person. It is a
combination of closed questions and statements that can be cumulated to form the
quantitative analysis. The participants can mark their answers on the basis of yes/no for
direct questions, select one or more responses from multiple alternatives, or rank by Likert
scale for statements. The creation of a structured questionnaire that examines the
instances that were identified during the literature review will bring forth a well-rounded
study with quantitative data analysis.
Questionnaires are a form of a written interview that can be carried out by mail, telephone,
or face to face. It is a relatively cheaper way to obtain a considerable volume of data
quickly and efficiently. The researcher does not have to be present at the time of data
collection, which makes it time productive. A problem often recognized is that some
respondents may lie in the questionnaire to look good. To avoid that, the questionnaire
used in this research requests the respondents to be anonymous.
Research Scopes and Limitations
Since this research study is conducted using questionnaires based on the literature
research instead of using a specific case study, the research is not limited to one particular
industry or area. A survey was designed and forwarded to people who had completed at
least one ERP implementation project in the past. The respondents were either members
of the organization that were developing and selling the information system (vendors), or
members of the organization which was interested in installing the system internally. In
both cases, the respondents participated in the implementation phase either as members
of the implementation team or were involved in this process to oversee and supervise.
The only limitation of the scope is that this research focuses on ERP projects in the private
sector. The implementation may be different in the public sector. Even though both of
them face similar obstacles and have identical goals, theories and thoughts in this research
may not be directly applicable in the public sector as the public sector can be more
complex and have procedures as well as legislation that does not apply to the private
sector.
Another limitation may be that there is a lack of research material in unsuccessful projects
because companies are reluctant to report and give details related to their failed projects
(Chakravorty, Dulaney and Franza, 2016). Which is not surprising, as this type of
sensitive information can give the public too much insider information and reveal the
company's weaknesses. This could affect why application failure rates are steep as they

-25-
are, as companies are reluctant to provide researchers with data. The aforementioned may
affect the outcome of the current research, as there may not be enough quantitative data
to analyze and provide a solid answer to the thesis question. Also, as this analysis is
conducted using an exploratory research approach, it does not focus on providing a
definitive answer, but it is focusing on gathering more information on the main topic.
Questionnaire design
The questionnaire has been designed based on a thorough review of the secondary data,
which have been collected from various sources, such as reference books, journals,
articles, Internet, and discussed in Chapter 3: Critical Risk Factors of ERP
Implementations. After generating 59 questionnaire items for the most significant risk
factor categories, these items were distributed to the supervisor of the dissertation and an
ERP consultant with previous experience in multiple implementation projects for an
academic review, to indicate either to keep, delete, or modify each question. It took
approximately one week to complete this analysis, which focused on assessing whether
the data accurately measured the proposed categories according to the definitions
provided and whether any additional areas had to be covered.
Based on the feedback from the reviewers, three sections have been merged, and two
categories and 59 questions have been deleted. Thus, the size of the questionnaire has
been significantly reduced, and better coherence was achieved. As a result, the final
survey consisted of 43 questions and three components:
▪ Respondent profile section,
▪ Company profile section, and
▪ Risk factor section.
The first two parts consisted of four questions each one, while the third part had seven
sub-sections with a total number of 35 items, 5 for each sub-section. In the Appendix are
displayed:
▪ The risk register (Table 1), including all the risks which were examined with the
survey,
▪ The survey questions related to the respondent and company profiles (Tables 2
and 3),
▪ The survey questions related to the risk factors (Tables 4 to 10), including also the
mean and standard deviation values, and
▪ the items which were excluded from the survey (Table 11) after the completion of
the review.
The survey was sent through email to approximately 200 employees. The selection
criteria for this sample were related to the background of each respondent, his current job
position, and his experience on projects related to the implementation of ERP systems.
The respondents were asked to categorize each item using a 5-point Likert scale with a
score of 1 labeled "This risk was not addressed", and a score of 5 labeled "Very High
Risk Level". Using these labels allows us to detect both the level of the risk that was
addressed during the implementation, but also provides us the probability level. Three
weeks after the initial mailing, 51 questionnaires have been submitted to the online
survey, resulting in a response rate of 25.5%.

-26-
Sample Demographics - Respondent and Firm Profiles
The target group of the survey in this study was people who had participated in ERP
implementation projects. A web questionnaire was constructed, and approximately 200
members of the Greek market were invited to engage with the research. The sample was
chosen because these members had expertise in the implementation of at least one ERP
project. All the respondents are assured that their responses would be kept confidential.
A total of 51 questionnaires were returned, 34 of which were answered by men (67%)
and 17 by women (33%).
The respondents were asked to identify their positions within the firm, their educational
background, age, and gender. The profile of the final sample of 51 questionnaires
included upper-level executives (16%), middle-level managers and consultants (59%),
junior-level consultants and employees (23%), and external consultants (2%). Almost half
of the respondents had an educational background of a Masters (MSc) or equivalent
degree (47%).
In addition, information related to the profile of the organization was required, such as
the size of the organization, the number of years the organization operates, and the
number of ERP implementations that have been conducted within the firm. Almost half
67%
33%
Gender
Male
Female
0% 2%10%
29%
47%
12%
Educational background (highest degree)
No formal education
High School
College or equivalent
Bachelor (Bs) or equivalent
Master (MSc) or equivalent
Doctoral (PHD) or equivalent

-27-
of the firms had been in business for a time period between 15 and 30 years (43%), while
at the same, in the question related to the number of employees within the company, it
has been observed that prices were evenly distributed across all available choices, with
options a. "Less than 50" (31%) and d. "More than 500" (22%), having the most
responses.
The vast majority of the respondents had experience from three or more implementations
of similar systems (61%), some of them were working on their first ERP system
implementation (25%), with some having an experience of two implementations (14%).
Furthermore, more than 73% of respondents had worked with more than one ERP system,
as their organizations were actively using multiple systems in the same facility.
A summary of the demographic characteristics for the sample are presented in Appendix,
in Tables 2 and 3, respectively.
31%
24%10%
8%
27%
Number of Employees
Less than 50
51-150
151-300
301-500
More than 500
25%
14%61%
Number of ERP Implementations
1
2
3 or more

-28-
Chapter 5: Risk Management
All business activities involve numerous risks, especially when taking in a new
investment project like ERP systems implementation. No company can act without
accepting any risk, and the expected revenue from the business must be related to the
risks involved. The task of risk management in the ERP project is to identify the potential
risks of ERP projects concerning the company's goals and to eliminate or minimize them.
The risk is defined as a result of uncertainty on the company's primary objectives, and
impact is considered to be a negative deviation from expected. These deviations can only
be managed if they are identified and understood in advance. Hence, this thesis uses the
basics of risk management, where the first step is to identify the risk and evaluate the risk.
Usually, in risk management, the probability of the risk is calculated. The current thesis
does not assess any particular case study provided by an organization. Therefore, the risk
analysis is based on the literature review, and the probability calculation will be executed
with the data which were collected through the online survey.
Risk analysis
Risk analysis of an information system is the process of identifying and evaluating the
security risks that the system introduces into the operations of an organization. With this
process are also defined the costs of a potential disaster that might be incurred by a
possible problem. This determines the degree of risk of the information system and the
security requirements that exist. In addition, it is also calculated the cost of preventing
any damage, so that risks can be handled appropriately on a rational basis.
Risk is assessed by identifying threats and vulnerabilities, then identifying the
probabilities and impacts of each risk. In a risk analysis, both the negative and the positive
results of an event can be analyzed. Within the current chapter will be conducted a review
of the risk factors which were identified in the literature. Most of them cause issues and
have a negative impact on the completion of the ERP implementation projects, and
therefore the operation of the organization. There are two types of risk analysis, which
will be discussed in the following sections, qualitative analysis, and quantitative analysis.
According to PMI, quantitative analysis, together with qualitative analysis, can yield the
best possible results on the risks that may arise in a project or activity.
Qualitative Data Analysis
Qualitative research involves gathering a great deal of information about a small number
of people and trying to develop a conceptual framework for the topic, e.g., a
categorization of factors affecting the implementation process of an ERP project. The
outcome is a full and rounded understanding of the behavior and actions of a few
individuals.
The qualitative analysis aims to prioritize the risks recorded in the literature. It begins
with the collection of information on the identified risk factors and results in their
classification as "Low," "Medium," or "High" risks. Once the threats are detected, they
can be grouped according to their importance and the probability of occurrence and
represented in a risk matrix.

-29-
Impact
No Risk
Level
Low Risk
Level
Medium
Risk Level
High Risk
Level
Very High
Risk Level L
ikel
ihood
Very High (M) (M) (H) (H) (H)
High (L) (M) (M) (H) (H)
Medium (L) (M) (M) (H) (H)
Low (L) (L) (M) (M) (H)
Very Low (L) (L) (L) (L) (M)
Η: High risk, that is unacceptable, and an immediate reaction is required.
M: Medium risk, a reaction might be necessary.
L: Low risk, no immediate action is needed but simple monitoring.
Although qualitative analysis does not provide accurate results, it is the one most
frequently used by stakeholders. This is because it is more easily accessible, requires less
execution time and less work by those who execute it.
Quantitative Data Analysis
To conduct the required classification that was mentioned previously in the "Qualitative
Analysis" and review the risk level of the factors that were detected in the literature, the
second type of analysis is required, which is called Quantitative Analysis. Quantitative
analysis is a superset of qualitative, as it includes all its elements but also mathematical
analysis. This analysis is essentially the quantification of qualitative analysis. Its purpose
is to describe in detail each risk and to prioritize among the threats recorded in the risk
register (Appendix, Table 1), allowing us to find the overall degree of risk of the project.
The occurrence of risk is based on two causing factors (threats and vulnerabilities) and
broken down into two components, impact and likelihood.
The quantitative analysis provides more robust handling on the probability and impact of
the risk since it quantifies both of them. Such a review is costly, time-consuming, and
may require a large amount of data. Only a few selected risks may be subjected to this
kind of analysis. As mentioned in Chapter 4 (Questionnaire design section), a
categorization took place, and some questions related to specific risk factors were
removed. These risk factors were either not detected in the implementation phase, such
as the selection of the appropriate vendor, which is conducted in the "Planning" phase, or
the number of references in the literature was not notable enough, indicating that these
risk factors were not significantly related to the outcome of an ERP implementation plan.
Based on the risk register list, a qualitative analysis has been performed for the selected
risks with the Expected monetary value (EMV) analysis. EMV analysis is recommended
for beginners because it is quite simple to implement and does not require a lot of data
gathering, and analysis can be performed using simple mathematics. After defining the
likelihood and the impact, the degree of exposure is defined, as follows:
𝐸𝑀𝑉 = 𝑙𝑖𝑘𝑒𝑙𝑖ℎ𝑜𝑜𝑑 × 𝑖𝑚𝑝𝑎𝑐𝑡

-30-
EMV analysis is used to calculate the average outcome of uncertain scenarios by
multiplying probability with the effects of each risk. In this research, the investigation of
each risk is performed individually, but a further analysis could be conducted regarding
the category of each threat, by calculating the EMV for each risk factor and summing
them up, as follows:
𝐸𝑀𝑉′ = ∑(𝑙𝑖𝑘𝑒𝑙𝑦ℎ𝑜𝑜𝑑 × 𝑖𝑚𝑝𝑎𝑐𝑡)
Priorities must be set for the likelihood of any danger and the consequence that it can
have on the organization. The probability and consequence sizes must be quantified and
evident by the analysts who designate them. Typically, word scales that create specific
levels are used to express these sizes. Below are provided some definitions of the
likelihood of risks and their impact, according to the Project Management Institute (PMI)
formulated in 2000 (Pmi.org, 2020).
Table 9. Likelihood of risks according to PMI
Likelihood Description
Very High Probability of occurrence from 80% to 100%
High Probability of occurrence from 60% to 80%
Medium Probability of occurrence from 30% to 60%
Low Probability of occurrence from 10% to 30%
Very Low Probability of occurrence up to 10%
Table 10. Impact of risks according to PMI
Impact Description Project Objective
Cost Schedule Scope Quality
Very Low Consequence
level up to
10%
Cost increase
more than 0%,
but less than
5%
Overall project
schedule delay
more than 0
days and less
than 1 week
Scope decrease
barely
noticeable
Quality
reduction
barely
noticeable
Low Consequence
level from 10%
to 30%.
Cost increase
more than 5%, but less than
10%
Overall project
schedule delay more than 1
week and less
than 2 weeks
Minor areas of
scope are affected
Quality
reduction does not affect vital
functionality Medium Consequence
level from 30%
to 50%.
High Consequence
level from 50%
to 70%.
Cost increase
more than
10%
Overall project
schedule delay
more than 2 weeks
Major areas of
scope are
affected; Scope reduction
unacceptable to
the client
Quality
reduction
requires client approval Very High Consequence
level from 70%
to 90%.
Following is an example of a risk exposure according to the scales previously presented
by the PMI for the likelihood of each risk occurring and the consequence it can have on

-31-
an organization. The values determined by multiplying the Impact Rating with Risk
Probability, as shown in the table below.
Impact
No Risk Level
(𝑥 = 0.05)
Low Risk
Level
(𝑥 = 0.2)
Medium Risk
Level
(𝑥 = 0.4)
High Risk
Level
(𝑥 = 0.6)
Very High
Risk Level
(𝑥 = 0.8)
Lik
elih
ood
Very High
(𝑥 = 0.9)
(M4)
𝐸𝑀𝑉 = 0.05
(M2)
𝐸𝑀𝑉 = 0.18
(H3)
𝐸𝑀𝑉 = 0.36
(H2)
𝐸𝑀𝑉 = 0.54
(H1)
𝐸𝑀𝑉 = 0.72
High
(𝑥 = 0.7)
(L1)
𝐸𝑀𝑉 = 0.04
(M2)
𝐸𝑀𝑉 = 0.14
(M1)
𝐸𝑀𝑉 = 0.28
(H3)
𝐸𝑀𝑉 = 0.42
(H2)
𝐸𝑀𝑉 = 0.56
Medium
(𝑥 = 0.5)
(L2)
𝐸𝑀𝑉 = 0.03
(M3)
𝐸𝑀𝑉 = 0.10
(M2)
𝐸𝑀𝑉 = 0.20
(H4)
𝐸𝑀𝑉 = 0.30
(H3)
𝐸𝑀𝑉 = 0.40
Low
(𝑥 = 0.3)
(L3)
𝐸𝑀𝑉 = 0.02
(L1)
𝐸𝑀𝑉 = 0.06
(M3)
𝐸𝑀𝑉 = 0.12
(M2)
𝐸𝑀𝑉 = 0.18
(H4)
𝐸𝑀𝑉 = 0.24
Very Low
(𝑥 = 0.1)
(L4)
𝐸𝑀𝑉 = 0.01
(L3)
𝐸𝑀𝑉 = 0.02
(L1)
𝐸𝑀𝑉 = 0.04
(L1)
𝐸𝑀𝑉 = 0.06
(M4)
𝐸𝑀𝑉 = 0.08
Η: High risk (high exposure), that is unacceptable, and an immediate reaction is
required.
M: Medium risk (medium exposure), a reaction might be necessary.
L: Low risk (low exposure), no immediate action is needed but simple monitoring.
The above table clearly shows that along with classifying the report as low, medium, or
high, the existence of a numerical description makes it much easier to identify the risk
groups that need to be addressed immediately. The risks have been grouped into
subcategories to achieve a more noticeable separation. Specifically, the risk in the H1
category is more dangerous than the risk in the H2 type, and this, in turn, is more
dangerous than the risk in the H3 group. The same categorization is applied for medium
and low risks. So, the degree of risk from the largest to the smallest, starting from the
most severe risk to the most harmless, is defined as follows:
𝐻1 > 𝐻2 > 𝐻3 > 𝐻4 > 𝛭1 > 𝛭2 > 𝛭3 > 𝑀4 > 𝐿1 > 𝐿2 > 𝐿3 > 𝐿4
Assumptions
In the first phase, an analysis was performed on the results obtained from the research.
As expected, it was observed that most of the respondents, due to their experience with
project implementation of corresponding systems, were able to provide reliable
information regarding the likelihood and the impact of a risk.
As noticed in Appendix, Tables 4 to 11 show relatively high likelihood rates, which is to
be expected since this study, as mentioned in frequency analysis in Chapter 2, examines
the factors with the highest probability of occurrence within the literature. Thus, because
of the high incidence of these risks, if these values had to be grouped in the risk matrix
correlating with the impact, all values would be either in the "High" or "Very High" area.

-32-
Therefore, to better visualize the results, considering the probability level is high enough
for all risks, an assumption will be conducted, that will separate the "High" and "Very
High" sections to five equal levels as it is defined in the tables below.
Likelihood Description
Very High Probability of occurrence from 96% to 100%
High Probability of occurrence from 92% to 96%
Medium Probability of occurrence from 88% to 92%
Low Probability of occurrence from 84% to 88%
Very Low Probability of occurrence up to 84%
Impact Description
Very High Consequence level from 80% to 88%
High Consequence level from 72% to 80%
Medium Consequence level from 64% to 72%
Low Consequence level from 56% to 64%
Very Low Consequence level up to 56%
A new risk matrix will be created with new likelihood rates, as it is displayed in the table
below:
Impact
1. No Risk
Level
(𝑥 = 0.52)
2. Low Risk
Level
(𝑥 = 0.6)
3. Medium
Risk Level
(𝑥 = 0.68)
4. High Risk
Level
(𝑥 = 0.76)
5. Very High
Risk Level
(𝑥 = 0.84)
Lik
elih
ood
5. Very High
(𝑥 = 0.98)
(M4)
𝐸𝑀𝑉 = 0.51
(M2)
𝐸𝑀𝑉 = 0.59
(H3)
𝐸𝑀𝑉 = 0.67
(H2)
𝐸𝑀𝑉 = 0.74
(H1)
𝐸𝑀𝑉 = 0.82
4. High
(𝑥 = 0.94)
(L1)
𝐸𝑀𝑉 = 0.49
(M2)
𝐸𝑀𝑉 = 0.56
(M1)
𝐸𝑀𝑉 = 0.64
(H3)
𝐸𝑀𝑉 = 0.71
(H2)
𝐸𝑀𝑉 = 0.79
3. Medium
(𝑥 = 0.90)
(L2)
𝐸𝑀𝑉 = 0.47
(M3)
𝐸𝑀𝑉 = 0.54
(M2)
𝐸𝑀𝑉 = 0.61
(H4)
𝐸𝑀𝑉 = 0.68
(H3)
𝐸𝑀𝑉 = 0.76
2. Low
(𝑥 = 0.86)
(L3)
𝐸𝑀𝑉 = 0.45
(L1)
𝐸𝑀𝑉 = 0.52
(M3)
𝐸𝑀𝑉 = 0.58
(M2)
𝐸𝑀𝑉 = 0.65
(H4)
𝐸𝑀𝑉 = 0.72
1. Very Low
(𝑥 = 0.82)
(L4)
𝐸𝑀𝑉 = 0.43
(L3)
𝐸𝑀𝑉 = 0.49
(L1)
𝐸𝑀𝑉 = 0.56
(L1)
𝐸𝑀𝑉 = 0.62
(M4)
𝐸𝑀𝑉 = 0.69
In the following table (Table 11) is defined the probability and the risk level of each
threat that has been identified. Based on the risk list is determined the exposure of each
risk to make the quantification of qualitative analysis.
Table 11. Risk factors exposure report
Number Likelihood Impact Exposure EMV
R1 2 (88%) 3 (0,709) M3 0,624
R2 1 (84%) 3 (0,654) L1 0,549
R3 4 (94%) 3 (0,694) M1 0,652
R4 4 (94%) 3 (0,694) M1 0,652

-33-
R5 1 (84%) 1 (0,568) L4 0,477
R6 3 (90%) 3 (0,662) M2 0,596
R7 2 (88%) 3 (0,705) M3 0,620
R8 2 (88%) 2 (0,623) L1 0,548
R9 4 (96%) 3 (0,705) M1 0,677
R10 4 (96%) 3 (0,713) M1 0,684
R11 3 (90%) 2 (0,619) M3 0,557
R12 3 (90%) 2 (0,639) M3 0,575
R13 3 (90%) 3 (0,686) M2 0,617
R14 3 (90%) 3 (0,650) M2 0,585
R15 5 (98%) 4 (0,780) H2 0,764
R16 3 (92%) 4 (0,721) H4 0,663
R17 5 (98%) 3 (0,698) H3 0,684
R18 4 (96%) 4 (0,717) H3 0,688
R19 2 (88%) 1 (0,564) L3 0,496
R20 4 (94%) 3 (0,690) M1 0,649
R21 2 (88%) 3 (0,694) M3 0,611
R22 4 (94%) 3 (0,674) M1 0,634
R23 3 (92%) 3 (0,678) M2 0,624
R24 2 (86%) 3 (0,662) M3 0,569
R25 3 (92%) 3 (0,654) M2 0,602
R26 5 (98%) 3 (0,670) H3 0,657
R27 4 (96%) 3 (0,682) M1 0,655
R28 3 (92%) 3 (0,658) M2 0,605
R29 3 (92%) 2 (0,607) M3 0,558
R30 3 (90%) 3 (0,650) M2 0,585
R31 3 (92%) 3 (0,701) M2 0,645
R32 4 (96%) 3 (0,666) M1 0,639
R33 3 (92%) 3 (0,650) M2 0,598
R34 5 (100%) 5 (0,8) H1 0,800
R35 2 (88%) 3 (0,686) M3 0,604
All risks have been grouped in their categories, allowing us to define the probability and
impact for each category. These variables allow us to conduct a quantitative analysis of
each risk category and calculate its exposure with the aid of the risk matrix.
Table 12. Risk category exposure report
Risk Category Likelihood Impact Exposure EMV’
Strategic Initiatives 2 (89%) 3 (0,664) M3 0,591
Business Processes – Change Management 3 (92%) 3 (0,682) M2 0,627
Executive Commitment 3 (92%) 3 (0,675) M2 0,621
Project Management – Project Team 4 (94%) 3 (0,678) M1 0,637
Project Leader 3 (91%) 3 (0,673) M2 0,612
Training 4 (94%) 3 (0,654) M1 0,615
Communications – Technical Support 4 (94%) 3 (0,701) M1 0,659

-34-
Risk Management Strategy
In a scenario that takes place in the near world, if the implementation and risk
management teams are aware of the risk register, they will be able to understand the
significance between the project operations and the identified risks in the risk report. That
would allow them to find the appropriate means either to prevent or to deal with them if
they occur. The methods of dealing with threats are avoidance, transfer, mitigation, and
acceptance.
Table 13. Evaluation of ERP implementation risks
Number Likelihood Impact Exposure Priority
R34 5 5 H1 1
R15 5 4 H2 2
R18 4 4 H3 3
R17 5 3 H3 4
R26 5 3 H3 5
R16 3 4 H4 6
R10 4 3 M1 7
R9 4 3 M1 8
R27 4 3 M1 9
R3 4 3 M1 10
R4 4 3 M1 11
R20 4 3 M1 12
R32 4 3 M1 13
R22 4 3 M1 14
R31 3 3 M2 15
R23 3 3 M2 16
R13 3 3 M2 17
R25 3 3 M2 18
R33 3 3 M2 19
R6 3 3 M2 20
R14 3 3 M2 21
R30 3 3 M2 22
R28 3 3 M2 23
R1 2 3 M3 24
R7 2 3 M3 25
R21 2 3 M3 26
R35 2 3 M3 27
R12 3 2 M3 28
R24 2 3 M3 29
R29 3 2 M3 30
R11 3 2 M3 31
R2 1 3 L1 32
R8 2 2 L1 33
R19 2 1 L3 34
R5 1 1 L4 35

-35-
The acceptable risks must be monitored to check their status during the implementation
of the system. The risks that need to be reduced, either the likelihood of occurrence or the
consequence they may have, must be found in some alternative plans to be implemented
either before or after their appearance. Finally, the risks to be avoided are those that can
have the most significant impact on the implementation and operations of the system, and
alternative ways should be found to eliminate them.
For example, the risk "Adequate testing has not been conducted before the ERP system
goes live" has an H1 exposure rate and is considered to be the most important, whereas
the risk "The ERP is not related to the business goals" has an L1 exposure rate and is
considered less significant. The table below shows the classification of risks according to
their exposure, and the priority of each risk (Table 14). Despite the fact that the “Training”
factor was identified on having an M1 exposure level, is comparatively lower in the
ranking than factors "Business Processes & Change Management" and "Executive
Commitment". This is due to the fact that the EMV' value is calculated with the likelihood
and impact rates, which were at the lowest values they could get in that particular field.
Table 14. Evaluation of ERP implementation risk categories
Risk Category Likelihood Impact Exposure Priority
Communications & Technical Support 4 3 M1 1
Project Management & Project Team 4 3 M1 2
Business Processes & Change Management 3 3 M2 3
Executive Commitment 3 3 M2 4
Training 4 3 M1 5
Project Leader 3 3 M2 6
Strategic Initiatives 2 3 M3 7

-36-
Chapter 6: Results and Discussions
This thesis has been conducted by performing exploratory research using secondary data
intending to find an answer to the research question: What are the risk factors of ERP
project? To fulfill this goal, the meaning of the ERP system to the organization and its
relationship to the organization's operations had to be understood. The literature indicated
that the riskiest life stage of an ERP project is the implementation phase, and therefore,
the investigation focused on this field. Pointing out that the risks of ERP projects are
either formed in the implementation phase, or the outcome of risks related to the outcome
of the project (i.e., goals, costs, and resources) appear especially at this phase, even
though they have been caused by improper management in previous stages.
After receiving a coherent picture of ERP systems, the research for the risk factors of ERP
project was undertaken. During the literature review, a frequency analysis of the critical
risk factor instances was conducted. Findings in the frequency analysis showed that
factors associated with business processes, senior management, project management, and
strategic planning, emerged as the most widespread, as these topics are the most discussed
and have the most references in the literature. After identifying the most critical risk
categories, a comprehensive analysis has been performed both to these categories and the
risk factors which were located within these groups. However, it would be unwise to draw
firm conclusions on the strength of the results of only a literature review. After the
completion of this analysis, a questionnaire has been designed, which focused on the most
important risk factors identified in the literature and was forwarded to people who had
previous experience with at least one ERP implementation project. The purpose of the
research is to confirm whether the factors identified in the literature are actually related
to threats identified during the implementation of an ERP system by qualified people in
similar situations.
Through the findings of the survey, a slight differentiation has been identified regarding
the factors that occur more regularly in implementations that took place in the real-life,
and their impact level for the project. A quantitative analysis has been performed,
allowing us to determine the exposure rate for each category and receive the ranking list
for each group of risks, with the aid of the risk matrix, which was defined in Chapter 5.
Table 15 shows the differentiation in the ranking between the risks identified in the
literature and those generated after analyzing the survey results.
Table 15. Risk factor categories ranking of the survey vs. the literature.
Risk Category Survey Ranking Bibliography Ranking
Communications & Technical Support 1 15
Project Management & Project Team 2 3 & 9
Business Processes & Change Management 3 1 & 7
Executive Commitment 4 2
Training 5 10
Project Leader 6 17
Strategic Initiatives 7 4
It is acknowledged that many of the risk factors have been classified at the same level
both in the literature review and quantitative survey analysis. Risk categories related to

-37-
project management, business processes, and executive commitment are in the top ranks
in both lists. On the other hand, the strategic planning category, which was very high in
the literature analysis, seems to hold the last position in the responses, which probably
means that currently is given more emphasis on this risk category, and a more reliable
analysis is handled related to the strategies and goals of the organizations, causing a
reduction of the threats that occur related to this section. In addition, the communications
and technical support categories, which were considerably low in the literature review,
appear to maintain the highest degree of risk in the survey analysis. In the Appendix are
also included graphic representations of the risk categories depending on the position of
the respondents within their organization and their educational background.
Any organization that wishes to implement a new ERP system must consider the above-
mentioned risks and take necessary actions to prevent threats or minimize their effect.
Lack of empirical studies concerning communications and technical support during the
development of an ERP project was recognized. Therefore, this thesis suggests further
research, and careful studies via empirical methods should be guided towards these risk
factors as they are tightly related to the ERP project outcome.
Additionally, further investigation should probably have to be conducted that will focus
only on ERP systems, which are associated with a cloud environment, as this type of
system is growing exponentially from 2017 as it was stated by Panorama Consulting
Group (2020). Cloud ERP is more convenient to control and requires a smaller investment
in the long term than on-premises ERP systems. Cloud ERP data are also accessible
through any device with internet access, adding a level of convenience to the cloud versus
the on-premises ERP. Most importantly, cloud ERP enables businesses to make better
use of their data and to work smarter (Alagna, 2020). However, security is a huge aspect
of these systems that involve high risks. A cloud environment is associated with many
risks such as confidentiality, privacy, integrity. Even though cloud ERP has many
benefits, organizations need to consider those security risks related to the cloud before
moving into the implementation of a cloud-based environment.

-38-
Bibliography
Journals
Afshin, J., Samira, A., Angel, R. and Daoud, A. (2014). A New Framework for Risk
Assessment in ERP Maintenance. IEEE.
Ağaoğlu, M., Yurtkoru, E. and Ekmekçi, A. (2015). The Effect of ERP Implementation
CSFs on Business Performance: An Empirical Study on Users’ Perception. Procedia -
Social and Behavioral Sciences, 210, pp.35-42.
Ahmad, M. and Pinedo Cuenca, R. (2013). Critical success factors for ERP
implementation in SMEs. Robotics and Computer-Integrated Manufacturing, 29(3),
pp.104-111.
Al-Mashari, M., Al-Mudimigh, A. and Zairi, M. (2003). Enterprise resource planning: A
taxonomy of critical factors. European Journal of Operational Research, 146(2), pp.352-
364.
Aladwani, A. (2001). Change management strategies for successful ERP implementation.
Business Process Management Journal, 7(3), pp.266-275.
Ali, M. and Miller, L. (2017). ERP system implementation in large enterprises – a
systematic literature review. Journal of Enterprise Information Management, 30(4),
pp.666-692.
Aloini, D., Dulmin, R. and Mininno, V. (2007). Risk management in ERP project
introduction: Review of the literature. Information & Management, 44(6), pp.547-567.
Aloini, D., Dulmin, R. and Mininno, V. (2012). Risk assessment in ERP projects.
Information Systems, 37(3), pp.183-199.
Amid, A., Moalagh, M. and Zare Ravasan, A. (2012). Identification and classification of
ERP critical failure factors in Iranian industries. Information Systems, 37(3), pp.227-237.
Amoako‐Gyampah, K. (2004). ERP implementation factors. Business Process
Management Journal, 10(2), pp.171-183.
Berchet, C. and Habchi, G. (2005). The implementation and deployment of an ERP
system: An industrial case study. Computers in Industry, 56(6), pp.588-605.
Bingi, P., Sharma, M. and Godla, J. (1999). Critical Issues Affecting an ERP
Implementation. Information Systems Management, 16(3), pp.7-14.
Boltena, A. and Gomez, J. (2012). A Successful ERP Implementation in an Ethiopian
Company: A case Study of ERP Implementation in Mesfine Industrial Engineering Pvt.
Ltd. Procedia Technology, 5, pp.40-49.
Boonstra, A. (2006). Interpreting an ERP-implementation project from a stakeholder
perspective. International Journal of Project Management, 24(1), pp.38-52.
Chakravorty, S., Dulaney, R. and Franza, R. (2016). ERP implementation failures: a case
study and analysis. International Journal of Business Information Systems, 21(4), p.462.

-39-
Chang, B., Kuo, C., Wu, C. and Tzeng, G. (2015). Using Fuzzy Analytic Network Process
to assess the risks in enterprise resource planning system implementation. Applied Soft
Computing, 28, pp.196-207.
Chen, I. (2001). Planning for ERP systems: analysis and future trend. Business Process
Management Journal, 7(5), pp.374-386.
Dezdar, S. and Ainin, S. (2011). Examining ERP implementation success from a project
environment perspective. Business Process Management Journal, 17(6), pp.919-939.
Eckartz, S., Daneva, M., Wieringa, R. and van Hillegersberg, J. (2009). A conceptual
framework for ERP benefit classification: A literature review University Twente.
Fui‐Hoon Nah, F., Lee‐Shang Lau, J. and Kuang, J. (2001). Critical factors for successful
implementation of enterprise systems. Business Process Management Journal, 7(3),
pp.285-296.
Garg, P. and Garg, A. (2013). An empirical study on critical failure factors for enterprise
resource planning implementation in Indian retail sector. Business Process Management
Journal, 19(3), pp.496-514.
Hasibuan, Z. and Dantes, G. (2012). Priority of Key Success Factors (KSFS) on
Enterprise Resource Planning (ERP) System Implementation Life Cycle. Journal of
Enterprise Resource Planning Studies, pp.1-15.
Holland, C. and Light, B. (1999). A critical success factors model for ERP
implementation. IEEE Software, 16(3), pp.30-36.
Hong, K. and Kim, Y. (2002). The critical success factors for ERP implementation: an
organizational fit perspective. Information & Management, 40(1), pp.25-40.
Huang, S., Chang, I., Li, S. and Lin, M. (2004). Assessing risk in ERP projects: identify
and prioritize the factors. Industrial Management & Data Systems, 104(8), pp.681-688.
Jagoda, K. and Samaranayake, P. (2017). An integrated framework for ERP system
implementation. International Journal of Accounting & Information Management, 25(1),
pp.91-109.
Jarrar, Y., Mudimigh, A. and Zairi, M. (2000). ERP implementation critical success
factors - The role and impact of business process management. IEEE.
Kumar, V., Maheshwari, B. and Kumar, U. (2003). An investigation of critical
management issues in ERP implementation: emperical evidence from Canadian
organizations. Technovation, 23(10), pp.793-807.
Lemonakis, C., Sariannidis, N., Garefalakis, A. and Adamou, A. (2018). Visualizing
operational effects of ERP systems through graphical representations: current trends and
perspectives. Annals of Operations Research.
Lopez, C. and Salmeron, J. (2014). Dynamic risks modelling in ERP maintenance
projects with FCM. Information Sciences, 256, pp.25-45.
López, C. and Salmeron, J. (2014). Modeling maintenance projects risk effects on ERP
performance. Computer Standards & Interfaces, 36(3), pp.545-553.

-40-
Maditinos, D., Chatzoudes, D. and Tsairidis, C. (2011). Factors affecting ERP system
implementation effectiveness. Journal of Enterprise Information Management, 25(1),
pp.60-78.
Marsh, A. (2000). The Implementation Of Enterprise Resource Planning Systems In
Small-Medium Manufacturing Enterprises In South-East Queensland: A Case Study
Approach.
Motwani, J., Mirchandani, D., Madan, M. and Gunasekaran, A. (2002). Successful
implementation of ERP projects: Evidence from two case studies. International Journal
of Production Economics, 75(1-2), pp.83-96.
Motwani, J., Subramanian, R. and Gopalakrishna, P. (2005). Critical factors for
successful ERP implementation: Exploratory findings from four case studies. Computers
in Industry, 56(6), pp.529-544.
Muscatello, J. and Chen, I. (2008). Enterprise Resource Planning (ERP) Implementations.
International Journal of Enterprise Information Systems, 4(1), pp.63-83.
Ngai, E., Law, C. and Wat, F. (2008). Examining the critical success factors in the
adoption of enterprise resource planning. Computers in Industry, 59(6), pp.548-564.
Pan, K., Baptista Nunes, M. and Chao Peng, G. (2011). Risks affecting ERP post‐
implementation. Journal of Manufacturing Technology Management, 22(1), pp.107-130.
Panayiotou, N., Gayialis, S., Panayiotou, T. and Leopoulos, V. (2004). Risk Management
Issues in the Implementation of an ERP System for a Large Greek Company. WSEAS
Transactions on Computers.
Raj Singla, A. and Goyal, D. (2006). Managing risk factors in ERP implementation and
design: an empirical investigation of the Indian industry. Journal of Advances in
Management Research, 3(1), pp.59-67.
Rajnoha, R., Kádárová, J., Sujová, A. and Kádár, G. (2014). Business Information
Systems: Research Study and Methodological Proposals for ERP Implementation Process
Improvement. Procedia - Social and Behavioral Sciences, 109, pp.165-170.
Rashid, M., Hossain, L. and Patrick, J. (2002). The Evolution of ERP Systems: A
Historical Perspective Mohammad.
Reitsma, E., Hilletofth, P. and Mukhtar, U. (2018). Enterprise Resource Planning System
Implementation: A User Perspective. Operations and Supply Chain Management: An
International Journal, 11(3), pp.110-117.
Rothenberger, M. and Srite, M. (2009). An Investigation of Customization in ERP System
Implementations. IEEE Transactions on Engineering Management, 56(4), pp.663-676.
Sammon, D. and Adam, F. (2010). Project preparedness and the emergence of
implementation problems in ERP projects. Information & Management, 47(1), pp.1-8.
Sarkis, J. and Sundarraj, R. (2003). Managing large-scale global enterprise resource
planning systems: a case study at Texas Instruments. International Journal of Information
Management, 23(5), pp.431-442.
Saumyendu, G. (2002). Challenges on a global implementation of ERP software. IEEE.

-41-
Scott, J. and Vessey, I. (2002). Managing risks in enterprise systems implementations.
Communications of the ACM, 45(4), pp.74-81.
Seng Woo, H. (2007). Critical success factors for implementing ERP: the case of a
Chinese electronics manufacturer. Journal of Manufacturing Technology Management,
18(4), pp.431-442.
Sherer, S. and Alter, S. (2004). Information Systems Risks and Risk Factors: Are They
Mostly About Information Systems?. Communications of the Association for Information
Systems, 14.
Singla, A. and Goyal, D. (2007). Success factors in ERP systems design implementation:
an empirical investigation of the Indian industry. International Journal of Business
Information Systems, 2(4), p.444.
Siong, C. and Arachich, S. (2015). Literature Based Review -Risks In Erp Systems
Including Asian Countries. Samantha Mathara Arachchi. 3(1), pp.1-14.
Subramanian, R. and Taterh, S. (2018). Risk based ERP Implementation framework for
Higher Education Institutions. International Journal of Pure and Applied Mathematics,
119(12), pp. 16211-16221.
Sumner, M. (2000). Risk factors in enterprise-wide/ERP projects. Journal of Information
Technology, 15(4), pp.317-327.
Tarhini, A., Ammar, H., Tarhini, T. and Masa'deh, R. (2015). Analysis of the Critical
Success Factors for Enterprise Resource Planning Implementation from Stakeholders’
Perspective: A Systematic Review. International Business Research, 8(4).
Thangamani, G. (2018). Practical Risk Assessment Methodology for ERP Project
Implementation. Journal of Economics, Business and Management, 6(3), pp.84-90.
Umar, M., Khan, N., Agha, M. and Abbas, M. (2016). Exploring The Factors Affecting
Erp Implementation Quality. Journal of Quality and Technology Management, XII(I),
pp.137-155.
Yildirim, V. and Kusakci, A. (2018). The Critical Success Factors Of Erp Selection And
Implementation: A Case Study In Logistics Sector. Journal of International Trade,
Logistics and Law, 4(1), pp.138-146.
Yusuf, Y., Gunasekaran, A. and Abthorpe, M. (2004). Enterprise information systems
project implementation:. International Journal of Production Economics, 87(3), pp.251-
266.
Zeng, Y. and Skibniewski, M. (2013). Risk assessment for enterprise resource planning
(ERP) system implementations: a fault tree analysis approach. Enterprise Information
Systems, 7(3), pp.332-353.
Dissertations
Harris, S. (2017). Evaluating the implementation of ERP system and is impact on the
business process: A case study on Sibca Electronics LLC.. Master of Business
Administration. Cardiff Metropolitan University.

-42-
Markkanen, V. (2018). Risk factors in ERP project. Bachelor of Business Administration.
Helsinki Metropolia University of Applied Sciences.
Selvakumar, S. (2011). Critical Success Factors of ERP Implementation. Master of
Science in Mechanical Engineering. University of Toledo.
Woosang, H. (2011). The Drivers Of Erp Implementation And Its Impact On
Organizational Capabilities And Performance And Customer Value. Doctor of
Philosophy in Manufacturing Management. University of Toledo
Websites
Alagna, C. (2020). Top 5 Business Benefits of Cloud ERP. [online] Hitachi Solutions.
Available at: https://us.hitachi-solutions.com/blog/benefits-of-cloud-erp/ [Accessed 3
Feb. 2020].
Dysel. (2020). 7 Risks when selecting new ERP software. [online] Available at:
https://dysel.com/knowledge-centre/blog/7-risks-when-selecting-new-erp-software
[Accessed 22 Dec. 2019].
Panorama Consulting Group (2020). Five Surprising Takeaways From The 2018 ERP
Software Report | ERP. [online] Panorama Consulting Group. Available at:
https://www.panorama-consulting.com/five-surprising-takeaways-from-the-2018-erp-
software-report/ [Accessed 6 Feb. 2020].
Pemeco Consulting. (2020). Four ERP Selection Risks that Torpedo Your Project (and
How to Avoid them) - Pemeco Consulting. [online] Available at:
https://www.pemeco.com/quash-erp-selection-failure-risks-before-they-torpedo-your-
project/ [Accessed 19 Nov. 2019].
Pmi.org. (2020). Risk analysis and management. [online] Available at:
https://www.pmi.org/learning/library/risk-analysis-project-management-7070 [Accessed
10 Jan. 2020].

-1-
Appendix
Table 1. Risk register
Number Risk Description
R1 The organization does not have clear strategic IT goals
R2 The ERP is not related to the business goals
R3 Lack of strategic guidelines regarding IT planning
R4 Lack of continuous evaluation of the strategic goals
R5 An analysis of risks, costs and resources has not been conducted
R6 Business processes are modified during the implementation of the ERP system
R7 Leadership does not support BPR (Business Process Reengineering)
R8 Cross-functional members are not involved in BPR team
R9 Employees reject changes
R10 Employees do not understand how their actions impact the organization
R11 Top Management is doubtful regarding ERP investment
R12 Top Management is unaware of the ERP system benefits
R13 Top Management resist change and smooth system rollout
R14 Top Management undervalues the need for long term support for the ERP System
R15 Top Management does not provide the required time and resources.
R16 The project schedule and objectives are not defined clearly
R17 Milestones are not used to measure the project completion rate
R18 The project team mix is not well structured
R19 External consultants are not part of the project team
R20 Team members do not accept their roles and responsibilities
R21 ERP project leader is inexperienced and unaware of business goals
R22 The ERP project leader is unable to provide motivating leadership
R23 EPR project leader is unable to resolve conflicts and manage resistance
R24 ERP project leader is unaware of the team’s skills and knowledge
R25 ERP project leader is not accepted by all team members
R26 User training needs are not appropriately identified
R27 Training content and length are not designed well
R28 User training has been conducted too early/late
R29 Users are not aware of the importance of their training
R30 User training stops after the end of the project
R31 Miscommunication regarding the role of the I.S. to all or any staff members
R32 Lack of culture with shared values and common aims
R33 The organization does not promote open communications
R34 Adequate testing has not been conducted before the ERP system goes live
R35 The project team is disbanded when the ERP system goes live

-2-
Table 2. Respondent profile
Gender Count Percentage
Female 34 67%
Male 17 33%
Age Group Count Percentage
18 – 24 1 2%
25 – 34 22 43%
35 – 44 17 33%
45 – 54 9 18%
55 – 65 1 2%
65 or older 1 2%
Position in the organization Count Percentage
Junior Level (Junior Consultants and other employees) 12 24%
Middle Level (Head of Department, Business Managers, Consultants,
etc.) 30 59%
Upper Level (Top Management, Business Executives, etc.) 8 16%
1 2%
Educational background (highest degree) Count Percentage
No formal education 0 0%
High School 1 2%
College or equivalent 5 10%
Bachelor (Bs) or equivalent 15 29%
Master (MSc) or equivalent 24 47%
Doctoral (PHD) or equivalent 6 12%
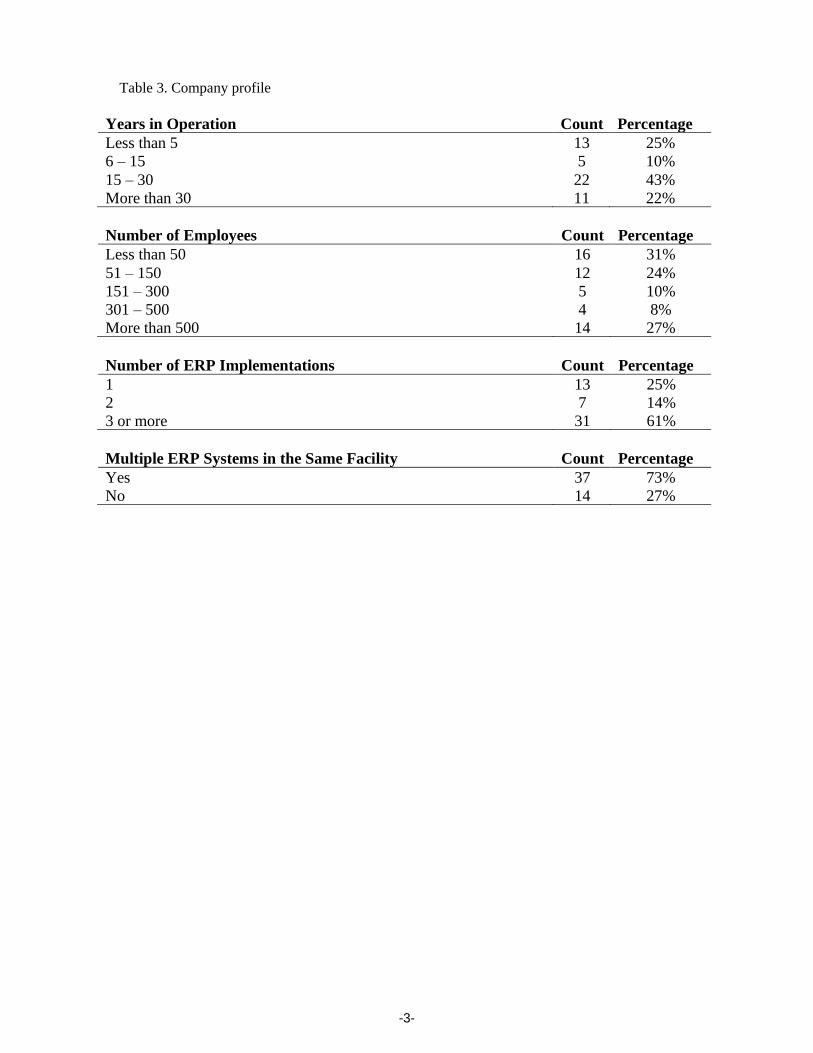
-3-
Table 3. Company profile
Years in Operation Count Percentage
Less than 5 13 25%
6 – 15 5 10%
15 – 30 22 43%
More than 30 11 22%
Number of Employees Count Percentage
Less than 50 16 31%
51 – 150 12 24%
151 – 300 5 10%
301 – 500 4 8%
More than 500 14 27%
Number of ERP Implementations Count Percentage
1 13 25%
2 7 14%
3 or more 31 61%
Multiple ERP Systems in the Same Facility Count Percentage
Yes 37 73%
No 14 27%

-4-
Table 4. Strategic Initiatives
Statement/Question No Risk
Level
Low Risk
Level
Medium
Risk Level
High Risk
Level
Very High
Risk Level
Organization does not have clear
strategic IT goals 6 (12%) 5 (10%) 6 (12%) 23 (46%) 11 (22%)
The is not related to the business
goals 8 (16%) 7 (14%) 5 (10%) 25 (50%) 6 (12%)
Lack of strategic guidelines
regarding IT planning 3 (6%) 6 (12%) 11 (22%) 26 (51%) 5 (10%)
Lack of continuous evaluation of the
strategic goals 3 (6%) 5 (10%) 15 (30%) 21 (42%) 7 (14%)
A risk and cost analysis has been
conducted before the implementation 8 (16%) 10 (20%) 17 (34%) 14 (28%) 2 (4%)
Indicator Mean Std Dev Likelihood
Organization does not have clear strategic IT goals 1,27 3,549 88%
The is not related to the business goals 1,297 3,275 84%
Lack of strategic guidelines regarding IT planning 1,027 3,471 94%
Lack of continuous evaluation of the strategic goals 1,046 3,471 94%
A risk and cost analysis has been conducted before the
implementation
1,046
2,843
84%
0
0.5
1
1.5
2
2.5
3
3.5
4
4.5
5
R1 R2 R3 R4 R5
Position in the organization mean values
External Members (Buyers, Vendors, etc.)
Junior Level (Junior Consultants and other employees)
Middle Level (Head of Department, Business Managers, Consultants, etc.)
Upper Level (Top Management, Business Executives, etc.)
0 1 2 3 4 5
High School
College or equivalent
Bachelor (Bs) or equivalent
Master (MSc) or equivalent
Doctoral (PHD) or equivalent
Educational background mean values
R5 R4 R3 R2 R1

-5-
Table 5. Business Processes & Change Management
Statement/Question No Risk
Level
Low Risk
Level
Medium
Risk Level
High Risk
Level
Very High
Risk Level
Business processes are modified
during the implementation 5 (10%) 6 (12%) 13 (26%) 22 (44%) 5 (10%)
Leadership does not support BPR
(Business Process Reengineering) 6 (12%) 5 (10%) 10 (20%) 16 (32%) 14 (28%)
Cross-functional members are not
involved in BPR team 6 (12%) 10 (20%) 11 (22%) 20 (40%) 4 (8%)
Employees reject changes 2 (4%) 6 (12%) 14 (28%) 21 (42%) 8 (16%)
Employees do not understand how
their actions impact the organization. 2 (4%) 4 (8%) 14 (28%) 25 (50%) 6 (12%)
Indicator Mean Std Dev Likelihood
Business processes are modified during the implementation 1,122 3,314 90%
Leadership does not support BPR (Business Process Reengineering) 1,317 3,529 88%
Cross-functional members are not involved in BPR team 1,177 3,118 88%
Employees reject changes 1,027 3,529 96%
Employees do not understand how their actions impact the
organization.
1,027
3,569
96%
0
0.5
1
1.5
2
2.5
3
3.5
4
4.5
5
R6 R7 R8 R9 R10
Position in the organization mean values
External Members (Buyers, Vendors, etc.)
Junior Level (Junior Consultants and other employees)
Middle Level (Head of Department, Business Managers, Consultants, etc.)
Upper Level (Top Management, Business Executives, etc.)
0 1 2 3 4 5
High School
College or equivalent
Bachelor (Bs) or equivalent
Master (MSc) or equivalent
Doctoral (PHD) or equivalent
Educational background mean values
R10 R9 R8 R7 R6

-6-
Table 6. Executive Commitment/Senior Management (S.M.)
Statement/Question No Risk
Level
Low Risk
Level
Medium
Risk Level
High Risk
Level
Very High
Risk Level
The organization's S.M. is doubtful
regarding the investment 5 (10%) 10 (20%) 14 (28%) 19 (38%) 3 (6%)
The organization's S.M. is unaware
of the benefits 5 (10%) 7 (14%) 17 (34%) 17 (34%) 5 (10%)
The organization's S.M. resists
change and smooth system rollout 5 (10%) 5 (10%) 13 (26%) 19 (38%) 9 (18%)
The organization's S.M. undervalues
the need for long term support for the
I.S. 5 (10%) 7 (14%) 12 (24%) 24 (48%) 3 (6%)
The organization's S.M. does not
provide the required time and
resources 1 (2%) 4 (8%) 10 (20%) 20 (40%) 16 (32%)
Indicator Mean Std Dev Likelihood
The organization's S.M. is doubtful regarding the investment 1,1001 3,098 90%
The organization's S.M. is unaware of the benefits 1,1139 3,196 90%
The organization's S.M. resists change and smooth system rollout 1,1875 3,431 90%
The organization's S.M. undervalues the need for long term support
for the I.S.
1,0926
3,255
90%
The organization's S.M. does not provide the required time and
resources
1,0926
3,902
98%
0
0.5
1
1.5
2
2.5
3
3.5
4
4.5
5
R11 R12 R13 R14 R15
Position in the organization mean values
External Members (Buyers, Vendors, etc.)
Junior Level (Junior Consultants and other employees)
Middle Level (Head of Department, Business Managers, Consultants, etc.)
Upper Level (Top Management, Business Executives, etc.)
0 1 2 3 4 5
High School
College or equivalent
Bachelor (Bs) or equivalent
Master (MSc) or equivalent
Doctoral (PHD) or equivalent
Educational background mean values
R15 R14 R13 R12 R11

-7-
Table 7. Project Management & Project Team
Statement/Question No Risk
Level
Low Risk
Level
Medium
Risk Level
High Risk
Level
Very High
Risk Level
Project schedule and objectives are
not defined clearly 4 (8%) 3 (6%) 10 (20%) 26 (51%) 8 (16%)
Milestones are not used to measure
project completion rate 1 (2%) 4 (8%) 21 (42%) 19 (38%) 6 (12%)
The project team mix is not well
structured 2 (4%) 6 (12%) 13 (26%) 20 (40%) 10 (20%)
External consultants are not
members of the project team 6 (12%) 16 (32%) 12 (24%) 15 (30%) 2 (4%)
Team members do not accept their
roles and responsibilities 3 (6%) 9 (18%) 9 (18%) 22 (44%) 8 (16%)
Indicator Mean Std Dev Likelihood
Project schedule and objectives are not defined clearly 1,0785 3,608 92%
Milestones are not used to measure project completion rate 0,8803 3,490 98%
The project team mix is not well structured 1,0616 3,588 96%
External consultants are not members of the project team 1,1083 2,824 88%
Team members do not accept their roles and responsibilities 1,1083 3,451 94%
0
0.5
1
1.5
2
2.5
3
3.5
4
4.5
5
R16 R17 R18 R19 R20
Position in the organization mean values
External Members (Buyers, Vendors, etc.)
Junior Level (Junior Consultants and other employees)
Middle Level (Head of Department, Business Managers, Consultants, etc.)
Upper Level (Top Management, Business Executives, etc.)
0 1 2 3 4 5
High School
College or equivalent
Bachelor (Bs) or equivalent
Master (MSc) or equivalent
Doctoral (PHD) or equivalent
Educational background mean values
R20 R19 R18 R17 R16

-8-
Table 8. Project Leader
Statement/Question No Risk
Level
Low Risk
Level
Medium
Risk Level
High Risk
Level
Very High
Risk Level
The Project Leader is inexperienced
and unaware of business goals 6 (12%) 6 (12%) 12 (24%) 12 (24%) 15 (30%)
The Project Leader is unable to
provide motivating leadership 3 (6%) 6 (12%) 16 (32%) 21 (42%) 5 (10%)
The Project Leader is unable to
resolve conflicts and manage
resistance 4 (8%) 7 (14%) 12 (24%) 21 (42%) 7 (14%)
The Project Leader is unaware of the
team’s skills and knowledge 7 (14%) 2 (4%) 14 (28%) 24 (48%) 4 (8%)
The Project Leader is not accepted
by all team members 4 (8%) 7 (14%) 18 (36%) 15 (30%) 7 (14%)
Indicator Mean Std Dev Likelihood
The Project Leader is inexperienced and unaware of business goals 1,3469 3,471 88%
The Project Leader is unable to provide motivating leadership 1,019 3,373 94%
The Project Leader is unable to resolve conflicts and manage
resistance
1,1328
3,392
92%
The Project Leader is unaware of the team’s skills and knowledge 1,14 3,314 86%
The Project Leader is not accepted by all team members 1,14 3,275 92%
0
0.5
1
1.5
2
2.5
3
3.5
4
4.5
5
R21 R22 R23 R24 R25
Position in the organization mean values
External Members (Buyers, Vendors, etc.)
Junior Level (Junior Consultants and other employees)
Middle Level (Head of Department, Business Managers, Consultants, etc.)
Upper Level (Top Management, Business Executives, etc.)
0 1 2 3 4 5
High School
College or equivalent
Bachelor (Bs) or equivalent
Master (MSc) or equivalent
Doctoral (PHD) or equivalent
Educational background mean values
R25 R24 R23 R22 R21

-9-
Table 9. Training
Statement/Question No Risk
Level
Low Risk
Level
Medium
Risk Level
High Risk
Level
Very High
Risk Level
User training needs are not
appropriately identified. 1 (2%) 12 (24%) 10 (20%) 24 (48%) 4 (8%)
Training content and length are not
designed well 2 (4%) 7 (14%) 13 (26%) 26 (51%) 3 (6%)
User training has been conducted too
early/late 4 (8%) 10 (20%) 12 (24%) 17 (34%) 8 (16%)
Users are not aware of the
importance of their training 4 (8%) 12 (24%) 17 (34%) 14 (28%) 4 (8%)
User training stops after the end of
the project 5 (10%) 8 (16%) 14 (28%) 17 (34%) 7 (14%)
Indicator Mean Std Dev Likelihood
User training needs are not appropriately identified. 0,9965 3,353 98%
Training content and length are not designed well 0,9418 3,412 96%
User training has been conducted too early/late 1,1882 3,294 92%
Users are not aware of the importance of their training 1,0763 3,039 92%
User training stops after the end of the project 1,0763 3,255 90%
0
0.5
1
1.5
2
2.5
3
3.5
4
4.5
5
R26 R27 R28 R29 R30
Position in the organization mean values
External Members (Buyers, Vendors, etc.)
Junior Level (Junior Consultants and other employees)
Middle Level (Head of Department, Business Managers, Consultants, etc.)
Upper Level (Top Management, Business Executives, etc.)
0 1 2 3 4 5
High School
College or equivalent
Bachelor (Bs) or equivalent
Master (MSc) or equivalent
Doctoral (PHD) or equivalent
Educational background mean values
R30 R29 R28 R27 R26
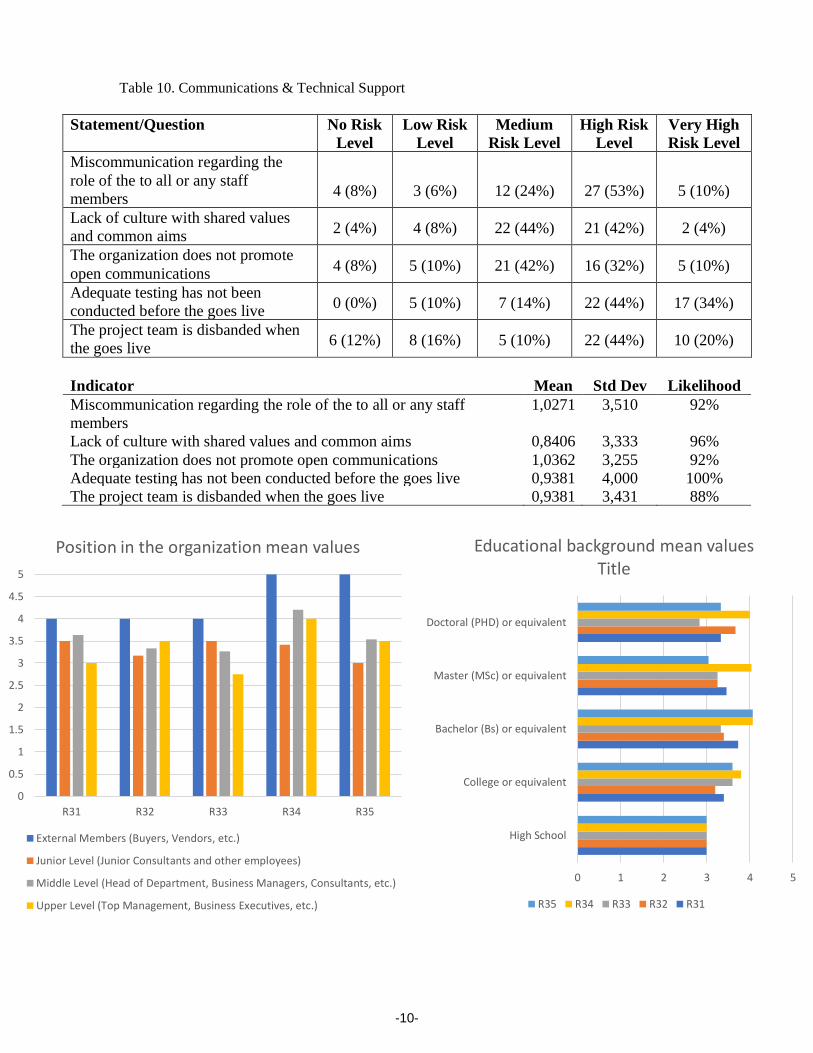
-10-
Table 10. Communications & Technical Support
Statement/Question No Risk
Level
Low Risk
Level
Medium
Risk Level
High Risk
Level
Very High
Risk Level
Miscommunication regarding the
role of the to all or any staff
members 4 (8%) 3 (6%) 12 (24%) 27 (53%) 5 (10%)
Lack of culture with shared values
and common aims 2 (4%) 4 (8%) 22 (44%) 21 (42%) 2 (4%)
The organization does not promote
open communications 4 (8%) 5 (10%) 21 (42%) 16 (32%) 5 (10%)
Adequate testing has not been
conducted before the goes live 0 (0%) 5 (10%) 7 (14%) 22 (44%) 17 (34%)
The project team is disbanded when
the goes live 6 (12%) 8 (16%) 5 (10%) 22 (44%) 10 (20%)
Indicator Mean Std Dev Likelihood
Miscommunication regarding the role of the to all or any staff
members
1,0271
3,510
92%
Lack of culture with shared values and common aims 0,8406 3,333 96%
The organization does not promote open communications 1,0362 3,255 92%
Adequate testing has not been conducted before the goes live 0,9381 4,000 100%
The project team is disbanded when the goes live 0,9381 3,431 88%
0
0.5
1
1.5
2
2.5
3
3.5
4
4.5
5
R31 R32 R33 R34 R35
Position in the organization mean values
External Members (Buyers, Vendors, etc.)
Junior Level (Junior Consultants and other employees)
Middle Level (Head of Department, Business Managers, Consultants, etc.)
Upper Level (Top Management, Business Executives, etc.)
0 1 2 3 4 5
High School
College or equivalent
Bachelor (Bs) or equivalent
Master (MSc) or equivalent
Doctoral (PHD) or equivalent
Educational background mean valuesTitle
R35 R34 R33 R32 R31

-11-
Table 11. Deleted Questions
Number Questions
Q1 The organization has an open communication and information sharing policies are promoted
by the organization (during the implementation phase).
Q2 Enterprise wide culture and structure change is promoted by the executives.
Q3 All employees are aware of the scope, objectives and tasks of the ERP implementation
project.
Q4 Training materials and training sessions have been customized for each specific job.
Q5 It is not clear which is the best time period to conduct the training.
Q6 Formal education and training is not provided from the beginning of the business process
redesign procedure.
Q7 The overall ERP architecture has not been established before deployment.
Q8 There is a high level of business process knowledge within the ERP entity.
Q9 A demo run has not been performed before the system going live.
Q10 The IT staff is not able to efficiently implement ERP system upgrades.
Q11 The IT staff is not able to analyze the technical impact of proposed system changes.
Q12 A high degree of technical expertise in the IT organization does not exist in the organization.
Q13 Executives do not champion the ERP project.
Q14 Which of the following factors were most important for the vendor selection (select all that
apply):
1. Financial situation
2. History
3. Number of previous implementations
4. Support
5. People
6. Other…"
Q15 Which of the following are the most important elements for the project team (select maximum
3 items):
1. IT skills
2. Motivation
3. Past accomplishments
4. Reputation
5. Flexibility
6. Key player involvement
7. (add other...)"
Q16 Key people in the implementation team (select all that apply):
1. Functional personnel and management
2. IT personnel and management
3. Top management
4. IT consultants
5. ERP vendor
6. Parent company employees
7. Management consultants
8. Hardware vendor"