ersri manager primer may board materials
TRANSCRIPT

BOSTON | ATLANTA | CHARLOTTE | CHICAGO | DETROIT | LAS VEGAS | PORTLAND | SAN FRANCISCO
MAY BOARD MATERIALS
ERSRI MANAGER PRIMER
May, 2018
Doug Moseley, PartnerWill Forde, CAIA, ConsultantKevin Leonard, Partner

NEPC, LLC
SSGA PRIMER

RI QVM(3 Factors*)
SSGA QVM(5 Factors)
Proposed RI QVM(3 Factors)
Valuation (2)
Size (4)
Volatility (5)
Quality (1)
Momentum (3)
Optimizer
*The RI QVM portfolio has a custom definition of quality that differs from the SSGA 5 Factor product
1

RHODE ISLAND QVM PERFORMANCE (NET)
*Performance sourced from SSGA and is as of 3.31.18 **Inception date of the mandate is October 2015
• The Rhode Island QVM performance has outpaced the MSCI ACWI by 0.84% net of fees since inception
‐0.7
15.414.3
‐1.3
13.613.4
‐2
0
2
4
6
8
10
12
14
16
Q1 1 Year Since Inception
RI QVM MSCI ACWI
2

NEPC, LLC
MARKET UPDATE
3

THE RETURN OF VOLATILITY
Source: CBOE, Bloomberg
• 2017 was one of the least-volatile markets in over half a century– The S&P 500 experienced only four greater than 1% moves in 2017, while in 2018 it
has already seen 15 of that magnitude through the beginning of April
• Generally, a more volatile market environment was expected for 2018, but few expected the severity and consistency of swings we have already experienced this year in equity markets
0
5
10
15
20
25
30
35
40
Jan‐17 Apr‐17 Jul‐17 Sep‐17 Dec‐17 Mar‐18
VIX Movements
2017 Average: 11.12018 Average: 17.8
Long‐Term Average: 19.4
4

• Through February, expectations of building inflation pressure pushed the 10 Year Treasury yield close to 3% and raised concerns of the impact of higher interest rates on economic activity
– Following the knee-jerk sell-off, revised inflation data eased concerns that the Fed would need to move more aggressively to raise interest rates
– With the Fed’s preferred inflation metric, PCE, still running below its 2% target, the Fed is expected to continue its gradual approach to normalize rates
• February’s technical sell-off in the short volatility trade rapidly forced equity market volatility higher
– Market participants had sought to capitalize on the premium between expected equity volatility and low realized volatility of the past few years by selling volatility
– Short volatility strategies include leverage, which caused significant disruption as VIX rose, leading to significant margin calls and forced sales as investors appeared too complacent with the historically low levels of equity market volatility
• Escalating trade tensions between the US and China rattled equity markets throughout the quarter as one of our key market themes, “Globalization Backlash” reignites
• Continued global trade tensions are likely to sustain higher volatility levels and potentially have long-term economic implications
WHAT CAUSED RECENT VOLATILITY?
5
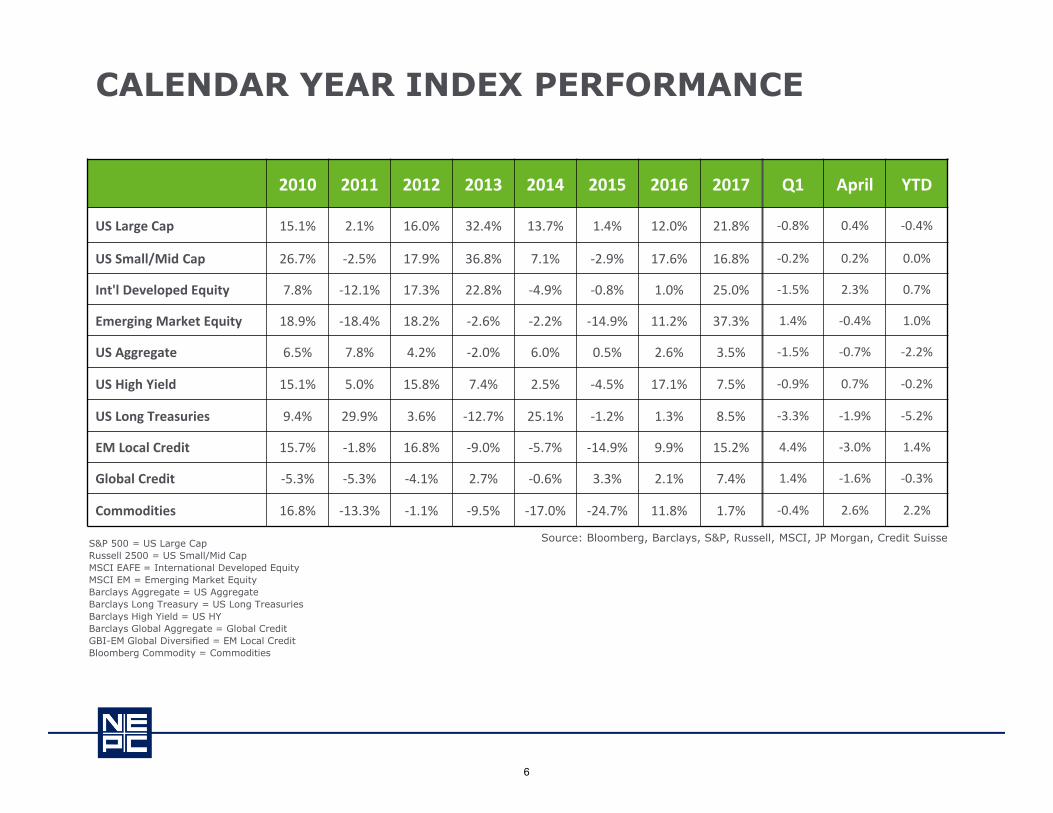
Source: Bloomberg, Barclays, S&P, Russell, MSCI, JP Morgan, Credit SuisseS&P 500 = US Large CapRussell 2500 = US Small/Mid CapMSCI EAFE = International Developed EquityMSCI EM = Emerging Market EquityBarclays Aggregate = US AggregateBarclays Long Treasury = US Long TreasuriesBarclays High Yield = US HYBarclays Global Aggregate = Global CreditGBI-EM Global Diversified = EM Local CreditBloomberg Commodity = Commodities
CALENDAR YEAR INDEX PERFORMANCE
2010 2011 2012 2013 2014 2015 2016 2017 Q1 April YTD
US Large Cap 15.1% 2.1% 16.0% 32.4% 13.7% 1.4% 12.0% 21.8% ‐0.8% 0.4% ‐0.4%
US Small/Mid Cap 26.7% ‐2.5% 17.9% 36.8% 7.1% ‐2.9% 17.6% 16.8% ‐0.2% 0.2% 0.0%
Int'l Developed Equity 7.8% ‐12.1% 17.3% 22.8% ‐4.9% ‐0.8% 1.0% 25.0% ‐1.5% 2.3% 0.7%
Emerging Market Equity 18.9% ‐18.4% 18.2% ‐2.6% ‐2.2% ‐14.9% 11.2% 37.3% 1.4% ‐0.4% 1.0%
US Aggregate 6.5% 7.8% 4.2% ‐2.0% 6.0% 0.5% 2.6% 3.5% ‐1.5% ‐0.7% ‐2.2%
US High Yield 15.1% 5.0% 15.8% 7.4% 2.5% ‐4.5% 17.1% 7.5% ‐0.9% 0.7% ‐0.2%
US Long Treasuries 9.4% 29.9% 3.6% ‐12.7% 25.1% ‐1.2% 1.3% 8.5% ‐3.3% ‐1.9% ‐5.2%
EM Local Credit 15.7% ‐1.8% 16.8% ‐9.0% ‐5.7% ‐14.9% 9.9% 15.2% 4.4% ‐3.0% 1.4%
Global Credit ‐5.3% ‐5.3% ‐4.1% 2.7% ‐0.6% 3.3% 2.1% 7.4% 1.4% ‐1.6% ‐0.3%
Commodities 16.8% ‐13.3% ‐1.1% ‐9.5% ‐17.0% ‐24.7% 11.8% 1.7% ‐0.4% 2.6% 2.2%
6

NEPC, LLC
APPENDIX
7
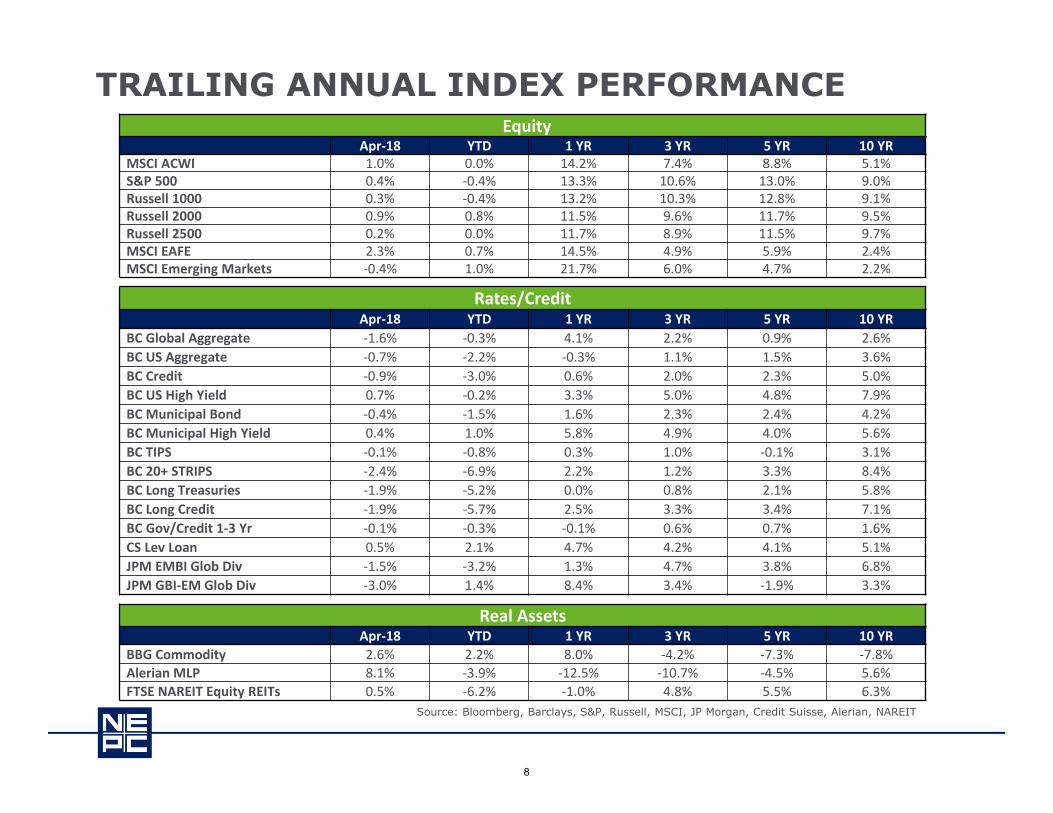
EquityApr‐18 YTD 1 YR 3 YR 5 YR 10 YR
MSCI ACWI 1.0% 0.0% 14.2% 7.4% 8.8% 5.1%S&P 500 0.4% ‐0.4% 13.3% 10.6% 13.0% 9.0%Russell 1000 0.3% ‐0.4% 13.2% 10.3% 12.8% 9.1%Russell 2000 0.9% 0.8% 11.5% 9.6% 11.7% 9.5%Russell 2500 0.2% 0.0% 11.7% 8.9% 11.5% 9.7%MSCI EAFE 2.3% 0.7% 14.5% 4.9% 5.9% 2.4%MSCI Emerging Markets ‐0.4% 1.0% 21.7% 6.0% 4.7% 2.2%
Rates/CreditApr‐18 YTD 1 YR 3 YR 5 YR 10 YR
BC Global Aggregate ‐1.6% ‐0.3% 4.1% 2.2% 0.9% 2.6%BC US Aggregate ‐0.7% ‐2.2% ‐0.3% 1.1% 1.5% 3.6%BC Credit ‐0.9% ‐3.0% 0.6% 2.0% 2.3% 5.0%BC US High Yield 0.7% ‐0.2% 3.3% 5.0% 4.8% 7.9%BC Municipal Bond ‐0.4% ‐1.5% 1.6% 2.3% 2.4% 4.2%BC Municipal High Yield 0.4% 1.0% 5.8% 4.9% 4.0% 5.6%BC TIPS ‐0.1% ‐0.8% 0.3% 1.0% ‐0.1% 3.1%BC 20+ STRIPS ‐2.4% ‐6.9% 2.2% 1.2% 3.3% 8.4%BC Long Treasuries ‐1.9% ‐5.2% 0.0% 0.8% 2.1% 5.8%BC Long Credit ‐1.9% ‐5.7% 2.5% 3.3% 3.4% 7.1%BC Gov/Credit 1‐3 Yr ‐0.1% ‐0.3% ‐0.1% 0.6% 0.7% 1.6%CS Lev Loan 0.5% 2.1% 4.7% 4.2% 4.1% 5.1%JPM EMBI Glob Div ‐1.5% ‐3.2% 1.3% 4.7% 3.8% 6.8%JPM GBI‐EM Glob Div ‐3.0% 1.4% 8.4% 3.4% ‐1.9% 3.3%
Real AssetsApr‐18 YTD 1 YR 3 YR 5 YR 10 YR
BBG Commodity 2.6% 2.2% 8.0% ‐4.2% ‐7.3% ‐7.8%Alerian MLP 8.1% ‐3.9% ‐12.5% ‐10.7% ‐4.5% 5.6%FTSE NAREIT Equity REITs 0.5% ‐6.2% ‐1.0% 4.8% 5.5% 6.3%
TRAILING ANNUAL INDEX PERFORMANCE
Source: Bloomberg, Barclays, S&P, Russell, MSCI, JP Morgan, Credit Suisse, Alerian, NAREIT
8

Macro Equity Credit Real Assets
USDollar VIX US
10-YrS&P500
MSCIEAFE
MSCIEM
USAgg.
High Yield
DollarEMD Oil Gold REITS
-2.3% 8.9 33 bps -0.8% -1.5% 1.4% -1.5% -0.9% -1.8% 7.5% 1.7% -6.5%
• After a strong year for equity markets in 2017, the first quarter of theyear saw a spike in volatility – in part due to concerns over a potentialtrade war between the US and China
• After ending the year down over 10%, the dollar continued to decline asthe US deficit is likely to increase with higher spending and lower tax
– As a result, emerging market equities fared well throughout the quarter and are stillsupported by strong earnings and GDP growth
• Long-term US Treasury yields increased, but an additional Fed rate hikepushed up short-term yields even more, causing the curve to flatten
PERFORMANCE OVERVIEWQ1 Market Summary
Market segment (index representation) as follows: US Dollar (DXY Index), VIX (CBOE Volatility Index), US 10-Year (US 10-Year Treasury Yield), S&P 500 (USEquity), MSCI EAFE Index (International Developed Equity), MSCI Emerging Markets (Emerging Markets Equity), US Agg (Barclays US Aggregate BondIndex), High Yield (Barclays US High Yield Index), Dollar EMD (JPM Emerging Market Bond Index), Crude Oil (WTI Crude Oil Spot), Gold (Gold Price Spot),and REITs (NAREIT Composite Index).
9

Extended US Economic Cycle
Equity Performance Overview
• Despite volatility weighing on global equity returns, strong fundamentals and growth prospects remain supportive
• US equity markets declined 0.8%on the quarter in part due totrade concerns – its first negativequarter in over two years
Russell 3000 QTD Sector Return Contribution
Information Technology 0.80%
Consumer Discretionary ‐0.68%
Financials ‐0.15%
Industrials ‐0.07%
Consumer Staples ‐0.45%
Energy 0.07%
Materials ‐0.19%
Health Care ‐0.77%
Real Estate 0.15%
Telecommunication 0.20%
Utilities ‐0.23%
Q1 Equity Market Summary
Source: MSCI, Russell, S&P, Bloomberg
Source: MSCI, Bloomberg. QTD top country contributors to index returnSource: Russell, Bloomberg
EQUITY PERFORMANCE OVERVIEW
10

Extended US Economic Cycle
Credit Performance Overview
• Credit spreads increased slightly,but remain below medians inmost areas of the credit market
• In particular, current high yieldspreads continue to support abroad reduction in exposure
• Long credit declined 3.3% for thequarter with the 30-year Treasuryyield increasing 23 basis points
Q1 Credit Market Summary
Source: Barclays, JPM, S&P, Bloomberg
Source: Barclays, JPM, S&P, Bloomberg. As of 01/31/2000Source: Barclays, Merrill Lynch, JPM, Bloomberg, NEPC
Credit Spread(Basis Points) 12/29/17 03/31/18 |∆|
BC IG Credit 93 109 16
BC Long Credit 139 148 9
BC Securitized 27 32 5
BC High Yield 343 354 11
Muni HY 275 253 ‐22
JPM EMBI 311 326 15
Bank Loans ‐ Libor 336 257 ‐79
CREDIT PERFORMANCE OVERVIEW
11

Extended US Economic Cycle
Credit Performance Overview
• MLPs experienced a significantdecline for the quarter as a resultof flow weakness, the FERC ruling,and higher Treasury yields
– Despite the negative performance,fundamentals remain supportive withstrong earnings and growth prospects
• Commodity index roll yield is morenegative than the previous quarter,despite the energy sector having apositive contribution
Q1 Real Assets Market Summary
Source: S&P, NAREIT, Alerian, Bloomberg
Source: NCREIF, Alerian, NAREIT, S&P, Bloomberg Source: Bloomberg, NEPC Calculated as of 04/09/2018
Real Asset Yields 12/29/17 03/31/18
MLPs 7.8% 8.9%
Core Real Estate 4.4% N/A
US REITs 4.1% 4.6%
Global REITs 3.6% 4.0%
Global Infrastructure Equities 3.9% 3.9%
Natural Resource Equities 3.1% 3.6%
US 10‐Yr Breakeven Inflation 2.0% 2.1%
Commodity Index Roll Yield ‐0.4% ‐1.6%
REAL ASSETS PERFORMANCE OVERVIEW
12
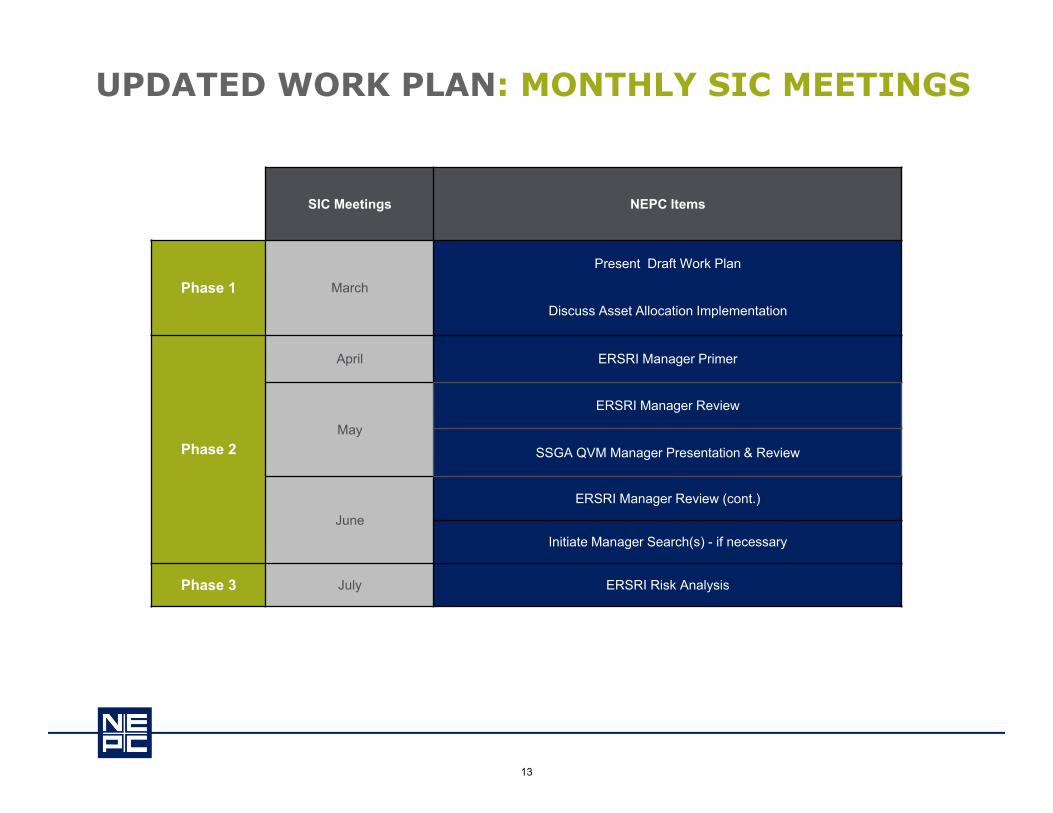
UPDATED WORK PLAN: MONTHLY SIC MEETINGS
SIC Meetings NEPC Items
Phase 1 March
Present Draft Work Plan
Discuss Asset Allocation Implementation
Phase 2
April ERSRI Manager Primer
May
ERSRI Manager Review
SSGA QVM Manager Presentation & Review
JuneERSRI Manager Review (cont.)
Initiate Manager Search(s) - if necessary
Phase 3 July ERSRI Risk Analysis
13

NEPC RATING DESCRIPTORS & DEFINITIONS
Rating Rating Descriptor Definition
1 PreferredA high conviction investment strategy. A 1 (Preferred) rated strategy has a compelling and sound investment thesis, and the manager is well-resourced and incented to execute on the thesis.
2 Positive
NEPC has a positive view of the strategy. Strategy has a compelling and sound investment thesis. The manager is sufficiently resourced and incented to execute on the thesis. Strengths outweigh the weaknesses.
3 NeutralNEPC has a neutral view of the strategy. Strategy lacks a compelling investment thesis. There are no significant concerns with the manager.
4 Negative Strategy lacks or has an unclear investment thesis. The strategy’s weaknesses clearly outweigh its strengths.
5 Not Recommended
A strategy that lacks an investment thesis or NEPC has no confidence in the strategy’s ability to execute on the thesis. Serious issues have been identified with the investment manager or strategy.
NR Not Rated NEPC has not performed sufficient due diligence on the product or manager.
14
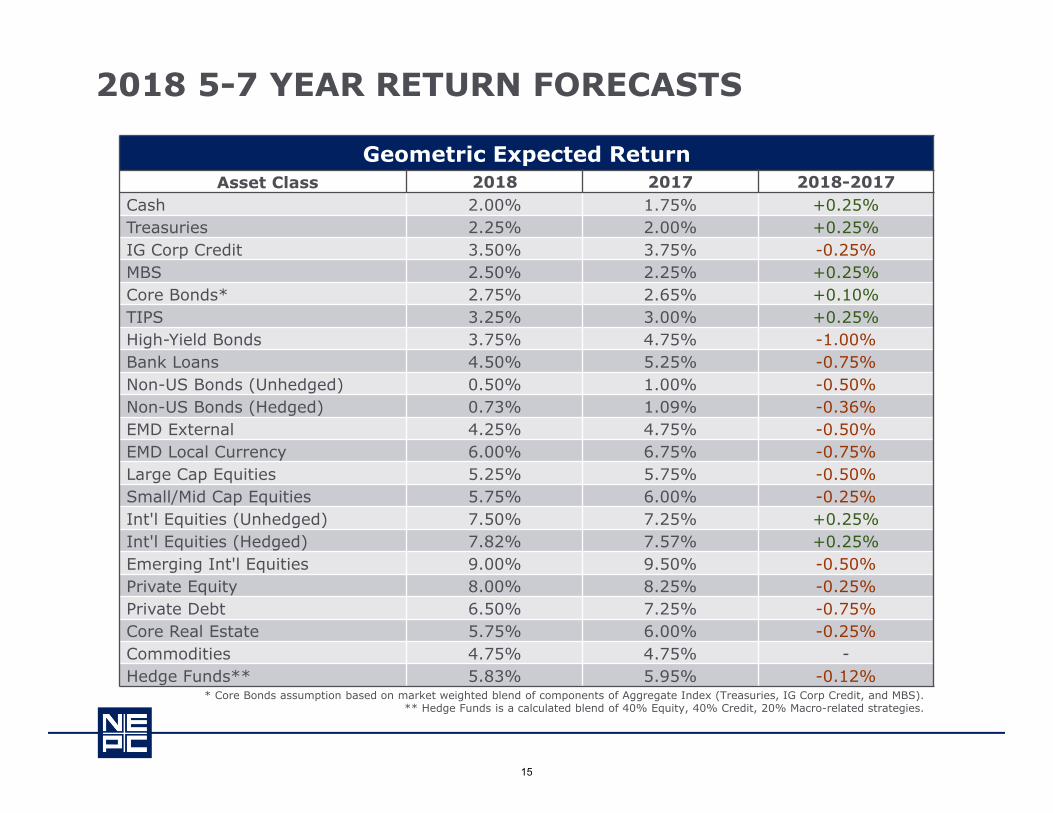
2018 5-7 YEAR RETURN FORECASTS
* Core Bonds assumption based on market weighted blend of components of Aggregate Index (Treasuries, IG Corp Credit, and MBS).** Hedge Funds is a calculated blend of 40% Equity, 40% Credit, 20% Macro-related strategies.
Geometric Expected ReturnAsset Class 2018 2017 2018-2017
Cash 2.00% 1.75% +0.25%Treasuries 2.25% 2.00% +0.25%IG Corp Credit 3.50% 3.75% -0.25%MBS 2.50% 2.25% +0.25%Core Bonds* 2.75% 2.65% +0.10%TIPS 3.25% 3.00% +0.25%High-Yield Bonds 3.75% 4.75% -1.00%Bank Loans 4.50% 5.25% -0.75%Non-US Bonds (Unhedged) 0.50% 1.00% -0.50%Non-US Bonds (Hedged) 0.73% 1.09% -0.36%EMD External 4.25% 4.75% -0.50%EMD Local Currency 6.00% 6.75% -0.75%Large Cap Equities 5.25% 5.75% -0.50%Small/Mid Cap Equities 5.75% 6.00% -0.25%Int'l Equities (Unhedged) 7.50% 7.25% +0.25%Int'l Equities (Hedged) 7.82% 7.57% +0.25%Emerging Int'l Equities 9.00% 9.50% -0.50%Private Equity 8.00% 8.25% -0.25%Private Debt 6.50% 7.25% -0.75%Core Real Estate 5.75% 6.00% -0.25% Commodities 4.75% 4.75% -Hedge Funds** 5.83% 5.95% -0.12%
15
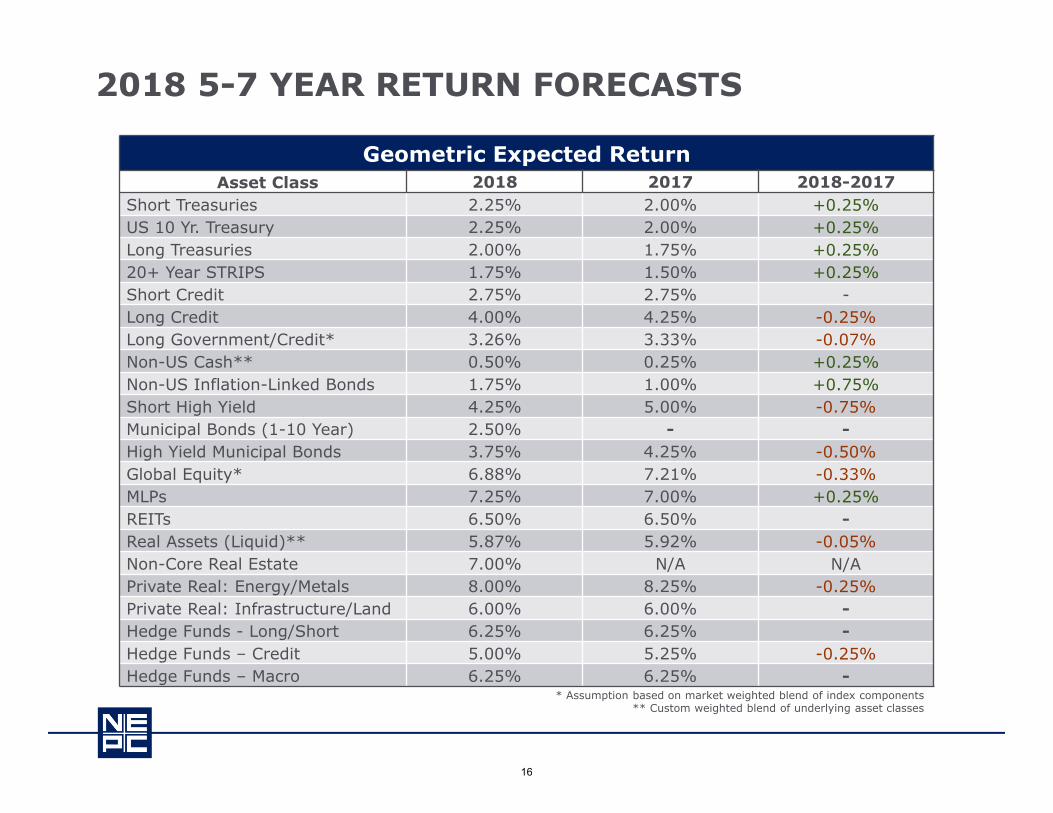
2018 5-7 YEAR RETURN FORECASTS
* Assumption based on market weighted blend of index components** Custom weighted blend of underlying asset classes
Geometric Expected ReturnAsset Class 2018 2017 2018-2017
Short Treasuries 2.25% 2.00% +0.25%US 10 Yr. Treasury 2.25% 2.00% +0.25%Long Treasuries 2.00% 1.75% +0.25%20+ Year STRIPS 1.75% 1.50% +0.25%Short Credit 2.75% 2.75% -Long Credit 4.00% 4.25% -0.25%Long Government/Credit* 3.26% 3.33% -0.07%Non-US Cash** 0.50% 0.25% +0.25%Non-US Inflation-Linked Bonds 1.75% 1.00% +0.75%Short High Yield 4.25% 5.00% -0.75%Municipal Bonds (1-10 Year) 2.50% - -High Yield Municipal Bonds 3.75% 4.25% -0.50%Global Equity* 6.88% 7.21% -0.33%MLPs 7.25% 7.00% +0.25%REITs 6.50% 6.50% -Real Assets (Liquid)** 5.87% 5.92% -0.05%Non-Core Real Estate 7.00% N/A N/APrivate Real: Energy/Metals 8.00% 8.25% -0.25%Private Real: Infrastructure/Land 6.00% 6.00% -Hedge Funds - Long/Short 6.25% 6.25% -Hedge Funds – Credit 5.00% 5.25% -0.25%Hedge Funds – Macro 6.25% 6.25% -
16

2018 VOLATILITY FORECASTS
* Core Bonds assumption based on market weighted blend of components of Aggregate Index (Treasuries, IG Corp Credit, and MBS).** Hedge Funds is a calculated blend of 40% Equity, 40% Credit, 20% Macro-related strategies.
VolatilityAsset Class 2018 2017 2018-2017
Cash 1.00% 1.00% -Treasuries 5.50% 5.50% -IG Corp Credit 7.50% 7.50% -MBS 7.00% 7.00% -Core Bonds* 5.99% 6.03% -0.04%TIPS 6.50% 6.50% -High-Yield Bonds 13.00% 13.00% -Bank Loans 9.00% 9.00% -Non-US Bonds (Unhedged) 10.00% 8.50% +1.50%Non-US Bonds (Hedged) 4.50% 5.00% -0.50%EMD External 13.00% 13.00% -EMD Local Currency 13.00% 15.00% -2.00%Large Cap Equities 17.50% 17.50% -Small/Mid Cap Equities 21.00% 21.00% -Int'l Equities (Unhedged) 21.00% 21.00% -Int'l Equities (Hedged) 18.00% 18.00% -Emerging Int'l Equities 28.00% 28.00% -Private Equity 23.00% 23.00% -Private Debt 13.00% 14.00% -1.00%Core Real Estate 13.00% 15.00% -2.00%Commodities 19.00% 19.00% -Hedge Funds** 9.07% 8.74% -0.33%
17

2018 VOLATILITY FORECASTS
* Assumption based on market weighted blend of index components** Custom weighted blend of underlying asset classes
VolatilityAsset Class 2018 2017 2018-2017
Short Treasuries 2.50% 2.50% -US 10 Yr. Treasury 7.50% 7.50% -Long Treasuries 12.00% 12.00% -20+ Yr. STRIPS 19.00% 19.00% -Short Credit 3.50% 3.50% -Long Credit 12.00% 13.00% -1.00%Long Government/Credit* 11.26% 12.01% -0.75%Non-US Cash** 1.00% 1.00% -Non-US 10 Yr. Sovereigns** 6.50% 6.50% -Non-US Inflation-Linked Bonds (H) 5.50% 6.00% -0.50%Short High Yield 8.50% 9.00% -0.50%Municipal Bonds (1-10 Year) 5.50% - -Global Equity*** 18.22% 18.26% -0.04%MLPs 19.00% 20.00% -1.00%REITs 21.00% 21.00% -Real Assets (Liquid)**** 13.06% 12.83% +0.23%Non-Core Real Estate 17.00% N/A N/APrivate Real: Energy/Metals 21.00% 21.00% -Private Real: Infrastructure/Land 12.00% 14.00% -2.00%Hedge Funds - Long/Short 11.00% 11.00% -Hedge Funds – Credit 9.50% 9.50% -Hedge Funds – Macro 9.50% 9.50% -
18