esb investor update - financial results 2020
TRANSCRIPT

1
ESB Investor Update- Financial Results 2020www.esb.ie/ir

2
Forward looking statements: This presentation may contain certain "forward-looking statements" with respect to ESB’s financial condition, results of operations and business andcertain of ESB’s plans and objectives with respect to these items. By their very nature forward-looking statements are inherently unpredictable, speculative and involve risk anduncertainty because they relate to and depend upon future events and circumstances. There are a number of factors that could cause actual results and developments to differmaterially from those expressed or implied by these forward-looking statements. All forward-looking statements in the presentation are expressly qualified in their entirety by suchfactors. ESB does not intend to update any forward-looking statements.
No warranty as to accuracy: Neither ESB nor any person acting on its behalf (i) makes any representation or warranty, express or implied, as to the accuracy or completeness of theinformation contained within this presentation or (ii) shall have any liability whatsoever for loss, howsoever arising, directly or indirectly, from use of the information contained withinthis presentation.
No invitation to engage in investment activity: This presentation is not an offer to sell, exchange or transfer any securities of ESB and is not soliciting an offer to purchase, exchangeor transfer such securities in any jurisdiction.
Disclaimer
3
PAT FENLON
CFO
GERRY TALLON
GROUP TREASURER
WILLIAM YOUNG
MANAGER, INVESTOR
RELATIONS & CREDIT RATING
ESB Team

4
Overview & COVID-19 Response
2020 Financial Review
Funding & Liquidity
Outlook & Summary
Business Review
Agenda

5
COVID-19
➢ As the provider of an essential service, ESB has a critical role to play in supporting the Irish Government's response to this crisis. During the course of 2020 ESB:❖ Maintained the safety, health and wellbeing of all ESB employees, contractors, their families, customers and the public;❖ Maintained a secure and reliable electricity service for all customers;❖ Remained agile and responsive, adapting rapidly and appropriately as the situation evolves;❖ Delivered majority of the capital programmes.
➢ We instigated several key contingency measures to ensure the business continues to operate effectively including:❖ remote working, remote operation of assets, securing additional PPE etc
➢ While electricity demand was impacted by the COVID-19 lockdown restrictions, the overall year-on-year reduction in demand was less than 1% in Ireland.
➢ Overall COVID-19 had a c. €15 million negative impact on Operating Profit in 2020
➢ ESB is a financially strong business illustrated by:❖ Strong investment grade credit rating from S&P and Moody’s (A- / A3);❖ ESB Networks and NIE Networks revenue is secured under regulatory contracts;❖ Liquidity as at 31 December 2020 was €1.8 billion;❖ In February 2020 executed a new 5-year €1.4 billion Sustainability-linked RCF;

6
2020 Highlights
• ESB delivered resilient financial results as it continues its transition to a low carbon energy future
➢ EBITDA €1.3 billion; Capex €1.1 billion; Gearing 55%
➢ Capital expenditure €1.1 billion, including 80% (€889 million) in regulated networks capital infrastructure
• Networks:
➢ ESB Networks Price Review 5 (PR5) was finalised with the regulator which underpins ESB Networks work programmes for 2021-2025. The PR5 programme is aligned to Ireland’s Climate Action Plan
➢ Regulated Networks Businesses in Ireland; 73% of Group EBITDA supported by established and transparent regulatory frameworks; €110m on Smart Meter roll out in ROI.
• Generation & Trading: Continuing investment in low carbon renewable generation
• Customer Solutions (including Electric Ireland): Competing effectively with an Irish market share of 34%
• Strong liquidity position of €1.8 billion at 31 December 2020; Credit ratings reaffirmed A- / A3
• Climate Action Progress:
➢ ESB strategy is aligned with the Government’s Climate Action Plan
➢ Obtained CDP "A" rating for first time in 2020
➢ Carbon intensity of fleet reduced further to 378 g/kWh – reduced from 406 g/kWh in 2019 (44% reduction on 2005 baseline)
1 All references to EBITDA in presentation are before exceptional items (non-impairment).

7
Price Review 5 Determination
To meet our
collective challenge
to deliver the
National Climate
Action Plan.
To secure the
funding to deliver
metrics in line with
a strong investment
grade credit rating.
To meet customers’
changing needs
and expectations,
while keeping our
prices affordable.
To secure
sustainable
incentives to invest
in a period of
change.
To deliver a safe
and reliable low
carbon system.
€
Critical Contract for ESB
• Underpins Regulatory income 2021 – 2025
• Aligned to Climate Action Plan
• Increased Capex to support transition to Brighter Future
(SMART meters, eheat and etransport)
• Maintains Financial Strength
* 2019 money
8
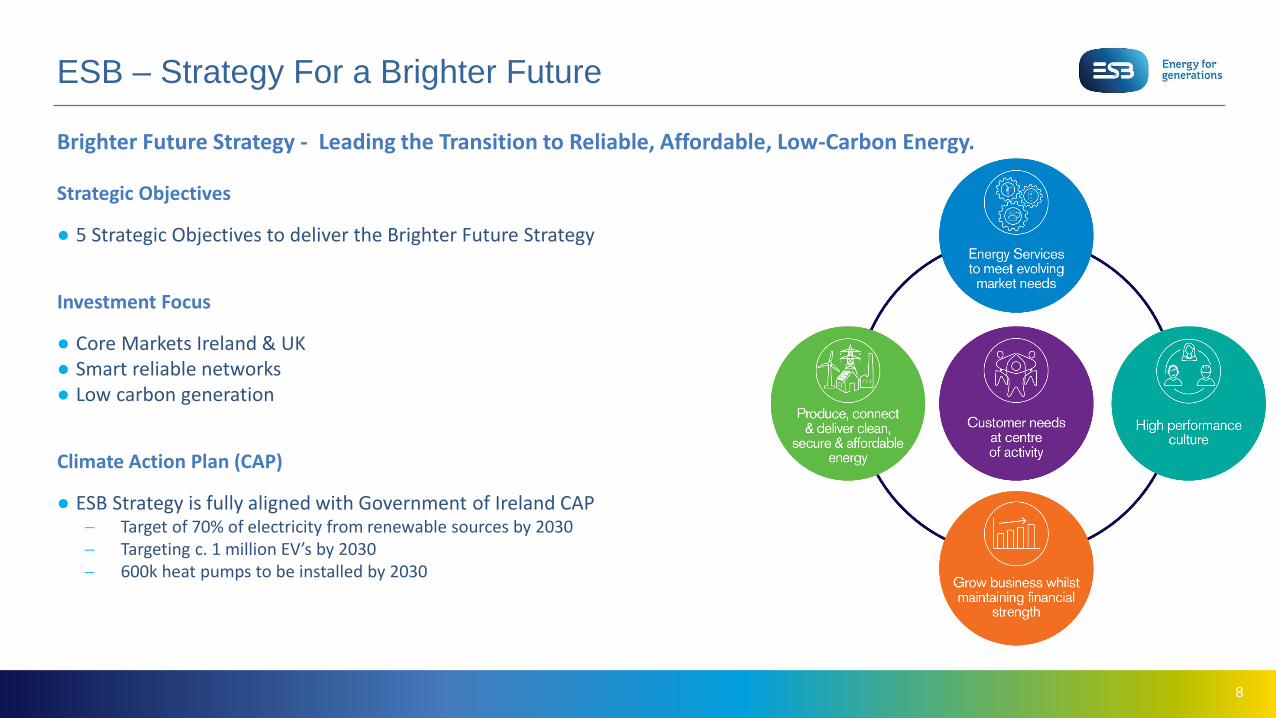
Strategic Objectives
● 5 Strategic Objectives to deliver the Brighter Future Strategy
Investment Focus
● Core Markets Ireland & UK● Smart reliable networks● Low carbon generation
Climate Action Plan (CAP)
● ESB Strategy is fully aligned with Government of Ireland CAP− Target of 70% of electricity from renewable sources by 2030− Targeting c. 1 million EV’s by 2030− 600k heat pumps to be installed by 2030
ESB – Strategy For a Brighter Future
Brighter Future Strategy - Leading the Transition to Reliable, Affordable, Low-Carbon Energy.
9
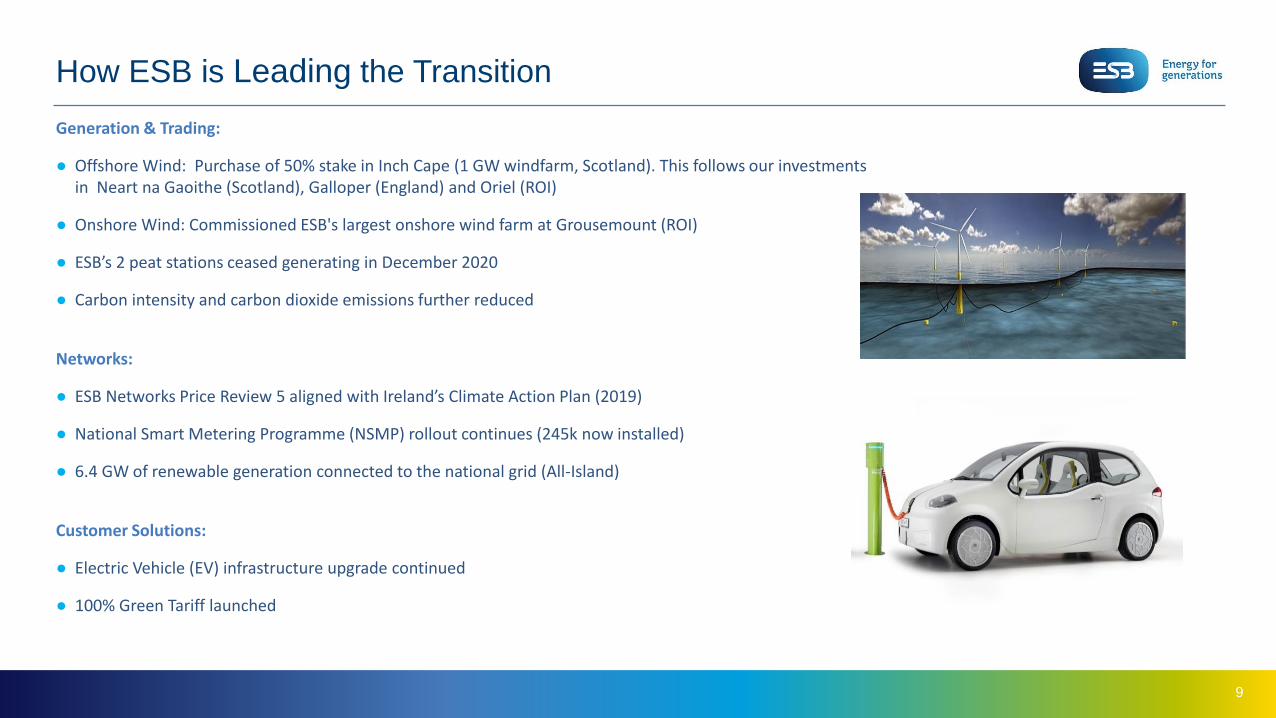
How ESB is Leading the Transition
Generation & Trading:
● Offshore Wind: Purchase of 50% stake in Inch Cape (1 GW windfarm, Scotland). This follows our investments in Neart na Gaoithe (Scotland), Galloper (England) and Oriel (ROI)
● Onshore Wind: Commissioned ESB's largest onshore wind farm at Grousemount (ROI)
● ESB’s 2 peat stations ceased generating in December 2020
● Carbon intensity and carbon dioxide emissions further reduced
Networks:
● ESB Networks Price Review 5 aligned with Ireland’s Climate Action Plan (2019)
● National Smart Metering Programme (NSMP) rollout continues (245k now installed)
● 6.4 GW of renewable generation connected to the national grid (All-Island)
Customer Solutions:
● Electric Vehicle (EV) infrastructure upgrade continued
● 100% Green Tariff launched

10
ESG Progress & Reporting
● Carbon intensity in 2020 of 378 g/kWh
(44% improvement since 2005)
● CDP Score Improvement – "A" listed
● Gender Pay gap published (first time)
● 2020 Sustainability Report
● Green Bond Framework and Report for 2019/2020
www.esb.ie/investor-relations/green-bond
11
FINANCIAL OVERVIEW

12
Gearing (%)
Capital Expenditure (€m)*
Net Debt (€m)**
EBITDA (€m)
Consistent Financial Performance
*2016-2017 capex is net of capital contributions (Avg €150m p.a)*2018 -2020 capex is gross of capital contributions
4,524 4,377 4,915 5,239 5,120
2016 2017 2018 2019 2020
897 867 1,165 1,243 1,115
2016 2017 2018 2019 2020
**2019 – 2020 include lease liabilities (IFRS 16) (Avg €128m p.a.)
51%52% 56% 57% 55%
2016 2017 2018 2019 2020

13
Highlights 2020 Change vs 2019 Commentary
EBITDA €1,299m (€73m) Reduction includes increase in ARO provisions, FX losses and bad debts
Capex €1,115m (€127m) €889m in regulated business, 2019 included the investment in Neart na Gaoithe offshore wind farm
Gearing 55% (2%)
Liquidity €1.8 billion €200m Sustainability linked RCF (€1.4bn) agreed in 2020
Credit Ratings A-/A3 - Ratings with both agencies re-affirmed in 2020
2020 Financial Highlights
Points of Note
Exceptional items An exceptional charge of €247m was taken in 2020:• €188m impairment charge on Carrington gas plant in GB (1.4% of total asset base) due to reduced forward prices/spreads• €59m charge due to increase in the asset retirement obligation (ARO) provision for the future disposalcost of wooden electricity
poles as they are retired from the network.

14
BUSINESS REVIEW
15
Source: Eirgrid
Forecast Irish GDP Source: Central Bank of Ireland Q1 2021 BulletinForecast UK GDP Source: Office of Budget Responsibility March 2021
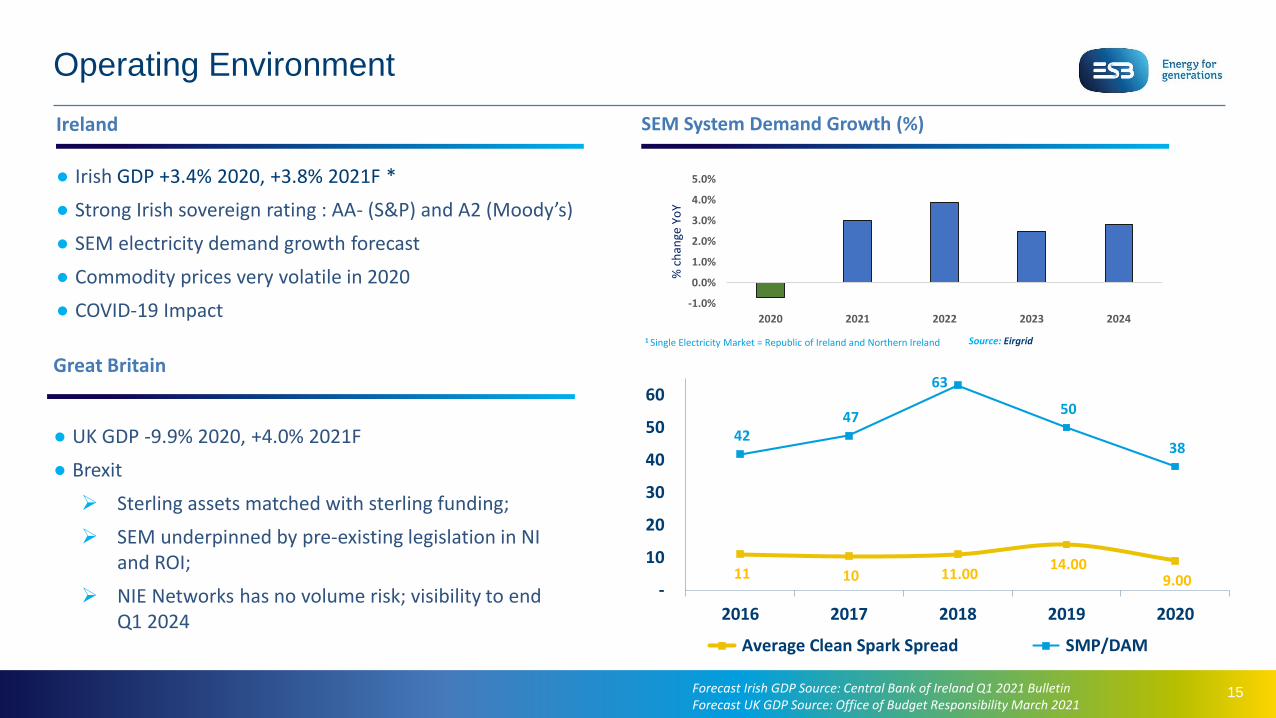
● Irish GDP +3.4% 2020, +3.8% 2021F *
● Strong Irish sovereign rating : AA- (S&P) and A2 (Moody’s)
● SEM electricity demand growth forecast
● Commodity prices very volatile in 2020
● COVID-19 Impact
● UK GDP -9.9% 2020, +4.0% 2021F
● Brexit
➢ Sterling assets matched with sterling funding;
➢ SEM underpinned by pre-existing legislation in NI and ROI;
➢ NIE Networks has no volume risk; visibility to end Q1 2024
1 Single Electricity Market = Republic of Ireland and Northern Ireland
Operating Environment
SEM System Demand Growth (%)
Great Britain
Ireland
11 10 11.00 14.00
9.00
42 47
63
50
38
-
10
20
30
40
50
60
2016 2017 2018 2019 2020€
/ M
Wh
Average Clean Spark Spread SMP/DAM
-1.0%
0.0%
1.0%
2.0%
3.0%
4.0%
5.0%
2020 2021 2022 2023 2024
% c
han
ge Y
oY

16
● 55% of Group EBITDA and 57% of Group Assets
● Operating Profit increased due to higher regulated tariff income offset by higher opex
● Capex increase reflects further roll out of Smart Meters and increased asset retirement provision
● Regulated Asset Base (RAB) - €8.4bn
● PR5 Revenue Determination (2021-2025)
− €4.4 billion capex programme
− WACC 3.8% pre-tax real1
● Focus:
− PR5 delivery
ESB Networks
1 WACC pre-tax real calculated real pre-tax cost of debt and real pre-tax cost of equity* before exceptional items – increase in Asset Retirement Obligation provision
Business Highlights
2020 ESB Group EBITDA - €1,299m / ESB Networks EBITDA - €716m
Operating Profit (€m)* Capital Expenditure (€m)
Business Strategy - Smart Reliable Networksto Support Decarbonisation
344 368
Y E2 0 1 9 Y E2 0 2 0
581 749
Y E 2 0 1 9 Y E 2 0 2 0

17
ESB Networks PR4Outturn*
PR5Determination **
WACC (pre-tax, real) 4.95% 3.80%
Overall revenue €5.2bn €5.83bn***
Gross Capex €2.7bn €4.4bn
Operating Allowances €1.7bn €1.96bn
Closing RAB €8.4bn €10 bn
Asset Life Transmission – 50 years
Distribution – 45 years
Transmission – 50 years
Distribution – 45 years
Revised secondary assets to technical life (10-17 years)
* Nominal** 2019 money*** Excluding Incentive revenue
ESB Networks – PR5 Determination (vs PR4)
18
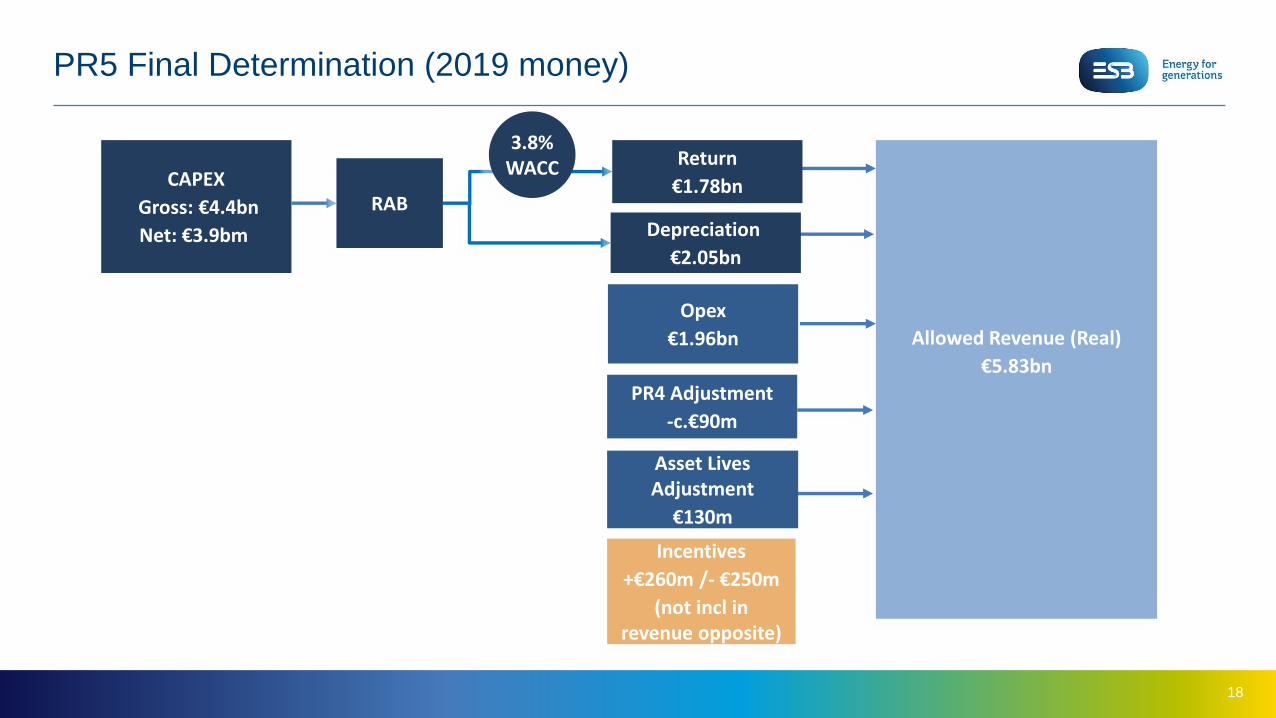
PR5 Final Determination (2019 money)
RABCAPEX
Gross: €4.4bn
Net: €3.9bm
Allowed Revenue (Real)
€5.83bn
3.8% WACC Return
€1.78bn
Depreciation
€2.05bn
Opex
€1.96bn
Incentives
+€260m /- €250m
(not incl in revenue opposite)
PR4 Adjustment
-c.€90m
Asset Lives Adjustment
€130m

19
Northern Ireland Electricity (NIE) Networks
Business Highlights
1Vanilla WACC calculated real pre-tax cost of debt and real post-tax cost of equity
● 18% of Group EBITDA and 16% of Group Assets
● Operating Profit increase is due to higher use of system income
● Capex decrease primarily reflects COVID-19 impact on activities
● Regulated Asset Base - €1.8bn / £1.6bn
● RP6 revenue determination (Oct ’17 – Mar ’24)
− RP6 WACC 3.2% vanilla real1 (3.8% pre-tax real)
● Focus:
− RP6 Implementation
Business Strategy - Smart Reliable Networks to Support Decarbonisation
2020 ESB Group EBITDA - €1,299m / NIE Networks EBITDA - €230m
Operating Profit (€m) Capital Expenditure (€m)
18%
61
85
Y E 2 0 1 9 Y E 2 0 2 0
154 140
Y E 2 0 1 9 Y E 2 0 2 0

20
Generation & Trading (GT)
Business Highlights
● 19% of Group EBITDA and 18% of Group Assets
● All-Island SEM market share 29% by volume
● Decrease in Operating Profit reflects lower energy margin
● Energy margin – lower due to cessation of peat PSO and certain gas contracts
● Decrease in capex reflects higher capex in 2019 relating to investment in Neart na Gaoithe (offshore) and Grousemount(onshore) windfarms
● Carbon intensity 378 g/kWh – reduced from 406 g/kWh in 2019 and targeted to reach 200 g/kWh by 2030
● Focus:
− Build pipeline of renewable projects
− Continue to prepare for future RESS auctions
Business Strategy – Transition to Low Carbon Generation Portfolio
Operating Profit (€m)* Capital Expenditure (€m)
2020 ESB EBITDA - €1,299m /
GT EBITDA - €252m
Fuel Mix:
SEM & GB Generation
198
108
YE 2019 YE 2020
424
121
YE 2019 YE 2020
*before exceptional items –impairment on Carrington CCGT asset

21
Electric Ireland
SSE
BGE
Viridian
Other
● Customer-facing businesses - supply of electricity, gas, energy services, e-transport and wholesale telecoms
● Customer Solutions contributed 6% of Group EBITDA
● Operating Profit €58m; includes higher bad debt charge of €15m relating to the impact of COVID-19
● Bad Debts charge has increased from €10m to €25m (1.1% of Turnover)
● Irish market share 34% with 1.5m customer accounts
● ESB Energy (GB) customer accounts: 165,000 at year end
● Focus:
− Meet customer energy needs through value driven solutions at appropriate margins
Customer Solutions (including Electric Ireland)
Business Highlights
Business Strategy – Competitive Offerings & Excellent Customer Service to Meet Customer Needs
2020 ESB Group EBITDA - €1,299m / Customer Solutions EBITDA - €78m
Operating Profit (€m) SEM Market Share (MWh)
59 58
YE 2019 YE 2020

22
Funding &Liquidity

23
Funding Highlights 2020:
➢ January 2020: Issued £325 million bond, coupon 1.875%, maturity July 2035
➢ February 2020: Signed a new 5-year €1.4 billion sustainability linked RCF (14 relationship banks)
➢ July 2020: Issued €200m tap of our inaugural 2019 Green Bond
ESB Group Debt – Diversified Funding Liquidity
Group Debt 31 December 2020 - €5.3 billion Available Liquidity 31 December 2020 - €1.8 billion

24
Note: Excludes Joint Venture Debt
Debt Repayment Profile as at 31 December 2020

25
A-(Stable Outlook)
Long Term Rating
A3(Stable Outlook)
Long Term Rating
ESB Credit Ratings

26
Outlook & Summary

27
Summary & Outlook
COVID 19: resilient electricity demand and positive ESB response
ESB’s strategy is to lead the transition to a low carbon energy future and aligns with the Irish Governments Climate Action Plan
ESB Networks (ROI) PR5 Determination; NIE Networks (NI) RP6 delivery
Generation portfolio transition through renewable investments
Meet customer energy needs through value driven solutions at appropriate margins
Ongoing focus on strategy delivery while maintaining financial strength

28
Key Credit Strengths
● 96% Irish
Government
owned
● Markets —
Ireland and
Great Britain
● Owns all networks
in ROI and NI
● Irish electricity
market: 29% share
of generation and 34%
share of supply
YE 2020
Leading Irish
Energy Utility
● Regulated electricity
networks businesses
in Ireland accounts for
73% of Group Assets and
Group EBITDA
● Supported by
established and
transparent regulatory
frameworks regarded
as robust by credit
rating agencies
Stable
Business Profile
● Average EBITDA
€1.3bn & Gearing
54% (2016–2020)
● Diversified funding
and strong liquidity
position
● Credit ratings of
A- and A3
Consistent Financial
Performance

29
ESB
Two Gateway
East Wall Road
Dublin D03 A995
Ireland
W I L L I A M Y O U N G
MANAGER, INVESTOR
RELATIONS & CREDIT RATING
+353 1 702 26942
www.esb.ie/ir
Contacts