investor update investor update q4 fy2016q3 · pdf fileinvestor update investor update ......
TRANSCRIPT

Investor Update – Q4 FY2016Investor Update – Q3 FY2017

Section I: Overview
Representative images of Big Bazaar & fbb stores
2
3
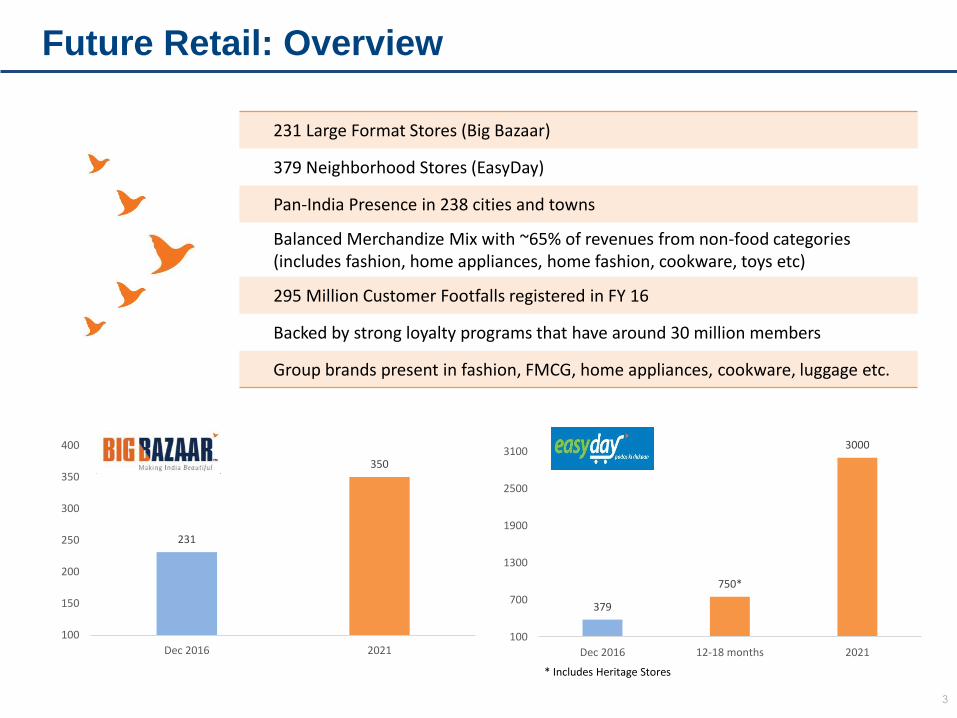
Future Retail: Overview
231 Large Format Stores (Big Bazaar)
379 Neighborhood Stores (EasyDay)
Pan-India Presence in 238 cities and towns
Balanced Merchandize Mix with ~65% of revenues from non-food categories (includes fashion, home appliances, home fashion, cookware, toys etc)
295 Million Customer Footfalls registered in FY 16
Backed by strong loyalty programs that have around 30 million members
Group brands present in fashion, FMCG, home appliances, cookware, luggage etc.
231
350
100
150
200
250
300
350
400
Dec 2016 2021
379
750*
3000
100
700
1300
1900
2500
3100
Dec 2016 12-18 months 2021
* Includes Heritage Stores

231 Stores; 9.8 million square feet
Created in 2001, it is a multi-category large format chain with typical store size of 30,000 – 40,000 square feet
Brand Promise: ‘Making India Beautiful’
Kept up with the changing times and pioneered multiple consumption events such as sales on 26th Jan, 15th August, Public Holiday Sale, Wednesday Bazaar, Exchange Mela among others
Among India’s Top 15 Most Trusted Brands
Iconic Retail Destination
As per ET Brand Consumer Survey
4

Designed to take customer experience to a new level with sit-down checkouts, experience zoneswith multi-sensorial, interactive displays, shelf
talkers
Launched in Infinity Malad, R-City Ghatkopar and Mall of India, Noida
For the Premium Experience
5

India’s “Pados ki Dukaan”, with a dominant presence in NCR, Punjab, Haryana and Western Uttar Pradesh, complements the large format stores network in the Northern Region.
Closer to the homes and a higher throughput adds to the company’s scale and efficiency.
379 Stores in over 128 cities, attracting over 50 million footfalls annually.
Format to be expanded through organic growth in northern markets as well as through upcoming merger with Heritage brand in Southern markets. Expected to touch 3,000 stores by 2021.
India’s Neighborhood Stores
6

Fashion destination endorsed by celebrities, beauty pageant winners & at leading music events. Attracts next generation customers within Big Bazaar.
54 Standalone stores along with presence in all Big Bazaar stores.
Company-owned brands contribute more than 90% of total sales in the chain.
Aggressive expansion planned in new and Tier 2 cities and towns.
Fashion for the Youth

Foodhall enhances the company’s ability to cater to the evolved food consumers. Also serves as a learning platform to identify, experiment and then mainstream forthcoming trends, cuisines and categories in the food space.
Stores located within the most premium malls in Mumbai, Bangalore and Delhi.
Creating a strong set of upmarket food brands that capture increasing share of sales in tea, spices and world foods.
The Gourmet Food Chain of India

Consumer Loyalty – FuturePay
Price Match – Customer Assured of Lowest Price
Mobile Wallet with Loyalty Program Integration
Over 1 million users with 20% customers having used
the price match feature.
Wallet uploads in excess of Rs 27 crore
9

10
Consumer Loyalty – EasyDay Savings Club
Pay Rs 999 and get 10% off for the year.
Customer gets guaranteed savings. Company passes on discount only to loyal customers.
Pilot project was successfully implemented in Jaipur stores. Over a 3 month period during pilot phase, average spend per member was Rs. 12,424.
Now extended in more than 340 EasyDay stores and garnered around 45,000 members in the previous month.

Section II: Q3FY17 Business Updates
Representative images of Big Bazaar & fbb stores
11

Executive Snapshot
Particulars (Rs cr) Q3 FY17 YTD FY 17
Income From Operations 4,420 12,591
Gross Margins % 24.6% 24.8%
EBIT 156 398
Net Profit 101 245
Same Store Sales Growth % 12.5% 11.5%
Gross Space Addition (mn.sq.ft) 0.25 0.83
Emergence of a stronger FRL amidst unprecedented challenges
Q-o-Q performance:
Business grew by 5%
Expansion in EBIT margins by 52 basis points
Increase in PAT by 37%
Key Q3FY17 Takeaways:
Better conversion from the footfalls
Drove higher value per customer
Cost savings kicking-in from operating leverage
Greater focus on social media campaigns & loyalty programs
Heritage Retail: Stock exchange approvals have been received while CCI approval is awaited; filed for NCLT approval
12
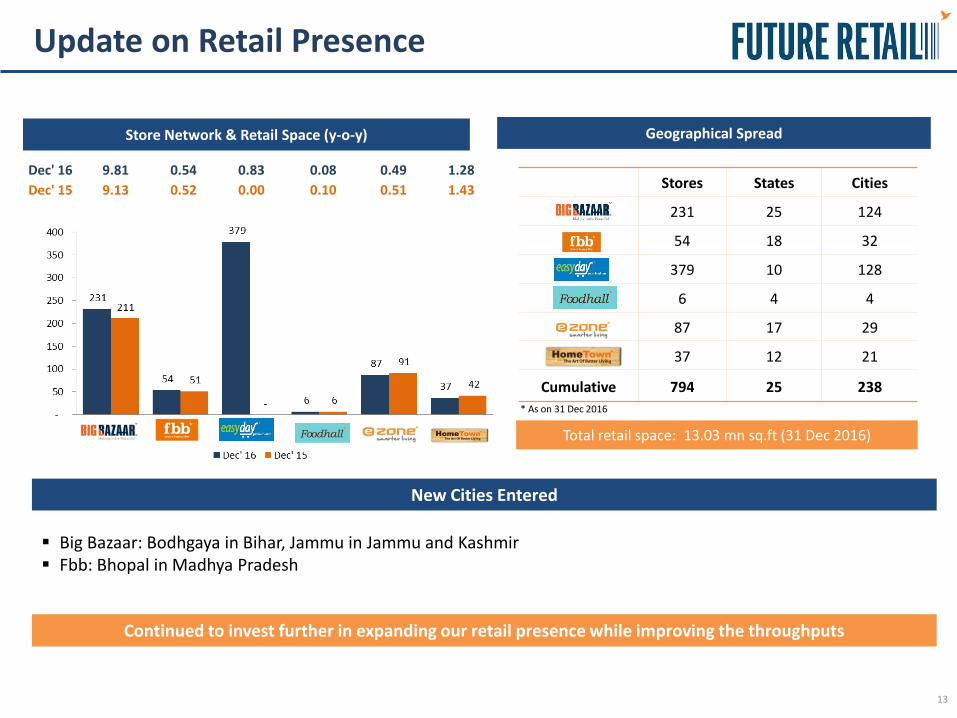
Update on Retail Presence
Store Network & Retail Space (y-o-y)
New Cities Entered
Big Bazaar: Bodhgaya in Bihar, Jammu in Jammu and Kashmir Fbb: Bhopal in Madhya Pradesh
Geographical Spread
Stores States Cities
Big Bazaar 231 25 124
fbb 54 18 32
379 10 128
6 4 4
Ezone 87 17 29
37 12 21
Cumulative 794 25 238
Continued to invest further in expanding our retail presence while improving the throughputs
Dec' 16 9.81 0.54 0.83 0.08 0.49 1.28
Dec' 15 9.13 0.52 0.00 0.10 0.51 1.43
* As on 31 Dec 2016
Total retail space: 13.03 mn sq.ft (31 Dec 2016)
13

Update on Small Neighborhood Stores
Roll-out Strategy
Top Consumption Micro-Markets – We
continue to maintain our focus on
expansion only in the targeted markets
In this quarter, we furthered our
presence in NCR and Bangalore
Customer Proposition: Targeted
assortment with a high degree of
shopping experience at attractive pricing
& loyalty benefits
Increase in private brands across these
stores shall enable the Company achieve
better inventory controls as well as
margins
ClusterNew Stores
Q2 FY17 Q3 FY17
NCR (Delhi, Faridabad, Ghaziabad, Gurgaon, Noida)
8 30
Bangalore Cluster 0 12
Ludhiana Cluster 7 3
Others 2 1
Total 17 46
Execution update
Progress till Dec 31’ 2016
Reduction in Head-office costs
Assortment enhancement
Closure of loss-making stores
Deep presence in “Top Consumption Micro-Markets”
Synergies of Scale -
Supply-chain efficiencies
Shared services (marketing, data analytics)
Omni-channel consumption
100% 25%14

Section III: Financial Updates
Representative images of Easyday stores
15
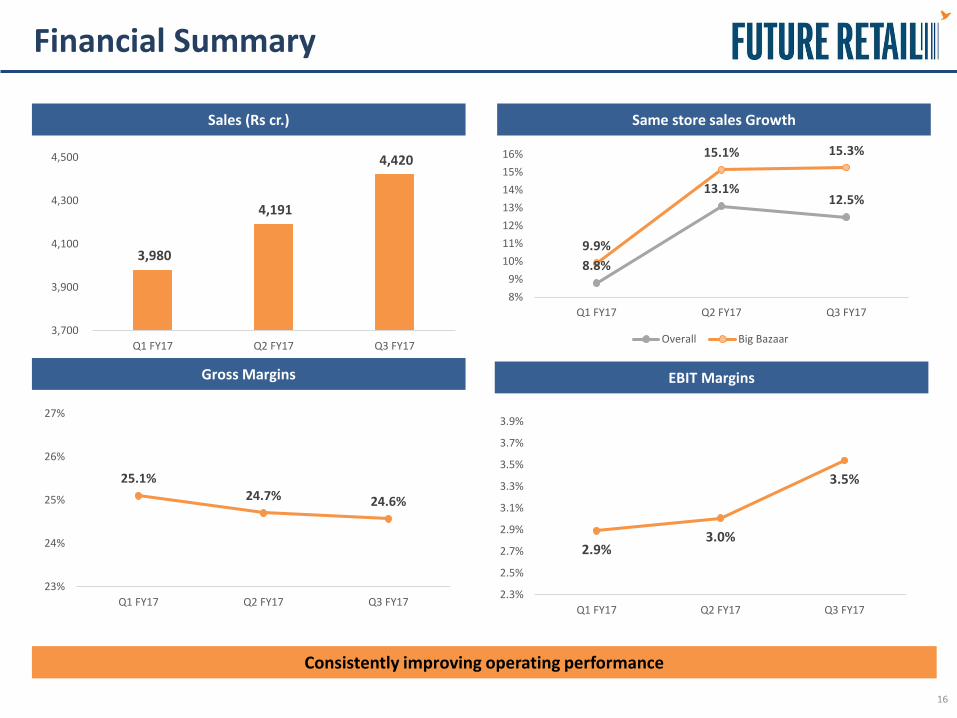
Financial Summary
Sales (Rs cr.) Same store sales Growth
EBIT Margins
Consistently improving operating performance
Gross Margins
8.8%
13.1%12.5%
9.9%
15.1% 15.3%
8%
9%
10%
11%
12%
13%
14%
15%
16%
Q1 FY17 Q2 FY17 Q3 FY17
Overall Big Bazaar
25.1%24.7% 24.6%
23%
24%
25%
26%
27%
Q1 FY17 Q2 FY17 Q3 FY17
2.9%3.0%
3.5%
2.3%
2.5%
2.7%
2.9%
3.1%
3.3%
3.5%
3.7%
3.9%
Q1 FY17 Q2 FY17 Q3 FY17
3,980
4,191
4,420
3,700
3,900
4,100
4,300
4,500
Q1 FY17 Q2 FY17 Q3 FY17
16

Profitability Margin Drivers
Targeted Margin Trajectory
Group brand strategy is being pursued across
categories
Demonstrated ability to sell top-quality value-
apparel which continues to be a differentiator
With deeper penetration in targeted micro-
markets, Neighborhood stores are projected
to yield higher margins & greater synergies
With an increased base of retail network,
costs are expected to rationalize
Category Penetration1 YTD movement2
Food
Fashion
General Merchandise
Household and Personal care
Group Brands
1. Refers to the extent of penetration of private brands with being the target2. YTD movement is an indicator of change in share of private brands’ revenue in total revenue
2.9%
Q1 FY17 Group Brandspenetration
Category Mix Neighborhoodstore margins
Costoptimization
After 3 years
Well regarded & accepted merchandise in
Fashion:
Built a high level of customer trust on
quality and design
Control on value chain, thereby delivering
high margins
Product innovation at the core that also
differentiates our retail stores
17

P&L Statement
Quarter ended9 months
ended
Particulars (Rs cr.) 31-Dec-16 30-Sep-16 30-Jun-16 31-Dec-16
Net Sales 4,322 4,130 3,892 12,343
Other Operating Income 98 62 88 248
Total income from Operations 4,420 4,191 3,980 12,591
Purchase of stock-in-trade 3,391 3,344 3,109 9,844
Changes in inventories (56) (190) (130) (376)
Gross Profit 1,086 1,037 1,000 3,123
Gross Margin % 24.6% 24.7% 25.1% 24.8%
Employee benefits expense 202 202 189 593
Rent including lease rentals 346 333 331 1,010
Other Expenditures 382 375 364 1,121
Other Income 9 6 6 21
EBITDA 165 135 122 422
Depreciation and Amortisation 9 8 7 24
EBIT 156 126 115 398
EBIT Margin % 3.5% 3.0% 2.9% 3.2%
Finance Costs 55 53 45 153
PBT 101 74 71 245
Tax Expenses - - - -
PAT 101 74 71 245
PAT % 2.3% 1.8% 1.8% 2.0%
Better throughput from customer footfalls over the previous quarter
Continuously improving ticket-size with thrust on customer loyalty programs
Deploying data analytics to ensure optimum assortment & availability
Focus on “Getting More out of Same”
18

Section IV: Key Marketing Updates
Representative images Big Bazaar Gen Next stores
19

fbb Denim Campaign
What started as a foot-tapping Denim Dance music video by celebrity choreographer Terence Lewis, concluded with a swooping Guinness World Record for making the ‘world’s largest photo book’!
Carrying thousands of photos of people in their denim-dance avatar,
the book was showcased at the Infinity Mall in Mumbai on
November 24, 2016
fbb’s Denim Dance campaign took the nation by storm!
20

Social Media Innovations – Price Discovery on
#DecideYourPrice campaign on Twitter
Launched a first of its kind social media campaign with active consumer interaction
• A branded bestseller is announced• Customers are required to retweet this announcement • Every single retweet reduces the price of the product• The lowest price is finally the price at which the product can be bought at any BB
store on specified dates
8,630 jeans sold
over 2 days
3,935 bags sold over 2
days
21

Section V: FRL - A Resilient & Dynamic Model
Representative images Big Bazaar Gen Next stores
22

Resilient to Demonetization
Demonetization & FRL
Driving Innovation in Retail
Continues to be Pivot of India’s Modern Retail
POS: Quick POS deployment at Big Bazaar outlets
Payment Wallets: Partnered with channels like Paytm and Mobikwik
Supply-chain: Robust payments to trade partners. Increase in direct procurement; trend likely to sustain in future.
FRL currency: In order to tap increased footfalls on a sustained basis, Company issued more vouchers
Strong Loyalty Strategy23

Continuous Innovation…
Driving Innovation in Retail
Future Pay: A unique loyalty wallet, comprising the Price Match feature that compares the price of items on the customer’s bill with the competitor’s advertised prices
Retail EMI card: Future Group and Bajaj Finance launched India’s first retail EMI card
Data Analytics: Use of data analytics to enhance assortment, effectiveness and availability thereby improving the throughput
Demonetization & FRL
Continues to be Pivot of India’s Modern Retail
Strong Loyalty Strategy
Loyalty
Price Match
Offers
Wallet
24

…With a Fundamentally Strong Retail Model
Continues to be Pivot of India’s Modern Retail
Strong SSGs: Growth momentumfrom same stores at >12%
Premiumization: One of the few pan-India retailers delivering growth along-with premiumization play across stores
Large contributor to national sales:FRL contributes significantly to the revenues of several marquee brands like Samsonite, Patanjali, Tropicana, Kellogg's, Prestige Cookware, Fiama-Da-Wills, Mamy Poko Pants, etc
Driving Innovation in Retail
Demonetization & FRL
Strong Loyalty Strategy25

…And a Unique Loyalty Platform
Continues to be Pivot of India’s Modern Retail
Driving Innovation in Retail
Demonetization & FRL
Strong Loyalty Strategy26

Namaste!
Disclaimer:This report contains forward-looking statements, which may be identified by their use of words like ‘plans’, ‘expects’, ‘will’, ‘anticipates’, ‘believes’, ‘intends’, ‘projects’, ‘estimates’, or other words of similar meaning. All statements that address expectations or projections about the future, including but not limited to statements about the Company’s strategy for growth, product development, market position, expenditures, and financial results are forward-looking statements. Forward-looking statements are based on certain assumptions and expectations of future events. The Company cannot guarantee that these assumptions and expectations are accurate or will be realized. The Company’s actual results, performance or achievements could thus differ materially from those projected in any such forward looking statements. The Company assumes no responsibility to publicly amend, modify or revise any forward looking statements, on the basis of any subsequent developments, information or events