esfahani and pesaran - iranian economy in twentieth...
TRANSCRIPT
Iranian Studies, volume xx, number x, April 2009
Iranian Economy in the Twentieth Century: A Global Perspective*
Hadi Salehi Esfahani, University of Illinois at Urbana-Champaign
and
M. Hashem Pesaran, University of Cambridge and USC
August 28, 2008
Abstract
This paper examines the transformation of the Iranian economy through the Twentieth Century within a global context. At the start of that century, the Iranian economy had long remained stagnant, poor, and largely agrarian, with a marginal role in the world economy. By the turn of 21st century, Iran had transformed into a complex and relatively large economy with important consequences for the economies of the Middle East and other parts of the world. While the initial conditions and the evolution of domestic institutions and resources played major roles in the pace and nature of that transformation, relations with the rest of the world had crucial influences as well. This paper focuses on the latter forces, while taking account of their interactions with domestic factors in shaping the particular form of economic development in Iran. We study the ways in which the development of the Iranian economy has been affected by international price movements and by the ebbs and flows of trade, investment, and economic growth in the rest of the world. In considering these effects, we also analyze the role of domestic political economy factors and policies in enhancing or hindering the ability of domestic producers to respond to external challenges and opportunities.
JEL Classifications: N15, O11, O53
Keywords: Development and Growth, Political Economy, Oil Prices, Global Development and the Iranian Economy
———————————— * We would like to thank Ahamd R. Jalali-Naini and the organizers and the participants of the conference on Iran and Iranian Studies in the 20th Century at the University of Toronto for encouragement and useful comments.
Introduction
The twentieth century was a period of profound transformation for the Iranian economy.
After centuries of under-development and economic stagnation with only a marginal role in the
world markets, the economy of Iran began to change in terms of structure, productivity, and
international impact. As Table 1 shows, by the end of the century, population of Iran had risen by
more than eight fold, per capita income had increased by about seven times, roughly doubling
the first half of the century and more than tripling in the second half. International trade,
although still limited in scope, had doubled relative to GDP and had come to play a major part in
providing access to technology and a wide variety of products, which served as an important
impetus for investment and growth. In the process, product, labor and capital markets had
expanded substantially in terms of size, scope, and depth, with industry and especially services
outgrowing agriculture as the primary sources of income and employment. The role of state in
the economy, which was largely confined to taxation and minimal maintenance of order, also
underwent significant changes both in the scope and the nature of government intervention in the
economy. Under the influence of internal and external forces, and with increasing revenues from
oil exports the state moved beyond its traditional roles and took major responsibilities for
economic development as entrepreneur, banker, regulator, and the primary provider of
infrastructure and social services. These changes came in ebbs and flows, with rapid
developments at times and major set backs at other times. Domestic and global circumstances
left their marks on the process and gave Iran's economic development specific forms.
Understanding these characteristics and the forces underlying them is important for assessing the
past performance of the Iranian economy and gaining insights into its future prospects.
[t]tab 1 here[/t].
Although the initial conditions and the evolution of domestic institutions and resources
played major roles in the pace and nature of that transformation, relations with the rest of the
world had crucial influences as well. In this paper, we focus on the latter forces, while taking
account of their interactions with domestic factors in shaping the form of economic change in
Iran. We study the ways in which the development of the Iranian economy has been affected by
international market trends and the vagaries of trade, investment, and economic growth in the
rest of the world. In considering these effects, we also analyze the role of domestic political
2
economy factors and policies in enhancing or hindering the ability of domestic producers to
respond to external challenges and opportunities.
We view economic development as a multi-faceted process that enables societies to
expand the opportunities for enhancing the well being and to respond to challenges. For this
reason, in our examination of the Iranian economy we address many different dimensions of
economic development; in particular, economic growth, structural change, income distribution,
education, and institutional capability (governance and knowledge of the economic system).
Since these dimensions are inter-related and interact with each other, we will focus more on two
types of central indicators. The first one is per capita GDP, which summarizes the economy's
ability to produce economic value per person. The other is the quality of policymaking, which
reflects the institutional capability to take advantage of opportunities and to respond to
challenges.
A key premise in our study of per capita GDP trends is the well-established proposition
that technological progress (i.e., new ways of producing more output given inputs) is the ultimate
source of sustainable long-run economic growth. While natural resources and physical and
human capital are necessary for production, they cannot serve as the engine of continued growth
by themselves because they are subject to depreciation and diminishing returns. They help
production and technological progress be materialized, but it is improvement in technology that
renders labor, and capital, and natural resources increasingly productive. Based on this premise,
the study of economic growth can be viewed as the analysis of the factors that enhance or hinder
the acquisition and use of technology. Economic interactions with the rest of the world are
particularly important in this context because technology is a worldwide phenomenon: It is
generated in bits and pieces in different parts of the world, but it can be shared and everyone can
benefit from it with appropriate interchange and local adaptation. While each country may
produce new technologies of its own, its contribution is typically a small part of the global pool
of technology. As a result, to avoid “reinventing the wheel” and to grow rapidly, countries need
to engage in global markets through trade, investment, and exchange of knowledge and know
how. Of course, domestic investments in productive capacity also need to be facilitated so that
new technologies are absorbed, adapted and put into effective use. The nature and quality of
institutions and policymaking is crucial in this process because it influences the ways in which
the economy becomes engaged in world markets. To ensure that the economy is positioned to
3
benefit from global opportunities, policymakers need to have (i) the motivation to pursue
economic growth and (ii) a good grasp of the workings of domestic and global economic
systems. As we argue in this paper, when these conditions were met in Iran, economic growth
was indeed very rapid. This was the case during the mid-1950s to mid-1970s. However, in most
of the century, policymakers did not view growth as top priority or lacked necessary knowledge
or commitment to effectively engage in the global development process. At those times, growth
was typically modest or short-lived. Long-term modest growth was largely a byproduct of other
processes such as state building (as in the 1930s) or various forms of modernization, which
helped expand education, infrastructure, and social services (as in the past two decades). There
were also short-lived episodes of high growth as a result of chance and special conditions (e.g., a
sharp rise in oil revenues or recovery from war), but they tapered off quickly as the
circumstances changed and government policies were not geared towards a sustained
development process. Finally, Iran suffered periods of significant economic decline during
periods when non-economic concerns became overwhelming; e.g., during the political turmoil of
the first two decades of 20th century or at times of domestic and international conflict (e.g., 1940-
1945, 1950-1953, 1978-1988).
We start in Section II below by reviewing the main macroeconomic trends in Iran during
the past century in a comparative perspective. Then, in Section III, we examine the role of
global economic trends on Iran and the way domestic factors have interacted with the external
forces. Section IV focuses on the role of economic sanctions imposed by the United States on
Iran. Section V offers some concluding observations.
Record of Economic Growth
Macroeconomic data for Iran's economy before 1959 is scant and unreliable. The Central
Bank of Iran has produced a detailed and consistent set of national accounts since 1959. A
rougher set of estimates for the period 1936-1958 is provided by Abolfazl Khavarinejad.1
4
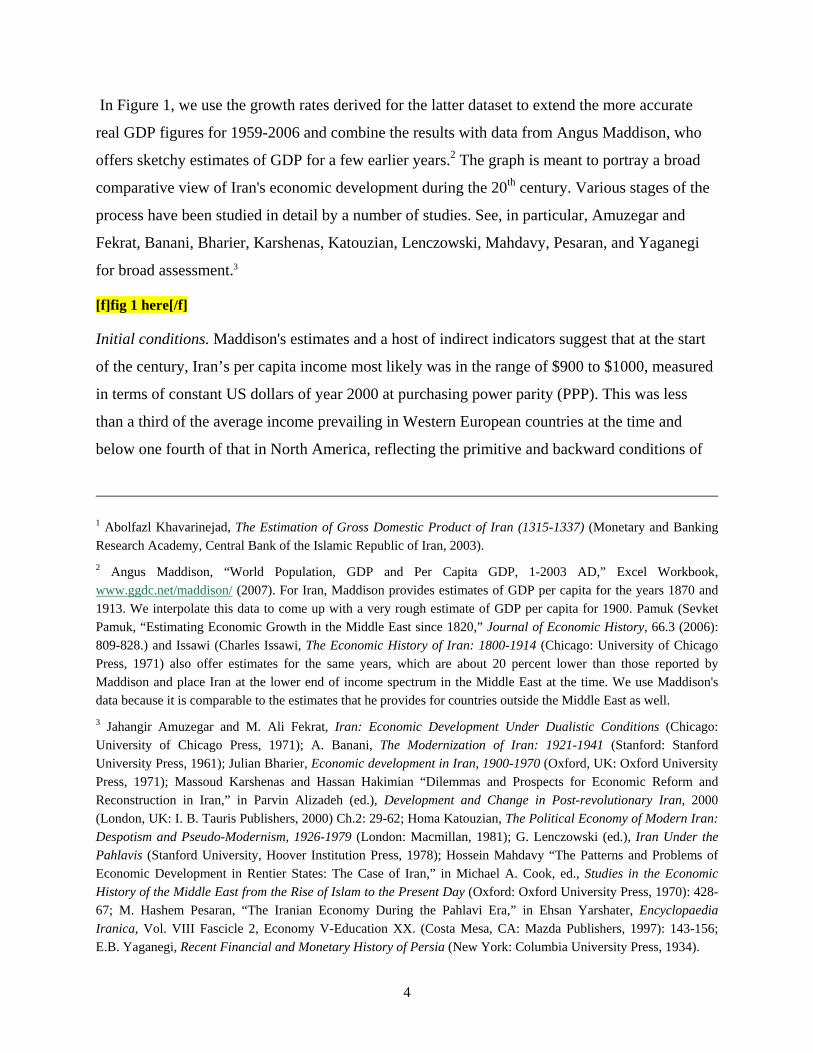
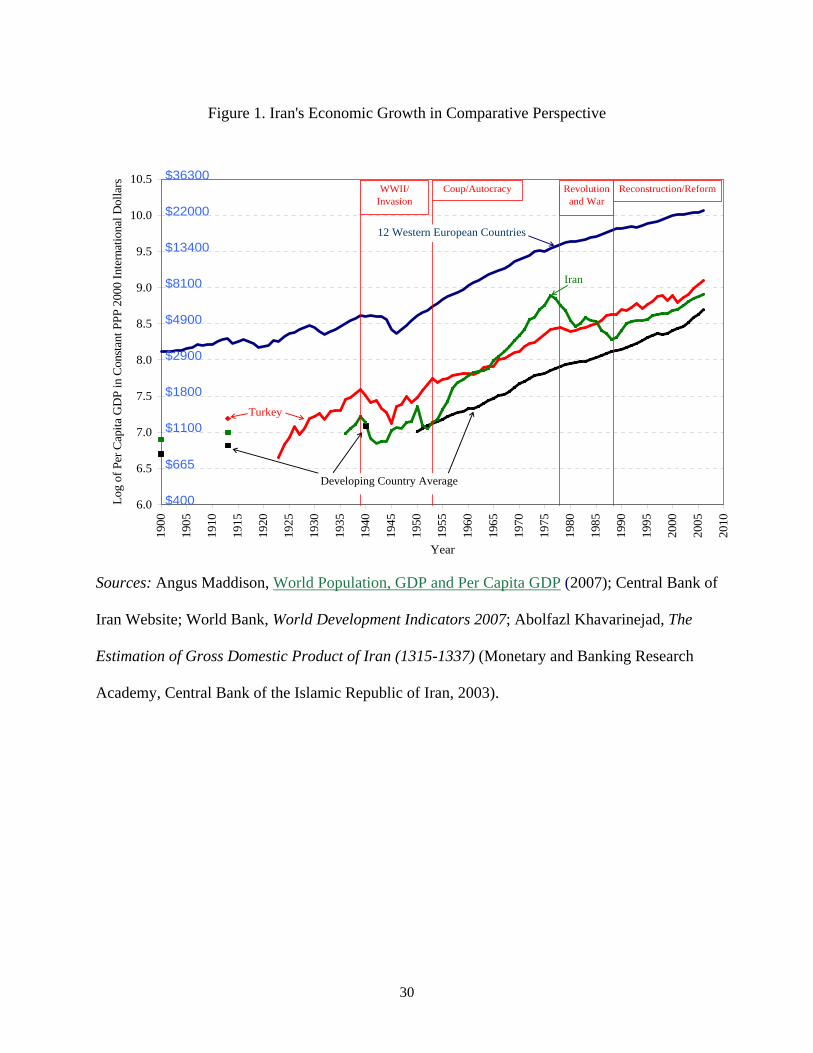
In Figure 1, we use the growth rates derived for the latter dataset to extend the more accurate
real GDP figures for 1959-2006 and combine the results with data from Angus Maddison, who
offers sketchy estimates of GDP for a few earlier years.2 The graph is meant to portray a broad
comparative view of Iran's economic development during the 20th century. Various stages of the
process have been studied in detail by a number of studies. See, in particular, Amuzegar and
Fekrat, Banani, Bharier, Karshenas, Katouzian, Lenczowski, Mahdavy, Pesaran, and Yaganegi
for broad assessment.3
[f]fig 1 here[/f]
Initial conditions. Maddison's estimates and a host of indirect indicators suggest that at the start
of the century, Iran’s per capita income most likely was in the range of $900 to $1000, measured
in terms of constant US dollars of year 2000 at purchasing power parity (PPP). This was less
than a third of the average income prevailing in Western European countries at the time and
below one fourth of that in North America, reflecting the primitive and backward conditions of
1 Abolfazl Khavarinejad, The Estimation of Gross Domestic Product of Iran (1315-1337) (Monetary and Banking Research Academy, Central Bank of the Islamic Republic of Iran, 2003).
2 Angus Maddison, “World Population, GDP and Per Capita GDP, 1-2003 AD,” Excel Workbook, www.ggdc.net/maddison/ (2007). For Iran, Maddison provides estimates of GDP per capita for the years 1870 and 1913. We interpolate this data to come up with a very rough estimate of GDP per capita for 1900. Pamuk (Sevket Pamuk, “Estimating Economic Growth in the Middle East since 1820,” Journal of Economic History, 66.3 (2006): 809-828.) and Issawi (Charles Issawi, The Economic History of Iran: 1800-1914 (Chicago: University of Chicago Press, 1971) also offer estimates for the same years, which are about 20 percent lower than those reported by Maddison and place Iran at the lower end of income spectrum in the Middle East at the time. We use Maddison's data because it is comparable to the estimates that he provides for countries outside the Middle East as well.
3 Jahangir Amuzegar and M. Ali Fekrat, Iran: Economic Development Under Dualistic Conditions (Chicago: University of Chicago Press, 1971); A. Banani, The Modernization of Iran: 1921-1941 (Stanford: Stanford University Press, 1961); Julian Bharier, Economic development in Iran, 1900-1970 (Oxford, UK: Oxford University Press, 1971); Massoud Karshenas and Hassan Hakimian “Dilemmas and Prospects for Economic Reform and Reconstruction in Iran,” in Parvin Alizadeh (ed.), Development and Change in Post-revolutionary Iran, 2000 (London, UK: I. B. Tauris Publishers, 2000) Ch.2: 29-62; Homa Katouzian, The Political Economy of Modern Iran: Despotism and Pseudo-Modernism, 1926-1979 (London: Macmillan, 1981); G. Lenczowski (ed.), Iran Under the Pahlavis (Stanford University, Hoover Institution Press, 1978); Hossein Mahdavy “The Patterns and Problems of Economic Development in Rentier States: The Case of Iran,” in Michael A. Cook, ed., Studies in the Economic History of the Middle East from the Rise of Islam to the Present Day (Oxford: Oxford University Press, 1970): 428-67; M. Hashem Pesaran, “The Iranian Economy During the Pahlavi Era,” in Ehsan Yarshater, Encyclopaedia Iranica, Vol. VIII Fascicle 2, Economy V-Education XX. (Costa Mesa, CA: Mazda Publishers, 1997): 143-156; E.B. Yaganegi, Recent Financial and Monetary History of Persia (New York: Columbia University Press, 1934).
5
the economy. The bulk of income came from land, with some limited manufacturing output
being by and large confined to carpet weaving, textiles, and handicraft. 4 The economy lacked
any growth momentum and education and infrastructure were too limited to support the
expansion of production and trade. More ominously, modern state institutions needed for
creating the conditions investment and productivity growth were badly lacking.5 However, this
was the fate shared by many countries in other parts of the world at the turn of the twentieth
century. Despite its low income, Iran’s per capita income was still above the average among
developing countries and only about 20 percent short of the average per capita income prevailing
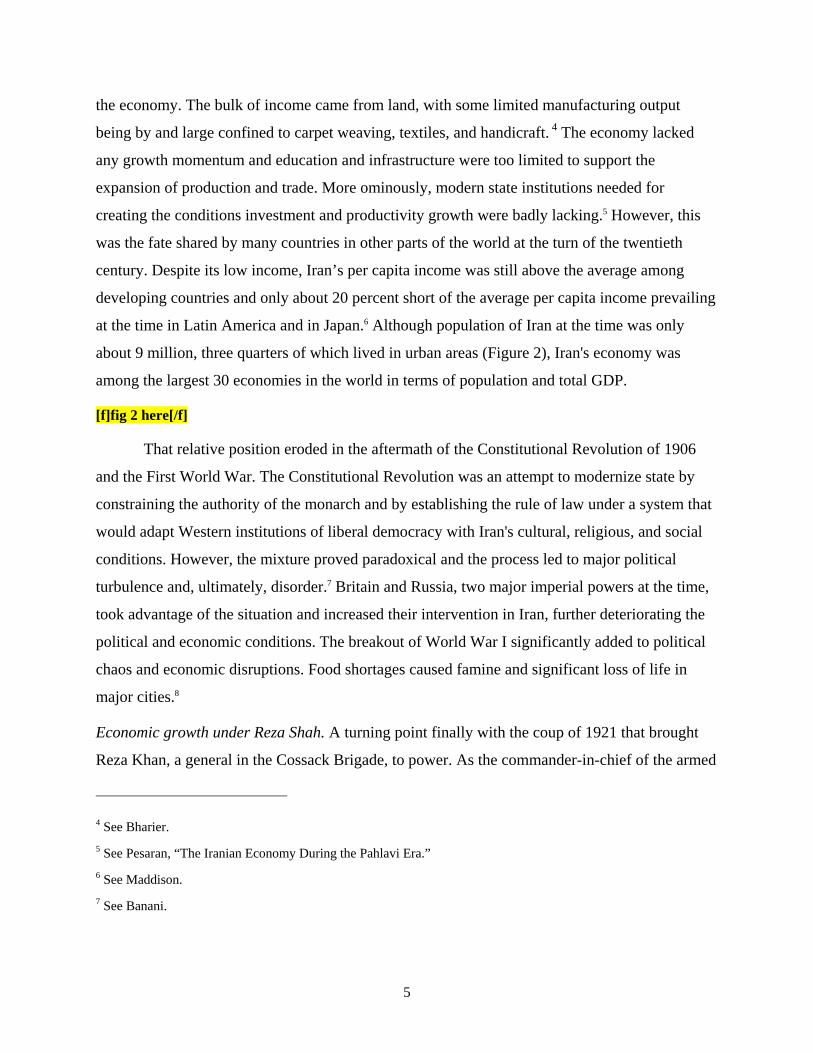
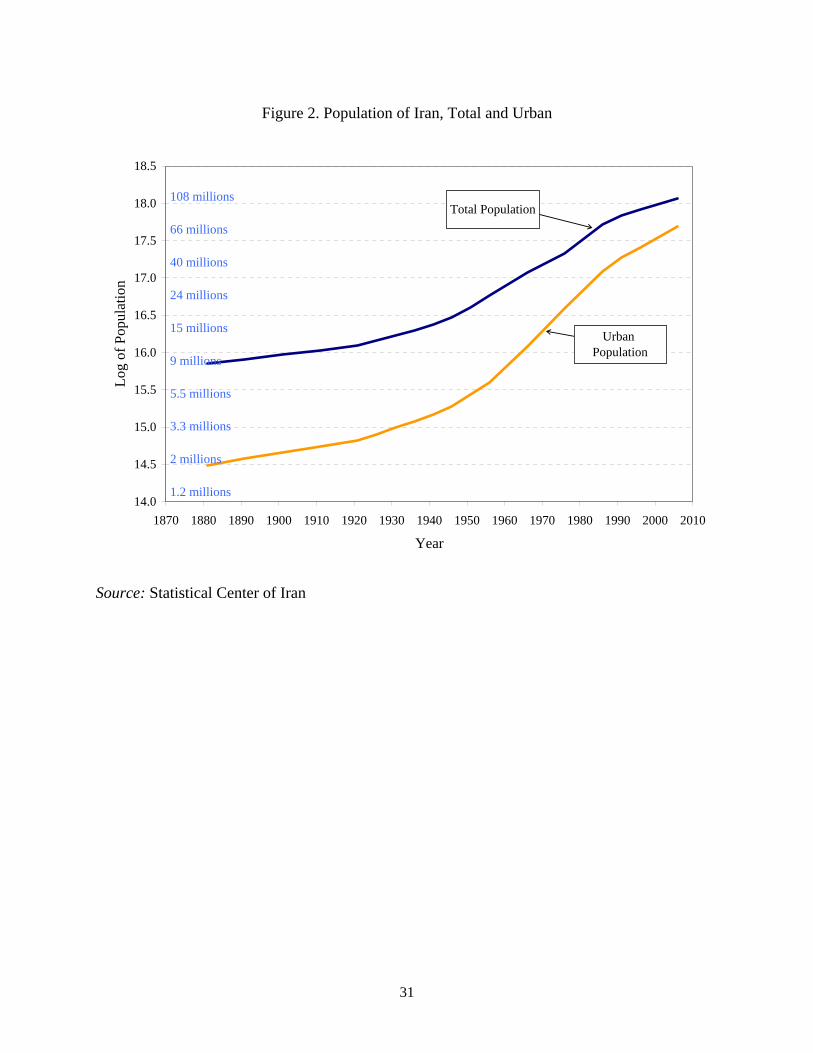
at the time in Latin America and in Japan.6 Although population of Iran at the time was only
about 9 million, three quarters of which lived in urban areas (Figure 2), Iran's economy was
among the largest 30 economies in the world in terms of population and total GDP.
[f]fig 2 here[/f]
That relative position eroded in the aftermath of the Constitutional Revolution of 1906
and the First World War. The Constitutional Revolution was an attempt to modernize state by
constraining the authority of the monarch and by establishing the rule of law under a system that
would adapt Western institutions of liberal democracy with Iran's cultural, religious, and social
conditions. However, the mixture proved paradoxical and the process led to major political
turbulence and, ultimately, disorder.7 Britain and Russia, two major imperial powers at the time,
took advantage of the situation and increased their intervention in Iran, further deteriorating the
political and economic conditions. The breakout of World War I significantly added to political
chaos and economic disruptions. Food shortages caused famine and significant loss of life in
major cities.8
Economic growth under Reza Shah. A turning point finally with the coup of 1921 that brought
Reza Khan, a general in the Cossack Brigade, to power. As the commander-in-chief of the armed
4 See Bharier.
5 See Pesaran, “The Iranian Economy During the Pahlavi Era.”
6 See Maddison.
7 See Banani.
6
forces and later as Minister of War and Prime Minister, Reza Khan initially channeled much of
government resources toward building an effective army, unifying the country under centralized
rule, and establishing order. This made it possible to increase production and, consequently, tax
collection, which in turn enabled the government to strengthen its position and begin a process of
state building.9 Reza Khan's success ultimately enabled him to depose Ahmad Shah (the last of
the Qajar dynasty) in 1925 and to take over the throne as Reza Shah.
Between 1921 and 1940, Reza Shah's regime brought about major institutional changes in
Iran. The centerpieces of those changes after the formation of a modern army were the
introduction of new Civil and Penal Codes and the establishment of an effective bureaucracy,
which helped improve the dire conditions of education and healthcare and initiated key
infrastructure development projects. The statist policies in Turkey under Ataturk also inspired
Reza Shah and provided him with ideas and guidelines for state building and economic
development, leading to the establishment of state-owned enterprises and the use of protection
and banking facilities to promote private investment.10 The Great Depression of the 1930s and
the rise of protectionism around the world also prompted and intensified interventionist policies
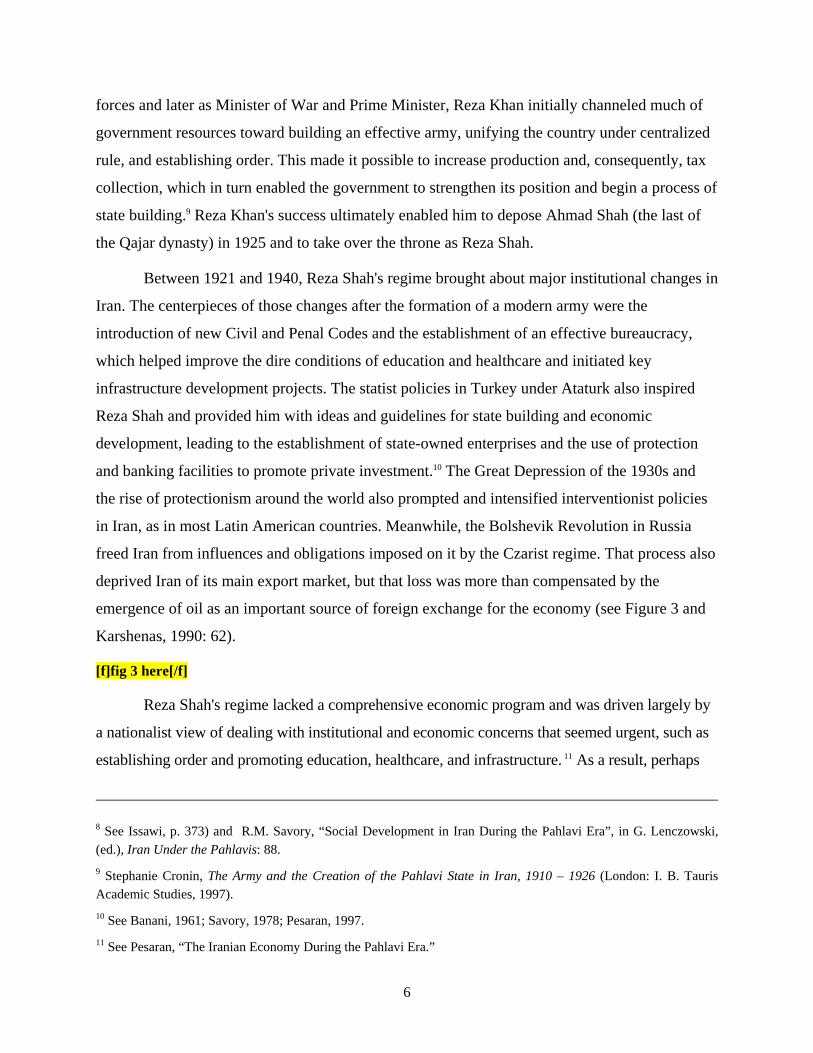
in Iran, as in most Latin American countries. Meanwhile, the Bolshevik Revolution in Russia
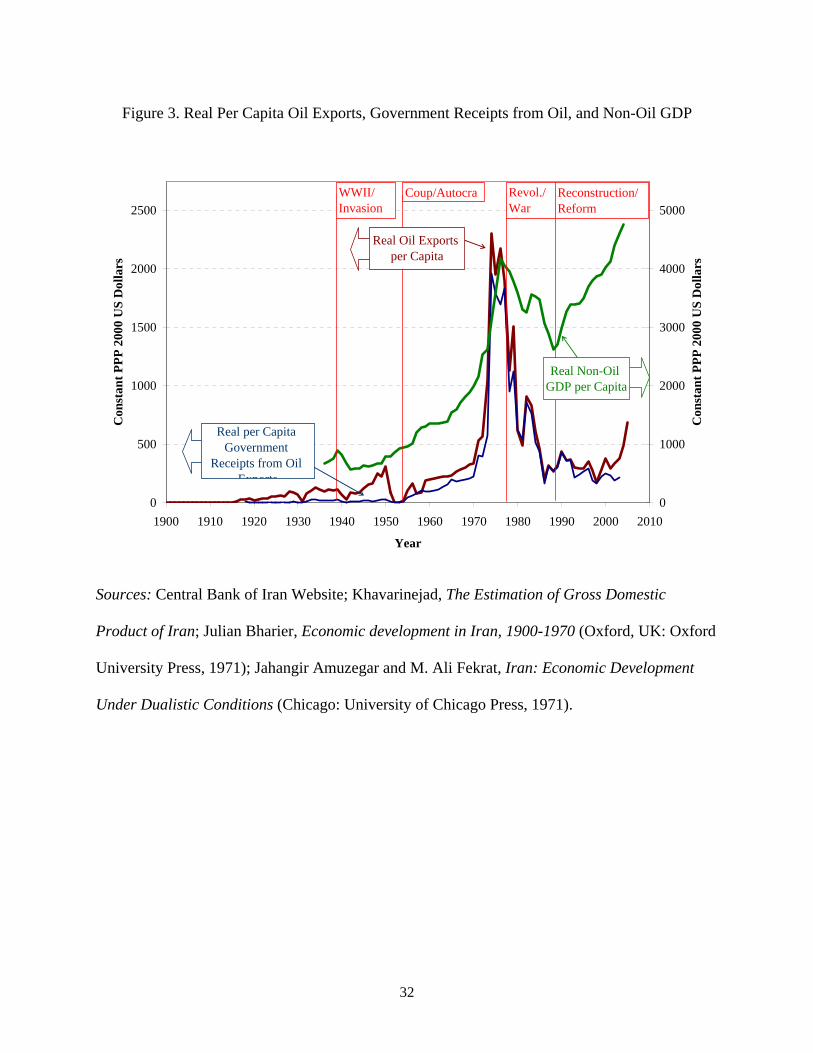
freed Iran from influences and obligations imposed on it by the Czarist regime. That process also
deprived Iran of its main export market, but that loss was more than compensated by the
emergence of oil as an important source of foreign exchange for the economy (see Figure 3 and
Karshenas, 1990: 62).
[f]fig 3 here[/f]
Reza Shah's regime lacked a comprehensive economic program and was driven largely by
a nationalist view of dealing with institutional and economic concerns that seemed urgent, such as
establishing order and promoting education, healthcare, and infrastructure. 11 As a result, perhaps
8 See Issawi, p. 373) and R.M. Savory, “Social Development in Iran During the Pahlavi Era”, in G. Lenczowski, (ed.), Iran Under the Pahlavis: 88.
9 Stephanie Cronin, The Army and the Creation of the Pahlavi State in Iran, 1910 – 1926 (London: I. B. Tauris Academic Studies, 1997).
10 See Banani, 1961; Savory, 1978; Pesaran, 1997.
11 See Pesaran, “The Iranian Economy During the Pahlavi Era.”
7
not surprising given the circumstances, economic policymaking had a trial and error nature, rather
than being based on systematic economic calculations, and a well thought out development
process. For example, when the worsening terms of trade during 1928-1929 caused a major rise in
trade deficit, the government initially resorted to devaluation. Then, as Pesaran puts it,
This devaluation introduced further uncertainties into an already volatile foreign
exchange market, forcing the government, in effect, to introduce foreign exchange
controls in February 1930. These controls were then supplemented by the Foreign
Trade Monopoly law, … granting the government monopoly over all foreign trade
(imports as well as exports). … Within two years, however, the controls proved
unworkable and the full implementation of the law lapsed. The more lasting effect
of the law was to increase the involvement of the government in productive
activities. By 1935 the government had established seventeen trading companies,
which directly or indirectly controlled 33 percent of imports and 49 percent of
exports. These companies also provided the government with a substantial degree
of control over the country’s financial, as well as physical, resources. 12
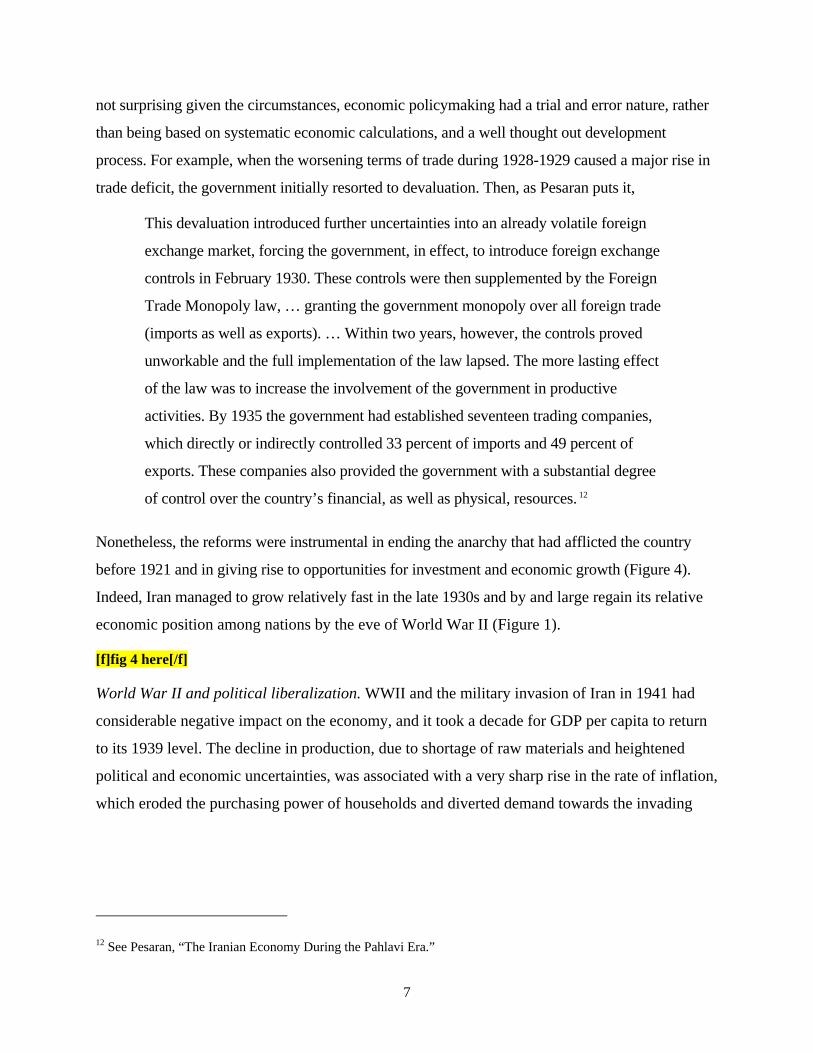
Nonetheless, the reforms were instrumental in ending the anarchy that had afflicted the country
before 1921 and in giving rise to opportunities for investment and economic growth (Figure 4).
Indeed, Iran managed to grow relatively fast in the late 1930s and by and large regain its relative
economic position among nations by the eve of World War II (Figure 1).
[f]fig 4 here[/f]
World War II and political liberalization. WWII and the military invasion of Iran in 1941 had
considerable negative impact on the economy, and it took a decade for GDP per capita to return
to its 1939 level. The decline in production, due to shortage of raw materials and heightened
political and economic uncertainties, was associated with a very sharp rise in the rate of inflation,
which eroded the purchasing power of households and diverted demand towards the invading
12 See Pesaran, “The Iranian Economy During the Pahlavi Era.”
8
armies. 13 Reza Shah was forced to abdicate and his young son, Mohammad Reza Pahlavi, was
propelled to the throne with the help and the patronage of the British government.
[f]fig 5 here[/f]
The departure of Reza Shah and the presence of foreign troops from 1941 to 46 created a
new environment in which a variety of groups found opportunities to participate in the political
process.14 This led to a relatively chaotic political situation because at the time Iran lacked well-
established political and policymaking institutions to coordinate the multitude of conflicting
demands that had emerged. 15 The only issue that seemed to unify large segments of the
population was the desire to gain control of the oil industry and appropriate larger shares of its
revenues. Iran had, indeed, been earning small shares of its oil wealth: Prior to 1930s, the
royalties paid to the government of Iran by the British holder of oil concession in most of Iran
were no more than 8 percent of the value of oil exports. When the concession was renegotiated
by Reza Shah's government in the early 1930s, Iran's share rose to about 15 percent.16 But, the
contract had not been set up to allow the share to rise in line with the international price of oil.
As a result, when the British pound lost its value and the price of oil rose following WWII, Iran's
share declined and fueled the public demand for the nationalization of the oil industry. Iranians
were also conscious that similar processes elsewhere had led to contracts much more favorable
towards oil exporting countries.
With end of military occupation in 1945, the government of Iran sought to address the
policy coherence issue by pursuing economic planning, which had been considered before
WWII. It instituted a High Economic Council in 1945, which eventually led to the formation of a
Plan Organization and put Iran's First Development Plan into effect in 1949. The Plan was
limited, lacked a macro framework, and focused entirely on channeling part of oil revenues
toward government investment projects. Nevertheless, it was successful in promoting the idea of
13 See Figure 5 in Pesaran, “The Iranian Economy During the Pahlavi Era.”
14 Ervand Abrahamian, Iran Between Two Revolutions (Princeton: Princeton University Press, 1982).
15 See Pesaran, “The Iranian Economy During the Pahlavi Era.”
16 Amuzegar and Fekrat: 21-22.
9
planning and in transforming the newly founded Plan Organization into an effective bureaucracy
which later came to play a central role in managing Iran's economic development.17
Iran's investment and growth rate picked up in the second half of 1940s as the economy
started to recover from the war episode and benefited from increased oil revenues and foreign
exchange reserves accumulated during the war. But, the recovery was short-lived. This may have
been partly due to the high level of political instability during those years, as reflected in
frequent demonstrations and strikes as well as assassination of two prime ministers and other
prominent political figures, not to mention the assassination attempt on the Shah. However, a
more dominant factor was the growing confrontation with the West over Iran's oil industry. In
the early 1950s, the movement to nationalize the oil industry gathered momentum and the
country came to face a major economic embargo from outside, and political instability from
inside (Figures 1-4).18 Oil revenues declined to a trickle and brought investment to a halt.
Although there were concerted attempts at increasing non-oil exports and maintaining a minimal
level of imports (Figure 6), per capita income, and even the non-oil production declined.19
[f]fig 6 here[/f]
Economic growth under autocracy, 1953-1979. The oil nationalization episode and its associated
economic collapse ended with a CIA-coordinated coup in 1953 that brought back a strengthened
autocracy under the Shah. In the aftermath of the coup, Iran started receiving much larger shares
of oil exports (Figure 3) as well as foreign aid and technical support from the United States.20
17 See G.C. Baldwin, Planning and Development in Iran (Baltimore: Johns Hopkins Press, 1967) and Hossein Razavi and Firouz Vakil, The Political Environment of Economic Planning in Iran, 1971-1983 (Boulder, CO: Westview Press. 1984).
18 Accounts of the developments leading to the nationalization of the oil industry under Mosaddeq's Premiership can be found in Ruhani (1971), Fesharaki (1976), Stobaugh (1978) and Bamberg (1994, Chapters 15-16).
19 See Patrick Clawson and Cyrus Sassanpour, “Adjustment to a Foreign Exchange Shock: Iran, 1951-1953,” International Journal of Middle East Studies, 19 (1987): 1-22, for a detailed examination of the adjustments to the foreign exchange shortage during 1951-1953.
20 U.S. grants during 1953-57 amounted to $303 million, which exceeded the government's receipt from oil exports during those years. Over the following six years, Iran received an average of about $50 million per year in U.S.
10
The government launched the Second Seven Year Plan (1956-62), which was more ambitious
than the First. It also started providing more systematic support to the private sector, especially
through credit channels: The private sector credit rose by 46 percent in 1957, 61 percent in 1958,
and 32 percent in 1959.21 Although these policies were effective in helping the economy to
recover and expand in the second half of 1950, they lacked coherence and a stable
macroeconomic framework, as in earlier growth episodes of the country. While incomes were
rising, non-oil exports became costly to maintain and imports outpaced exports (Figure 6). As a
result, a balance of payments crisis ensued in 1959 and forced the government to curtail its credit
and expenditure policies and eventually during 1960-62 implement an “Economic Stabilization
Program” supported by the International Monetary Fund.22 The Program was effective in
stabilizing the economy and addressing the payments problem, but it entailed a recession that
lasted until 1963. Meanwhile, the government had started a number of reform programs to
redistribute agricultural land away from large landlords, sell the shares of public enterprises,
require profit-sharing for industrial workers, extend suffrage to women, form literacy corps, and
nationalization of forests and pastures—jointly dubbed by the Shah as the “White Revolution.”
The recession along with these reform measures and increasing alignment of the regime with the
United States galvanized a broad-ranging opposition to the regime and instigated an uprising in
1963. The Shah managed to crush the uprising and undermine the opposition from landlords and
traditional strata of the society through his reform measures.
The concentration of power in the Shah's hand, the development of an effective
bureaucracy in charge of economic policies, and increasing oil revenues became a potent mix for
bringing about economic change.23 Between 1963 and 1976, GDP per capita grew at
unprecedented rates that averaged 8.0 percent per year (Figures 1 and 4). Interestingly, growth in
non-oil GDP per capita was even faster—8.6 percent per year. In that process, Iran's per capita
income moved well above the average for developing countries and was quickly closing its gap
grants. During those years, an additional $400 million was provided in the form of loans and another $712 millions as military grants. See Bharier (1971), Chapter 5, Table 8.
21 Annual Reports of the Central Bank of Iran, 1960 and 1961.
22 Karshenas: 133-139.
23 See Karshenas (Chapter 7) and Hadi Salehi Esfahani, “The Experience of High Economic Growth in Pre-Revolutionary Iran,” manuscript (University of Illinois at Urbana-Champaign, 2006).
11
with the average income levels in Western Europe. At its peak in 1976, per capita income in Iran
had reached about 64 percent of the average for 12 Western European countries (Figure 1). Of
course, that high level of income did not fully translate into a commensurate standard of living
for the typical Iranian household because well over on third of that income was due to oil
exports, which were not gained through productivity increases and were subject to the vagaries
of international oil markets. Besides, those revenues were controlled by the Shah’s autocratic
regime that had focused on overall economic growth with little regard for income distribution. It
was often argued that economic growth will eventually improve income distribution through the
so-called Kuznets effect. An important consequence was a sharp rise in income and expenditure
inequalities.24 This trend can be seen in the rise in the Gini coefficient and the income ratio of top
to bottom deciles, as shown in Figure 7. Nevertheless, the rise in the standard of living for most
of the population and the increase in non-oil GDP during those years were quite impressive and
comparable with the overall GDP growth (Figure 3). The process entailed rapid transformation
of the economy from a largely agrarian base to one mainly oriented towards services and
industry (Figure 8), accompanied by substantial improvements in infrastructure and public
services, particularly roads, electricity, water, education and health (see Figures 9 and 10).
[f]fig 7 here[/f]
[f]fig 8 here[/f]
[f]fig 9 here[/f]
[f]fig 10 here[/f]
Ironically, the long episode of post-1963 rapid growth started to falter following a four-
fold increase in oil prices in 1973. While the oil revenues reached phenomenal levels, managing
and channeling them properly proved a major challenge for the government under the Shah,
especially given his insistence to double the planned public expenditure after 1973.25 Although a
significant proportion of the increased revenue was directed towards investment (Figure 4), the
economy overheated and started experiencing high and rising inflation in the mid-1970s (Figure
5). The government's attempt to control inflation, sometime by draconian measures such as
24 Karshenas: 198-205.
25 See Pesaran, “The Iranian Economy During the Pahlavi Era.”
12
prosecuting shopkeepers for price increases, and private investors' reaction to those measures and
to increased economic instability soon led to sharp declines in investment and GDP.26
Meanwhile, public discontent with regime's policies in both economic and non-economic spheres
grew and fueled a revolutionary movement that soon brought down the monarchy and led to the
establishment of the Islamic Republic.27
Islamic Revolution and war. Following the Revolution of 1979, the economy entered a period of
rapid decline. Except for a brief period during 1983-1984, investment and GDP were rapidly
falling and inflation was on the rise. At its trough in 1988, real GDP per capita had dropped to
only 54 percent of its peak in 1976. Non-oil GDP per capita had fallen by less, but it was still
only 63 percent of its 1976 peak. As a result, by 1988 the per capita income in Iran had dropped
to about $4300 (in terms of constant 2000 dollars), which was only 23 percent of per capita
income in Western Europe and fell behind many comparable developing countries. For example,
Iran's GDP per capita ended up 25 percent below that of Turkey, while it had surpassed Turkey
by that measure in the early 1960s (Figure 1). Many factors account for this decline, particularly
the high political risks for private investors after the Revolution, exodus of large numbers of
skilled professionals,28 adoption of adverse economic policies, falling oil revenues, and the
highly destructive war with Iraq. The roles of most of these factors are well known.29 We will
examine the nature of the government's international trade and finance policies over this period
in some detail below.
Recovery and reform under the Islamic Republic. The end of the war with Iraq in 1988 ushered a
new period of economic development in Iran. Beginning 1989, the government of the Islamic
26 Katouzian: 334.
27 See Ervand Abrahamian, “Structural Causes of the Iranian Revolution,” MERIP Reports, No. 87 (1980): 21-26; M. Hashem Pesaran, “The System of Dependent Capitalism in Pre- and Post-Revolutionary Iran,” International Journal of Middle East Studies, 14.4 (1982): 501-22; M. Hashem Pesaran, “Economic Development and Revolutionary Upheavals in Iran,” in Haleh Afshar, ed., Iran: A Revolution in Turmoil (London: Macmillan,1985): 15-50; Esfahani, “The Experience of High Economic Growth …”.
28 Iran has one of the highest rates of emigration of people with university degrees (Carrington and Detragiache, 1998). See also the discussion in Amid and Hajikhani (2005: 89).
29 See Pesaran, “Economic Trends …” and Massoud Karshenas and Hassan Hakimian, “Dilemmas and Prospects for Economic Reform and Reconstruction in Iran,” in Parvin Alizadeh (ed.), Development and Change in Post-revolutionary Iran (London, UK: I. B. Tauris Publishers, 2000), Ch.2: 50-75.
13
Republic began to dismantle the extensive controls that had been imposed on the markets after
the Revolution and during the eight-year war with Iraq. Meanwhile, oil revenues started to
recover and facilitated a rapid increase in investment with subsiding inflation (Figures 3-5).
While private investment led the process, it should be pointed out that this was very much under
the auspices of the government. Indeed, most of the investment that is counted as “private” since
the Revolution is carried out by state-owned foundations, such as the Foundations for the
Oppressed which controlled a large fraction of the modern light industries in Iran, that were
directly or indirectly controlled by the executive or the office of the Supreme Leader.
The post-war recovery was short-lived. Managing deregulated markets and foreign
payments proved more challenging than the policymakers had anticipated. In particular, short-
term foreign debt started building up largely unchecked (Figure 11), and gave rise to a major
balance of payments crisis when oil revenues started to decline in 1993 (Pesaran, 2000).30 The
problem was significantly exacerbated by the government's effort to reduce the foreign-exchange
market controls and rely on a unified exchange rate. As the crisis started, the rial quickly lost its
value and made it difficult for domestic firms that had borrowed abroad to pay back their debts.
In the event, the government decided to cover a substantial portion of the losses sustained by the
borrowers as a result of the devaluation. Since public revenues had fallen and its
creditworthiness was low, this entailed a major expansion of the monetary base. The
consequence was stagnation of the economy along with a sharp rise in inflation (Figure 5). The
government's broader response was the re-introduction of a host of controls on foreign trade and
payments as well as on domestic markets.
[f]fig 11 here[/f]
The renewed interventions caused major distortions and prolonged the slowdown, but
enabled the government to gain firmer control over the situation and reduce the likelihood of
balance of payments crises. However, it was unable to generate tangible economic growth until
2002 when oil revenues recovered again. This connection between economic growth and oil
revenues is highlighted vividly in Figure 11, which also shows a brief recovery in 1996 and 1977
30 M. Hashem Pesaran, “Economic Trends and Macroeconomic Policies in Post-Revolutionary Iran,” in Parvin Alizadeh (ed.), Development and Change in Post-revolutionary Iran (London, UK: I. B. Tauris Publishers, 2000), Ch. 3: pp.63-100.
14
was thwarted by the decline in oil revenues in 1998 and 1999. Such close connection between oil
exports and growth is not inevitable and there are ways of ensuring more stable economic growth
paths. The creation of a stabilization fund, where revenue surpluses may be accumulated during
high oil price periods, is one way to help reduce the connection, which the government of Iran
has adopted in the past several years. Policies that ensure greater integration with the rest of the
world may also help by providing greater opportunities for diversification and substitution in the
face of rapid changing terms of trade. Ironically, the attempts in the past by the Islamic Republic
to stabilize the economy through greater isolation may have done the exact opposite. As Javad
Amid and Amjad Hajikhani argue based on their survey of representative Iranian firms,
extensive interventions in trade and markets have strained the relationship of domestic producers
and their foreign partners.31 This has put Iranian firms in precarious conditions and has lowered
the levels of their technological exchange and development.
The interventionist policies of the government after the Revolution were partly intended
to reverse the rising inequities in the earlier decades. They seem to have directly and indirectly
contributed to such a reversal (Figure 7). However, it is notable that inequality had already
started to decline before the Revolution, possibly due to “trickle down” effects of large
investment expenditures to the poorer sections of the society. It is also noteworthy that the
decline in inequality came to a halt in 1985 and was partially reversed for a few years. The more
long term legacy of Revolution for inequality in Iran seems to be a gradual decline in extreme
differences—reflected in the income ratio of the top to bottom deciles of the households—while
the overall inequality measured by the Gini coefficient has remained unchanged. These trends
gain more significance when one notes that after the Revolution, the impact of rising oil revenues
on inequality has been largely muted (Figure 7). Also, the post-revolutionary policies and
institutions seem to have somewhat counter balanced the rising trends in inequality experienced
in many other parts of the world due to the rapid pace of technological change and globalization.
While the GDP growth in recent years has been respectable (averaging to around 5
percent per annum), its apparent dependence on continued rise in oil revenues sheds doubt on the
sustainability of the process. Moreover, it has come at a time when many developing countries
31 Javad Amid and Amjad Hadjikhani, Trade, Industrialization and The Firm In Iran: The Impact of Government Policy on Business (I. B. Tauris, 2005): Chs. 7 and 8.
15
have started to grow at higher rates. This process is most clearly exemplified by the phenomenal
growth rates in China and more recently India, but it is not difficult to find other countries
growing faster than Iran in East and South Asia, Latin America, Eastern Europe, and even
Africa. As a result, despite its recent experience of growth, the relative position of Iran in the
world economy has been slowly eroding again (Figure 1). However, there are a number of
developments in the past two decades that can potentially wean the economy from oil revenues
and bring it to a more sustainable growth path. In particular, education, healthcare, and the use of
new technologies have been rapidly expanding (Figures 9 and 10). Also, as we will see below,
the economy and its non-oil exports are becoming more diverse and sophisticated. At the same
time, the demand for such production is rising in Iran's neighboring countries and is raising the
incentives for Iranian businesses to connect those markets to their production bases in Iran. We
will discuss these and related issues in detail in the next section.
Global Connections
International trade and finance provide key opportunities for economic growth in a
country. While trade restrictions and import substitution industrialization (ISI) in many countries
have been associated with economic growth under some conditions for a relatively short period
of time, continued and excessive reliance on such policies could deprive the economy of the
benefits of access to technology and capital, larger markets, and reliable signals for efficient
investment and production. Such benefits expanded steadily during the 20th century as
transportation and communications costs declined and the world economy and market sizes grew
larger. These developments made ISI policies increasingly obsolete. However, many developing
countries could not still shift gear and engage productively in world trade. This was partly
because of past successes with ISI and lack of knowledge about its increasing limitations.
Another factor was the underdeveloped nature of capital and labor markets made the reform and
management of trade fluctuations costly for most developing countries. Finally, many of those
countries lacked adequate institutional and administrative capabilities to develop those key
markets or find substitutes for managing the risks from international trade. In this context,
following the experience of Japan, East Asian countries came up with export promotion as an
alternative approach that shifted the focus of government interventions from import competing to
export-oriented industries. This innovative strategy allowed the country to take advantage of
16
global markets while enabling the government to maintain control and mobilize resources for
addressing possible market failures as well as its own institutional weaknesses.
Iran's participation in the world economy has been largely conditioned by its resources,
geographic location, global market trends, domestic ideological and political concerns, the eight-
year war with Iraq and the U.S. economic sanctions. At times, government policy has actively
managed these factors to enhance the benefits of trade for the economy. For example, the
government's responses to global economic challenges in the first three decades of the 20th
century led to a major shift in the composition imports, expanding the share of capital and
intermediate goods that facilitated transfer of technology and expanded the production capacity
of the economy. Also, relatively coherent plans for using a sizable part of oil revenues in the
1950s and 1960s to develop Iran's infrastructure and human capital paid off handsomely in terms
of growth between mid-1950s and mid-1970s by expanding domestic markets, improving access
to foreign resources and technology, and boosting investment opportunities. However, in many
other occasions, the policy approach has been passive or non-innovative intervention, including
significant withdrawal from the globalization process, causing loss of important opportunities for
economic growth.
Being on the route of silk trade many centuries ago, Iran had long benefited from access
to world trade. Indeed, the emergence of sea routes between Europe and Asia and the
concomitant decline of the Silk Road was a major contributory to the long economic stagnation
of Iran before the 20th century. In modern times, authorities started to recognize the importance
of trade and access to foreign resources, but this was often limited in scope and, at times, led to
quite restrictive policies. Access to large oil revenues, only made possible through trade, also
played a central role in Iran's economic relations with the rest of the world.
Geographical composition of Iran’s imports and exports. In the early years of the 20th century,
about 70 percent of Iran's exports went to Russian markets and 10 percent to U.K. and India
(Bharier, 1971: Chapter 6, Table 5). There was virtually no direct trade with the United States,
Japan, or Germany, which later became major trade partners for Iran. However, part of the
exports to Russia may have passed on to the rest of Europe or other countries. Imports also had a
similar pattern, though the share of Russia was about 45 percent and that of U.K. and India was
37 percent (Bharier, 1971: Chapter 6, Table 3). This pattern of trade partly reflected the
17
geographic location of Iran and partly the diversion of trade due to the low tariff imposed on Iran
through a series of treaties with Russia following Iran's defeat in wars between the two countries
in the first half of 19th century (Karshenas, 1990: 47). Britain also obtained similar tariff
privileges. The result was a shift in imports towards manufactured consumer goods, in
competition with domestic production of such products. Curiously, the superpower rivalry in
some cases entailed heavy subsidization of such consumer goods, which wiped out domestic
production of similar goods (Karshenas, 1990: 48). The pattern of tariffs also had important
implications for Iran's exports by shifting towards agricultural raw materials and away from
textiles and handicraft except carpets, though this did not turn the country into a monoculture
economy (Karshenas, 1990: 48).
After WWI and the Bolshevik Revolution, as noted earlier, trade with Russia declined
and was redirected towards Britain and the United States. Nevertheless, by late 1920s, some 40
percent of Iran's non-oil exports ended up in the Soviet Union, 20 percent in Britain and India,
and 17 percent in the United States (Bharier, 1971: Chapter 6, Table 5). German markets had
also become a destination, though still quite limited. However, Germany had become an
important supplier of Iranian imports (8 percent), while Soviet Union's share was 32 percent and
U.K./India's 29 percent, U.S. 7 percent, and Japan 9 percent (Bharier, 1971: Chapter 6, Table 3).
The composition of non-oil export products had remained largely the same as it was three
decades earlier. However, imports now consisted largely of capital and intermediate goods
(Karshenas, 1990: Table 3.1).
Trends in oil revenues and output growth. To develop an overview of Iran's interaction with the
global economy from 1930s onward, we start with Figure 6 that shows imports and exports as
shares of GDP since the mid-1930s. The graph shows that in the second half of 1930s, Iran's
imports were about 15 percent of its GDP and its exports amounted to about 25 percent of GDP,
with roughly half of that amount being due to oil exports. Oil seems to have been generating a
surplus that had been partly used for imports and investment, but mostly channeled towards
accumulation of foreign reserves, amortization of past debt, or transfer abroad (for travel,
education, or capital flight). However, the impact on the economic outlook was sufficiently
positive to encourage substantial investment at the time, as we have seen earlier (Figure 5). The
government had also started a limited form of ISI after the expiration of past foreign treaties,
such as the Turkmenchay treaty imposed by the Russian government, which restricted the use of
18
trade barriers by Iran. At the same time, the government was actively investing in infrastructure,
particularly roads, to facilitate trade and increase access to imports. The advent of WWII ended
that process and led to sharp decreases in trade, investment, and output.
The post-war recovery in trade, especially the rising oil revenues, helped imports to grow
and to facilitate investment and production. However, a large trade surplus with similar uses as
in the mid-1930s was maintained. Even during the British oil embargo of 1952-53 when all
foreign revenues were originated from non-oil exports, trade remained in surplus. Interestingly,
while the government encouraged non-oil exports during the embargo, it was only concerned
about weathering the temporary foreign exchange shortages and did not pursue it as a long term
strategy.
In the aftermath of the 1953 coup, oil revenues recovered and imports sharply increased
to the extent that Iran developed a large trade deficit and started borrowing from abroad. The
government began to develop a more coherent growth strategy based on a version of ISI that
took advantage of oil revenues and ensured the benefits of engagement in the global economy
through imports of capital and intermediate goods along with infrastructure and public service
development. The only foreign-exchange earning activity that the government actively promoted
was tourism, which was a relatively untapped resource and was becoming increasingly profitable
due to the declining travel costs and rising incomes around the world (Figure 12). The prospects
of rising foreign exchange from oil and tourism suggested that new industries could continually
be established to maintain the pace of growth. The revenues also enabled the government to rely
more on less distortionary subsidies (e.g., through cheap credit) rather than trade barriers to
address institutional and domestic market failures or deal with political considerations. The
average tariff protection declined from 71.2 percent in 1953 to 33 percent in 1956 and 27.7
percent in 1960 (Karshenas, 1990: Table 5.3). As a result of all this, as oil revenues increased,
non-oil exports diminished (Figure 6) and GDP growth came largely from services and ISI
industries, which were partly established and run by the government itself. This process led to
rapid relative decline of agriculture and its replacement by new industries and services as sources
of production and employment (Figure 8).32
32 For a detailed discussion of this process, see Karshenas (1990).
19
[f]fig 12 here[/f]
Import substitution industrialization strategy. Growth under Iran's version of ISI process
accelerated after 1963 when a package of economic and social reforms, including a major land
reform, gave the government more effective access to rural areas and facilitated the development
labor and capital markets. The dismantling of the landed oligarchy also enabled the Shah to
concentrate power in his own hands and enhance the cohesiveness of his regime, at least for a
decade. Stability and cohesiveness of the regime, expanding world economy, and steadily rising
oil revenues during the 1960s made the ISI policy a phenomenal success in terms of GDP growth
and structural change. The inherent inefficiency of the ISI as a sustained development strategy
was largely masked by the rapidly rising oil revenues which allowed easy funding of government
subsidies, particularly in the form of cheap credit for investors and producers.
The oil price increases of 1973 and 1974 caused a major change in Iran's ISI strategy.
Foreign exchange became plentiful and it became increasingly costly to use protection for the
promotion of many existing industries. Besides, the oil revenues and domestic resources could be
used to implement more advanced production processes rather than continuing with the mostly
light industries established in the past under ISI. To achieve this, the government acted as the
leading entrepreneur and boosted investment in new industries with the total investment reaching
over 60 percent of non-oil GDP (Figure 4). At the same time, protection for the existing
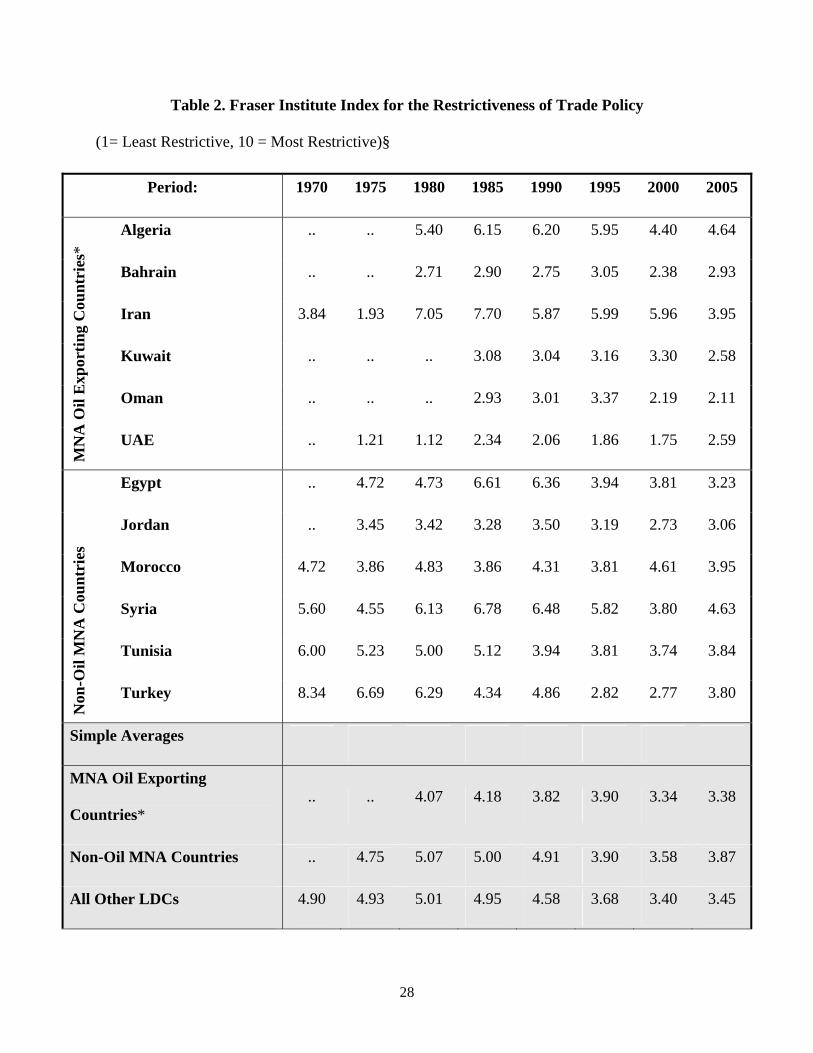
industries lost its logic and was significantly reduced. This is reflected in Fraser Institute index of
trade policy shown Table 2, which shows that between 1970 and 1975, Iran's trade policy had
become substantially more liberal while most other countries were maintaining high protection
rates. Indeed, the average protection rate in the developing world was still on the rise at that time.
A similar observation can be made using Figure 13 that shows the trade shares as an indicator of
openness.33 The graph shows that the share of trade in Iran's GDP during the 1970s was far
higher than that of typical developing country, which implies that the marginal imports in Iran
must have posed competition for at least part of domestic production. Yet another indicator is the
rise in the cost of domestic production relative to imports (the real exchange rate), which jumped
by more than 50 percent during the 1972-1976 period (Figure 14). In any case, the consequence
33 It is well-known that trade as share of GDP depends on country size and many other factors. However, controlling for those factors does not change the results of our observations here. See Esfahani and Squire (2007).
20
of the post-1973 policies was that the existing ISI industries as well as agriculture lost their
competitiveness over domestic resources to the new investment activities promoted by the
government. A clear indicator of this process is the decline of manufacturing as share of non-oil
GDP as early as 1975 (Figure 8).
[f]fig 13 here[/f]
[f]fig 14 here[/f]
While Iran's non-oil exports declined in the 1950s and 1970s and remained relatively
small in the 1960s, their characteristics are interesting indicators of some of the developments in
Iran's economy. First, as Figure 15 shows, the weight of Iranian non-oil exports had been rising
after WWII after moving around 0.2 million ton during 1925-1939 and sharply declining during
the war. Meanwhile, the value of each ton being exported had been generally on the rise until
1953. After 1953, this trend reversed and the unit value declined as the tonnage increased until
1970. Meanwhile, the degree of concentration of non-oil exports decreased, suggesting that a
greater variety of goods being exported (Figure 16). These phenomena were largely due to the
development industries that started exporting to other developing countries and to the former
Soviet Union (Figure 17). The decline in the relative size of non-oil exports came in the form of
reductions in higher value traditional products such as Persian rugs to the developed countries.
Interestingly, at the same time, the origin of Iran's imports was shifting away from developing
countries, North America and Europe towards Japan, Australia, New Zealand and the former
Soviet Union (Figure 18).
[f]fig 15 here[/f]
[f]fig 16 here[/f]
[f]fig 17 here[/f]
[f]fig 18 here[/f]
The above trends underwent important changes during the 1970s, following the large oil
price increases. Iranian non-oil exports seem to have returned to their earlier pattern: Traditional
high value items with less bulk and less diversity sold increasingly in developed countries.
Origin of imports also shifted towards the latter group of countries. The sharp rise in the real
exchange rate seems to have made it too costly to export non-oil exports except the ones in
21
which Iran traditionally had a strong comparative advantage. Curiously, similar patterns emerged
in the early years after the Revolution, when the real exchange rate depreciated quite a bit, the
main exception being that trade was diverted away from the United States as well. This may
seem puzzling. However, an important difference between the conditions before and after the
Revolution helps explain the situation: The real depreciation of the rial after the Revolution was
due to sharply higher costs of business and trade in Iran, which made it difficult to produce and
export even with a depreciated real exchange rate, except for very high unit value traditional
products. The war with Iraq, conversion of some public and private industrial enterprises into
production units for the military, and extreme government controls over the economy had not
only reduced business incentives, but also created shortage of raw materials for production.34
Indeed, in the early 1980s, non-oil goods exports had dropped to well below one-percent Iran's
non-oil GDP (Figure 12).
Post-Revolution trade and foreign exchange policies. In the aftermath of the Revolution,
especially during the war with Iraq, Iran's exports of oil and non-oil products were reduced
substantially and the government responded by increasing the level of protectionism to new
heights (Figure 13 and Table 2). This is in a sense a natural political economy response because
in the absence of capacity of import, in the calculus of protectionism the weight of domestic
producers rises vis-à-vis that of domestic consumers.35 After the end of the war, oil exports rose
again and protectionism was reduced. As the infrastructure was rebuilt and some market oriented
policies were implemented, the economy recovered and the cost of trade declined. Nevertheless,
the real value of the rial was allowed to remain low for private trade. As a result, non-oil exports
expanded quickly. Initially the focus of those exports was developed countries. But, that situation
changed after 1991 and trade shifted towards other developing countries, especially the
neighboring ones (Figure 17). This was associated with increasing diversification of trade
(Figure 16) with more bulky products and lower unit values (Figure 15).
34 Jahangir Amuzegar, Iran's Economy under the Islamic Republic, Rev Sub Edition (I. B. Tauris, London, 1997): 150; Vahid Nowshirvani, “Economy—Under the Islamic Republic,” Encyclopaedia Iranica Website, www.iranica.com/newsite/articles/v8f1/v8f1133x.html.
35 Hadi Salehi Esfahani and Lyn Squire, “Explaining Trade Policy in the Middle East and North Africa,” The Quarterly Review of Economics and Finance, 46.5 (2007): 660-684.
22
The balance of payments crisis of 1993-1994 along with the decline in oil revenues
brought back many controls and fueled protectionism again. Foreign exchange controls were
tightened and cost of trade rose again. Naturally, non-oil exports dropped and did not recover
until after 2002 when oil revenues started a fast upward trend, market controls were relaxed, and
trade became relatively more liberal. Interestingly, in this recent episode, non-oil exports seem to
be highly diversified both in terms of product composition and destination. Traditional exports—
carpets and agricultural products—are now a minority of non-oil exports and have been replaced
by processed and manufactured products (Amid and Hadjikhani, 2005: 54-55). One factor that
may be common to many manufactured exports of Iran is energy intensity, which entails
comparative advantage because of the highly subsidized price of energy in the country.
However, other factors are also involved. Neighboring countries have become important and
rapidly expanding export markets where cultural affinity and short distances between producer
and markets important assets. This is particularly the case, for example, in Iran's economic
relations with Afghanistan and Iraq. Because of the relatively low cost of such trade, unit values
of non-oil exports have remained low, though they have been edging upward lately. The break
up of the Soviet Union, the U.S. invasions of Afghanistan and Iraq, the oil boom, and economic
growth in neighboring countries generally seems to have brought globalization to Iran's door.
Iran has started taking advantage of that opportunity, but uncertainties still loom large because
the country's oil and non-oil exports continue to depend largely on oil prices. There is also the
question of sanctions being increasingly tightened, a subject to which we will turn in the next
section.
While the dependence on oil has been a fact of life for Iran's economy over the past few
decades (Figure 19), there are other factors that may help the country change its role in the world
economy during the 21st century. Iran's labor force is becoming increasingly more educated and,
because of the rapid fertility decline since the mid 1980s, will enjoy an unusually high proportion
of working age population in the next few decades. Meanwhile, the country has developed a
reasonably good infrastructure as well as institutions that can provide relatively effective support
for markets and social services. These factors should enable the country to find new niches in the
world economy other than oil exports and to deal with the possible risks of deeper integration in
global markets. There remains to be seen whether the government will possess the necessary
policy entrepreneurship to identify such opportunities and take advantage of them. One
23
important factor in this process is the economic sanctions against Iran over her alleged military
nuclear program and the manner that it is resolved.
U.S. Trade Sanctions and Iranian Response
The first formal economic sanctions by the United States against Iran were ordered by
Carter administration in April 1980 in the aftermath of Hostage crisis and have been in effect, in
one form or another, ever since. During 1989-91, the early parts of the Bush (senior)
administration, U.S. trade restrictions on Iran were slightly relaxed. In 1993, the so-called “dual
containment” policy was initiated by the Clinton administration focusing on the twin threats of
Iraq and Iran. This was followed by Iran-Libya Sanctions Acts (ILSA, 1996-2001) aimed
primarily at halting the development of Iran's oil and gas industries and placed a series of trade
and financial sanctions on foreign investment in Iran's energy sector. The provisions of ILSA
extended to non-U.S. companies and constituted a major extraterritorial application of the U.S.
law which was duly opposed by the European Union (EU). The result was a compromise by the
Clinton Administration and led to waiving of ISLA sanctions on the $2 billion contract signed in
September 1997 by Total of France and its minority partners, Gazprom of Russia and Petronas of
Malaysia. Similar waivers were granted to other EU firms for similar projects. In return EU
pledged to increase cooperation with the U.S. on non-proliferation and counter-terrorism.
The trade sanctions against Iran were eased somewhat during 1999 and 2000 in response
to the more moderate policies initiated by President Khatami, but the ILSA was nevertheless
renewed in August 2001 for a further five years to August 5, 2006, some of its provisions
tightened, and changed the name of ISLA to the Iran Sanctions Act (ISA) to reflect the fact that
Libya was no longer perceived as a treat to the U.S. interests. With U.S. heightened concern
over Iran's nuclear program, her alleged involvement in Iraq, and her continued support of
Hizbollah and Hamas, ISA was further tightened and extended to the end of 2011 as a part of the
“Iran Freedom and Support Act.”
Iran has responded to U.S. sanctions largely in a predictable manner. Imports and non-oil
exports have become much more geographically diversified. The share of G7 countries in Iran's
imports has fallen substantially with the United Arab Emirates (UAE) and China filling the
shortfalls created from U.S. sanctions. According to latest trade statistics UAE now accounts for
around 22.3 percent of Iran's total imports followed by Germany (12.5 percent) and China (6.9

24
percent). It is clear that a large part of the imports from UAE is due to re-directions of trade
from the U.S. and elsewhere to avoid sanctions and do not originate in UAE.
Similar shifts can also be seen in the geographical composition of Iran's oil and non-oil
exports with Asian economies replacing the U.S. and Western Europe as the main destinations of
Iran's exports. In 2005-06 Asian economies accounted for 56.4 percent of Iran's oil exports,
whilst the share of Western Europe was only 25.8 percent. In the same year UAE (17.9 percent),
Iraq (10.5 percent), India (6.9 percent) and Japan (5.0 percent) were the most important
destinations for Iran's non-oil exports, with Asian accounting for 72.8 percent of Iran's non-oil
exports as compared to 22.1 percent for Europe.
Iran has also tried to facilitate trade with her neighboring countries by establishment of
three free trade zones in the Persian Gulf, has applied to join the World Trade Organization in
1995-96 (so far vetoed six times by the U.S.), and in 2002 has signed up to New York
Convention for international agreement on enforcing arbitration awards in 2002, and has
approved a new Law for Protection and Promotion of Foreign Investment (which is not that
different from the 1955 pre-revolution version).
Whether U.S. sanctions against Iran have been effective is debatable. According to
Kenneth Katzman, the amount of foreign investment (committed but not necessarily fully spent)
in Iran's energy sector over the post 1999 period amounted to $80 billion, with an additional
amount of $46 billion that are pending agreements.36 These investments were by major oil
companies in Europe (ENI of Italy, Royal Dutch Shell, Statoil of Norway) as well as by Sinopec
of China, ONGC of India, and LG of South Korea. Most of the investment projects that were
signed up before 2004 are either completed and are producing oil and gas or are in the process of
being completed. These figures suggest that at best the U.S. sanctions can be viewed as having
somewhat slowed down the pace of foreign investment in Iran's energy sector rather than
bringing it into a halt as intended. Hossein G. Askari et al. also arrive at a similar conclusion.37
36 Kenneth Katzman, “The Iran Sanctions Act (ISA),” CRS Report for Congress (2007).
37 Hossein G. Askari, John Forrer, Hildy Teegen, and Jiawen Yang, Case Studies of U.S. Economic Sanctions, the Chinese, Cuban, and Iranian Experience (Westport, CT: Praeger, 2003).
25
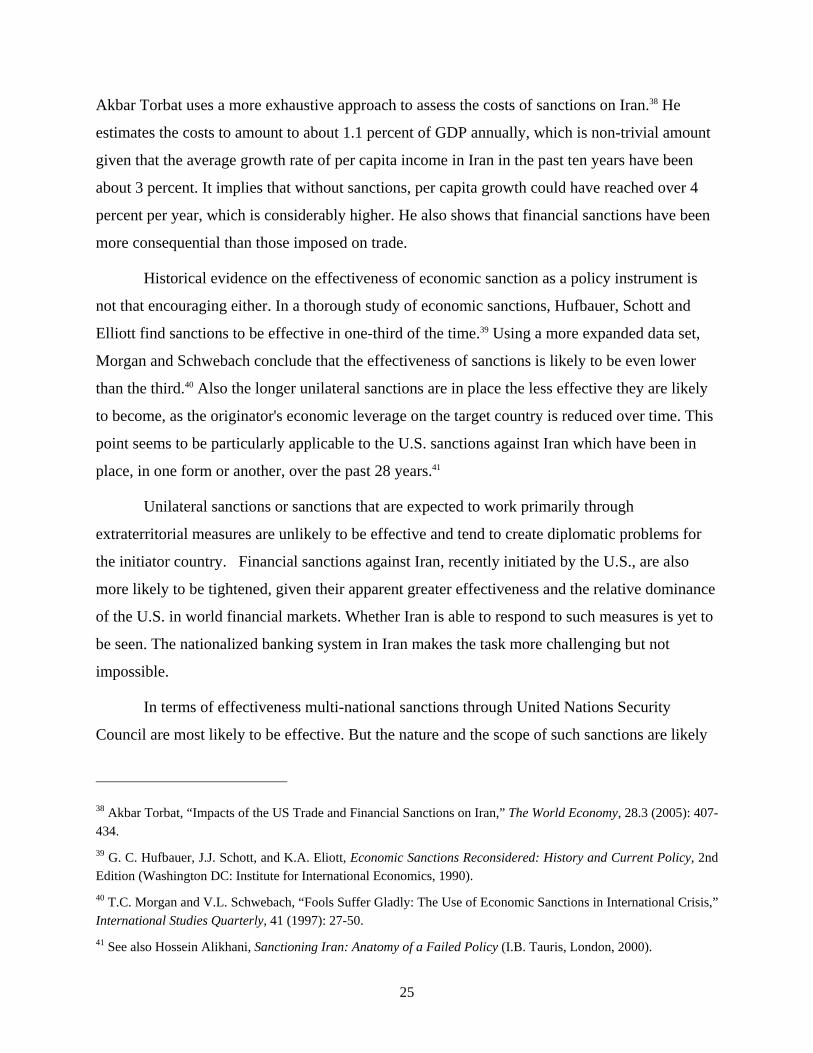
Akbar Torbat uses a more exhaustive approach to assess the costs of sanctions on Iran.38 He
estimates the costs to amount to about 1.1 percent of GDP annually, which is non-trivial amount
given that the average growth rate of per capita income in Iran in the past ten years have been
about 3 percent. It implies that without sanctions, per capita growth could have reached over 4
percent per year, which is considerably higher. He also shows that financial sanctions have been
more consequential than those imposed on trade.
Historical evidence on the effectiveness of economic sanction as a policy instrument is
not that encouraging either. In a thorough study of economic sanctions, Hufbauer, Schott and
Elliott find sanctions to be effective in one-third of the time.39 Using a more expanded data set,
Morgan and Schwebach conclude that the effectiveness of sanctions is likely to be even lower
than the third.40 Also the longer unilateral sanctions are in place the less effective they are likely
to become, as the originator's economic leverage on the target country is reduced over time. This
point seems to be particularly applicable to the U.S. sanctions against Iran which have been in
place, in one form or another, over the past 28 years.41
Unilateral sanctions or sanctions that are expected to work primarily through
extraterritorial measures are unlikely to be effective and tend to create diplomatic problems for
the initiator country. Financial sanctions against Iran, recently initiated by the U.S., are also
more likely to be tightened, given their apparent greater effectiveness and the relative dominance
of the U.S. in world financial markets. Whether Iran is able to respond to such measures is yet to
be seen. The nationalized banking system in Iran makes the task more challenging but not
impossible.
In terms of effectiveness multi-national sanctions through United Nations Security
Council are most likely to be effective. But the nature and the scope of such sanctions are likely
38 Akbar Torbat, “Impacts of the US Trade and Financial Sanctions on Iran,” The World Economy, 28.3 (2005): 407-434.
39 G. C. Hufbauer, J.J. Schott, and K.A. Eliott, Economic Sanctions Reconsidered: History and Current Policy, 2nd Edition (Washington DC: Institute for International Economics, 1990).
40 T.C. Morgan and V.L. Schwebach, “Fools Suffer Gladly: The Use of Economic Sanctions in International Crisis,” International Studies Quarterly, 41 (1997): 27-50.
41 See also Hossein Alikhani, Sanctioning Iran: Anatomy of a Failed Policy (I.B. Tauris, London, 2000).
26
to be limited as they need to be agreed by all permanent members of the Security Council, in
particular by Russia and China who have important trade links with Iran. So far two Security
Council Resolutions (number 1737 in December 2006 and number 1747 in March 2007) have
been passed aimed at restricting Iran’s development of sensitive technologies in support of its
nuclear and missiles programs. The scope of these sanctions is currently limited to individuals
and entities that are engaged in Iran’s nuclear activities or the development of the nuclear
weapon delivery systems, and to the further development of Iran’s military capabilities. The
March 2007 resolution also calls upon all States and financial institutions not to provide new
grants, loans or financial assistant to the Iranian government. These measures if extended and
maintained are likely to adversely affect the performance of the Iranian economy. But it is more
doubtful if these sanctions on their own will be effective in achieving their aim.
Conclusion
In the course of 20th century, Iran's economy transformed from a relatively simple
agrarian system into a complex and industrialized one with a much higher level of income. In
that process, education, health, social insurance, and infrastructure vastly improved. The country
also developed a host of economic institutions to support the economic process and allow capital,
labor, and product markets to grow in terms of size, scope, and depth. A great part of this
transformation came about as a result of Iran's ability to engage in global markets, particularly
through imports of knowledge, technology, and capital and intermediate goods. Oil played a
major role in facilitating those imports, but also ruled out much of what Iran might have learned
by getting involved more intensively and extensively in production for exports. Instead, the
country enjoyed, at least at times and given other factors, a higher standard of living than might
have otherwise been possible. Industry, especially manufacturing, never came to dominate the
economy. However, global forces that enabled Iran to earn substantial oil revenues led to the
growth of the service sector and, thereby, contributed to the country's growing strengths in terms
of human capital, infrastructure, and the like. At the same time, Iran's neighbors are providing
new opportunities for trade and investment. The key ingredient that can turn these strengths and
opportunities into a formula for sustainable and rapid growth is effective policy entrepreneurship
on the part of the government, and a closer integration of the Iranian economy in the global
markets.

27
Table 1. Iran's Key Economic Indicators, 1900 and 2006
Indicator 1900
(Rough Estimates) 2006
Population (millions) 8.6 70.5
Rank in the World 20 18
Out of …. 228 211
Per Capita Income (Constant 2000 PPP $) 1,000 $7400
Rank in the World 44 78
Out of (number of countries for
which data is available) …. 68 187
Urbanization Rate 27% 64%
Life Expectancy (Total) <30? 71
Rank in the World ? 114
Literacy Rate (Population 15+) <5? 83%
Share of Agriculture in GDP 65% 15%
Trade-GDP Ratio 35% 68%
28
Table 2. Fraser Institute Index for the Restrictiveness of Trade Policy
(1= Least Restrictive, 10 = Most Restrictive)§
Period: 1970 1975 1980 1985 1990 1995 2000 2005
Algeria .. .. 5.40 6.15 6.20 5.95 4.40 4.64
Bahrain .. .. 2.71 2.90 2.75 3.05 2.38 2.93
Iran 3.84 1.93 7.05 7.70 5.87 5.99 5.96 3.95
Kuwait .. .. .. 3.08 3.04 3.16 3.30 2.58
Oman .. .. .. 2.93 3.01 3.37 2.19 2.11
MN
A O
il E
xpor
tin
g C
oun
trie
s*
UAE .. 1.21 1.12 2.34 2.06 1.86 1.75 2.59
Egypt .. 4.72 4.73 6.61 6.36 3.94 3.81 3.23
Jordan .. 3.45 3.42 3.28 3.50 3.19 2.73 3.06
Morocco 4.72 3.86 4.83 3.86 4.31 3.81 4.61 3.95
Syria 5.60 4.55 6.13 6.78 6.48 5.82 3.80 4.63
Tunisia 6.00 5.23 5.00 5.12 3.94 3.81 3.74 3.84
Non
-Oil
MN
A C
oun
trie
s
Turkey 8.34 6.69 6.29 4.34 4.86 2.82 2.77 3.80
Simple Averages
MNA Oil Exporting
Countries* .. .. 4.07 4.18 3.82 3.90 3.34 3.38
Non-Oil MNA Countries .. 4.75 5.07 5.00 4.91 3.90 3.58 3.87
All Other LDCs 4.90 4.93 5.01 4.95 4.58 3.68 3.40 3.45

29
Weighted Averages‡
MNA Oil Exporting
Countries** .. .. 4.69 5.56 4.63 4.72 4.28 3.62
Non-Oil MNA Countries† .. 5.82 5.64 4.86 5.06 3.34 3.30 3.76
All Other LDCs 3.46 5.08 5.34 5.64 4.35 3.85 3.09 3.64
§ For comparability purposes and to make the index rise with restrictiveness, the dependent
variable is defined as 10 minus the index reported by the Fraser Institute.
* Countries with significant share of oil in their exports.
‡ Weighted by GDP in terms of 1995 US dollars. Only countries with complete data are
included.
** Algeria, Bahrain, Iran, Kuwait, Oman, UAE.
† Egypt, Jordan, Morocco, Syria, Tunisia, Turkey.
Sources: Gwartney, James, Robert Lawson, and Neil Emerick. 2007. Economic Freedom of the
World: 2007 Annual Report, Vancouver, B.C.: Fraser Institute.
30
Figure 1. Iran's Economic Growth in Comparative Perspective
6.0
6.5
7.0
7.5
8.0
8.5
9.0
9.5
10.0
10.5
1900
1905
1910
1915
1920
1925
1930
1935
1940
1945
1950
1955
1960
1965
1970
1975
1980
1985
1990
1995
2000
2005
2010
Year
Log
of
Per
Cap
ita
GD
P in
Con
stan
t PP
P 2
000
Inte
rnat
iona
l Dol
lars
12 Western European Countries
Iran
Turkey
Reconstruction/ReformWWII/Invasion
Coup/Autocracy Revolution and War
Developing Country Average
$400
$665
$1100
$1800
$2900
$4900
$8100
$13400
$22000
$36300
Sources: Angus Maddison, World Population, GDP and Per Capita GDP (2007); Central Bank of
Iran Website; World Bank, World Development Indicators 2007; Abolfazl Khavarinejad, The
Estimation of Gross Domestic Product of Iran (1315-1337) (Monetary and Banking Research
Academy, Central Bank of the Islamic Republic of Iran, 2003).
31
Figure 2. Population of Iran, Total and Urban
14.0
14.5
15.0
15.5
16.0
16.5
17.0
17.5
18.0
18.5
1870 1880 1890 1900 1910 1920 1930 1940 1950 1960 1970 1980 1990 2000 2010
Year
Log
of
Pop
ulat
ion
5.5 millions
9 millions
15 millions
24 millions
40 millions
66 millions
108 millions
1.2 millions
2 millions
3.3 millions
Urban Population
Total Population
Source: Statistical Center of Iran
32
Figure 3. Real Per Capita Oil Exports, Government Receipts from Oil, and Non-Oil GDP
0
500
1000
1500
2000
2500
1900 1910 1920 1930 1940 1950 1960 1970 1980 1990 2000 2010
Year
Con
stan
t P
PP
200
0 U
S D
olla
rs
0
1000
2000
3000
4000
5000
Con
stan
t P
PP
200
0 U
S D
olla
rs
Revol./ War
Reconstruction/Reform
WWII/Invasion
Coup/Autocra
Real Non-Oil GDP per Capita
Real per Capita Government
Receipts from Oil Exports
Real Oil Exports per Capita
Sources: Central Bank of Iran Website; Khavarinejad, The Estimation of Gross Domestic
Product of Iran; Julian Bharier, Economic development in Iran, 1900-1970 (Oxford, UK: Oxford
University Press, 1971); Jahangir Amuzegar and M. Ali Fekrat, Iran: Economic Development
Under Dualistic Conditions (Chicago: University of Chicago Press, 1971).

33
Figure 4. Investment as Percent of Non-Oil GDP in Iran
0
10
20
30
40
50
60
70
1935 1940 1945 1950 1955 1960 1965 1970 1975 1980 1985 1990 1995 2000 2005 2010Year
Per
cen
t of
Non
-Oil
GD
P
Reconstruction/Reform
Total Investment
Public Investment
Coup/Autocracy Revolution/Wa
Private Investment
WWII/Invasion
Sources: Central Bank of Iran Website; Khavarinejad, The Estimation of Gross Domestic
Product of Iran.

34
Figure 5. Real Per Capita GDP Growth and Inflation in Iran
-30%
-10%
10%
30%
50%
70%
90%
1930
1935
1940
1945
1950
1955
1960
1965
1970
1975
1980
1985
1990
1995
2000
2005
2010
Year
Per
cen
t of
Cu
rren
t P
rice
GD
P
Revolution and War
Reconstruction/Reform
Consumer Price Inflation
WWII/Invasion Coup/Autocracy
Real per Capita GDP
G th
0%
Sources: Central Bank of Iran Website; Khavarinejad, The Estimation of Gross Domestic
Product of Iran; Bharier, Economic development in Iran.
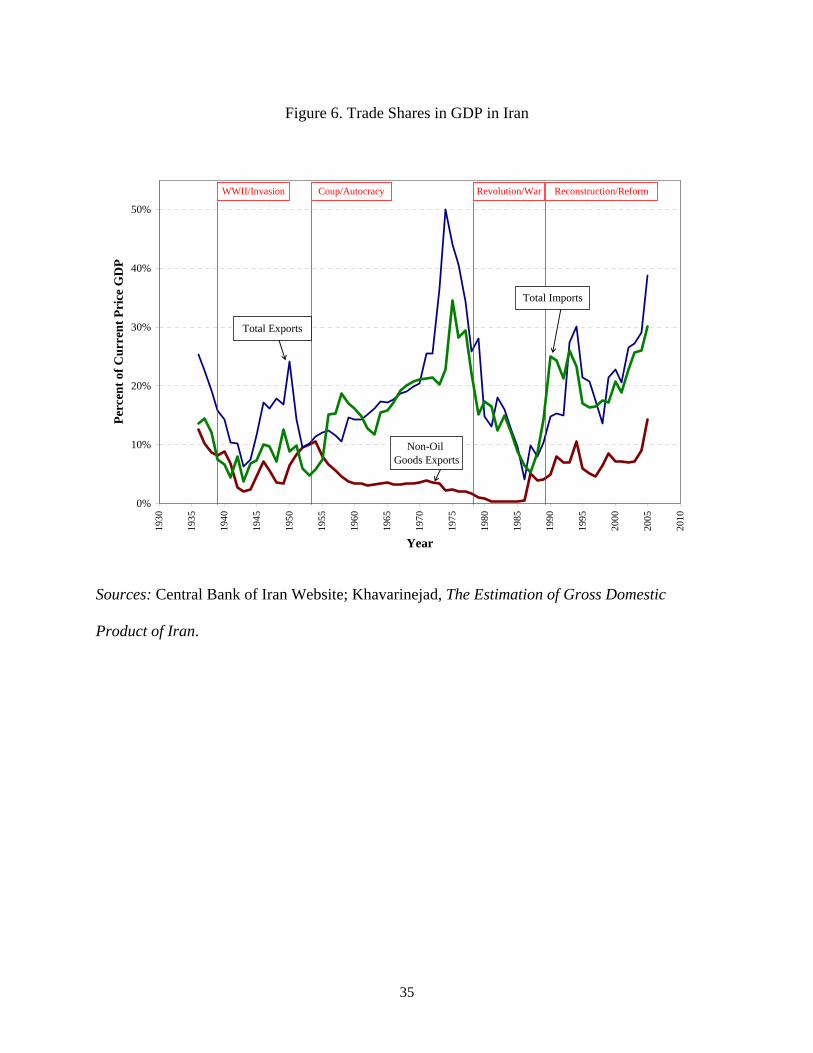
35
Figure 6. Trade Shares in GDP in Iran
0%
10%
20%
30%
40%
50%
1930
1935
1940
1945
1950
1955
1960
1965
1970
1975
1980
1985
1990
1995
2000
2005
2010
Year
Per
cen
t of
Cu
rren
t P
rice
GD
P
Revolution/War Reconstruction/Reform
Total Imports
Non-Oil Goods Exports
WWII/Invasion Coup/Autocracy
Total Exports
Sources: Central Bank of Iran Website; Khavarinejad, The Estimation of Gross Domestic
Product of Iran.
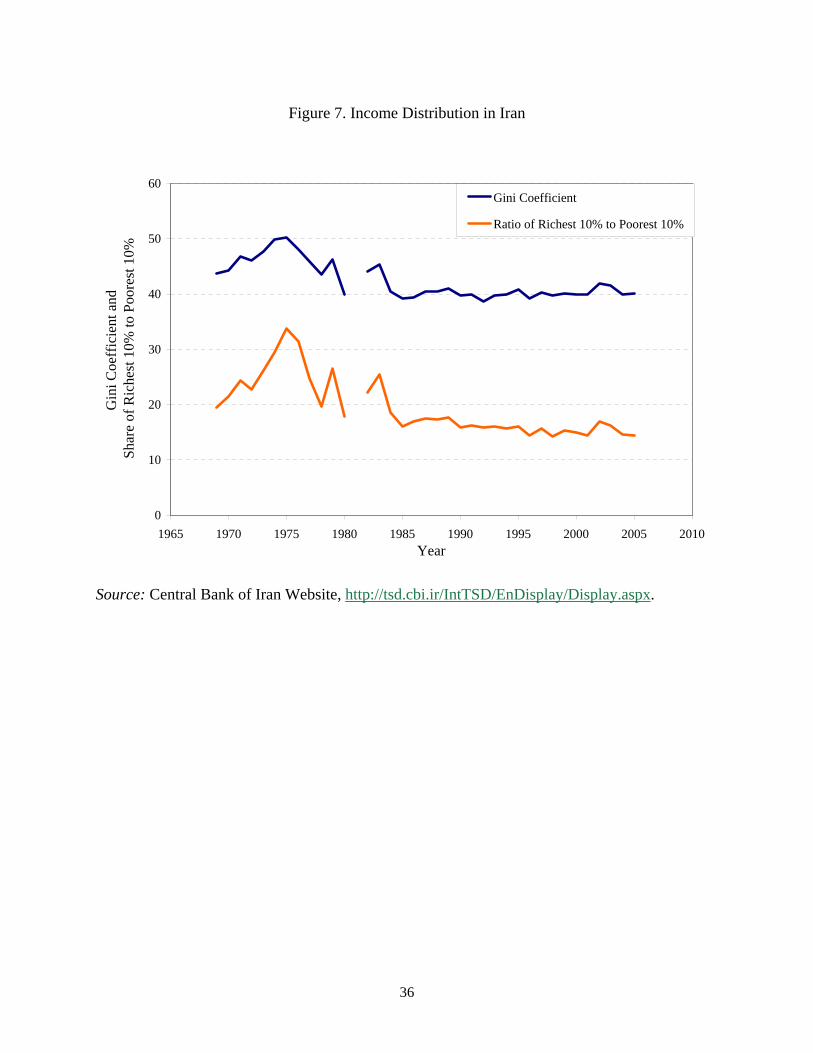
36
Figure 7. Income Distribution in Iran
0
10
20
30
40
50
60
1965 1970 1975 1980 1985 1990 1995 2000 2005 2010Year
Gin
i Coe
ffic
ient
and
S
hare
of
Ric
hest
10%
to P
oore
st 1
0%
Gini Coefficient
Ratio of Richest 10% to Poorest 10%
Source: Central Bank of Iran Website, http://tsd.cbi.ir/IntTSD/EnDisplay/Display.aspx.
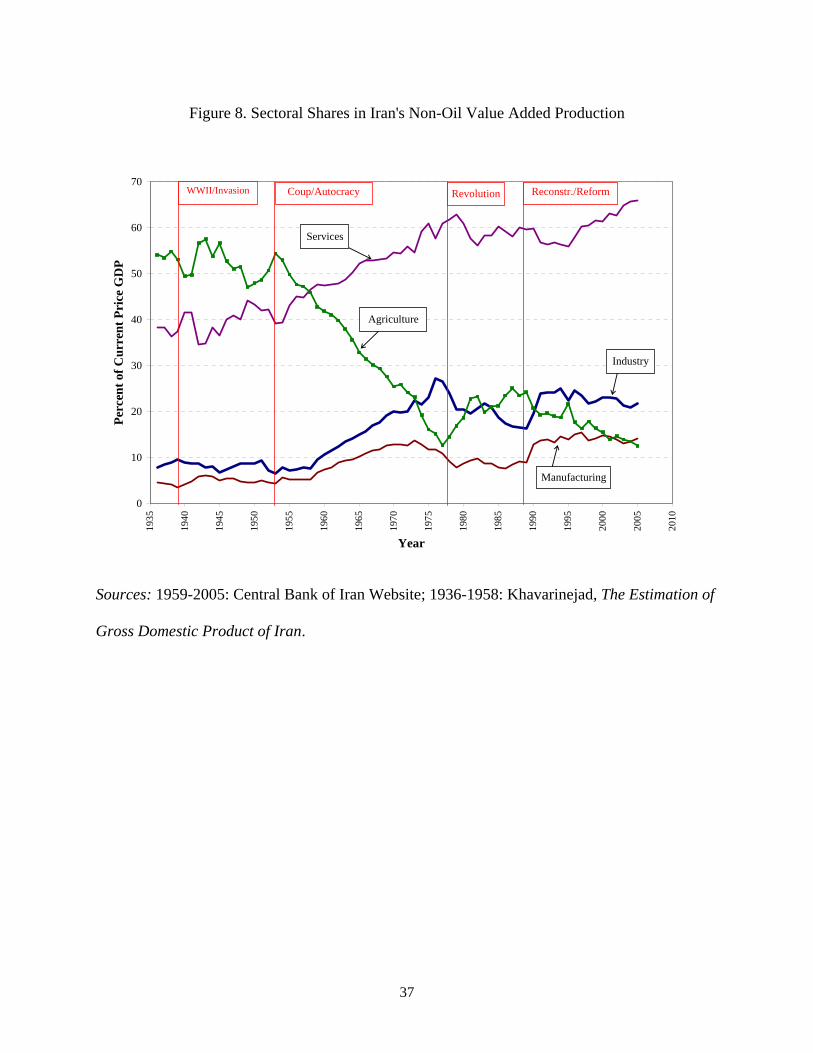
37
Figure 8. Sectoral Shares in Iran's Non-Oil Value Added Production
0
10
20
30
40
50
60
70
1935
1940
1945
1950
1955
1960
1965
1970
1975
1980
1985
1990
1995
2000
2005
2010
Year
Per
cen
t of
Cu
rren
t P
rice
GD
P
Manufacturing
Revolution Reconstr./Reform
Agriculture
Industry
Coup/Autocracy
Services
WWII/Invasion
Sources: 1959-2005: Central Bank of Iran Website; 1936-1958: Khavarinejad, The Estimation of
Gross Domestic Product of Iran.

38
Figure 9. Infrastructure Development in Iran
1.0
10.0
100.0
1000.0
1950
1955
1960
1965
1970
1975
1980
1985
1990
1995
2000
2005
2010
Year
Log
Sca
le
Reconstruction and Reform
Telephone Mainlines Per
1000 Population
Coup/Autocracy Revolution/War
Electricity Generation Capacity, KW per
Capita per Year
Paved Roads, Km per 100,000
Population
Sources: Canning (1998); Bharier (1970); World Bank, World Development Indicators 2007.
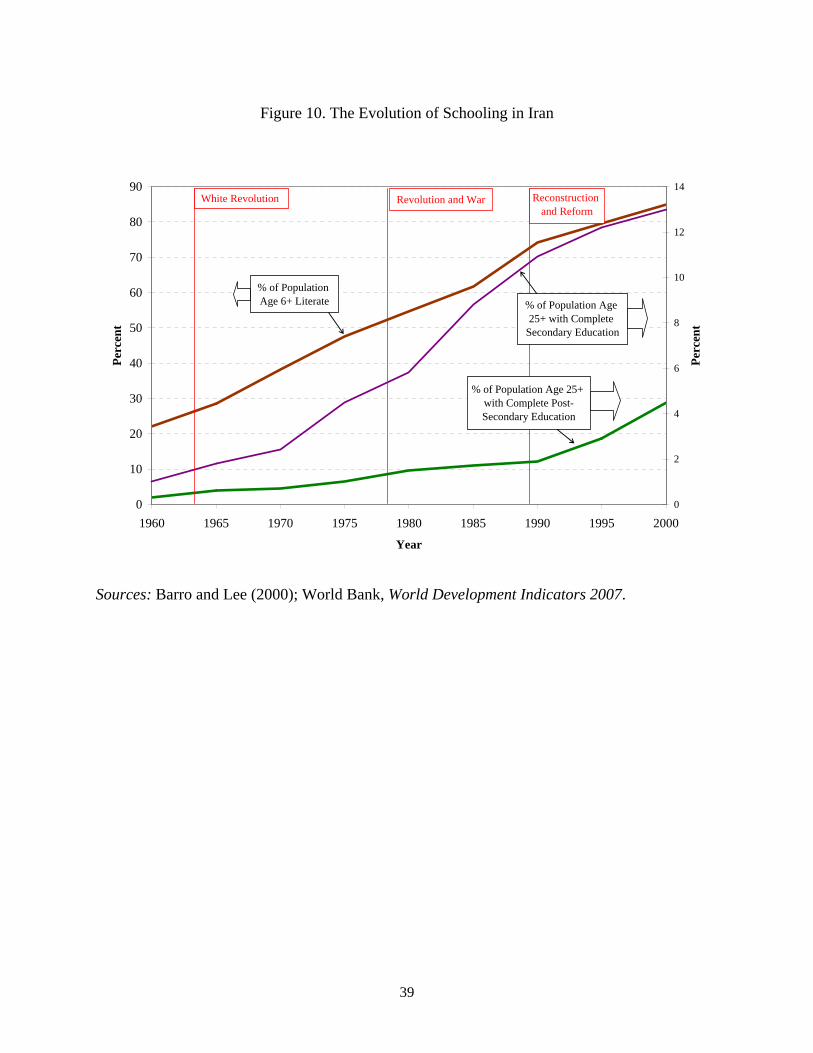
39
Figure 10. The Evolution of Schooling in Iran
0
10
20
30
40
50
60
70
80
90
1960 1965 1970 1975 1980 1985 1990 1995 2000
Year
Per
cen
t
0
2
4
6
8
10
12
14
Per
cen
t
Revolution and War Reconstruction and Reform
% of Population Age 6+ Literate
% of Population Age 25+ with Complete Post-Secondary Education
% of Population Age 25+ with Complete
Secondary Education
White Revolution
Sources: Barro and Lee (2000); World Bank, World Development Indicators 2007.
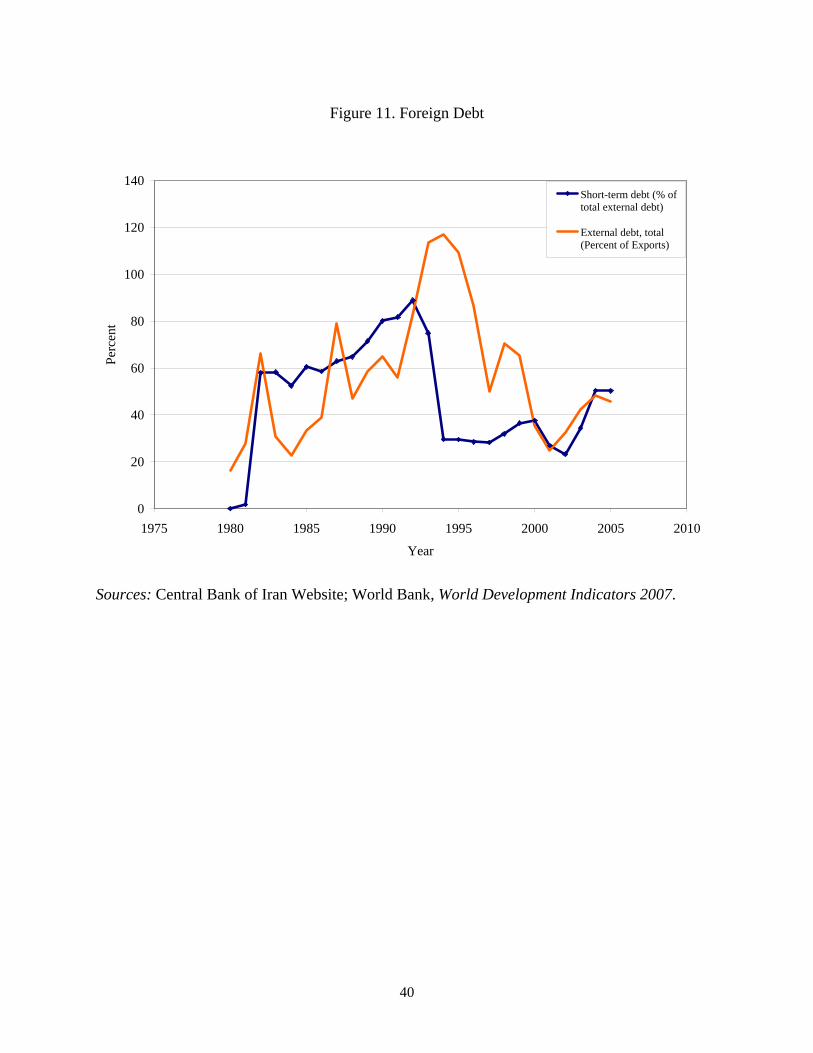
40
Figure 11. Foreign Debt
0
20
40
60
80
100
120
140
1975 1980 1985 1990 1995 2000 2005 2010
Year
Per
cent
Short-term debt (% oftotal external debt)
External debt, total(Percent of Exports)
Sources: Central Bank of Iran Website; World Bank, World Development Indicators 2007.
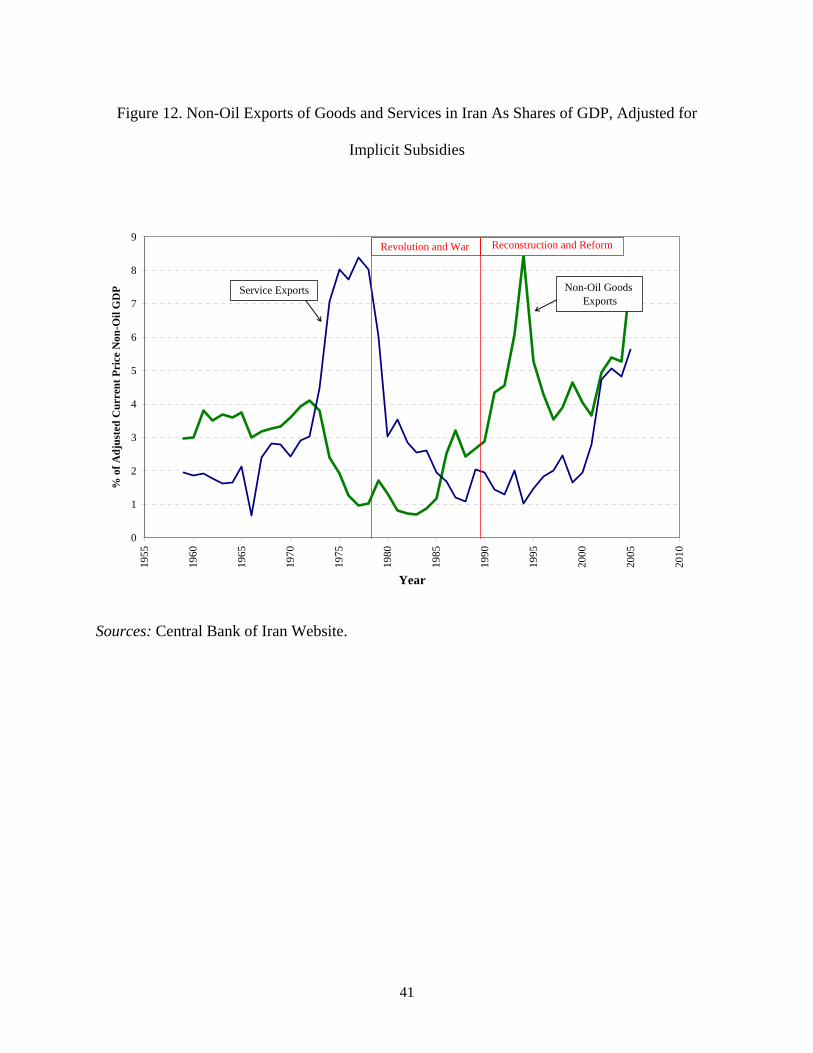
41
Figure 12. Non-Oil Exports of Goods and Services in Iran As Shares of GDP, Adjusted for
Implicit Subsidies
0
1
2
3
4
5
6
7
8
9
1955
1960
1965
1970
1975
1980
1985
1990
1995
2000
2005
2010
Year
% o
f A
dju
sted
Cu
rren
t P
rice
Non
-Oil
GD
P
Revolution and War Reconstruction and Reform
Non-Oil Goods Exports
Service Exports
Sources: Central Bank of Iran Website.
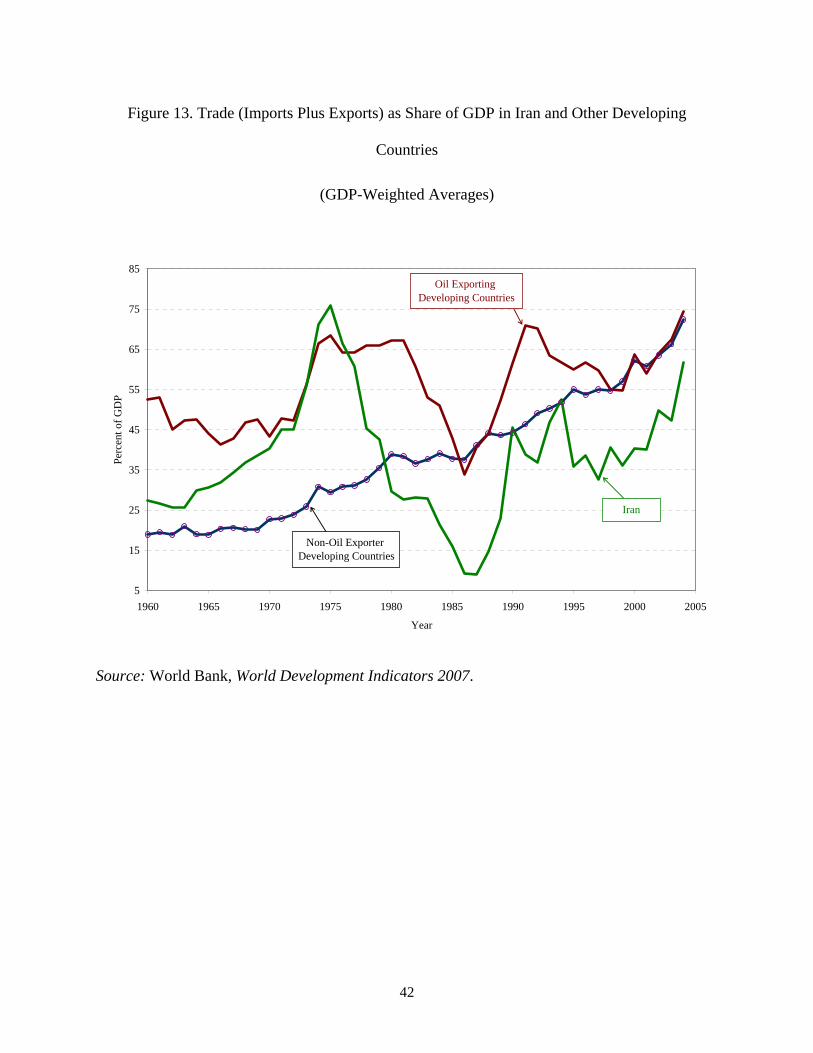
42
Figure 13. Trade (Imports Plus Exports) as Share of GDP in Iran and Other Developing
Countries
(GDP-Weighted Averages)
5
15
25
35
45
55
65
75
85
1960 1965 1970 1975 1980 1985 1990 1995 2000 2005
Year
Per
cent
of
GD
P
Non-Oil Exporter Developing Countries
Oil Exporting Developing Countries
Iran
Source: World Bank, World Development Indicators 2007.
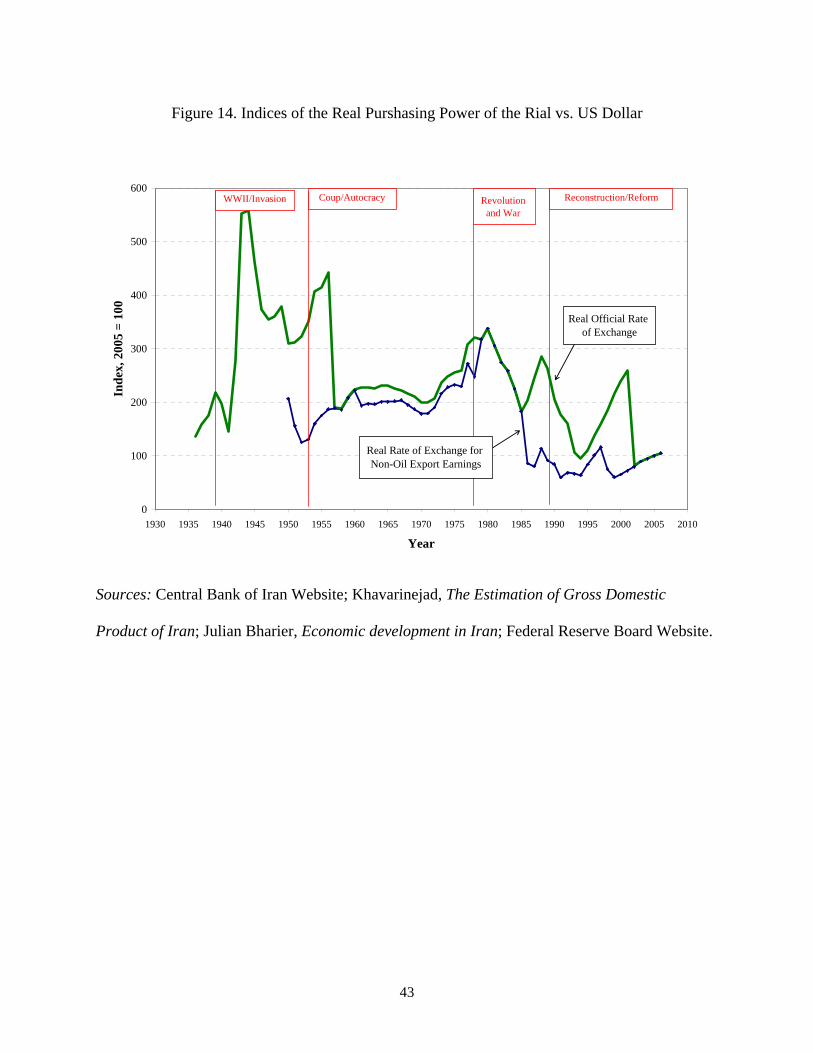
43
Figure 14. Indices of the Real Purshasing Power of the Rial vs. US Dollar
0
100
200
300
400
500
600
1930 1935 1940 1945 1950 1955 1960 1965 1970 1975 1980 1985 1990 1995 2000 2005 2010
Year
Ind
ex, 2
005
= 1
00
Reconstruction/Reform
Real Official Rate of Exchange
WWII/Invasion Coup/Autocracy
Real Rate of Exchange for Non-Oil Export Earnings
Revolution and War
Sources: Central Bank of Iran Website; Khavarinejad, The Estimation of Gross Domestic
Product of Iran; Julian Bharier, Economic development in Iran; Federal Reserve Board Website.
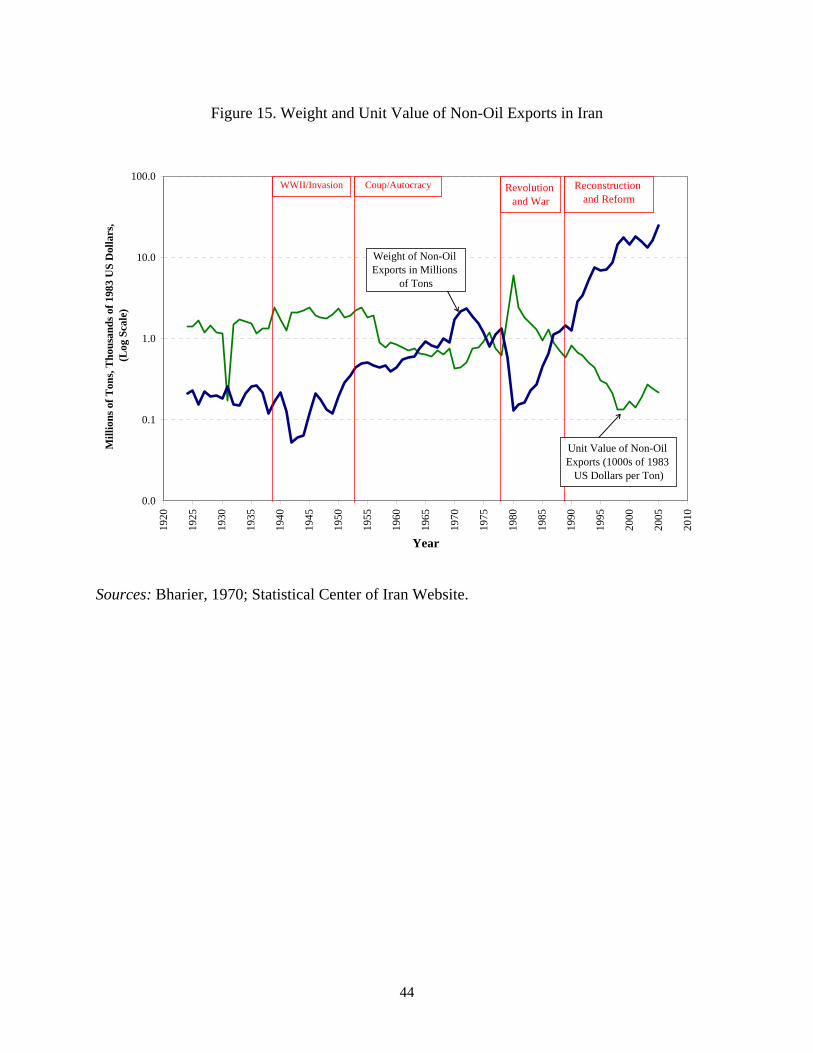
44
Figure 15. Weight and Unit Value of Non-Oil Exports in Iran
0.0
0.1
1.0
10.0
100.019
20
1925
1930
1935
1940
1945
1950
1955
1960
1965
1970
1975
1980
1985
1990
1995
2000
2005
2010
Year
Mil
lion
s of
Ton
s, T
hou
san
ds
of 1
983
US
Dol
lars
, (L
og S
cale
)
Revolution and War
Reconstruction and Reform
Weight of Non-Oil Exports in Millions
of Tons
Unit Value of Non-Oil Exports (1000s of 1983
US Dollars per Ton)
WWII/Invasion Coup/Autocracy
Sources: Bharier, 1970; Statistical Center of Iran Website.
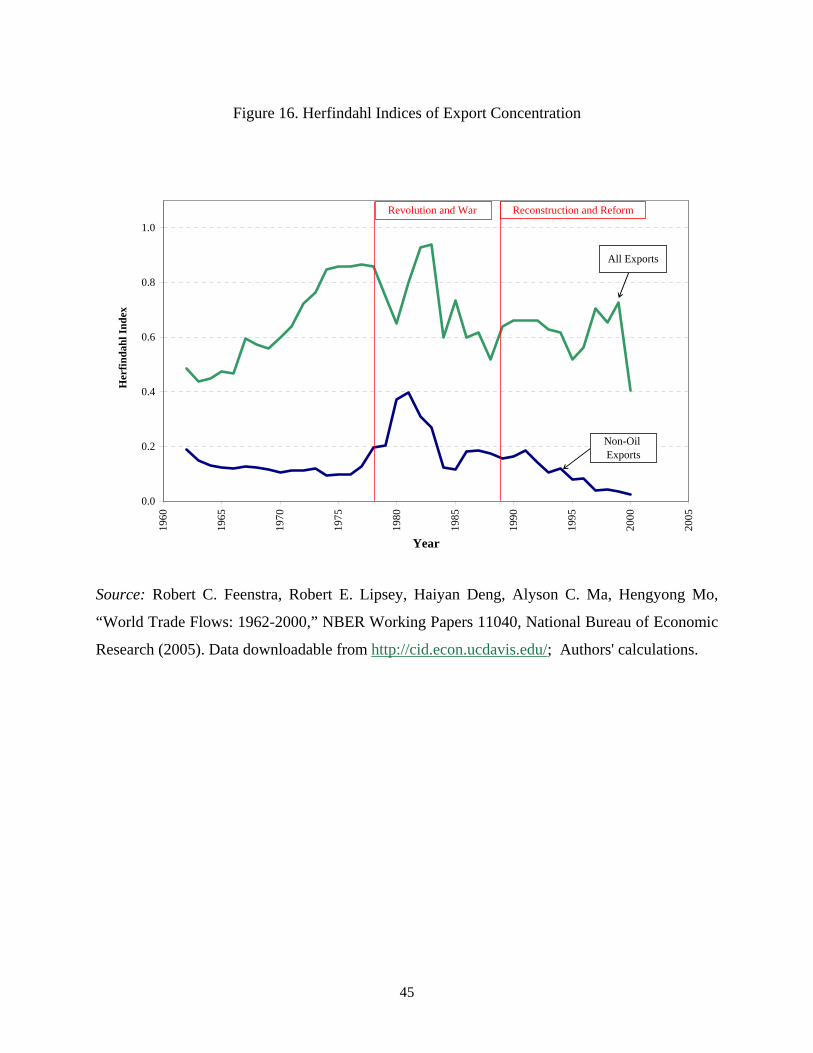
45
Figure 16. Herfindahl Indices of Export Concentration
0.0
0.2
0.4
0.6
0.8
1.0
1960
1965
1970
1975
1980
1985
1990
1995
2000
2005
Year
Her
fin
dah
l In
dex
Revolution and War Reconstruction and Reform
All Exports
Non-Oil Exports
Source: Robert C. Feenstra, Robert E. Lipsey, Haiyan Deng, Alyson C. Ma, Hengyong Mo,
“World Trade Flows: 1962-2000,” NBER Working Papers 11040, National Bureau of Economic
Research (2005). Data downloadable from http://cid.econ.ucdavis.edu/; Authors' calculations.
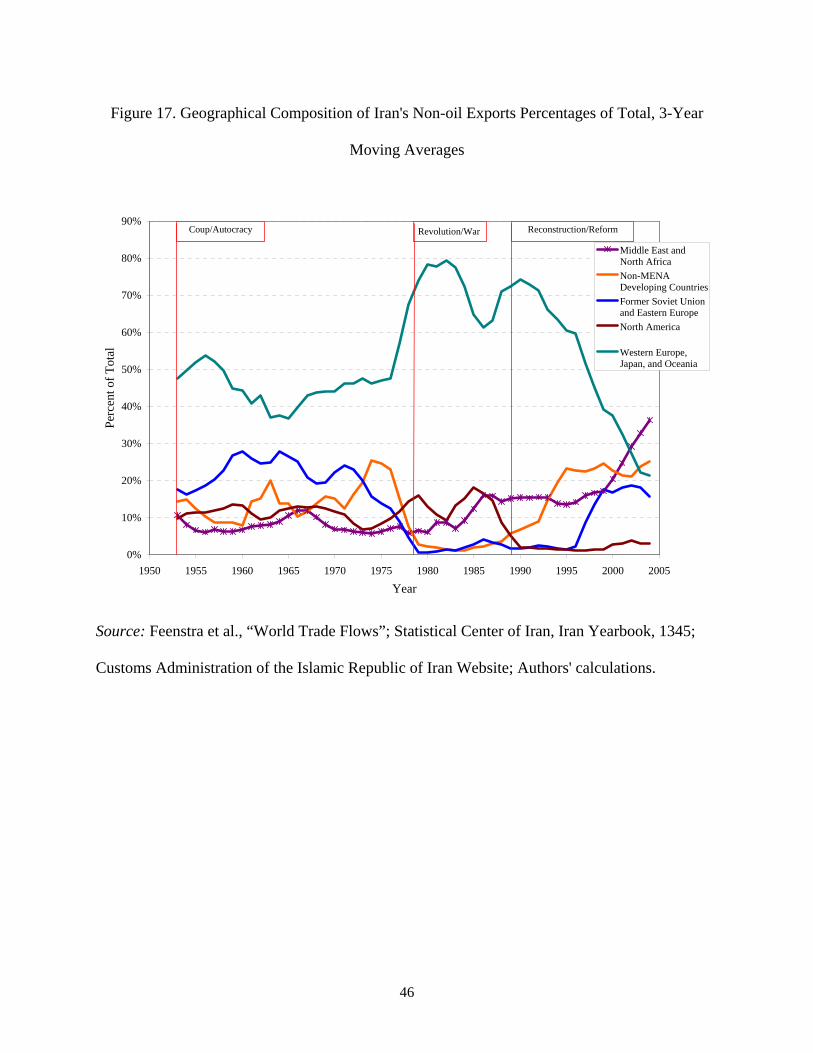
46
Figure 17. Geographical Composition of Iran's Non-oil Exports Percentages of Total, 3-Year
Moving Averages
0%
10%
20%
30%
40%
50%
60%
70%
80%
90%
1950 1955 1960 1965 1970 1975 1980 1985 1990 1995 2000 2005
Year
Per
cent
of
Tot
al
Middle East andNorth Africa
Non-MENADeveloping Countries
Former Soviet Unionand Eastern Europe
North America
Western Europe,Japan, and Oceania
Revolution/War Reconstruction/ReformCoup/Autocracy
Source: Feenstra et al., “World Trade Flows”; Statistical Center of Iran, Iran Yearbook, 1345;
Customs Administration of the Islamic Republic of Iran Website; Authors' calculations.
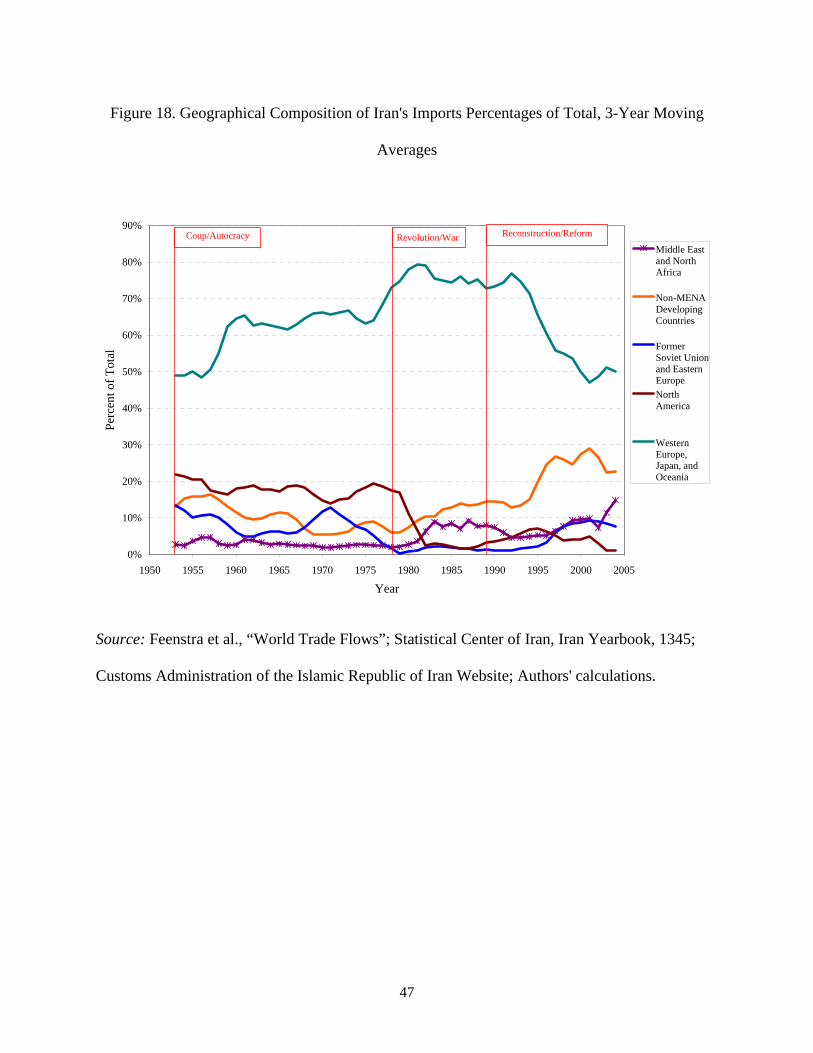
47
Figure 18. Geographical Composition of Iran's Imports Percentages of Total, 3-Year Moving
Averages
0%
10%
20%
30%
40%
50%
60%
70%
80%
90%
1950 1955 1960 1965 1970 1975 1980 1985 1990 1995 2000 2005
Year
Per
cent
of
Tot
al
Middle Eastand NorthAfrica
Non-MENADevelopingCountries
FormerSoviet Unionand EasternEurope
NorthAmerica
WesternEurope,Japan, andOceania
Revolution/War Reconstruction/ReformCoup/Autocracy
Source: Feenstra et al., “World Trade Flows”; Statistical Center of Iran, Iran Yearbook, 1345;
Customs Administration of the Islamic Republic of Iran Website; Authors' calculations.
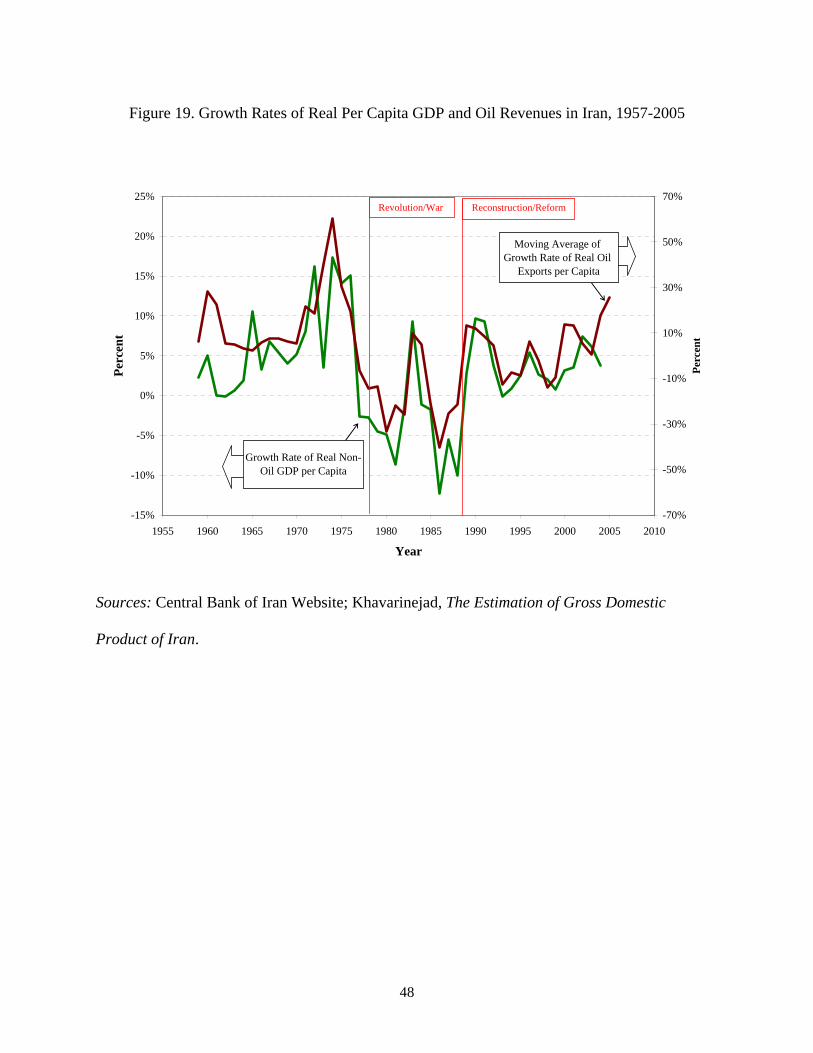
48
Figure 19. Growth Rates of Real Per Capita GDP and Oil Revenues in Iran, 1957-2005
-15%
-10%
-5%
0%
5%
10%
15%
20%
25%
1955 1960 1965 1970 1975 1980 1985 1990 1995 2000 2005 2010
Year
Per
cen
t
-70%
-50%
-30%
-10%
10%
30%
50%
70%
Per
cen
t
Revolution/War Reconstruction/Reform
Moving Average of Growth Rate of Real Oil
Exports per Capita
Growth Rate of Real Non-Oil GDP per Capita
Sources: Central Bank of Iran Website; Khavarinejad, The Estimation of Gross Domestic
Product of Iran.