establishing a baseline - bcs.org · report, the product of a ... john tiner chief executive ......
TRANSCRIPT
Establishinga Baseline
Financial Capability in the UK:
Establishing a Baseline


Foreword 3
Executive summary 4
Background 4Overview of results 4Next steps 5Illustrating the findings 6
Background 8
Detailed results 9
Making ends meet 10Keeping track of your finances 12Planning ahead 14Choosing financial products 17Staying informed about financial matters 20
Next steps 22
The need for intervention 22The National Strategy for Financial Capability 22
Appendix 24
What are the next steps with the Survey? 24Methodology 24
Contents


Financial Capability in the UK: Establishing a BaselineForeword
In a world in which individuals are increasingly required to take responsibility fortheir financial affairs, people need to be able to manage their money well. Thisreport, the product of a survey of over 5,300 people, assesses the ability of the UKpopulation to do so.
The Financial Capability Survey’s main purpose is to establish a baseline measure offinancial capability in terms of how well people: make ends meet; keep track oftheir finances; plan ahead; choose financial products; and stay informed aboutfinancial matters. The results give us rich and complex data, from which four mainthemes stand out:
• Large numbers of people, from all sections of society, are not taking basic stepsto plan ahead, such as saving sufficiently for their retirement or putting moneyaside for a rainy day.
• The problem of over-indebtedness is not that it affects a large proportion ofthe population, but that when it strikes it is often severe, and that many morepeople may find themselves in trouble in an economic downturn.
• Many people are taking on financial risks without realising it, because theystruggle to choose products that truly meet their needs.
• The under-40s, on whom some of the greatest demands are now placed, are typicallymuch less financially capable than their elders, even allowing for their generally lowerlevels of income and experience in dealing with financial institutions.
In short, unless steps are taken to improve levels of financial capability, we arestoring up trouble for the future.
The Survey results are an important contribution to setting the priorities of theNational Strategy for Financial Capability, which is led by the FSA and a SteeringGroup of partners and supported by many others. We intend to repeat the Survey –probably every four to five years – so that we can measure the impact over time ofinitiatives to improve financial capability, including the seven point programme ofaction1 we and our partners have devised to help address the challenges.
I am very grateful to our partners and supporters in this work. My thanks go alsoto Professor Elaine Kempson and her team at the Personal Finance Research Centreat Bristol University, as well as Jenny Turtle and her team at BMRB, for providingsuch a rich source of data from which we and others will derive great insight.
John Tiner
Chief Executive, Financial Services AuthorityMarch 2006
Foreword
3
John TinerChief Executive
Financial Services Authority
1 For details, see Financial Capability in the UK: Delivering Change, 2006(available at http://www.fsa.gov.uk/pubs/other/fincap_delivering.pdf).

Financial Capability in the UK: Establishing a BaselineExecutive summary
Executive summary
BackgroundThe economic and social environment in which peopletake financial decisions has changed – and this changeis set to continue. People are having to take increasingindividual responsibility for their financial affairs. Totake just two examples, the costs of higher educationand of retirement are both increasingly being borne byindividuals rather than the state or otherorganisations. This means that the cost of not havingthe necessary skills to make sound financial decisionsis becoming increasingly significant. It is therefore vitalthat the UK population’s financial capability improvesto meet these greater demands.
As part of addressing this challenge, we need to knowas accurately as possible where the population standstoday, and set a baseline against which we canmeasure progress in future. We have thereforesurveyed over 5,300 adults to create a comprehensivepicture of financial capability in the UK, and thisdocument presents the results.
Overview of resultsThe main themes emerging from the Survey are:
• Many people are failing to plan ahead adequatelyfor retirement or for an unexpected expense ordrop in income. This is not a case of peoplefailing to do so simply because they do not haveenough money. The Survey finds many people atall income levels who are not planning ahead,while also providing plenty of examples of peoplewith very low incomes who do. Nearly half ofpeople have no savings at all.
• Although only a small proportion of thepopulation is experiencing problems with debt,they are often very severely affected. In addition,a further two million households (or around threemillion people) are exposed to potential difficultyin the event of deterioration in economicconditions, since they are constantly struggling tokeep up with their commitments.
• People do not take adequate steps to chooseproducts to meet their needs. Most householdsspend material amounts on financial services, yetmany do not shop around to find a good deal.People also take risks without realising they aredoing so, while others buy insurance to coveragainst risks they do not face.
• The under-40s2 are less capable, on average, thantheir elders. This is true even after taking intoaccount factors such as their lower averageincomes and relative inexperience in dealing withfinancial institutions. It is especially true of the18-30 age group.
These findings confirm serious concerns about currentlevels of financial capability:
• Unless action is taken, the UK population will storeup problems for the future. People need to save,both for a rainy day and for the longer-term. OurSurvey found that, while most people do not makeprovision for an unexpected drop in income ormajor expense, such events are fairly common evenin a favourable economic environment, and oftenpush people into difficulties. In addition, adequatepension provision is becoming ever more important:for example, defined benefit (“final salary”)schemes are in steep decline3.
2 This group refers to people aged 18-40. The Survey was conducted with people aged 18 and over.
3 According to the Pensions Commission, active membership of defined benefit schemes has fallen by over 60% since 1995 (p.52, A New PensionSettlement for the 21st Century, 2005). The Employer Task Force on Pensions estimates that employers contribute at least twice as much to definedbenefit as to defined contribution schemes (p.15, Report of the Employer Task Force on Pensions, 2004).
4

• Many people could be tipped into financialdifficulties by a small change in their circumstances.Two million households are only just managing asit is. Given the general tendency not to plan aheadadequately, many could be pushed into financialdifficulties if interest rates or unemployment rise, orsimply if their personal circumstances change.
• Many people are taking on inappropriate risks andnot shopping around to get a good deal. Manycould face problems in the future as a result of riskswhich they are not protected against, either throughpoor choices or simply lack of awareness that theyface the risk. In addition, most households spendsignificant amounts on financial services: byshopping around for a good deal, they stand tosave themselves substantial sums of money.
• The greatest demands are placed on those leastequipped to deal with them. The under-40s face aconsiderably more demanding environment thantheir parents did, and consequently can ill affordto make mistakes or ignore the need to take action.There is therefore a particularly pressing need toequip them with greater financial capability.
Next steps
The need for intervention
The Survey confirms a clear need for the FSA andothers to take action, particularly to help people planahead more effectively and make better productchoices. The Survey also tells us, in greater detail thanever previously available, where the problems lie.
The National Strategy for FinancialCapability
Meeting this challenge requires a broad range oforganisations to work together. The FSA is providingleadership through the National Strategy for FinancialCapability. With our partners, we have devised aseven point programme, including projects specificallytargeted at groups the Survey highlights as having themost to gain from improved financial capability.
In the three years since we launched the NationalStrategy for Financial Capability, many hundreds ofthousands of people have received help, educationand advice that was previously unavailable to them.With the sustained and relentless implementation ofthe programme, we will now extend this to reachmillions of people across the UK.
Data snapshotsThough individual statistics rarely tell the whole story, there were many telling pieces of data in the results.
• 81% of the pre-retired think that a state pension will not provide them with the standard of living they hope for inretirement. Nevertheless, 37% of these people have not made any additional pension provision.
• 70% of people have made no personal provision to cover an unexpected drop in income.
• Of the 1.5 million who say they are falling behind with bills or credit commitments, one third say they have real financialproblems. Almost three million more people (or two million households) say it is a constant struggle to keep up withcommitments.
• 33% of people, who hold no more complex products than general insurance, bought their policy without comparing it toeven one other product.
• 40% of people who own an equity ISA are not aware that its value fluctuates with stock market performance, and 15% ofpeople who own a cash ISA think its value does.
Financial Capability in the UK: Establishing a BaselineExecutive summary
5

Illustrating the findingsThe following ‘pen portraits’ have been derived from the Survey findings and other work we have done to helpillustrate some of the main findings4.
“I finally got around to joining my employer’s pension scheme. Retirement always seemed really far away so I neverworried about it before. But, because I had put it off for so long, I was shocked to discover how much I would needto start contributing to get even an okay income in my old age. I might even have to retire a bit later than Ithought. I suppose one of the reasons I didn’t start saving earlier was that I enjoyed having a little extra moneyevery month. I’m going to need to start making some small sacrifices now, but actually that’s not so bad becauseI’ve discovered that for every pound I put into my pension, my employer will contribute a pound too.” – 45 year old
“I have two children who are always growing out of stuff or needing new trainers. I got myself into quite a bit of debton credit cards and store cards. I was only just managing to make the payments and sometimes I accidentally slippedinto the red and added overdraft fees to my worries. I had to ask my parents to help me out a couple of times. I wasgetting really worried and wasn’t sleeping properly. I found out about a debt helpline and called them up. I alwaysthought they charged for advice, but actually it was free. They explained to me that credit and store cards can be reallyexpensive and that I could try to get a loan which would help me pay off the money I owed. It seemed like it wouldtake me a little longer to pay it all off, but now I am making payments that I can afford.” – 32 year old
“I have worked really hard to save money over the years and hope to have a bit put away for my retirement. I used toput all my savings in my building society account. My daughter had just opened an ISA and she told me that you getthe returns tax-free. I thought that sounded great. I opened an equity ISA and moved £7,000 into it. When I got myfirst statement, I discovered that the amount of money in my account had gone down! I hadn’t realised that therewas a risk of sometimes losing money. So I talked to an adviser and she explained how that can sometimes happenwith stocks and shares and how I need to balance that risk against the possibility of higher returns. As it turns out,over the last two years my equity investment has done better.” – 62 year old
“When I buy clothes or go out, I use my credit card most of the time. But that’s okay because I always aim to pay itoff in full at the end of the month. Although I have been hit a few times because I haven’t set up a Direct Debitand every once in a while you do forget to put the cheque in the post on time. I heard that can damage your creditrating so I’ll definitely sort that out soon. There was one time when my car broke down and I had to get it fixed soI couldn’t pay off my credit card at all that month. I remember seeing stories on the news about pensions and so onbut I’m only young – that sort of thing won’t affect me for years.” – 26 year old
4 The design of the Survey does not allow for direct quotes to be collected, so these simply illustrate the points.
Financial Capability in the UK: Establishing a BaselineExecutive summary
6


The economic and social environment in which peopletake financial decisions has changed – and it willcontinue to change. As a consequence, people arehaving to take increasing individual responsibility fortheir financial affairs. This was identified as a priorityrisk in our Financial Risk Outlook 20065.
The costs of not having the necessary skills to makethose decisions are also becoming increasinglysignificant. The decline in the number of activedefined benefit pension schemes, for example, meansthat it is ever more important that people make theirown provision for retirement. With the costs ofhigher education increasingly being borne bystudents, inability to manage debt sensibly canreduce course completion rates and leave people witha heavier burden than might otherwise be the case.And, more generally, the wider availability of creditcan lead to dire consequences for those inexperiencedor otherwise unable to manage it. For some, thechallenge is simply about gaining the confidence toengage with the financial system, particularly if theyhave been excluded from it in the past.
The FSA has a statutory objective to promote publicunderstanding of the financial system. As part ofdelivering against this, in Autumn 2003 we broughttogether a partnership of key people and organisationsin government, the financial services industry,employers, trades unions, and the educational andvoluntary sectors. Together we have established a roadmap6 for delivering, over time, a step change in thefinancial capability of the UK population.
As a starting point, we need to know where thepopulation stands today. Working with leadingacademics from the Personal Finance Research Centreat Bristol University and market researchers fromBMRB, we have surveyed over 5,300 adults across theUK to create a comprehensive picture of how wellequipped people are to manage their money. Thissurvey will provide a baseline against which we canmeasure progress in future.
The Survey provides greater insight than everpreviously available into where action might best betargeted. For example, the results tell us that whilethe over-70s are strong at making ends meet, theyare much weaker in the area of choosing financialproducts; and that the under-40s particularly needhelp with planning ahead. We set out in thisdocument the main conclusions we have drawnfrom our initial analysis of the results of the Survey.Further analysis of the data by the FSA and ourpartners will draw out other insights.
As well as influencing the priorities of the NationalStrategy for Financial Capability, the Survey resultswill help inform our wider regulatory work to helpretail consumers achieve a fair deal. They will beespecially useful in our work to develop morecapable and confident consumers and to produceclear, simple and understandable information forconsumers to use.
Background
Financial Capability in the UK: Establishing a BaselineBackground
8
5 Sections A and D, Financial Risk Outlook, 2006.
6 Financial Capability in the UK: Delivering Change, 2006 (available at http://www.fsa.gov.uk/pubs/other/fincap_delivering.pdf).

Financial Capability in the UK: Establishing a BaselineDetailed results
9
Detailed results
The Financial Capability Survey covered each of five components of financial capability:
• Making ends meet.
• Keeping track of your finances.
• Planning ahead.
• Choosing financial products.
• Staying informed about financial matters.
A comprehensive report, which describes how these components were identified andcontains detailed analysis of each, is also published today7.
Interpretation of the results
The Survey allows us to see who is more and who is less financially capable, how theythink about money, and on what components they do better and worse. It tells us wherewe should focus our attention. But it cannot be reduced to a simple pass or fail mark,because the financial capability which a given person needs will depend to some extent ontheir individual circumstances.
For example, someone on a very tight budget would be well advised to maintain anaccurate picture of how much money they have left to spend at any given time. On theother hand, someone whose income comfortably exceeds their outgoings can probablyafford to maintain only a very general picture of their current balance.
For each of the components, the data allows us to represent graphically what proportion ofthe UK population performs at what level of financial capability (for example, see p11). Theleft hand end of these graphs is determined by the least capable response to the Survey, andthe right hand end is based on the most capable response. The distributions are thereforebased on a relative rather than an absolute measure of capability. For each, we have provideda perspective of what might be considered, on an absolute scale, more and less capable. This isshown using red, yellow and green shading in the graphs that follow in this section.
7 Consumer Research Paper 47 – Levels of Financial Capability in the UK: Results of a Baseline Survey, 2006 (available at http://www.fsa.gov.uk/pubs/consumer-research/crpr47.pdf).

Making ends meetA basic component of financial capability is making ends meet. Though everybody hasdifferent incomes and needs, making sure that spending does not consistently exceedincome is clearly a fundamental element of financial survival.
Summary
• The large majority of people do consistently make ends meet, although while some spendless than their income, others use credit to plug the gap.
• The problem of over-indebtedness is not especially widespread in terms of the percentageof the population. But, looked at in absolute terms, it is very concerning: 500,000 peoplehave real financial problems and have fallen behind with many bills or creditcommitments; a further one million have fallen behind with some.
• A further two million households (with three million people) say it is a constant struggleto keep up with commitments; this group in particular should try to take steps to cushionthemselves against an economic downturn or deterioration in their personal circumstancesas they are at risk of joining those falling behind.
• Four million people say they always run out of money at the end of the week or month.
• People who struggle include many earning average or even above average income.
• Being capable at making ends meet is linked strongly with age. The under-40s perform lesswell than their elders, even allowing for factors like differences in incomes or whether theyown their homes outright. The over-60s are especially capable on this component.
Differentiating more capable and less capable
Although we asked people a wide variety of questions on their ability to make ends meet,statistically the following behaviours and attitudes are the strongest indicators of financial capability.
Key findings
• Keeping up with commitments. 65% of people say that they are able to keep up with their billsand other commitments without any difficulties; another 26% are able to do so although it issometimes a struggle. But for 9% of the population, keeping up is either a constant struggle orworse, with 3% falling behind, sometimes severely.
Financial Capability in the UK: Establishing a BaselineDetailed results
10
8 In general, it is rational for people to save more in some periods of their lives and spend more in others. However, statistical analysis demonstrated thatthe attitude of being a spender rather than a saver was highly associated with inability to make ends meet.
More capable
Keeps up with his/her financial commitments without any difficulty and never struggles
Agrees that he/she is more of a saver than a spender8, preferring to save up to buy somethingrather than use credit
Never runs out of money at the end of the week/month
Has not been in financial difficulties in the last five years

Financial Capability in the UK: Establishing a BaselineDetailed results
11
• Making money last. 31% of people say they sometimes run out of money at the end of theweek or month, and 9% of people always run out.
• Distribution by income. It is striking that difficulty in making ends meet is not restrictedto people with low incomes. Similar proportions of people on higher and lower incomessay that they sometimes run out of money at the end of the week or month.
• Attitudes towards debt. In general, people express rather cautious attitudes towards debt. Interms of unsecured debt, 61% strongly agree they would rather cut back on spending thanaccumulate debt on a credit card, and another 23% tend to agree. This was, broadly, borneout in practice: 21% say they have outstanding balances on their credit cards that they donot pay off in full each month.
Correlations
Ability to make ends meet correlates very strongly with increasing age. The under-40sperform less well than their elders, even allowing for differences in incomes or whether theyown their homes outright. Those in their 20s perform least well of all age groups, while theover-60s are especially capable. Other groups tending to do better than most are home-owners and those with higher levels of education.
Among those who, on average, find it harder to make ends meet are young people, peoplewho rent their homes, unemployed people, and people in households with children,particularly single parents.
Men and women tend to perform equally well at making ends meet.
Distribution9
The distribution of the overall scores shows that the large majority of people in the UK arecapable at making ends meet, although it is worth noting that for some this might be because theyare using debt to do so. However, there are quite a few who find it a struggle. There are evensome at the far left of the distribution who are clearly experiencing significant difficulties.
Numberof people
Less capable More capable
The large majorityof people are capableat making ends meet
9 See p9 for how this information is derived and how to read it.

Keeping track of your financesKeeping track differs somewhat from other components of financial capability. For some peopleit is absolutely essential that they know the details of their day-to-day finances. For others, whiledoubtless desirable, it is not actually necessary. For some, if they decide to devote more of theirtime to managing their finances, keeping track would be an excellent place to start and couldmake the difference between making ends meet or not. For others, extra time might be muchbetter spent on planning ahead or choosing products.
The key factor in determining the importance of keeping track for an individual is how tightlythey are living within their income. Many, and particularly those on low incomes, need to keeptrack to avoid going over budget. People who have the luxury of an income which comfortablyexceeds their outgoings can get away with keeping track less well.
Keeping track is likely to be somewhat driven by personality: some people are more meticulous,others go with the flow.
Summary
• Though the correlation is relatively weak, the people who are best at keeping track of theirmoney tend to be slightly worse on average on the other components of financial capability.So, groups such as single parents, those living in social housing, the unemployed and peoplewithout current accounts all perform better than average.
• People on higher incomes are slightly more likely to be less capable at keeping track.
• Women on average out-perform men, even allowing for differences in income,employment status, etc.
• This component is less correlated with demographic factors such as age than the othercomponents of financial capability.
Differentiating more capable and less capable
Statistically the following behaviours and attitudes are the strongest indicators of capabilityat keeping track.
Financial Capability in the UK: Establishing a BaselineDetailed results
12
More capable
Checks the amount of money in current account (or in-hand, for cash budgeters10) frequently
Checks receipts against his/her bank statements as opposed to simply glancing over the entries orjust checking the final balance
Knows current account balance (or in-hand, for cash budgeters) to an appropriate level in linewith his/her income
Budgets to ensure that sufficient funds are available to cover uneven expenditure (eg utility bills,TV licence)
10 Cash budgeters mean those who do not have, or do not use, a current account.

Financial Capability in the UK: Establishing a BaselineDetailed results
13
Key findings
• Knowing bank balance. 7% of people say they have no idea of their current accountbalance to within £500; 21% know to within a pound or two, with teenagers and retirees(ie the age groups most likely to have limited incomes) having the most precise knowledge.
• Checking bank balance. 38% of people say they always check the balance on their bankaccount before taking out money. This differs by gender, with 41% of women and 35%of men always checking the balance. Of the 14% of people who never check theirbalance before taking out money, the gender difference is smaller: 13% of women and15% of men.
• Monitoring withdrawals. 43% of people maintain no record of withdrawals from theircurrent account (or day-to-day spending for cash-budgeters), just out-numbering the42% who do keep receipts from ATM (cashpoint)/cashback withdrawals.
• Reviewing bank statements. Most people pay some attention to their bank accountstatements: only 6% appear to ignore bank statements altogether, while 42% say theykeep and check receipts against statement entries.
• Preparing for upcoming expenditure. 10% of people say they make no provision forplanned expenditure, for example quarterly or annual bills. A further 40% claim theyhave no need to plan as they either have no bills to pay or could easily find the moneywithout planning, while 37% put money aside so they will have enough to pay for billswhen they become due.
Correlations
There is no clear or strong relationship between age and keeping track of money, implyingthat being a careful record keeper is not a skill that is learnt over time. Those who tend toscore highest in this area are those who do less well at making ends meet. People who haveno access to a current account, tenants, lone parents and the unemployed performmarkedly better than average at keeping track.
The lack of correlation with demographic factors, which is in contrast to the other componentsof financial capability, reinforces the view that keeping track may only be an importantcomponent for certain people, ie those who are most in danger of running out of money.
Women perform, on average, better than men on this component.
Distribution
Most people in the UK are reasonably capable at keeping track of their financial situation.However, there is more variation in the scores on this component compared with making endsmeet. This reflects that for some people it is absolutely essential that they know the details oftheir day-to-day finances. For others, while doubtless desirable, it is not actually necessary.

Planning aheadA key component of financial capability is the ability to make adequate provision for thefuture. The Survey suggests that this is an area of major concern.
Summary
• The majority of people in the UK are not planning ahead sufficiently, and are likely tobe storing up problems for the future. 39% of people say they tend to live for today andlet tomorrow take care of itself.
• Unexpected financial setbacks are surprisingly common. In the last three years, 28% ofpeople have experienced a large unexpected drop in income11, and 21% have faced a largeunexpected expense12. Approximately one quarter of people facing these events had falleninto arrears on credit commitments for at least three months over the last five years.
• Nonetheless, most people are unprepared for the unexpected: 70% have made no personalprovision to face a drop in income, and 55% do not think they have sufficient provision toface an unexpected expense.
• 81% of the pre-retired do not think a state pension will provide them with the standardof living they hope for in retirement. Nevertheless, 37% of these people have not madeany additional pension provision.
• This is not a case of people not planning ahead simply because they do not have enoughmoney. The Survey finds many people at all income levels who are not planning ahead, whilealso providing plenty of examples of people with very low incomes who do so.
• This component is more strongly linked with age than any other. There is a clear and steepscale: the under-20s perform worse than the under-30s who perform worse than the under-40s and so on.
Financial Capability in the UK: Establishing a BaselineDetailed results
14
11 Caused by incapacity to work (through accident, illness or disability), redundancy, drop in income following relationship breakdown or death of a partner.
12 Defined in the Survey as “an expense equivalent to your whole income for a month, or more”.
Numberof people
Less capable More capable
People in the UK are reasonably capableat keeping track
Financial Capability in the UK: Establishing a BaselineDetailed results
15
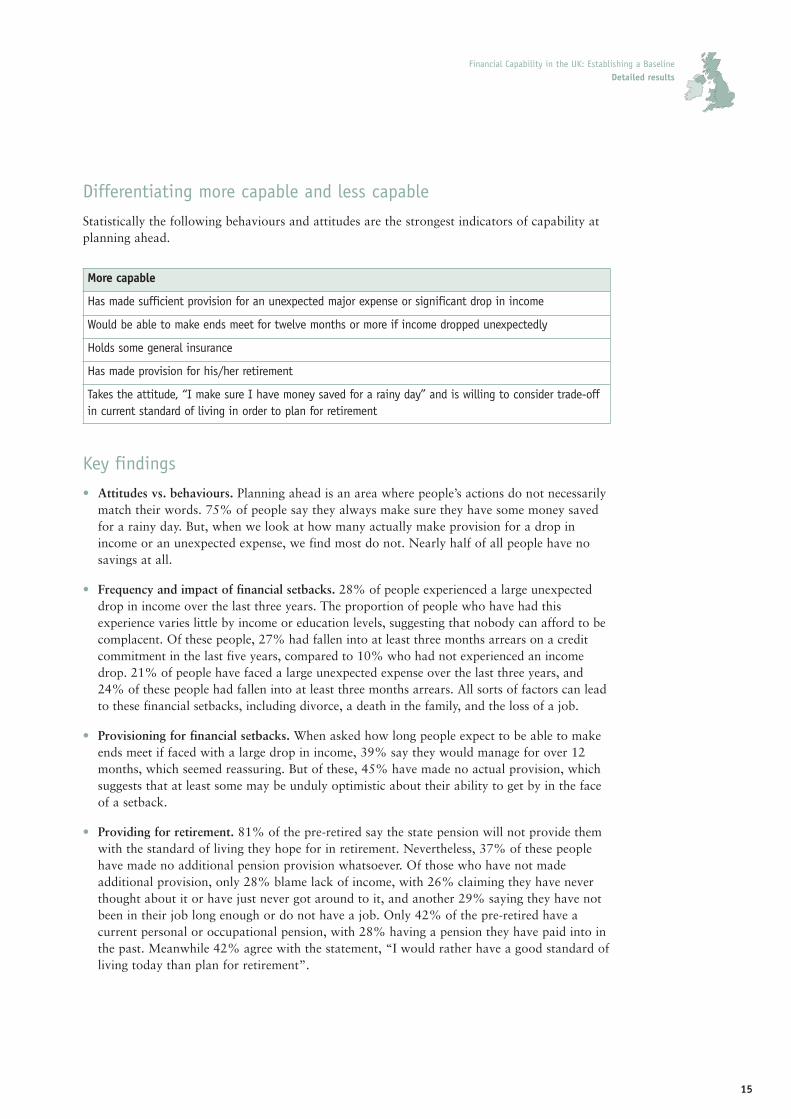
Differentiating more capable and less capable
Statistically the following behaviours and attitudes are the strongest indicators of capability atplanning ahead.
Key findings
• Attitudes vs. behaviours. Planning ahead is an area where people’s actions do not necessarilymatch their words. 75% of people say they always make sure they have some money savedfor a rainy day. But, when we look at how many actually make provision for a drop inincome or an unexpected expense, we find most do not. Nearly half of all people have nosavings at all.
• Frequency and impact of financial setbacks. 28% of people experienced a large unexpecteddrop in income over the last three years. The proportion of people who have had thisexperience varies little by income or education levels, suggesting that nobody can afford to becomplacent. Of these people, 27% had fallen into at least three months arrears on a creditcommitment in the last five years, compared to 10% who had not experienced an incomedrop. 21% of people have faced a large unexpected expense over the last three years, and24% of these people had fallen into at least three months arrears. All sorts of factors can leadto these financial setbacks, including divorce, a death in the family, and the loss of a job.
• Provisioning for financial setbacks. When asked how long people expect to be able to makeends meet if faced with a large drop in income, 39% say they would manage for over 12months, which seemed reassuring. But of these, 45% have made no actual provision, whichsuggests that at least some may be unduly optimistic about their ability to get by in the faceof a setback.
• Providing for retirement. 81% of the pre-retired say the state pension will not provide themwith the standard of living they hope for in retirement. Nevertheless, 37% of these peoplehave made no additional pension provision whatsoever. Of those who have not madeadditional provision, only 28% blame lack of income, with 26% claiming they have neverthought about it or have just never got around to it, and another 29% saying they have notbeen in their job long enough or do not have a job. Only 42% of the pre-retired have acurrent personal or occupational pension, with 28% having a pension they have paid into inthe past. Meanwhile 42% agree with the statement, “I would rather have a good standard ofliving today than plan for retirement”.
More capable
Has made sufficient provision for an unexpected major expense or significant drop in income
Would be able to make ends meet for twelve months or more if income dropped unexpectedly
Holds some general insurance
Has made provision for his/her retirement
Takes the attitude, “I make sure I have money saved for a rainy day” and is willing to consider trade-offin current standard of living in order to plan for retirement

• Prospects for the retired. 21% of people already retired do not find their income sufficient togive them the standard of living they hoped to have. This prompts concern because thecurrent generation of the retired includes beneficiaries of the generous defined benefitpensions that were the norm during their working lives, but which are increasingly rarelyoffered to today’s workforce. As things currently stand, the problems that today’s pensionersface could be magnified for tomorrow’s pensioners.
• Insuring against setbacks. Product holdings bear out these findings on general levels ofplanning ahead, with only 61% of people having a savings account and 66% having homecontents insurance.
• Living for today. Encapsulating these findings is the statistic that 39% agree strongly or tendto agree with the statement, “I tend to live for today and let tomorrow take care of itself”.The worry is that some people may find this approach serves them poorly in future.
Correlations
Capability in planning ahead is stronger in people with higher levels of education and improvesmarkedly with age. There is a clear and steep scale: the under-20s perform worse than theunder-30s, who perform worse than the under-40s, and so on. This is true even when all factorssuch as income levels, employment status etc are stripped out.
Although the data show that people with higher incomes are likely to be better at planningahead, it also tells us that, on average, they are only slightly better: plenty of higher earners arenot doing well on this component.
Women do slightly less well than men, while people who rent rather than own their homes, andparticularly those in social housing, are especially prone to poor planning.
Distribution
The distribution of scores on the planning ahead component is particularly striking. Thedistribution is fairly flat, reflecting considerable diversity in capability. While a number ofpeople are clearly taking considerable efforts to plan ahead, it is just as common for people toobtain less capable scores. Approaching one half of the UK population appears to be makinginsufficient effort, or is unable, to plan ahead and make adequate provision for the future.
Financial Capability in the UK: Establishing a BaselineDetailed results
16
Numberof people
Less capable More capable
Nearly half of the UKpopulation appears to be making insufficienteffort or is unable toplan ahead

Financial Capability in the UK: Establishing a BaselineDetailed results
17
Under -40s
Over -40s
Less capable
Proportionof people
More capable
Comparison of capability distributionfor over- and under-40s
Capability in planning ahead is strongly correlated with age
Choosing financial productsBeing able to make informed choices about financial products is an important component of financialcapability. People need an understanding of risk: both what risks they face, and the trade-off between riskand reward. This needs to be complemented by a good general awareness of the types of financialproducts that can help them achieve their goals, for example how protection products can mitigatesetbacks and how exposure to different asset classes can help to spread risk.
Summary
• People were scored on their ability to choose financial products only if they had personally bought onein the last five years. 74% had done so. Even so, these people generally choose poorly.
• People often do not understand the risks they are taking on: many people who say they want to takeno risks with their savings in fact take on material risks, while others insure themselves against risksthey do not face. Plenty do not use insurance in situations when it might benefit them to do so.
• People do remarkably little shopping around for financial products meaning that they may not begetting a good deal. Many choose products for reasons other than price or product features (eg takinga credit card just because it is offered with a current account).
The distribution of scores obtained by people under-40 are clusteredtowards the less capable end of the range. In comparison, the scoresobtained by people over-40 are clustered towards the more capable end.This indicates that, in general, the under-40s are less capable at planningahead than the over-40s.

• Most people buy products based solely on product information and/or advice from friends,relatives or sales staff. Over four million people bought their most complex product13 withoutconsidering any other options at all.
• People usually learn from experience: in general, the more products they have bought, thebetter they are at choosing. However, the under-30s are particularly prone to choosing poorly,even if they are experienced buyers.
Differentiating more capable and less capable
Statistically the following behaviours and attitudes are the strongest indicators of capability atchoosing products.
Key findings
• Participation in the market. 26% of the population have not personally bought a financialproduct in the last five years, because they have stayed with a pre-existing product, are too youngto have engaged with financial products, rely on someone else, or are financially excluded.
• Understanding of risks. A significant minority of people seem not to understand the risks theyface. 43% say they are not prepared to take any risk at all with their savings. 40% of peoplewho own an equity ISA do not know that the cash value of their investment is directlyaffected by stock market performance, while 15% of people who own a cash ISA think that itis. In contrast, we found examples of people insuring themselves against risks they may notface, eg 9% of people who rent from a private landlord hold buildings insurance.
• Use of financial products to mitigate risks. Over 10% of home-owners do not have buildingsinsurance, and just over a third of renters have home contents insurance.
• Use of advice when purchasing. When asked for the main source of information that theyuse, 42% say they relied on product information and/or advice from friends, relatives orsales staff, 21% take no advice at all, and only 21% conduct an active search for thebest buy or consult an appropriate professional adviser. 13% buy the product withoutconsidering any other options.
• Price insensitivity. Only 37% of savings account holders choose their account based on theinterest rate paid. 49% of savings account holders cannot estimate the current level ofinterest. 49% of people choose a credit card based on the interest rate, and 11% simplychoose it because it came with their current account.
Financial Capability in the UK: Establishing a BaselineDetailed results
18
More capable
Seeks advice from an appropriate professional adviser before buying financial products or activelyshops around
Doesn’t just rely on the information that accompanies the product to inform his/her purchasing decision
Compares products from multiple providers either personally or through an appropriate professional adviser
Compares products on features and price rather than making a choice based on brand image
Reads terms and conditions in detail
13 We asked people about a maximum of two products purchased within the last five years. If more than two had been purchased, people were asked aboutthe two most complex product types from a hierarchy of investments, mortgages, payment or income protection, credit cards, unsecured credit, generalinsurance, savings accounts and current accounts.
• Inertia after purchase. There is considerable inertia in the market for financial products: oncepeople have bought a product, they tend to stick with it. This is true even in productcategories typically seen as very competitive, such as car insurance, or where the value to theaverage household of shopping around is very high, such as mortgages. Of those who havecar insurance, 48% have taken out a different policy or have actively considered switching inthe last five years. The comparable figure for mortgages is 42%.
• Use of credit. The great majority of the population do not regularly sign up to new creditcards: only 20% have taken out a credit card in the last five years. Personal loans are lessprevalent (held by 14% of the population compared with 56% for credit cards) though themarket is growing. 21% hold credit cards which they do not pay off in full each month.
Correlations
Experience counts in choosing financial products: the number of different types of productspeople have bought is by far the best indicator of how well they choose, and much stronger thanincome, for example.
The under-30s perform well below average, even allowing for other factors, which is concerninggiven the demands they face. The retired as a group score well above average, but those over 70are almost as weak as 18-19 year olds when all other factors are taken into account.
Women are somewhat less capable at choosing financial products than men, even allowing forother factors such as income. Renters, and particularly those in social housing, performsubstantially below average. But there is no evidence that groups such as the unemployed andsingle mothers, who are typically below average on other components, are more capable or lesscapable when it comes to choosing products.
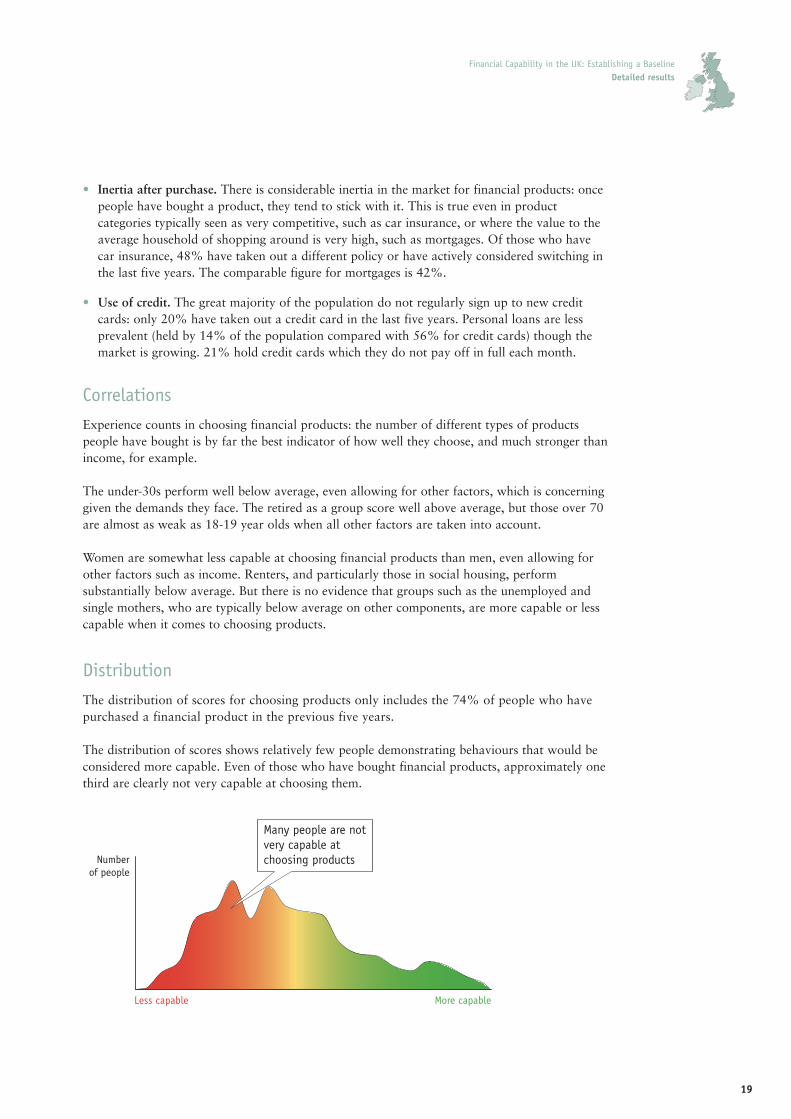
Distribution
The distribution of scores for choosing products only includes the 74% of people who havepurchased a financial product in the previous five years.
The distribution of scores shows relatively few people demonstrating behaviours that would beconsidered more capable. Even of those who have bought financial products, approximately onethird are clearly not very capable at choosing them.
Financial Capability in the UK: Establishing a BaselineDetailed results
19
Numberof people
Less capable More capable
Many people are not very capable at choosing products

Staying informed about financial mattersThe final component of financial capability is having some knowledge of financial matters andkeeping abreast of financial developments.
Summary
• 72% of people think it is very or quite important to keep up with financial matters, although12% of these people say that they are not doing so. 78% of people keep up with at least onefinancial indicator14.
• 19% stay informed primarily through specific financial information sources (eg the financialpages of a newspaper); most rely on general newspaper, television and radio content.
• In a short quiz, people generally did quite well at reading bank statements and making basiccalculations, but were much less sure on questions about risk.
• The under-40s generally perform less well than their elders, even allowing for the fact thatthey typically earn less and have less experience of dealing with financial institutions.
Differentiating more capable and less capable
Statistically the following behaviours and attitudes are the strongest indicators of capability atstaying informed.
Key findings
• Attitudes to keeping informed. 72% of people agree it is very or quite important to keep upwith financial matters, although 12% of these people say they are not actually doing so. 78%of people keep up with at least one financial indicator but 22% keep up with none. Only 9%think it is not important at all.
• Indicators watched. People are much more likely to keep up with macro-economic measures.46%, the highest proportion, keep up with interest rates: many also keep up with tax rates,changes in the state pension, benefits and tax credits, and the state of the housing market.Only 11%, the lowest proportion, keep up with best buys in financial products.
• Sources of information. When asked which sources they use to keep informed about financialmatters, people say newspapers generally (41%) and television or radio programmes (39%).19% keep up to date by reading the financial pages of newspapers, and only 7% do so bytuning in to specialist programmes on television or radio. This shows that most people absorbfinancial information while reading, watching or listening to other things that interest them.
Financial Capability in the UK: Establishing a BaselineDetailed results
20
More capable
Monitors many financial indicators such as changes in the housing market, stock market andinterest rates
Checks these financial indicators frequently
Has a good level of applied financial literacy
Thinks it is reasonably important to keep up to date with financial matters
14 Specifically, we asked about changes in: interest rates; the housing market; state pension, benefits and tax credits; taxation; inflation; the stock market; thejob market; and best buys in financial products (listed in descending order of frequency with which people keep up to date).

• Results of the Money Quiz. The Survey includes six questions to test applied financial literacyin a Money Quiz. The average score was 4.9 out of 6.
– When asked to read the final balance from a bank statement, 91% were able to do so. 7%of those who use a current account got this wrong.
– 85% were able to say whether or not there was sufficient money in the account to cover aspecified Direct Debit.
– 79% of people were able to correctly answer a question testing understanding of the effectsof inflation on savings15.
– 75% of people answered correctly two questions testing interpretation of graphs showingrelative returns on different types of investment.
– 90% correctly answered a question testing basic arithmetic16.
Young people on average scored lower on the quiz than others, while people with higherincomes consistently did better than people with lower incomes.
Correlations
There was a strong correlation between keeping well informed about financial matters andboth income and general levels of education. Again, retired people show stronger capabilityon this component.
Men significantly outperform women on staying informed, even after we stripped out otherfactors, such as differences in income. The under-40s generally perform less well than theirelders, although the over-70s perform worst of all age groups. Those in social housing and singleparents typically perform worse than average.
Distribution
The distribution of scores for the staying informed component shows considerable diversity inpeople’s behaviours. Unlike the distributions for making ends meet and keeping track, the vastmajority of people are clustered towards the middle of the distribution.
Financial Capability in the UK: Establishing a BaselineDetailed results
21
15 The question was: “If the inflation rate is 5% and the interest rate you get on your savings is 3%, will your savings have at least as much buying power ina year’s time?”
16 The question asked whether a discount of £30 on a television originally priced at £250 was better or worse than a 10% discount.
Numberof people
Less capable More capable
There is considerablediversity in the UKpopulation’s capability at staying informed

The need for interventionThe Survey confirms a clear need for the FSA andothers to take action, particularly to help peopleplan ahead more effectively and make betterproduct choices.
A lack of financial capability matters for individuals,but it also matters for society as a whole:
• When people make bad decisions (or simply nodecisions), there are often negative consequencesfor society generally. A classic example is thatwhen people do not save enough to maintain anadequate standard of living in retirement, thestate (and therefore the taxpayer) may have tomake up the difference.
• The absence of financial capability can diverteconomic resources from more productive uses. Forexample, if somebody becomes over-indebted, they,their debtors and any voluntary organisations towhom they turn incur significant costs to resolve thesituation. These resources could be more productivelyused elsewhere, particularly in preventing financialcrises happening in the first place.
• A lack of financial capability makes financialservices more expensive for everybody. Financialservices firms have to spend more time educatingconsumers and regulators have to impose systemsto mitigate the risks inherent when consumers whoare not financially capable buy products. The costof these activities is passed on to all consumers inthe form of higher prices for products and services.
It is therefore in everybody’s interest that action istaken to improve financial capability among allsections of society.
Some groups are particularly vulnerable, as the Surveyreveals. Many people, particularly those on lowincomes, lack access to mainstream financial services:1 in 12 people in the UK do not have access to a bankaccount of any kind17. Households that suffer fromfinancial exclusion have limited financial choices andoften incur higher costs (by, for example, having touse more expensive forms of credit). This can causegreater financial strain, trapping some in a cycle ofpoverty. While other factors have a significantinfluence on this, improving the financial capability ofmore vulnerable people – particularly in planningahead – must be a priority.
Action is also needed to mitigate the effect of apossible future downturn in economic conditions. Asthings stand, this could result in a substantial increasein the number of people in financial difficulties, sincemany are only just making ends meet, even against arelatively benign economic backdrop. Again, weknow that many people are not planning aheadadequately, even to the extent of setting aside a littlemoney for a rainy day.
The National Strategy forFinancial CapabilityMeeting this challenge requires a broad range oforganisations to work together. The FSA plays animportant coordinating role through its leadership ofthe National Strategy for Financial Capability.
With our partners, we have devised a seven pointprogramme, including projects specifically targeted atthe groups that the Survey highlights as having themost to gain from improved financial capability. Wewill see financial capability education, information
Next steps
Financial Capability in the UK: Establishing a BaselineNext steps
22
17 Promoting Financial Inclusion (HM Treasury), 2004. This is corroborated by the Financial Capability Survey finding that 11% of people do not have acurrent account.

Financial Capability in the UK: Establishing a BaselineNext steps
23
and advice reaching further into UK schools, HigherEducation institutions, organisations that help youngand often excluded adults, and the workplace. Wewill complement this with a range of resourcesdesigned to help all consumers become moreconfident and capable. Details of the seven pointprogramme are given in our document FinancialCapability in the UK: Delivering Change18.
In the three years since we launched the NationalStrategy for Financial Capability, many hundreds ofthousands of people have received help, educationand advice that was previously unavailable to them.With the sustained and relentless implementation ofour new programme, we will now extend this toreach millions of people across the UK.
18 Financial Capability in the UK: Delivering Change, 2006 (available at http://www.fsa.gov.uk/pubs/other/fincap_delivering.pdf).

What are the next steps withthe Survey?• We will continue to analyse the data, particularly to
understand more about the needs of groups whomay be more vulnerable.
• We will repeat it in the next four to five years asone of the measures to assess the impact ofinitiatives to improve levels of financial capability.
• We will share our data with a wide audience,through the Economic and Social Research CouncilData Archive, so that others can gain insights in theareas of greatest interest to them.
MethodologyMeasuring financial capability raised a number of keyissues: what is financial capability, how would wedevelop a measure of financial capability and howcould we measure it in practice? We tackled thesequestions through a significant programme ofdevelopmental work, and we appointed a team fromthe Personal Finance Research Centre led by ProfessorElaine Kempson to help with the design phase and tocarry out the subsequent analysis of the Survey data.Professor Kempson is a leading authority on financialcapability issues and has extensive experience ofworking on quantitative surveys and national datasets. The outcome of the development phase has beenreported on separately in FSA Consumer ResearchPaper 37 – Measuring financial capability: Anexploratory study19.
We were clear at the outset that we would require arepresentative quantitative survey of the UKpopulation. A number of design factors requiredcareful consideration including boosting numbers inkey sub-groups (the devolved UK administrativeregions and ethnic minorities), and deciding on whichsampling method to use. We set out these and otherpoints, including the need for extensive piloting, in aformal specification of requirements for thequantitative data collection phase.
We appointed BMRB20 to carry out the data collectionstage. The research design was based around a randomlocation sampling method developed by BMRB. It is arelatively sophisticated form of quota sampling whichavoids most of the biases of simple quota methods byminimising interviewer discretion about where tointerview. This process was conducted separately for thefour countries of the UK, in order to provide a minimumof 3,100 interviews representative of the Englishpopulation, 500 interviews representative of each ofScottish, Welsh and Northern Irish populations, and atleast 400 interviews with ethnic minority groups. In theend 5,328 interviews were conducted. Full details of thefieldwork research methodology are contained in aseparate methodological report21. We have alsopublished the questionnaire used in the fieldwork22.
In order to subject the research methods and findingsto independent external scrutiny, we established apanel of experts made up of individuals from keyresearch organisations23. Panel members attendedmeetings in their own right rather than asrepresentative members of organisations. The panel’sremit was to scrutinise the research methods andoutcomes at key stages of the research process.
Appendix
Financial Capability in the UK: Establishing a BaselineAppendix
24
19 Available at http://www.fsa.gov.uk/pubs/consumer-research/crpr37.pdf.
20 Examples of BMRB’s previous work include the Skills for Life Survey for the Department for Education and Skills and the British Crime Survey forthe Home Office.
21 Consumer Research Paper 47a – Financial Capability Baseline Survey: Methodological Report, 2006. (available at http://www.fsa.gov.uk/pubs/consumer-research/crpr47a.pdf ).
22 Consumer Research Paper 47b – Financial Capability Baseline Survey: Questionnaire, 2006(available at http://www.fsa.gov.uk/pubs/consumer-research/crpr47b.pdf).
23 The Scottish Executive, the Department for Education and Skills, the Department for Work and Pensions, the FSA Consumer Panel, Brunel University,King’s College London, IFF Research, the British Bankers’ Association, Henley Centre Headlight Vision, and Citizens Advice.
Keep in touchWe will be reporting on further developments on the FSA’s website at:
www.fsa.gov.uk/financial_capability
Comments or questions on the Survey can be sent via the website or by email to:
or by mail to:
Financial Capability Team The Financial Services Authority 25 The North ColonnadeCanary WharfLondon E14 5HS

FFiinnaanncciiaall SSeerrvviicceess AAuutthhoorriittyy
25 The North ColonnadeCanary WharfLondon E14 5HS
Tel: +44 (0) 20 7066 1000Fax: +44 (0) 20 7066 1099Website: www.fsa.gov.uk
ISBN: 1-84518-419-X