establishment survey on working time and work-life …€¦ · · 2007-07-02establishment survey...
TRANSCRIPT

Establishment Survey on
Working Time and Work-Life Balance (ESWT 2004/2005)
Sampling Report
UK Data Archive Study Number 5655 - Establishment Survey on Working Time and Work-Life Balance, 2004-2005
Establishment Survey on Working Time and Work-Life Balance (ESWT) in 21 EU Member States Sampling Report prepared by
Arnold Riedmann, TNS Infratest Sozialforschung, Munich TNS Infratest Landsberger Strasse 338 80687 Munich Germany on behalf of the
European Foundation for the Improvement of Living and Working Conditions, Dublin
Munich, 12 December 2005 40.36028/40.40815/Sampling_Report_EU21_20050805.doc
1

Contents Page
Preface 4 1. Challenges for the sampling and weighting of an EU-wide survey on
establishments 5 1.1. Specific requirements for the Sampling of the “Establishment Survey on Working-Time
and Work-Life Balance” 5 1.2. The unit of enquiry: Company or establishment? 7 1.2.1. Definitions 7 1.2.2. Considerations in terms of the contents of the study 9 1.2.3. Practical implications 10 1.3. Size-classes and sectors of activity: The stratification matrix 11 1.4. A disproportional sample-design: Definition, advantages and restraints 13 1.4.1. Employee vs. establishment-proportional sampling and weighting – some general
remarks 13 1.4.2. The weighting of the Establishment Survey on Working-Time and Work-Life Balance:
Requirements and practical hindrances 16 1.4.3. The sample-design used for the survey 17 1.5. Information in address-registers: Size-class and sector of activity 18 1.6. Coverage of sectors of activity: Completeness at any price? 19 2. The address registers 22 2.1. Types of address-registers 22 2.1.1. Official and semi-official registers 23 2.1.2. Registers built up by research institutes 24 2.1.3. Commercial address-providers 24 2.2. Compatibility of sector-classifications used in the address-sources with NACE 28 2.3. Coverage of size-classes by the address-sources 29 2.4. Coverage of sectors of activity by the address-sources 29
2

3. Statistical background information 30 3.1. Sources for statistical background information 30 3.2. Data of the Labour Force Survey 31 3.3. Some remarks on estimations 32 4. Company vs. establishments: Problematic cases and practical solutions 35 4.1. Typology of countries by availability of address-registers and statistical information on
the universe 35 4.2. Practical solutions for countries without adequate establishment-registers 37 4.2.1. Proposal of an additional screening-procedure 37 4.2.2. Alternative approach: Yellow Pages-based sampling 40 4.2.3. Comments on the alternatives 42 5. The countries 43 5.01 Belgium 44 5.02 Denmark 46 5.03 Germany 48 5.04 Greece 50 5.05 Spain 53 5.06 France 55 5.07 Ireland 57 5.08 Italy 59 5.09 Luxembourg 60 5.10 The Netherlands 62 5.11 Austria 64 5.12 Portugal 65 5.13 Finland 67 5.14 Sweden 68 5.15 The United Kingdom 69 5.16 The Czech Republic 71 5.17 Cyprus 72 5.18 Latvia 74 5.19 Hungary 75 5.20 Poland 77 5.21 Slovenia 78
3

Preface
The "Establishment Survey on Working-Time and Work-Life Balance (ESWT)" was prepared and carried out on behalf of the European Foundation for the Improvement of Living and Working Conditions by TNS Infratest Sozialforschung, Munich (Germany) in co-operation with a group of experts and national fieldwork institutes.1 Data collection was carried out in two phases: − In 2004 field-work was carried out in the 15 countries which formed the EU until its
expansion on 1 May 2004 (EU-15).
− In 2005, additional interviews were carried out in 6 of the 10 states which newly joined the European Union on 01 May 2004 (the Czech Republic, Cyprus, Latvia, Hungary, Poland and Slovenia).
Reporting about the preparatory phase and data collection is made in four separate parts: 1. A Technical Report describes the preparation of the survey (especially the development
of the questionnaires) and fieldwork and contains some recommendations for future surveys of a similar kind.
2. This Sampling Report describes in detail the challenges related to sampling and
weighting of a European-wide survey at establishment level and the practical solutions adopted for the ESWT survey.
3. The answers given by the respondents which were interviewed in 21,031 establishments
(21.031 managers and 5,232 employee representatives) are documented in separate volumes of Cross-Tabulations.
4. The English master versions of the questionnaires prepared for the interviews with the
management (MM) and with the employee representation (ER) as well as all national language versions of these questionnaires for the 21 countries involved in the survey in 2004/2005 can be found in a separate Documentation of Questionnaires.
Please note that all decisions on sampling and weighting were made against the background of the situation in the EU-15 countries. The decision to extend the survey to additional countries was made only after the preparation for the EU-15 countries had already been finished. Therefore the argumentation in this report and the examples given for illustration (e.g. company statistics vs. establishment statistics etc.) mostly are related to the EU-15 countries only. Nevertheless all problems described in this report and the practical solutions to overcome these problems also apply to the six new countries. The country-specific documentation at the end of this report comprises all 21 countries.
1 For details cf. Annex A and B of the Technical Report
4

1. Challenges for the sampling and weighting of an EU-wide survey on establishments
1.1. Specific requirements for the Sampling of the “Establishment Survey on Working-Time and Work-Life Balance”
Although surveys at enterprise level are common business (especially in market research) in all countries involved in this study, it has to be pointed out that for this project specific standards had to be met as far as sampling and weighting are concerned which go far beyond the normal requirements for this type of survey. Market research projects often are restricted to specific sectors of activity, are carried out on company (not establishment) level and/or use client's addresses for sampling. Yet, for the purposes of this study it was required to build representative samples at establishment level, and to cover all sectors of activity2. Additionally adequate statistical background information had to be made available for both employee- and establishment-proportional weighting of the data (nationally and internationally). Only in some of the countries it was an easy exercise to meet these requirements. Most of our partner institutes had to do intensive research on the possibilities for sampling as required. This implied the search for the best available address-register which fitted the specific requirements of this study, the availability of the corresponding statistical background information on the universe and a critical evaluation of the available sources with regard to completeness and reliability of the provided information. It turned out in the communication with address providers and the national statistical institutes that - even for these experts of handling addresses or statistical data - the importance of certain features was not always clear. This was especially true with regard to the information which had to be contained in the addresses (size, sector of activity, telephone numbers) and for the definition of the unit of enquiry (company vs. establishment). Obviously not everybody was familiar with the difference between "company" and "establishment" and the term "establishment" is used in different ways by different address-providers (e.g. in Belgium it turned out that what was declared as different establishments of the same enterprise in the address-source in fact were mostly just multiple entries of one and the same establishment listed with different kinds of activities). A high degree of cross-national comparability was one of the crucial criteria for the success of this multi-country study. To ensure cross-national comparability of such a survey does not only imply the construction of a questionnaire which is at the same time specific enough to capture peculiarities of the national work organization and general enough to allow a full comparison of all answers. It also requires a sampling design which ensures that in each country the same type of units is surveyed. Otherwise it would not be clear whether differences in the results are due to differences in substance or due to the fact that the units for data collection were not the same.
2 Except for agriculture, forestry and some other sectors with marginal importance with regard to the
topics of this study (see chapter 1.7.).
5

The choice of either establishments or companies as units of enquiry obviously has an impact on the structure of the universe and on the interpretation of the answers given. For examples of differences between establishment and company based surveys see below chapter 1.2. In the “Technical Specifications concerning the Company Survey on Working Time and Work-Life Balance” the Foundation stated that sampling for this survey should meet the following requirements: − The unit of enquiry is meant to be the establishment, i.e. the local unit in case of multi-site
enterprises (“For each country surveyed, random samples of establishments, representative of the universe to be covered, will be drawn from the register(s) available”.).
− The sample is to be designed as an employee-representative sample (“The structure of the stratification matrix should be proportionate to the distribution of employees.”).
− As sample frame a stratification matrix with 8 cells is to be used. This matrix is defined by two sectors of activity (“Producing Industries” NACE A - F and “Service Sector” NACE G - Q) and four size-classes (10-49, 50-249, 250-499 and 500 or more employees).
− Weighting of the national data has to be done in accordance with these sectors and size-classes.
All these requirements are well reasoned as regards both content and methodology of the study (cf. chapters 1.2 to 1.4). Yet, the task to build comparable samples based on these guidelines in 21 countries with not only different languages but also different legislation about data protection, a different degree of development of national statistics and partly differing norms and classification systems for the statistical capture of the economy, was a challenging task with pioneer character. For sampling as considered desirable the following requirements had to be met in each of the 21 countries to be surveyed: − Availability of an address-register which comprises
− addresses at establishment level, − all sectors of activity (with some minor exceptions, compare 1.6.), − up-to-date information on the sector of activity, − at least rough information (size-class) on the number of employees for each address
and − a telephone number for each address.
− Availability of statistical background information, about − the distribution of establishments by size class and sector of activity and − the distribution of employees over the cells of the sampling matrix (establishments by
size class and sector of activity), i.e. information on how many employees work in all establishments of a certain size class and sector of activity.
6
So the challenge consisted not only in finding any address-source at establishment-level, but this address-source additionally had to fulfil a high standard of quality, it had to contain specific additional information for each address and to be supplemented by the corresponding statistical background information. Practice has shown that even if a reasonably comprehensive and up-to-date address-source is available at establishment level, it may well be that the statistical background information necessary for building the gross sample and – even more important – for later weighting of the data is not available. The business data collected by the national statistical institutes are sometimes either not based on establishments at all or they are not sufficiently differentiated between size-classes. Or they provide stratified information on the number of establishments, but not on the number of employees working in establishments of the various sizes. And in some cases, they don’t include all relevant sectors of activity.
1.2. The unit of enquiry: Company or establishment?
1.2.1. Definitions
It is an indispensable prerequisite for any survey to have a well defined unit of enquiry for data-collection in the interviewing-process. As the major aim of this survey on working-time and work-life balance is the provision of data which enable analysts to undertake cross-national comparisons, the unit of enquiry was meant to follow under all circumstances the same definition in all 21 countries involved in the study. But which is the ideal unit of enquiry for the purposes of such a survey? Before discussing this question, a common base of understanding should be established with regard to the quite disturbing variety of different terms – such as enterprise, company, firm, establishment, workplace, local unit etc. - which are in use for the denomination of the unit of enquiry. A company is defined as a legal unit where commercial activities of any kind (production, sales, services etc.) are being practiced. The terms enterprise and firm are often used synonymously with “company”. Yet, some authors state that an enterprise comprises only “larger” companies which have more than one employing unit under common ownership or control (Groß 2003: 10). According to this narrower definition, an enterprise would always be a multi-site company. But as this distinction is obviously not common place, both terms are used synonymously in this report. An establishment can be defined as “…the local unit or the reporting unit where work takes place” (Groß 2003: 10). In companies which consist of one local unit only (single-site companies), there’s no factual difference between the terms company and establishment: each single-site company is at the same time an establishment. Yet, the distinction between company and establishment is significant for so called multi-site companies, i.e. companies
7

whose activities are not bound to a single site or geographical location but take place in several sites/locations. In such companies, each site of activity which is not legally independent is counted as an establishment. Examples are banks with their various branch offices, chains of supermarkets, car factories with different production sites etc. Unfortunately there are a couple of cases where this distinction is not easy. E.g. in some cases there are units which are organizationally closely connected with others and which may even share an in large parts common firm name, but are nevertheless formally legally independent. Strictly speaking, such units are not to be regarded as establishments of multi-sites, but as companies of their own. The terms workplace and especially local unit are often used synonymously with establishment. But while the usage of local unit as synonym for establishment is widely acknowledged (e.g. several National Statistical Offices use this term for their establishment statistics), in some publications workplace is referring to sub-units within establishments, therefore we avoid the usage of this term here in this report. For entities of the public administration, the terms company or enterprise are usually not used, whereas it is possible – although not very common either – to use the term establishment for the local unit. The roughly equivalent term for the unit company in the public administration sector would be the more general term organization or institution. For this sector of activity therefore the basic distinction was made between organization or institution on the one and establishment or the more neutral term local unit on the other hand. However, in this report we do not always explicitly differentiate between companies and organizations, as this would lead to quite tedious repetitions. Wherever we talk about companies only, the term is referred to both the private and the public sector. A clear distinction between organization and local unit is quite complicated for the public administration and some other parts of “the public sector” anyway – even more so in a cross-national study: Depending on the respective national political and organizational structures each single police station e.g. might be regarded either as an establishment of the headquarters of the National Police or as an “independent” organization. In a similar way, a public school might be regarded as an establishment of the local, regional or national school administration or – in some cases – again as an “independent” organization. Multi-national companies are another somewhat special case. The national branches of an internationally operating firm are of course in a sense dependent on the mother company. Yet, from the point of view of national law, the national branch (or the set of branches) is considered as a company of its own in the respective country. So e.g. the German branch of Sony (“Sony Deutschland”) would have to be considered as a company of its own in Germany and not as a mere establishment of the Japanese headquarters of Sony – although from an international point of view it is certainly a daughter of Sony Japan and not completely independent from the latter. If further local units of Sony exist within Germany (e.g. local distribution or repair centres or production units), these are to be classified as “establishments” of German headquarters – provided that they’re not legally independent from that headquarters.
8

It is also a completely different case if one company owns another company. Example: TNS Infratest in Munich is a legally independent company which is owned by TNS London and insofar a “daughter company". For the purposes of the survey this kind of relationship is irrelevant. In this case TNS Infratest in Munich would be treated as one "company" (which might have offices in different locations in Germany), but it would not be counted as an "establishment" belonging to TNS London. This is not only valid for international cross-connections of this type, but also for companies owned by another local company. In most commercial business surveys the unit of enquiry is the “company”. Yet, for the European Foundation’s survey on working time, it was decided to strive for the “establishment” as unit of enquiry under all circumstances and in each country to be surveyed. This decision has no implications at all for so called “single-site companies”, i.e. for companies whose activities are confined to one geographical place and who do not have any legally dependent branch offices, production sites, sales units or the like either at the same location or anywhere else in the country. For single-site companies, the terms establishment and company can be used interchangeably.
1.2.2. Considerations in terms of the contents of the study
Several good reasons back the decision to choose the “establishment” as unit of enquiry for a survey on the topic of working-time policies and practices: − While rough guidelines about personnel policy (such as the number of hours to be worked
by full-time employees, the amount of annual leave etc.) are often decided centrally in multi-site companies and apply to all different workplaces, certain details e.g. about the handling of shift-systems or working-time accounts are more likely to be regulated differently in the various local units of an establishment. This is especially true where in the local units different types of work are being carried out (e.g. production-activities in some and administrative activities in others).
− Even where the legal regulations or collective agreements are equally valid for all
establishments belonging to the same company, there may be significant differences in the practical application of these guidelines. These differences may result from differing styles of leadership and working cultures within the several establishments or from different types of work carried out in the various sites. E.g. the intensity of contacts with clients, the use of expensive machinery or the necessity to have to keep up with delivery dates often significantly determine working-time practices. The regulations valid for the mainly administrative staff in the national headquarters of a bank or a supermarket chain for example are likely to differ significantly from those applied in the various branch offices or local super markets all over the country. If the company would have been taken as unit of enquiry in the survey, this would have implied the risk of a significant bias in large multi-site companies: There, answers of the respondent might rather have been referred to the situation in the headquarters than to the situation in the branch offices - which might have
9

led to considerable distortion of the results especially in the production sector and in sectors with direct client contact. Even if in such cases the answers are really given for the whole company there is a risk that respondents rather report policy (i.e. what is supposed to be the case) than practice, because Human Resources managers in the headquarters may either be not very familiar with the actual practice in the branch offices or they may be cautious not to reveal any details concerning the branches. By using an establishment sample instead, survey results are based much more on the local experience and they are interpretable against the background of the specific constraints imposed by the activity carried out in these local units.
− Several questions of the ESWT-questionnaires concern (at least indirectly) the
practicalities of management-employee relations. Although often a certain common philosophy may be identifiable within the various units of a multi-site company, the relationship between management and employees and the general climate often differ widely from establishment to establishment. For this reason, questions concerning that relationship could hardly be answered well by respondents in the headquarters.
1.2.3. Practical implications
The need to build samples at establishment level posed a series of difficulties in some of the countries to be covered by the survey. As will be pointed out more in detail later in this report, interviewing at establishment level not only requires the availability of address-sources which systematically list establishments (and not only the administrative headquarters in case of multi-site companies), but it also implicates the necessity to get statistical background-information on the same level in order to be able to correctly weight the establishment sample. The distinction between companies and establishments has certain implications in quantitative terms, too: Both the overall number of establishments and their distribution among the different cells of the stratification matrix differ quite significantly from the number and distribution of companies3. The stratified sample and even more the weighting-factors may therefore show significant differences between an establishment- and a company-approach. Apart from the strong reasons of contents, this is another argument against an application of a mix of establishment- and company-based samples in a multi-national survey. Table 1.2.3.1 below shows differences in the distribution of companies (enterprises) and establishments (local units) among the various size-classes at the example of Sweden. According to this table, the number of big entities is considerably larger for companies than for establishments since many small or middle-sized establishments may form one large (multi-site) company. In the middle and small size-classes in turn there are much more
3 These differences are more significant in the Services than in the Industries sector, since certain
types of firms in the Service sector have a very large number of branch-offices or sites (e.g. retail trade firms, banks, insurances etc.) while the number of different production sites of firms of the Industries sector is usually much more limited.
10
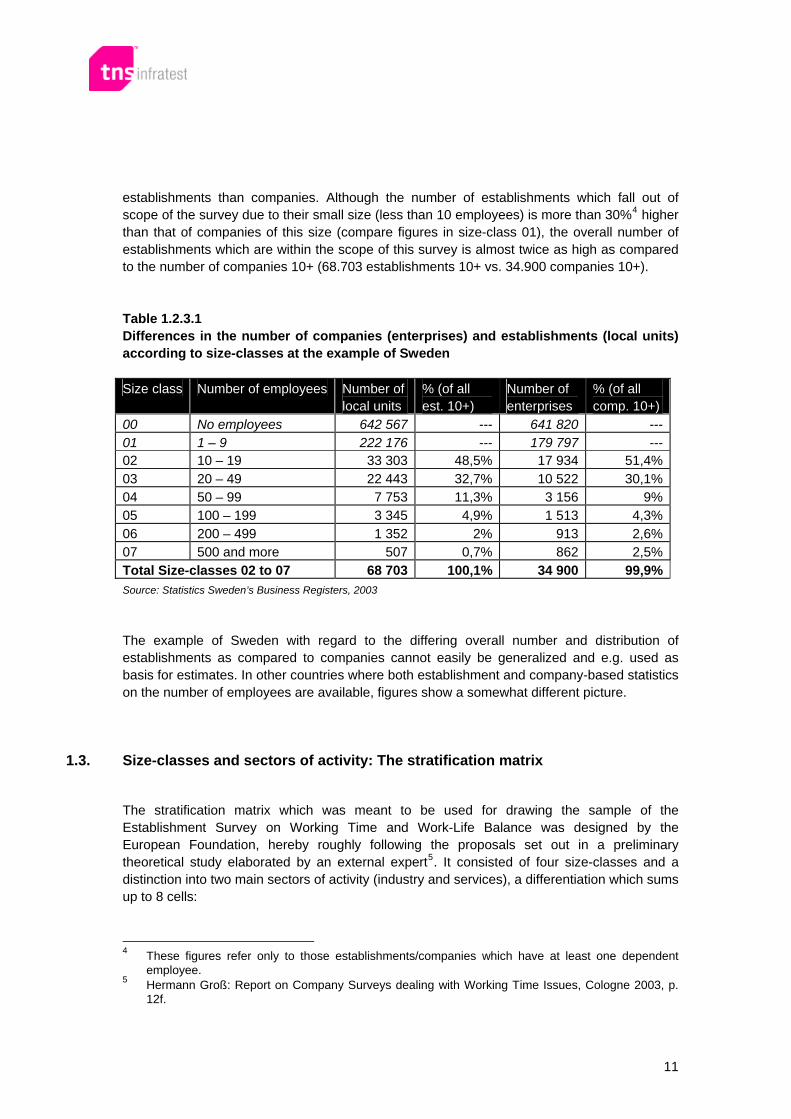
establishments than companies. Although the number of establishments which fall out of scope of the survey due to their small size (less than 10 employees) is more than 30%4 higher than that of companies of this size (compare figures in size-class 01), the overall number of establishments which are within the scope of this survey is almost twice as high as compared to the number of companies 10+ (68.703 establishments 10+ vs. 34.900 companies 10+). Table 1.2.3.1 Differences in the number of companies (enterprises) and establishments (local units) according to size-classes at the example of Sweden Size class Number of employees Number of
local units % (of all est. 10+)
Number of enterprises
% (of all comp. 10+)
00 No employees 642 567 --- 641 820 ---01 1 – 9 222 176 --- 179 797 ---02 10 – 19 33 303 48,5% 17 934 51,4%03 20 – 49 22 443 32,7% 10 522 30,1%04 50 – 99 7 753 11,3% 3 156 9%05 100 – 199 3 345 4,9% 1 513 4,3%06 200 – 499 1 352 2% 913 2,6%07 500 and more 507 0,7% 862 2,5%Total Size-classes 02 to 07 68 703 100,1% 34 900 99,9%Source: Statistics Sweden’s Business Registers, 2003 The example of Sweden with regard to the differing overall number and distribution of establishments as compared to companies cannot easily be generalized and e.g. used as basis for estimates. In other countries where both establishment and company-based statistics on the number of employees are available, figures show a somewhat different picture.
1.3. Size-classes and sectors of activity: The stratification matrix
The stratification matrix which was meant to be used for drawing the sample of the Establishment Survey on Working Time and Work-Life Balance was designed by the European Foundation, hereby roughly following the proposals set out in a preliminary theoretical study elaborated by an external expert5. It consisted of four size-classes and a distinction into two main sectors of activity (industry and services), a differentiation which sums up to 8 cells:
4 These figures refer only to those establishments/companies which have at least one dependent
employee. 5 Hermann Groß: Report on Company Surveys dealing with Working Time Issues, Cologne 2003, p.
12f.
11
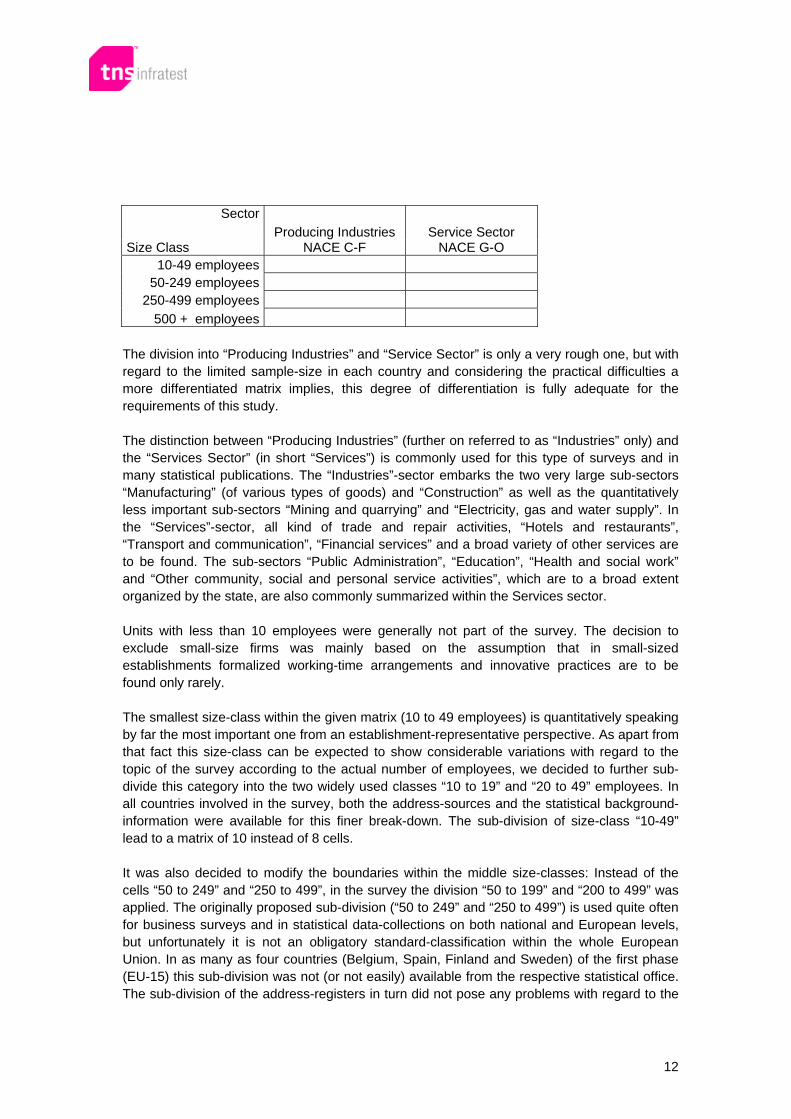
Sector
Producing Industries Service Sector Size Class NACE C-F NACE G-O
10-49 employees 50-249 employees
250-499 employees 500 + employees
The division into “Producing Industries” and “Service Sector” is only a very rough one, but with regard to the limited sample-size in each country and considering the practical difficulties a more differentiated matrix implies, this degree of differentiation is fully adequate for the requirements of this study. The distinction between “Producing Industries” (further on referred to as “Industries” only) and the “Services Sector” (in short “Services”) is commonly used for this type of surveys and in many statistical publications. The “Industries”-sector embarks the two very large sub-sectors “Manufacturing” (of various types of goods) and “Construction” as well as the quantitatively less important sub-sectors “Mining and quarrying” and “Electricity, gas and water supply”. In the “Services”-sector, all kind of trade and repair activities, “Hotels and restaurants”, “Transport and communication”, “Financial services” and a broad variety of other services are to be found. The sub-sectors “Public Administration”, “Education”, “Health and social work” and “Other community, social and personal service activities”, which are to a broad extent organized by the state, are also commonly summarized within the Services sector. Units with less than 10 employees were generally not part of the survey. The decision to exclude small-size firms was mainly based on the assumption that in small-sized establishments formalized working-time arrangements and innovative practices are to be found only rarely. The smallest size-class within the given matrix (10 to 49 employees) is quantitatively speaking by far the most important one from an establishment-representative perspective. As apart from that fact this size-class can be expected to show considerable variations with regard to the topic of the survey according to the actual number of employees, we decided to further sub-divide this category into the two widely used classes “10 to 19” and “20 to 49” employees. In all countries involved in the survey, both the address-sources and the statistical background-information were available for this finer break-down. The sub-division of size-class “10-49” lead to a matrix of 10 instead of 8 cells. It was also decided to modify the boundaries within the middle size-classes: Instead of the cells “50 to 249” and “250 to 499”, in the survey the division “50 to 199” and “200 to 499” was applied. The originally proposed sub-division (“50 to 249” and “250 to 499”) is used quite often for business surveys and in statistical data-collections on both national and European levels, but unfortunately it is not an obligatory standard-classification within the whole European Union. In as many as four countries (Belgium, Spain, Finland and Sweden) of the first phase (EU-15) this sub-division was not (or not easily) available from the respective statistical office. The sub-division of the address-registers in turn did not pose any problems with regard to the
12
boundaries of the size-classes, as for most registers several alternative sub-divisions or even precise - albeit partly outdated - figures on the number of employees in the establishment are provided. For the weighting, it is important to have the same size-classes in both the address-source and the statistical background-information. With the new sub-division of the middle size-bands this congruency of size-classes between both address-source and statistical information on the universe could be upheld in all but two countries6. In another two countries – Denmark and Finland – the statistical offices do not apply either of these two divisions of middle-size classes. There, differentiation according to size-classes ends much earlier, the largest size-class for which stratified information is available for Denmark is 100+, for Finland it is 200+. In these cases, the only way to get figures in the foreseen size-classes is by way of estimations. The same applies for Cyprus where only the size-classes 10 to 49, 50 to 249 and 250+ were available. With the modifications described above, the sampling-matrix finally used for the survey is the following:
Sector Producing Industries Service Sector
Size Class NACE C-F NACE G-O 10-19 employees 20-49 employees
50-199 employees 200-499 employees
500 + employees
1.4. A disproportional sample-design: Definition, advantages and restraints
1.4.1. Employee vs. establishment-proportional sampling and weighting – some general remarks
There are generally two possibilities of sampling and weighting: − one which is “employee proportional” and − one which is “establishment proportional”.
6 The two concerned countries are The United Kingdom and Portugal. In the UK the reason for this
incongruency is that the statistical background information provided to us (a statistics of the address-provider Dun & Bradstreet) turned out to be quite incomplete. Therefore we searched for another, more reliable address-source. We found a more reliable official source, but this source is based on the size-breakdown 249/250. In the case of Portugal, the problem was the late delivery of the statistical background-data.
13

The choice between employee and establishment proportional samples is not arbitrary. Both methods of sampling have their advantages and disadvantages. It depends on the problem in question which aspect is more adequate: The establishment as such or the importance of the establishment measured by its size. Most of the establishment surveys in fact are employee proportional but are analysed as if they were establishment proportional. Unfortunately the results of many establishment surveys are published without giving sufficient information on whether the data are “employee proportional” or “establishment proportional”. We would like to demonstrate the importance of the difference by giving an example:
If – in an employee proportional sample – we find out that 60% of the answering establishments offer the opportunity of phased retirement, this does not mean at all that in reality 60% of all establishments dispose of such an offer, because in the employee proportional sample large establishments (which are more likely to offer a phased retirement-scheme) are overrepresented and small establishments (which are less likely to offer this) are underrepresented. When analysing employee representative data therefore one should better say that “60% of all employees work in establishments which offer phased retirement” – which is a correct statement. Regarding establishments as such one has to transform the sample and will find out that the percentage of establishments with a phased-retirement scheme might be as low as e.g. 30%, which is due to the relatively large number of small establishments in reality. This example is accordingly applicable for establishments having part-time workers or practising other working time arrangements or for the incidence of a formal employee representation within the establishment etc.
For the ESWT it was originally foreseen that the national samples should be strictly proportional to the distribution of employees. In principle an employee proportional sample is certainly an adequate approach for a study about working-time and work-life balance. When using a strict establishment-proportional sample instead, only an extremely low number of interviews would be realized in large establishments with many employees. Interviews would heavily concentrate on the smaller units which might be quite different from larger ones with regard to working-time practices. For the employee-proportional weighting and analyses, the number of interviews realized in the large establishments would be too small to allow any generalizations from the answers of the respondents. In the Belgian example set out below in table 1.4.1.1. in an establishment-proportional sample of 1000 net interviews only 1,6% = 16 interviews in size-class 500+ would have to represent some 27% of all employees in the universe of establishments with 10 or more employees if analyzing the survey-data employee-proportionally. Such an analysis would be unacceptable. Yet, to apply a strict employee proportional sampling within the basic settings of this study has its disadvantages and practical limitations, too. There are several countries where it is practically impossible to meet the requirements of a strict employee-proportional sample, since the absolute number of establishments in the size-class 500+ is not large enough to fulfil the requirements of a strictly employee-proportional sample.
14
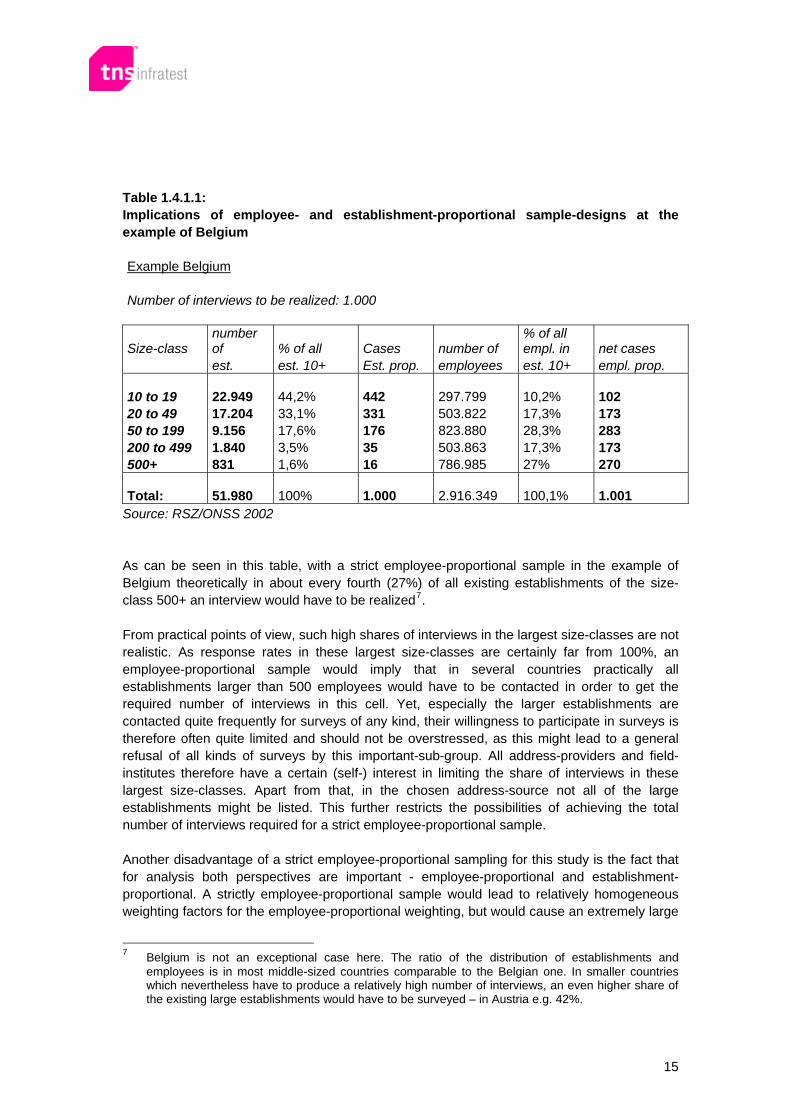
Table 1.4.1.1: Implications of employee- and establishment-proportional sample-designs at the example of Belgium Example Belgium Number of interviews to be realized: 1.000
Size-class number of % of all Cases number of
% of all empl. in net cases
est. est. 10+ Est. prop. employees est. 10+ empl. prop. 10 to 19 22.949 44,2% 442 297.799 10,2% 102 20 to 49 17.204 33,1% 331 503.822 17,3% 173 50 to 199 9.156 17,6% 176 823.880 28,3% 283 200 to 499 1.840 3,5% 35 503.863 17,3% 173 500+ 831 1,6% 16 786.985 27% 270 Total: 51.980 100% 1.000 2.916.349 100,1% 1.001
Source: RSZ/ONSS 2002 As can be seen in this table, with a strict employee-proportional sample in the example of Belgium theoretically in about every fourth (27%) of all existing establishments of the size-class 500+ an interview would have to be realized7. From practical points of view, such high shares of interviews in the largest size-classes are not realistic. As response rates in these largest size-classes are certainly far from 100%, an employee-proportional sample would imply that in several countries practically all establishments larger than 500 employees would have to be contacted in order to get the required number of interviews in this cell. Yet, especially the larger establishments are contacted quite frequently for surveys of any kind, their willingness to participate in surveys is therefore often quite limited and should not be overstressed, as this might lead to a general refusal of all kinds of surveys by this important-sub-group. All address-providers and field-institutes therefore have a certain (self-) interest in limiting the share of interviews in these largest size-classes. Apart from that, in the chosen address-source not all of the large establishments might be listed. This further restricts the possibilities of achieving the total number of interviews required for a strict employee-proportional sample. Another disadvantage of a strict employee-proportional sampling for this study is the fact that for analysis both perspectives are important - employee-proportional and establishment-proportional. A strictly employee-proportional sample would lead to relatively homogeneous weighting factors for the employee-proportional weighting, but would cause an extremely large
7 Belgium is not an exceptional case here. The ratio of the distribution of establishments and
employees is in most middle-sized countries comparable to the Belgian one. In smaller countries which nevertheless have to produce a relatively high number of interviews, an even higher share of the existing large establishments would have to be surveyed – in Austria e.g. 42%.
15
variance of the weighting factors for the establishment-proportional weighting - and vice versa. An extremely large variance has a negative impact on the later analysis since it increases the risk that outliers have too much influence on the findings. We therefore chose a "moderate" employee-proportional stratification of the sample, i.e. large establishments are overrepresented, but not as extremely as it would be the case in a strictly employee-proportional sample. This means that the structure of the sample is something like a compromise between a strict employee-proportional and a strict establishment-proportional approach. With this approach we aimed at reducing the gap between the variance of the weighting factors for both, the employee-proportional and the establishment-proportional weighting.
1.4.2. The weighting of the Establishment Survey on Working-Time and Work-Life Balance: Requirements and practical hindrances
Employee and establishment proportional weighting at national level was carried out with the management data file only. Employee representative interviews were given the same weighting factors as the corresponding management interviews. In order to reproduce real quantitative proportions between the countries for cross-national analysis an additional “international weighting” adjusts the national sample sizes. International weighting is based on the total of establishments respectively employees in each country, taking into account the definition of the universe. The information required for weighting was aimed to be drawn from the available national source(s) of statistical background information (see chapter 3). For this purpose, from each country the following information was needed: − number of employees working in establishments of the defined size-classes and sectors of
activity
− number of all establishments of the respective size-classes, stratified according to sectors of activity
Yet, by far not all national statistical offices in the European Union countries provide the whole spectrum of these data. Especially statistics on the distribution of employees over establishments of the various size-classes are not available in quite a number of countries (Greece, Spain, France, Ireland, Luxembourg, the Netherlands, Portugal and the UK). Where not all required figures were available from the national statistical offices or from any other reliable national source, estimations had to be made on the distribution of employees and/or establishments among the various cells, hereby using alternative sources of information (for more details on the estimations compare chapter 3.3.). In those countries of the first phase where a single address-register could be used to cover all sectors of activity – including the Public Administration – weighting was done with the
16

proposed 10-cell matrix. In a series of countries, however, where a second address-source had to be used for getting addresses for the Public Administration (NACE L / 75), specific quota were set for this sub-sector. For weighting, consequently, in these countries an enhanced matrix of 15 cells (the sectors “Industries”, “Services without Public Administration” and “Public Administration” and 5 size-classes for each of these sectors) was used in order to attribute the proper weight to the interviews with respondents of the Public Administration. In phase 2, the 15-cell matrix was applied to all 6 countries – regardless whether or not an additional address-source had to be used.
1.4.3. The sample-design used for the survey
The sampling-frame finally used for all countries was based on the distribution of establishments and employees in Germany and was adapted to country-specific-structures wherever information on these structures was available at the stage of preparing the samples8. The following table shows the universe of establishments and employees for Germany and the targets set for each cell: Table 1.4.3.1.: Sampling-frame Germany Employees Establ. target target Sector Size Class (share in %) (share in %) (%) (n)
Industry 10 - 19 4,1% 14,8% 10% 150Industry 20 - 49 5,4% 9,2% 10% 150Industry 50 - 199 8,7% 4,5% 12% 180Industry 200 - 499 5,7% 0,9% 5% 75Industry 500 + 10,5% 0,4% 4% 60Services 10 - 19 10,3% 38,4% 16% 240Services 20 - 49 12,3% 19,8% 16% 240Services 50 - 199 18,3% 9,7% 13% 195Services 200 - 499 10,4% 1,7% 9% 135Services 500 + 14,4% 0,6% 5% 75Total 100,1% 100,0% 100% 1.500Source for the distribution of establishments and employees: IAB 2003 With the chosen sampling-frame, the “Industries” sector is somewhat over-sampled in most countries in order to have a sufficiently high number of interviews in all cells of this sector for weighting.
8 In the second phase of the study, this information was made available before the start of field-work
in all 6 countries.
17
1.5. Information in address-registers: Size-class and sector of activity
For the purposes of this survey, the address-source to be used had to contain information on both the size-class and the sector of activity for each listed address. If this information (or part of it) is lacking, it is extremely time-consuming and costly to carry out interviews according to the set stratification matrix: If an address-register contains information on the size-class, but not on the sector of activity each address belongs to, the only criterion for a pre-selection of the addresses and for drawing the sample is the size-class. In such a case, a random sample has to be drawn from all establishments listed within a size-class. Information on the sector then has to be gathered during the interview-phase by inserting a question about the main activity of the contacted establishment into the questionnaire. The answers to this question then have to be regularly coded in order to enable a daily count of the realized interviews by sectors and size-classes. While this procedure works fairly well at the beginning of the field-phase, difficulties begin as soon as the first cells (defined by the size-class and by the information about the sector as given in the interview) are completed. From this point on, all further interviews have to be filtered to “end” if the chosen respondent belongs to a cell where the required number of interviews is already accomplished. Further interviews can then only be realized in the remaining “open” cells. With each completed cell, it gets more and more difficult to fill the remaining cells, as the number of contacts with establishments of sectors which are not needed any more is continually rising. For the completion of the last few cells, an enormous amount of futile contacts is almost inevitable. Address registers, where information on the sector of activity is given, but on company-level only, are less problematic. In such cases, it can be assumed that the establishment belongs to the same sector of activity as the company it is part of. Of course there might be a certain number of establishments with a differing main activity, but these cases can be expected to be of a negligible quantity and of minor importance with regard to the requirements of this study. Missing information about the number of employees for each address is still more problematic than the lack of information on the sector. In principle, an equivalent procedure as described above for registers without information on the sector of activity could be applied. Yet, as establishments with less than 10 employees are not included in this survey, from the very beginning of the field-phase on a large number of interviews would have to be filtered to the end because the contacted establishments do not surpass the size-threshold. This problem is even much more accentuated in a disproportional sample-design as applied in this study (for details about the dimension of such futile contacts see chapter 4.1.3., step 4). If an address-register does contain information on the size, but on company level only, the problem is basically the same9.
9 Even if it is known that a listed company consists of e.g. 3 establishments with a total of only 15
employees, this address cannot be excluded a priori as it is not known for sure whether all three establishments fall below the size-threshold of 10 employees. It might as well be the case that one of these establishments has 10 or 12 employees while the others have only one, two or three employees.
18
1.6. Coverage of sectors of activity: Completeness at any price?
The approach to include all sectors of activity in a survey of establishments has the evident advantage that one can state to have comparable cross-national data which are representative of the whole economy in the covered countries. Yet, in practice, only very few establishment or company surveys really cover the whole economy without any limitations with regard to sectors. Certain sectors or sub-sectors of activity are frequently not included. The reasons for this are mostly of a practical nature: − Some (sub-) sectors are hard to survey due to an insufficient coverage by any of the
available address-registers (like e.g. agriculture) or because the adequate respondents are frequently not available for one or the other reason (e.g. in “Forestry” or “Fishing”).
− In a few (sub-)sectors it is hardly possible to get any interviews due to internal regulations which prohibit employees to take part in external surveys of any kind. This is especially the case in many establishments of NACE Q (extra-territorial organizations and bodies) and in those parts of the Public Administration which belong to the security sector (police, military, secret services and the like). Contacting such establishments for interviews leads to an extremely high rate of refusals.
− For certain topics it does not make much sense to include particular groups of establishments in a general survey because the type of work they are carrying out or the nature of their working-relations are of a very specific nature and their inclusion would lead to quite distorted results.
For the survey on working-time and work-life balance, the original aim was to include all sectors of activity. Yet, during the preparatory phase it was decided to exclude a couple of (sub-) sectors because they’re hardly accessible and/or of minor importance with regard to the topic of the study: The most significant sectors not to be included are “Agriculture, hunting and forestry” (NACE A respectively NACE 01) and “Fishing” (NACE B / 02). While the latter is of a negligible dimension in all 15 countries involved in the study (<1% of all employees), the quantitative importance of the agricultural sector is varying widely within the 15 countries which were surveyed: While in most of the larger industrialized countries like Germany, the Netherlands or the United Kingdom the proportion of all people in gainful employment to be classified within this sector is well below 3%, in some Mediterranean countries the share is still considerably higher (12,5%10 in Portugal and 15,8% in Greece) and far from being negligible. Yet, especially in the latter countries only an extremely small proportion of establishments within this sector surpasses the size-limit of 10 employees11. Moreover, the vast majority of those
10 Percentages are taken from: “Statistisches Jahrbuch 2003”, Chapter 3.3. 11 According to data of the Labour Force Survey 2004 some 533.500 people are working in the
Agricultural Sector in Greece, but hereof only 8.220 are working in units larger than 9 employees.
19

people working in the agricultural sector are family members12. The working-time regimes of these family members are hardly comparable to those of other, dependent employees. For these reasons, it was decided that it would not be worthwhile to face the access-problems which in most countries exist for interviews in the agricultural sector. Another sector which was not included in the survey is NACE P “Activities of households”. The vast majority of “establishments” of this size consists of only one person, only extremely few – if any - of them surpass the 10+ threshold13. The “Public Administration” (NACE L / 75) is a further and the quantitatively most important sector which is often excluded in establishment or company surveys – mainly due to practical problems of getting access to addresses and statistical background information for this type of entities. The Public Administration is to be clearly distinguished from the “Public Sector” as a whole. While the latter refers to all establishments owned by the state and may include establishments from a large variety of (sub-)sectors of activity (e.g. transport, post and telecommunications, education, health and social work), the Public Administration as such comprises the following sub-categories according to the NACE-classification: NACE L = NACE 75: Public administration and defence; compulsory social security NACE 751: Administration of the State and the economic and social policy of the community NACE 752: Provision of services to the community as a whole NACE 753: Compulsory social security activities Yet, even in this narrow definition, the relative importance of this sector with regard to employment structures is considerable: According to Labour Force Survey data of the year 2002, in the 15 EU-countries a remarkable average of 7,6% of all employees is working in this sector (the percentage is ranging from 5,1% in Ireland to 11,2% in Luxembourg)14. I.e. that in a strictly employee-representative sample of 1000 interviews on average 76 interviews would have to be made in this sector. Due to the quantitatively significant share of employees working in establishments of the Public Administration and due to some strong reasons as regards content15, it was opted to include this sector in the ESWT. This decision implicated some major challenges with regard to sampling and weighting:
12 The share of family members among the workforce in this sector is about 90% EU-wide, in Greece it
is as high as 99%. Numbers on the agricultural sector taken from: Statistical Yearbook Agriculture 1992-2001, Chapter 4.14
13 According to figures of the Labour Force Survey 2004. 14 These figures refer to employees in all establishments, not only in those with 10 or more employees. 15 The main reason with regard to the content of the study is that in many countries the Public Sector
and especially the Public Administration has a pioneering role with regard to working-time regimes. Regulations are often especially employee-friendly there.
20
− The definition of the unit of enquiry (i.e. especially the distinction between establishments and companies) is very difficult in some organizations of the public administration and may vary widely according to the general organization of the state. (compare chapter 1.2.1).
− In a number of countries (Belgium, Greece, Luxembourg, The Netherlands and Portugal), establishments of the public administration are not included in the best available address-sources. In these cases, addresses for this sector had to be drawn from alternative sources such as the Yellow Pages or other Yellow-Pages based commercial address-registers. The major problems with these address-sources – a lack of information on size-class and an often differing logic of classification of the activity – are set out more in detail below in chapter 2.1.3 (a).
− Reliable stratified statistical background information on the universe of establishments (or companies) in the Public Administration is hard to find in several countries. In some countries, such information does obviously either not exist at all in the required form (i.e. establishments stratified by size-classes) or it is not made public.
21

2. The address registers
2.1. Types of address-registers
Hermann Groß states in his preliminary study for the European Survey on Working-Time and Work-Life Balance on behalf of the Foundation, that “(…) it is recommendable to take the most recent and most comprehensive directory of all establishments with 1 or more employees in the countries under investigation" (Groß 2003, p. 13). This at the first glance simple and obvious demand is not as easy to fulfil as it seems to be. In most countries there is absolutely no choice between different registers of establishments, so the topicality of the addresses or the comprehensiveness of a register cannot be applied as decisive criteria there. In a couple of countries, there is rather no establishment register at all. Topicality fortunately was not a real problem with any of the registers finally chosen for this study. All registers proved to be reasonably up-to-date, the oldest register used for the survey dates from the year 2001. Most of the other registers are updated at least once a year, sometimes even quarterly or weekly. Yet, it has to be stated that the scope and quality of the updates varies widely: While some registers are up-dated by actively contacting all establishments - e.g. via telephone interviews or via mail-questionnaires – in other cases up-dates are only made for those units which report changes on their own initiative. Practice has shown that in several registers which claimed to be updated on a regular basis, firms which were dissolved or went bankrupt were not de-registered at all. Also, significant augmentations or diminutions of the workforce were not reported to the institution responsible for maintaining the address-register. With regard to comprehensiveness, a judgement of the different sources is quite difficult. The total number of entries e.g. is only a very weak indicator for the completeness of an address-register as long as the register does not embark all establishments in the country. If the latter is not the case, entries might be concentrated on specific types of establishments. For example there might be a good coverage of large establishments, but an only poor coverage of the smaller ones (or vice versa). Or registers might be complete for certain sectors of activity but include only very few addresses of others. Other possible criteria for inclusion or exclusion of establishments might be their legal status, their geographical location within the country, the amount of turnover, the fact whether they are paying taxes to the national tax office or whether or not they are enrolled in the trade-register. In order to be suitable for the purposes of this study, an address-register needn’t list all addresses of establishments (with 10 or more employees) – although this of course would be the ideal case. A selection of establishments is absolutely sufficient as long as this selection a) does not systematically exclude or heavily under-represent sectors which are relevant for
the intended study
22

b) is based on known and controllable criteria for inclusion or exclusion and
c) is large enough in order to allow a random selection of respondents in different cells (size-class/sector of activity).
According to availability, addresses for this survey were drawn from sources which can roughly be divided into three categories: 1. Official and semi-official address-registers 2. Address-registers compiled and maintained by private research institutes and 3. Address-registers bought from commercial external suppliers. Each of these types of address-registers is designed for specific purposes and under certain restrictions and consequently has its specific advantages and shortcomings.
2.1.1. Official and semi-official registers
Official and semi-official registers of companies or establishments are registers initiated and maintained by stately owned or (co-) financed bodies such as the National Statistical Offices, National Social Security Services, the Chambers of Commerce16 or the like. The registers compiled by such institutes are often a by-product of the proper task of the corresponding institutions (e.g. administration and collection of social security contributions or taxes). Frequently, the registers serve as basis for the compilation of statistics which are needed by political decision-makers as base of knowledge on the structure of the economy. Although in quite a number of countries such official or semi-official address-sources do exist, they are not always available for survey purposes. Data protection legislation and practical hindrances such as a widely decentralized collection and storage of data often impede their use for survey purposes. The main advantage of this type of sources is their completeness: As the registration is usually compulsory for all legally registered companies (or at least clearly defined sub-groups of the economy) operating in the country, in most cases there are no serious shortcomings regarding the coverage of sectors or size-classes. Yet one quantitatively important sector of activity which is relevant for the ESWT-study but in quite a number of cases not covered by this type of address-sources is the Public Administration (NACE 75). This is partly due to the fact that its employees are mostly civil servants for which certain administrative tasks such as the registration for social security are not relevant. Experiences made during the survey have shown that for similar reasons two further sectors with a high share of publicly owned
16 The Chambers of Commerce are classified here as a “semi-official” source. The Chambers are
usually not entities of the state, but not-for-profit business federations organised and at least partly financed by the entrepreneurs themselves. Yet, in a couple of countries the state attributes certain tasks to them which he otherwise would have to do on his own. In Germany e.g. membership in the Chambers of Commerce (IHK) is compulsory and regulated by law and a series of functions is delegated from the state to the Chambers.
23

organisations – NACE M (Education) and NACE N (Health and Social Work) - are clearly under-represented in some of the official address-sources (e.g. in Portugal and Hungary). Official or semi-official address-registers were used in Cyprus, France, Latvia, Hungary, Portugal, the Netherlands and Sweden.
2.1.2. Registers built up by research institutes
Another type of address-registers used for the purpose of this survey are registers which are compiled and maintained by private research institutes. As registers of this type are built up and maintained especially for the purpose of conducting interviews, they are usually a very good source to draw addresses from. Address-sources of this type mostly do not claim absolute completeness, as this would require an enormous investment of time and money. Besides, a private institute can’t oblige firms to registration. These compilations therefore are based on other sources, on voluntary registrations and/or on own interview-activities. Nevertheless, these institutes guarantee to provide addresses which are not arbitrarily selected, but chosen according to a strict (random) logic which guarantees their representativeness. The sub-selections are usually large enough to allow a random selection of addresses even for very large surveys. The addresses these registers contain usually provide ample information about size-class, sectors of activity and address-details such as telephone numbers or sometimes even names and direct telephone numbers of managers. Yet, as most surveys with representatives of enterprises are of a commercial nature, certain sectors of activity which are rarely of interest for commercial surveys (e.g. Public Administration and Agriculture) tend to be underrepresented or are excluded. Compared to externally bought non-official address-registers, the main advantage of these “own” registers is that the shortcomings of the source are well known to the institute and can therefore be evened out to a certain extent, e.g. by over-sampling “weak” cells or by using additional sources for addresses of missing sub-sectors. This type of address-sources was used for the survey in Greece and Germany.
2.1.3. Commercial address-providers
The third group of address-registers are those built up and maintained by commercial address-providers. The customers of such address-bases are e.g. marketing and advertisement companies, but often they are also used for representative research. Among this type of registers, basically three sub-types can be distinguished:
24

(a) Yellow Pages-based address-registers,
(b) Registers based on economic balances and other economic data (e.g. entries in the national trade-registers), sometimes supplemented by voluntary self-registrations for commercial purposes
(c) “Advanced suppliers” which use multiple types of sources to compile their address-lists This distinction is only a theoretical one and boundaries especially between (b) and (c) are fluid. (a) Yellow Pages based address-registers The Yellow Pages based address-registers are based on the voluntary entries of companies in the so called “Yellow Pages”. As is widely known, the Yellow Pages are telephone books which contain telephone numbers of businesses, doctors, lawyers etc. and are provided to households which hold an active telephone line. The entries in these registers are therefore oriented mainly towards the end-user, which means that the addresses they contain usually are categorised in a way which first and foremost enables individuals to easily find providers of specific products and services. These categorizations are often not easy to transform into an internationally acknowledged codification such as NACE, because e.g. production and sales units are often not distinguishable in these registers as they are summarized under one and the same category. (E.g. under the category “furniture” carpenters and furniture factories might be found as well as mere furniture shops, under “automobiles” car factories might be listed side by side with car sales units etc.) The orientation of the Yellow Pages towards the end-user usually also implies that in some sectors of activity – namely in those where the bulk of activities is directly aimed at the end-user – establishments are listed much more completely than in others. Especially establishments of the producing sector (e.g. car factories or the construction of industrial machinery) tend to be under-represented because their self-interest in being publicly accessible by private end-consumers is quite limited as long as they are only suppliers for other factories or sell their goods exclusively to other businesses or wholesalers and not to the end-user. On the other hand, frequently establishments especially of the service-sector are listed twice or even more times because classification in these registers is often not limited to one “main activity” (as in official registers). Since there are no binding rules for the classification, a business can chose by itself under which categories it wants to be listed. (A large department store for example may be listed separately under each type of merchandise it offers for sale, such as bicycles, cosmetics, clothing etc.). The duplicates resulting from this are hard to find out, as the addresses are not always listed under exactly the same name. In any case, the cleaning of these address-registers and their preparation for the sampling of an establishment survey would be very time-consuming and costly and results might nevertheless be rather unsatisfying. Without cleaning the data, the register would be quite worthless from
25

the statistical point of view because the often large number of multiple entries would significantly distort the sample in favour of certain types of establishments17. A further and even more relevant disadvantage of Yellow-Pages based address-sources is that they frequently do not include any information on the number of employees working in the listed establishments. The problems this implicates in practice for a survey with a disproportional sample and a limitation to establishments of a certain minimum size (here: 10 employees) are outlined in detail in chapter 4.2.2. The main advantage of this type of address-register is the topicality of its entries and especially of the telephone numbers. Listed firms have a strong self-interest in keeping their entry up-to-date, as they are an important means for the contact with customers and for gaining new clients. For those sectors of activity which are in close contact with the private customer, Yellow Pages are all in all a very comprehensive source of addresses. In many countries, this is even valid for the bulk of organizations belonging to the Public Administration – a sector which is often not or only very selectively covered by other address-sources. In a couple of countries (e.g. Austria and Italy) address registers are available which are based on the Yellow Pages, but adapted to the requirements of business surveys. In these registers the telephone numbers are supplemented by further information on the number of employees (albeit sometimes only for a part of the listed establishments) and the logic of classification by sector of activity has been adapted to the NACE-code or another widely used codification of activities. (b) Registers based on economic balances and other economic data A second type of commercial address-registers is based on published business-information like entries in the official trade register, economic balances or other economical data, sometimes supplemented and verified by own research activities. The best known address-provider of this category is the internationally operating firm Dun & Bradstreet18. Other providers which can be attributed to this sub-category are Schober, Bill Moss (Ireland) or Hoppenstedt. Sources of this type often show a quite selective coverage of companies with regard to the size-classes: Whereas in the Yellow Pages-based registers small companies are covered quite well, address-sources which are mainly based on economical registers tend to be concentrated on units with a high financial turnover and/or a large number of employees. Unfortunately, many of these address-providers do not provide clear information about which types of companies are not listed or clearly under-represented in their registers and about the extent of under-representation. This poses some difficulties on the drawing of samples which
17 E.g. in the case of sales activities stores with a broad variety of offered goods would be over-
represented. 18 The general attribution of Dun & Bradstreet to one of these theoretical sub-categories of commercial
registers is a bit arbitrary, as in some countries these registers are compiled from a broad variety of sources – depending on the availability – while in others their basis is much narrower as far as we’re informed.
26

are to follow strict requirements of representativeness, since the chances of some types of businesses to be chosen for interview tend to be much higher than those of others. Due to the lack of precise information on coverage, it is hardly possible to adequately compensate for these distortions. In the United Kingdom, which is the only country where Dun & Bradstreet was used for the ESWT, the Dun & Bradstreet registers recur – among others - to business registration data provided by Public Record Offices. Dun & Bradstreet addresses for the UK can therefore be regarded as more comprehensive and reliable than those for some other countries and – most important - unlike in the bulk of other countries where according to our information this is not the case, they cover both companies and establishments quite systematically. The experiences TNS Infratest has made in other b2b-studies suggest that in some sectors of activity the response-rates of establishments or companies of this type of address-sources is considerably lower than in others because they are contacted very frequently with surveys of a commercial nature. This can especially be expected with IT-companies or with the modern media sector (production, distribution, services etc.) in general – sectors which in several countries suffered from a heavy over-research in recent years. (c) Advanced suppliers which use multiple types of sources to compile their address-lists. The restrictions named for commercial registers of sub-type (a) or (b) mostly do not apply to the commercial sources of type (c). Registers of this type combine entries from a broad variety of publicly accessible sources of economical data such as debtor’s registries or lists of companies quoted at the stock market, entries in telephone books or voluntary entries of companies/establishments with official data-sources such as listings in the official national register of companies or tax-register. Due to the multiple sources they use for getting addresses – usually including official sources with entries which are obligatory for at least a broad part of the economy - they reach a high level of comprehensiveness and overall quality. In 12 of the 21 countries covered by this survey, addresses from commercial address-providers of either one of the mentioned sub-types were used as main or sole address-register - either because of the confirmed high quality of this source or because no other sources were accessible in the country. The respective countries are Belgium, the Czech Republic, Denmark, Spain, Ireland, Italy, Luxembourg, Austria, Poland, Slovenia, Finland and the United Kingdom. Of (for details on the sources compare chapter 5: “The countries”).
27

2.2. Compatibility of sector-classifications used in the address-sources with NACE
The standard system for the statistical classification of economic activities in the European Union is NACE (Nomenclature générale des activités économiques dans les Communautés Européennes) in its first revision of 1990 (NACE Rev.1). The stratification matrix chosen for sampling and weighting the ESWT is therefore based on NACE Rev.1. But although the use of the NACE-classification is in principle obligatory for all official statistical data dispersed in the EU since 1993, some address-registers nevertheless still stick to other officially acknowledged national or international codification systems. This is e.g. the case of the German AMS-Master-Sample, which is codified with the WZ 93-codes or with Dun & Bradstreet, which uses SIC codes, another internationally acknowledged system of codifying economic activities. Even some official address-registers such as the French SIRENE directory are still classified according to national systems (here: the French NAF codes). Nevertheless, none of these official national or international codes presented any problem with regard to the sampling and weighting of the ESWT since all these alternative systems of codification are well adaptable to NACE. There is not always a 100%-congruency with NACE, but existing differences are confined to the finer levels of classification (third and especially fourth digit of NACE). For sampling, weighting and analyzing the Establishment Survey on Working-Time and Work-Life Balance, these finer codifications were not needed because in a survey with a maximum of 1500 cases per country, the number of cases realized in any NACE 3- or 4-digit category would be far too low to draw any specific conclusions from that. Some commercial address-providers codify their addresses not to any of the acknowledged national or international systems, but use their own specific codifications. Examples for this are the KOMPASS–directory in Italy and Schober in Spain. Yet since many European business surveys are based on the NACE codification meanwhile, both KOMPASS and Schober have established equivalences between their system of codification and the NACE codes as far as possible. In some more detailed sub-divisions, one or the other of these categories might not be exactly corresponding with NACE, but again for the purposes of this study the established degree of equivalence is certainly sufficient. A more problematic issue was the codification of addresses taken from either the Yellow- or the White-Pages telephone books or other address-bases which are based on telephone-registers. Yet, such registers were used in a couple of countries for the addresses of the Public Administration only and never for the entire economy. For these establishments of NACE L, the Yellow- or White-Pages entries (with topics such “municipalities”, “police-stations” or the like) had to be converted manually into NACE-codes. Carrying out such a manual conversion was a viable solution for this limited sub-sector, for a broader spectrum of sectors of activity it would have implied an enormous load of extra-work. The congruency of the sectors of activity contained in the various address-sources with the NACE-code is extremely important for this survey, as it was decided not to integrate a question about the kind of activity carried out in the surveyed establishments. Instead, the codes of activity as contained in the address-sources were added to the questionnaires. This
28

procedure saved valuable interviewing-time and is in most cases more accurate than asking a question about the type of activity to the respondents – provided that the codes in the different address-sources from the various countries are all referring to exactly the same type of activity. At least up to a NACE 2-digit classification, which is the degree of differentiation used for the data, this congruency with NACE is given in all 15 countries.
2.3. Coverage of size-classes by the address-sources
Generally, all chosen address-sources cover the whole range of establishments with 10 or more employees from quite small workshops to huge enterprises, albeit with some deviations with regard to the definition of size-classes (cf. chapter 1.3. above). Yet, wherever not all establishments are covered, the relative coverage of establishments might be lower in some size-classes than in others. Especially commercial address-providers do usually not provide information on the degree of coverage of the various size-classes. Yet, from the nature of the data-bases used for the compilation of an address-register, assumptions can be made: While in address-registers which are mainly based on economical data, smaller units tend to be underrepresented, in Yellow-Pages based registers an under-representation of larger units in the producing sector can be expected. Some official address-registers also show a certain degree of under-representation of smaller units.
2.4. Coverage of sectors of activity by the address-sources
As already pointed out in chapter 1.6., in a couple of countries the best available address-sources do not cover the Public Administration (NACE L). This phenomenon is not restricted to one specific type of address-sources, but concerns address-sources of all the mentioned types: Whereas in Belgium and Luxembourg it is an external commercial source which shows this weakness, in Greece it is the address-compilation of the research-institute and in Cyprus, The Netherlands and Portugal official or semi-official sources. The weaknesses of the registers with regard to the degree of coverage of single sectors of activity were already outlined in the previous chapters dedicated to the various types of sources and are described more in detail in chapter 5 (“The countries”). Generally, it has to be stated that among those sources which do not have a practically full coverage of all establishments, it is very difficult to judge the degree of coverage of certain sectors if there is no detailed, stratified information on that. Another hindrance for an exact evaluation of the address-sources with regard to coverage is that especially commercial sources apply not always a clear and consistent distinction between companies, establishments, departments etc. Therefore e.g. one or the other establishment might be contained more than once in the register while others might not be contained e.g. because their legal status with regard to other parts of the firm is not exactly known.
29
3. Statistical background information
3.1. Sources for statistical background information
In almost all countries involved in this study, the statistical background information on the universe was taken from the respective national statistical office. The quality of these statistics varies from country to country as there is no standardized mode of data collection on businesses valid for all EU-countries. While in some countries the official statistics are based on compulsory registrations of all active enterprises or on a nationwide census of companies or establishments, there are other countries where such obligatory forms of data-gathering do not exist. One of the weakest points of the statistics provided by the national statistical offices are often enterprises and institutions which belong to the public sector, namely the public administration in the narrower sense. Even in countries where entries are obligatory for private firms, entities of the public administration are not necessarily listed comprehensively. Where the national statistical office does not provide any stratified information on the number of establishments, nation-wide surveys carried out in establishments are a theoretical alternative to provide such data instead - provided that these survey-data are of a reliable quality and based on a sufficiently large number of interviews. In Germany for example, no complete, sufficiently stratified official statistics exists – neither on establishment nor on company level. The best proxy to get the necessary statistical background data is therefore the “IAB Betriebspanel”, a large survey of establishments conducted annually in all sectors of the German economy. In countries in which stratified official statistics or reliable survey-data on the universe of establishments or companies do not exist, the statistics of private address-providers were used as a “second best” alternative for getting the necessary data. Yet, where these statistics are not based on official data, they are likely to show the same limitations and shortcomings with respect to completeness as the address-registers which they are based on. Statistics of address-providers mostly show only the distribution of the companies or establishments, but not the distribution of employees over the size-classes. The only case where no official statistics were available and where therefore the statistics of a commercial address-provider had to be used, was the Services sector in Ireland. In Greece an official statistics on the distribution of companies was available from the Statistical Office, but the statistics based on the research-institute’s address-register turned out to be more complete than the outdated figures of the national statistical office NSSG which had their last systematic up-date in 1995. In all other countries, official sources could be found and were used for the weighting of the survey. A further potential source of information are surveys among individuals which contain questions about their working-situation, including questions on the characteristics of the establishment where they are employed, such as type of activity or number of persons employed in the unit. The by far largest survey of this kind is the Labour Force Survey.
30

3.2. Data of the Labour Force Survey
For those countries where figures about the distribution of employees over establishments of the different size-classes were not available from the national statistical offices, we used data of the Labour Force Survey as a proxy for this distribution. The Labour Force Survey (LFS) is a large-scale survey among the population which is continually carried out in all EU-15 countries since many years and more recently also in the new EU member-states. It is coordinated by Eurostat, the Statistical Office of the European Union. In the various countries, the national statistical offices are organizing the survey. On basis of the results of these interviews, the statistical offices elaborate estimates of the total number of employees in the various cells. The LFS is a survey among individuals. Respondents are asked for the total number of employees working in the local unit they are working at as well as for the economic activity of this unit. The former is a difficult question for employees – especially for those working in multi-site enterprises. Therefore the LFS contains not very detailed information on the establishment size: Only if there are not more than 10 employees in the establishment, the LFS questionnaire asks for the exact number. Above this threshold information is available only for the size-classes 11-19, 20-49 and 50+. Additionally, a category “unknown but more than 10” is available. For the purpose of the ESWT this means that for the size-classes 10 to 19 and 20 to 49 employees quite precise figures on the distribution of employees are available, while for the three larger size-classes (50 to 199, 200 to 499 and 500+) only the sum of employed persons is available – without any information on their distribution among these three groups. LFS data on the distribution of employees over the different size classes are not published, but available on demand. We originally bought data from the 2002 LFS which then were the latest data available and used them for the employee-representative weighting of the EU-15 part of the survey. Later, additionally the data of the years 2003 and 2004 were acquired and used in those countries where the LFS-data of 2002 showed considerable weaknesses (France and the Netherlands). For all those countries of the second phase where no stratified information on the distribution of employees was available, LFS data of the year 2004 were used (the Czech Republic, Cyprus, Hungary, Poland and Slovenia).
31

Analysis of the LFS data shows that the quality varies largely across the countries: − While in some countries (B, EL, A, PT, CY, LV, HU and PL) there are no missing answers
at all in this question, in other countries the number of missing answers is quite high (LFS 2002: IRL: 8%, UK: 10%, F: 21%19 of all employed persons). For NL absolutely no information on the breakdown by size classes is available from the LFS 2002, while the LFS-data of 2004 show the distribution among size-classes without differentiation with regard to sectors of activity.
− In some countries (D, IRL, I, A, FIN, SI) there are no cases in the category "unknown > 10". In other countries relatively high shares of employees can be found in this category (LFS 2002: F: 13%, E: 15%, P: 40%).
Despite these shortcomings the LFS data had to be used in several countries for best estimations of the distribution of employees over the different size classes, since for these countries the LFS was the only possibility to get the required information on the distribution of the workforce. The LFS-data provided us at least with figures for the number of employees in the two smallest size-classes of the survey (10–19 and 20-49 employees). Additionally, the figures given for the very broad size-class 50+ served as a base for an estimation of the distribution in the three larger size-classes used in the ESWT (50-199, 200-499 and 500+) in those countries where no other data were available.
3.3. Some remarks on estimations
As already outlined, statistical background data on both the universe of establishments of different sectors and size-classes in a country and the universe of employees in the same distribution were not in all countries available: − In some countries (Finland, Denmark and Cyprus) only the distribution for the smaller
size-classes is available, while there is no further differentiation of the data for the two larger size-classes: In Finland the differentiation ends with a size-category 200+ for both establishment- and employee-statistics. For Denmark, the differentiation already ends with a summarizing size-category 100+ in the employee statistics, whereas for the number of establishments the required differentiation is available. In Cyprus, the establishment statistics ends with 250+ as largest size-class.
− In a couple of countries (Spain, France, the Netherlands, the UK, Cyprus and Slovenia) the distribution of establishments is available in the required form, but no differentiated figures on the universe of employees according to sectors and size-classes. While for Spain official figures on the distribution of employees among the size-classes at least exist for the total of all sectors of activity (albeit in the somewhat differing size-bands 1 to 10, 11 to 50, 51 to 250 and 251+ only), for the other countries of this group we could not get
19 In the LFS of 2004 the share of “No Answer” for France decreased to 4,2%.
32
other than the LFS-figures.
− In a series of other countries the statistical offices or address-providers provide only figures on company-level. In the countries of this group, different degrees of availability of statistics have to distinguished: − In Portugal and the Czech Republic, statistics on both employees and units are
available, but both are provided at company-level only. − In Ireland, statistics are available for the distribution of companies, but not for the
distribution of employees (neither on establishment nor on company-level). Yet, for the Industries-sector – albeit without the quite large sub-sector “Construction” (NACE F / 45) – the statistical office conducted an industrial census in the year 2000 which provides figures on the number and distribution of establishments within this sector.
− For Luxembourg, Greece and Hungary, there are official figures on the distribution of companies, but none for the employees.
− For Poland, figures on the distribution of companies are provided, but only in the following differentiation: 10 to 49, 50 to 249, 250 to 999 and 1000+ employees. Figures on the distribution of employees are given only for the total universe of employees in companies 10+, not further differentiating into size-classes.
Countries for which all necessary statistical information was available in exactly the required form were Belgium, Germany, Italy, Austria, Sweden and – albeit with some doubts with regard to the distributions – Latvia. In order to be able to attribute the correct weights to the interview-data of all countries, we had to find solutions for the elaboration of the weighting-matrix for those countries where not all necessary statistical information was available or where the available information was not stratified in the way required for the survey. In these countries, the only way of achieving a solid base for weighting was by means of estimations. These estimations were made according to the following general rules: − In those countries from which we had reliable, but insufficiently stratified statistics on the
distribution of either establishments or employees, the given figures on the broader categories (e.g. establishments 200+ in Finland) were used. As a general rule, the total of units in these broader categories was then distributed in the required finer differentiation according to the ratio in those countries where this finer distribution is provided.
− In countries where statistics on the distribution of establishments across the various
sectors and size-classes were available, but no (sufficiently stratified) information on the distribution of employees, the first option was to use the Labour Force Survey data instead. In these cases, the differentiation of the LFS-data for the size-classes above 50 employees had to be estimated. These estimations were oriented on the distribution in other countries where official figures existed for all size-classes. Additionally a cross-check was made by calculating the average number of employees in establishments of the different size-classes (i.e. the average size e.g. of the size-class 10 to 19 as resulting from the division of the number of employees through the number of establishments within the same size-class).
33

− In those countries where no statistics on the distribution of companies were available we
had to make estimations for the distribution of establishments. The existing figures about the number and structure of companies turned out to be of very limited value only, because there is no reliable key for calculating the number of establishments from a given number of companies. A comparison of establishment statistics with company statistics in those few countries for which both distributions are available (Belgium, Sweden, Latvia and – albeit with only a very rough differentiation – Spain) shows that no uniform pattern can be found for the relation between both structures. Estimations for the distribution of establishments therefore had to be made on base of the distribution of employees as given by the LFS or other sources. For this purpose, the LFS-figures on the numbers of employees per cell of the stratification matrix were divided by the average number of employees in these cells as derived from other countries with reliable statistics. The average number of employees within each cell proved to be a remarkable stable variable for the estimations. Variations from country to country are in close limits, especially for the small and middle size-classes.
In those countries where an additional screening procedure was carried out (for details cf. chapter 4) in order to get establishment addresses out of company-based registers, theoretically information on the structure of companies in these countries (ratio single/multi site establishments, average number of establishments of multi-site companies etc.) could have gained. Yet, practice has shown that due to the quite low number of screened multi-site enterprises per country and due to the large variance in the number of establishments belonging to these multi-site enterprises the analysis of the screener was not a sufficiently reliable source for estimations on the distribution of establishments over the size-classes.
34

4. Company vs. establishments: Problematic cases and practical solutions
4.1. Typology of countries by availability of address-registers and statistical information on the universe
As outlined earlier in this report (see chapter 1.2.), the establishment is considered the preferable unit of enquiry for a survey of (personnel-) managers and employee representatives on the topic of working-time and work-life balance. But while reasonably comprehensive address-registers covering at least the core sectors of the economy (albeit often not Agriculture or Public Administration) are available for the unit of companies in practically all 15 “old” and in most of the new member-states of the European Union (e.g. from the commercial address-provider Dun & Bradstreet), there are quite a number of countries where this is not or only partially the case for establishments20. As can be seen in table 4.1.1, different degrees of (non-)availability can be distinguished: Whereas there are countries, where detailed and up-to-date information on the universe of establishments is obtainable, but no suitable address-source for this level, there are others, where both addresses and the correspondent statistical background information are missing. As already pointed out, the consideration of an address-register as “suitable” in the context of this survey means first and foremost that its entries of establishments a) cover all relevant sectors of activity and do not systematically exclude important sectors
and b) that they contain fairly reliable information about the sector of activity for each listed
establishment as well as c) about the number of employees (size-class) working in the respective local unit. If either one of these criteria could be neglected, theoretically there would be no problem regarding the address-register: In practically all countries world-wide business telephone registers called “Yellow Pages”, “Golden Pages” or the like, which contain a large amount of telephone numbers of establishments of various sectors of activity, are readily available - usually not only in printed form, but also as CD-ROMs which are much more practical for drawing random samples. Yet, as pointed out earlier more in detail (cf. chapter 2.1.3), the major problem with most of these Yellow-Pages address-registers is that they don’t provide any information on the size of the respective establishment. The matrix printed below therefore is based only on address-sources which fulfil at least the minimum standards of both completeness and practical suitability defined above. 20 Yet, to draw from this the conclusion to carry out further surveys of this kind on company-level would
be misleading. Apart from the strong reasons of content described in chapter 1.2.2., it has to be pointed out that in those countries where establishment registers are available, they are often of a higher quality than the available company registers. Moreover, statistical information on the universe is sometimes available for establishments only and not for companies. This is especially true for statistics based on workplace censuses, which are certainly among the best available statistical sources, but usually provide data at establishment level only
35

Table 4.1.1: Availability of address-registers and statistical information on the universe Addresses available on the level
of establishmentsAddresses available only on the level of companies
Statistical background-information for universe of establishments available (number of establishments per sector/size-class)
A
Denmark, Germany, Spain, France, Italy, The Netherlands*, Austria, Finland, Sweden, The United Kingdom, Latvia, Slovenia
B
Belgium*, Cyprus*
Statistical background-information available for universe of companies only (number of companies per sector/size-class)
C
Poland
D
Luxembourg*, Portugal*, Ireland, Greece*, the Czech Republic, Hungary
* In these countries, the chosen address-register does not cover the Public Administration. The additionally used registers for the coverage of this sector are all of the Yellow-Pages type and based on establishment-level, but do mostly not provide any size-classes for the addresses. Cell A is the “ideal case”: In the 12 countries listed there both suitable address-registers and the corresponding statistical background information on the universe of establishments are available on the level of establishments – albeit with varying quality and completeness (cf. chapter 3.3. and the country descriptions in chapter 5). For these nations, establishment addresses can easily be drawn and establishment-proportional weighting can be done on the base of official establishment statistics. The difficulties begin with cell B: Here no establishment-addresses are available although precise figures about the universe of establishments are provided. Among the 21 countries to be surveyed, only Belgium and Cyprus show this constellation21. The challenge in cell B consists in getting establishment-addresses out of company registers for a well known universe of establishments. How this can be achieved in practice is described in chapter 4.2.1.
21 The Belgian National Social Security Office (in Flemish called RSZ = Rijksdienst voor Soziale
Zekerheid and in French called ONSS = Office National Securité Sociale), which provides the data on the universe of both companies and establishments in Belgium, gets the information about the number of workplaces from its local offices, which are spread all over the country (each municipality has its own RSZ/ONSS-branch-office).
36

The only country in cell C is Poland. It is the only country where there is a “suitable” address source (i.e. with size-class and sector of activity) on establishment level, but no information about the universe on the same level. A somewhat special case is Greece: In Greece, there is a quite comprehensive address-register which is based on companies (the ICAP business-databank), but also includes the various establishments belonging to a multi-site enterprise. Yet unfortunately, this address-source provides information on size-class and sector of activity only for the company as a whole but not for the single workplaces. Consequently, although we know the number of employees working in company x and the number of different establishments of this company, we have no idea about the distribution of the sum of its employees among the various establishments and we don’t know either which of these have 10 or more employees and would therefore in principle be eligible for the survey. For this reason, Greece was treated like those cases where both addresses and statistical information on the universe are totally lacking for the level of the establishment (cell D). Cell D obviously contains the most difficult cases: In the six countries listed in this cell, there is no suitable address-register available on establishment-level either. Yet additionally, a further challenge consists in building a weighting matrix on establishment level without having the necessary figures at disposal, because the national statistical offices in these countries either do not collect these data or do not make them accessible for surveying purposes.
4.2. Practical solutions for countries without adequate establishment-registers
4.2.1. Proposal of an additional screening-procedure
In those countries, where no addresses and/or no statistics on the universe were available on establishment level (countries of cells B and D in table 4.1.1.), an additional screening-phase was designed in order to get a random choice of establishment addresses out of the best available company-based address-register. For the countries of cell D, this screening also had the aim to provide figures for an estimate on the structure of the universe of establishments. In short, the screening-procedure consisted of the following steps (compare MM050 to MM099 of the international master questionnaire):
37
Step 1: A sample is built on basis of the information available at the level of companies. To avoid an under-representation of larger firms, the size-bands 200 to 499 and especially 500+ are over-sampled22. Step 2: On the basis of this sampling-frame then a gross-sample of companies is randomly drawn from the best available address-register at company level. Step 3: Now, the contacted addresses are screened in order to find out if they are part of a multi-site enterprise or not: MM050 (=MM100 in countries without screener) May I first of all check: Is the establishment at this address a single independent company or organization with no further branch-offices, production units or sales units elsewhere in {country}? Or is it one of a number of establishments at different locations in {country} belonging to the same company or organization? A single independent company or organization ......................................................( 1 ) go to MM102 One of a number of different establishments ..........................................................( 2 ) ## No answer ..........................................................................................................( 3 ) go to MM102 If the contacted address refers to a single-site company (answer-code (1)), the interview is immediately filtered to MM102 ff., i.e. the main-interview then starts without any further differences to the standard-procedure. Step 4: Yet, in all multi-site enterprises the respondent is now asked for the number of employees working in the company in total, i.e. in all sites in the respective country (MM050a). This information is needed for the later analysis of the screeners. Step 5: The next step is to ask the respondents about the number of establishments (including the headquarters) with 10 or more employees belonging to the company (MM051). If none of the company’s establishments surpasses this size-threshold or if the respondent refuses to 22 An over-sampling of the larger size-classes e.g. can compensate for the inevitable tendency of
diminishing size-classes in the transition form company level to establishment level. An example: A multi-site company consisting of four establishments with 150 employees each would be listed as a company of the size-class 500+ in the company register, but in an establishment register it would be listed with 4 units within the size-class 50-199 employees.
38
answer this question, the screening is ended at this stage and the respective reason of non-response is entered. Wherever there is only one establishment within the required size-range (10+ employees), the interviewer asks for the name and address of the Human Resources manager within this establishment and enters this information in the screen (MM053a). If the only establishment with 10 or more employees is the one the interviewer is already connected with, the questions of the main interview now immediately follow (provided that the respondent is already the responsible Human Resources manager and not e.g. somebody at the switchboard). Step 6: In all other cases, i.e. in all companies with several establishments larger than 9 employees, additionally a question about the distribution of these establishments among the defined size-classes has to be asked: MM052 Would you please tell me how many of these establishments have …
10 to 19 employees.......................................................... __mm052a__
20 to 49 employees.......................................................... __mm052b__
50 to 199 employees.........................................................__mm052c__
200 to 499 employees...................................................... __mm052d__
500 or more employees ................................................... __mm052e__
Total ................................................................................... _ mm052f*)_
Respondent has to investigate information ........................ ( mm052na = 0 ) call again later No answer.......................................................................... ( mm052na = 1 ) go to END (refused) Step 7: The further proceeding now depends on the answer given in MM052:
• If according to MM052 there are establishments in one of the size-bands 10+ only, this size-band is chosen for the selection of the establishment to be interviewed. One of the establishments in this size-band is then randomly chosen for the interview (MM053c). Again, the main interview can immediately start if the chosen unit is the one the interviewer is already connected with. If not, the interviewer asks for the name and address of the Human Resources manager of the chosen unit and tries to contact this person later.
• In companies with establishments in more than one of the size-classes, first one of
these size-classes is randomly chosen. If there is only one establishment in the selected size-band, this is the one to be surveyed. Wherever there are two or more
39

establishments in the chosen size-band, again a random choice between these is made. As described above, the further proceeding after this selection depends on whether the randomly selected unit is the one the interviewer is already connected with (in this case the interview can start immediately) or whether it is another one (then name and address of the personnel-manager of the respective unit are noted).
In all cases where a new respondent in another establishment of the company has to be contacted after this screening, the interview there starts again with the contact phase and is then filtered to the main-interview (MM102). I.e., that the new contact implies a repetition of the contact-phase of the interview – again with all risks of non-response for various reasons: The first respondent, who was contacted at the address contained in the company-based address-register and who provided the information of the company’s structure, already was decided to take part in the interview. The personnel manager of the chosen establishment might not be willing to participate or might not be available during the fieldwork period.23
By applying the described procedure it was secured that all establishments with 10 or more employees - including the headquarters where usually the respondent of the first contact is located - had a chance to be chosen for the interview. Besides, provisions were made for the case that the first respondent (usually the personnel manager of the headquarters) should not be informed well enough about all the various workplaces belonging to the enterprise. In this case, the phone-call either had to be passed on to somebody in the company who was competent to answer the questions about the structure of the enterprise ad hoc or the interviewer offered to call again later in order to give the respondent time to inform himself. For Belgium (cell B of the matrix in table 4.1.1.), the only country with no establishment-based register but with differentiated statistical information on establishment-level, theoretically a somewhat simplified screening-procedure would have been sufficient. Yet, due to practical considerations there the same screening-process was applied as in the four countries of cell D24.
4.2.2. Alternative approach: Yellow Pages-based sampling
Theoretically, an alternative approach for getting establishment addresses in a country where no suitable establishment-register exists, is to randomly draw a number of addresses from the Yellow Pages and set up quotas for the various size-classes and sectors of activity. The chosen addresses then have to be contacted and screened for both size-class and sector of activity. Finally, an interview can be conducted in all those workplaces which turn out to have ten or more employees. In the course of the fieldwork, cell by cell then has to be closed 23 Yet the rate of non-response can be expected to be lower than with a completely “fresh” address,
because the interviewer can refer to the previous contact with another part of the company – usually the headquarters.
24 The field-work for Luxembourg (one of the cell-D countries) and Belgium was carried out by the same field-institute and with the same version of the CATI-programme. Therefore, it was more time-efficient to apply the detailed screener to Belgium as well.
40

as soon as the quota set for the cell (sector of activity/size-class) are complete. In the “closed” cells, no further interview can be conducted. This alternative solution seems quite plausible at a first glance, too, but it has a series of major disadvantages: As the chosen addresses do not provide any information about the number of employees, an enormous number of futile contacts with establishments below the set size-threshold of 10 employees is unavoidable. The absolute number of large-sized establishments is very low in most countries, but due to the disproportionate sampling-approach a large number of interviews have to be conducted in larger establishments. Using an address-register without any information about the size of an enterprise, it is therefore hardly possible to meet the quota of the largest size-classes, whereas the cells with the smaller enterprises fill up pretty soon25. The dimensions of this problem can not be over-emphasized, as the figures from West-Germany show in an exemplary way: a) Universe b) Targets
Size class Establishments
(in %) Establishments
(n)disproportional sample
in size-classes 10+
1 to 9 72,7% 727 0 10 to 19 14,9% 149 260 20 to 49 7,6% 76 260
50 to 199 3,8% 38 250 200 + 1,0% 10 230 Total 100,0% 1000 1.000
a) The percentages and the absolute number of establishments are related to the universe of
all establishments with at least one dependent employee. The share of units which are out of scope of the survey (due to the size-limit of 10+) is even higher if the chosen address-source also includes self-employed persons (what is usually the case in Yellow Pages-based registers).
b) Shows the number of establishments to be interviewed in the respective size-classes in
the disproportional net-sample chosen for this survey. The assumed total number of interviews is here for reasons of simplification 1.000.
Among a random choice of 1.000 contacted establishments from an address-register containing establishments of all sizes (1+) and providing no information on the size-class, only 273 would fall into the size-categories 10+ which were chosen for this survey. Among these 273, there would be only 10 establishments of the size-class 200+ (see column "Establishments" in table (a) above).
25 Similarly, it would be difficult to meet the quota for the industry-sectors, as these are often only
partially listed in Yellow Pages due to their limited interest in being contacted by the public.
41

Yet, as the chosen sampling-approach is not establishment-proportional but a mix of establishment- and employee-proportional, 230 interviews (and not only 10) in establishments 200+ are needed. If 10 net cases in 200+ already require a total of 1.000 contacts, then 230 net cases in 200+ require 230 : 10 = 23 times as many contacts. In other words: 23 times 1.000 contacts, i.e. 23.000 successful contact interviews are needed in order to complete the set quota of 230 interviews in the size-classes 200+. The figure of 23.000 marks the number of successful contacts, i.e. of contacts with establishments where the respondent is willing to answer the questionnaire (or at least the screening questions). Actually much more telephone calls are necessary since not all of the selected respondents are willing to give the required information.
4.2.3. Comments on the alternatives
The screening-procedure described in chapter 4.2.1 requires a prolonged field-phase and a considerable commitment especially on part of the involved field-institutes. A higher rate of refusals (because in the case of multi-unit companies there is a two-stage contact phase with the risk of non-response at each of the two stages) and a certain amount of futile contacts (with multi-site companies of more than 10 employees where none of the workplaces reaches the 10-employee threshold) are inevitable. Nevertheless, we consider it as the best practical approach for getting interviews at establishment-level while disposing only of a company-based register, as this screening-procedure leads to an unbiased (sub-) sample of establishments, based on a randomly chosen stratified and comprehensive company sample and it implies only a comparatively low number of futile contacts. With the described “alternative approach”, a reasonably good random-sample might also be achieved, but only at extremely high costs. The overall number of futile contacts in this alternative approach is – as was demonstrated above - in dimensions which can hardly be managed in practice, even if the telephone-studio disposes of a widely automated sample-management system. We therefore applied the screening-procedure outlined in 4.2.1. in all countries where an adequate company-register, but no establishment-register with the required information on size-class and sector was available.
42

5. The countries
The following documentation gives an overview of the address-registers and the statistical background data that were used in the countries. General Remark: The provided documentation on the sources used for sampling and weighting is mainly based on the information we got from our partner institutes in the countries, amended by own assessments and information from additional sources such as web-sites etc. where possible. In some countries, there are still some open questions with regard to the statistical sources for weighting which could not finally be clarified in the course of our research. This is especially true with regard to inconsistencies and implausibilities which in some countries become visible when comparing the establishment figures provided by the national statistical offices with figures about the distribution of employees derived from other sources such as the Labour Force Survey (LFS). All addresses for the first phase of the survey (EU-15) were bought in the preparation phase of the study, i.e. in summer 2004. For the second phase (6 additional countries), addresses were ordered in spring 2005. In each country, the latest up-date of the address-registers which was available at that time was used.
43
5.01 Belgium
Address-source: Belfirst (Bureau Van Djik) Type of Source: Commercial address-provider Sources for entries: * annual Accounts of the National Bank of Belgium * listing of VAT-paying firms * other sources (e.g. for non-profit organizations) Unit: Company-based, only sporadically subsidiaries of multi-sites Screening: Additional screening procedure applied in order to obtain a
randomly selected sample of establishments on base of the company-based databank
Coverage of Sectors: All relevant sectors of activity except for Public Administration which is clearly under-represented.
Codification of Sectors: SIC, NACE Size-bands: 10-19, 20-49, 50-199, 200-499, 500+; others also available Nr. of addresses in 10+: About 30.000 Updating: Weekly Comments/Assessment:
• Good coverage in the “Industries” sector. A detailed analysis of the net-distribution of interviews achieved within the “Services” sector indicates the existence of major weaknesses of the address-databank with regard to the coverage of the sectors NACE M (“Education”) and – to a lesser degree - NACE N (“Health and social work”).
• Another source for addresses would have been the Social Security Database, but this database, too, is centrally available only for companies and has some practical disadvantages. The Belfirst databank of businesses is also used for the sampling of the local Flemish PASO-Panel which is a large scientific establishment panel survey carried out on behalf of Flemish ministries.
44

Additional address-source for Public Administration: Infobel Type of Additional Source: Yellow Pages-based Sources for entries: Mode of compilation not exactly known Unit: Establishments Coverage of Sectors: Practically complete coverage of Public Sector Codification of Sectors: Following Yellow-Pages logics, not codified according to NACE
or another acknowledged international classification Size-bands: No information on size of unit contained Updating: Regularly Comments/Assessment:
• Addresses taken from Infobel were coded manually according to NACE (using the given headwords such as “municipality” etc.).
• Infobel-addresses first had to be screened for the size of the establishment due to lack of information on size in the addresses.
• Additional screening-procedure (in order to get establishment-addresses out of company-addresses) not applied for Public Administration since entries in Infobel are already establishment-based and screening-information was not necessary for weighting in Belgium.
Source for Statistics: RSZ (Rijksdienst voor sociale Zekerheid) Type of Source: Register of the national office of Social Security Statistics on establ.: Both establishment- and company-statistics available Statistics on employees: Available for both companies and establishments Coverage of Sectors: All relevant sectors covered; separate figures for Public
Administration available Codification of Sectors: SIC, NACE Size-bands: 10-19, 20-49, 50-199, 200-499, 500+; others also available Topicality: 2002 Comments/Assessment:
• All information required for weighting is available from this source and is fully compatible with the sample.
• According to RSZ, the number of employees in establishments larger than 9 employees is about 10% higher than the number of employees working in companies of the same size. This discrepancy is not plausible, since the number of employees working in companies 10+ also includes those employees of multi-site establishments which are working in branches with less than 10 employed persons, whereas in statistics on the number of employees in establishments 10+ these employees are not included because the establishment they belong to does not surpass the size-threshold. In spite of this peculiarity, we used the given official establishment-figures of the RSZ for weighting.
45

5.02 Denmark
Address-source: KOB (Kobmandsstandens Oplysningsbureau) Type of Source: Commercial address-compilation Sources for entries: * CVR, a central company register with compulsory registration * Information from the registers of the tax-offices * Registration of employees from Ministry of Labour Unit: Establishments Coverage of Sectors: All relevant sectors including Public Administration Codification of Sectors: NACE Size-bands: 10-19, 20-49, 50-199, 200-499, 500+; others also available Nr. Of addresses in 10+: About 36.000 Updating: Quarterly Comments/Assessment:
• Information on number of employees outdated for some firms. • Contains some inactive companies. • All in all a very good and comprehensive address-register.
Source for Statistics: Danmarks Statistik Type of Source: National Statistical Office Statistics on establ.: Available Statistics on employees: Not available from Danmarks Statistik; Danmarks Statisik
provides only a total number of employees, broken down into sectors of activity but not into size-classes; distribution of employees therefore had to be estimated, using the data from the Labour Force Survey (LFS 2002) for the estimation
Coverage of Sectors: All relevant sectors covered Codification of Sectors: NACE Size-bands: 10-19, 20-49, 50-99, 100+; no finer breakdown of establishments
with more than 100 employees available Topicality: 2002 (published in 2004) Comments:
• For weighting, the number of establishments given for size-class 100+ had to be further broken down into the size-classes 50 – 199, 200 – 499 and 500+ by estimations elaborated on base of the “hard” figures given for the other countries (B, D, F, S, E, I, NL, A).
• For Denmark, two different statistics about the distribution of establishments are available. One is based on a “full-time equivalent” count, i.e. that part-timers are included, but counted according to the number of their working hours (e.g. 2 half-time employees are counted only as 0,5 + 0,5 = 1 employee in this statistics). Another table, also available from Danmarks Statistik, is based on the headcount (i.e. each
46

employee is counted fully, regardless whether (s)he is working full-time or part-time. For reasons of compatibility with the questionnaire and with the statistics of other countries, we opted for using the headcount-based statistics. The figures in the headcount-statistics are also much better compatible with the LFS-data for Denmark, since the LFS-data we are using for our estimations refer to “employed persons” in general and not only to full-time employees.
47

5.03 Germany
Address-source: AMS (Arbeitsstätten-Master-Sample) Type of Source: Databank of business addresses compiled and maintained by the
research institute TNS Infratest Sources for entries: * various commercial address-registers * information in addresses updated through information received
in interviews * other sources Unit: Establishments Coverage of Sectors: All relevant sectors including Public Administration Codification of Sectors: WZ 79 and WZ 93 (NACE-compatible) Size-bands: 10-19, 20-49, 50-199, 200-499, 500+; other break-downs also
available Nr. of addresses in 10+: About 90.000 randomly chosen establishments Updating: Regularly up-dated Comments/Assessment:
• Best accessible register of establishments in Germany. • Designed as an employee-representative sample of all German establishment-
addresses; i.e. that while in the smaller size-classes only a representative share of establishments is contained, almost all larger establishments (100+) are part of the register.
• Theoretically, an alternative source would have been the databank of the German Federal Office of Labour (Bundesagentur für Arbeit), where all establishments with employees who are obliged to pay social security contributions are registered. But information is restricted to employees who pay compulsory social security contributions and the register does not contain telephone-numbers.
48

Source for Statistics: IAB-Betriebspanel (German Establishment Panel) Type of Source: Large panel survey, conducted annually on behalf of the Federal
Labour Agency (for details see comments below) Statistics on establ.: Available Statistics on employees: On base of establishments Coverage of Sectors: All relevant sectors covered Codification of Sectors: NACE Size-bands: 10-19, 20-49, 50-199, 200-499, 500+; other break-downs
available Topicality: 2003 Comments:
• In Germany, official data which show the distribution of establishments and employees over size-classes and sectors of activity are available for subgroups only (e.g. Manufacturing Industry with 20 or more employees).
• The most comprehensive data source is the register of employees who have to pay compulsory contributions to the social security (“sozialversicherungspflichtig Beschäftigte”), which, however, systematically excludes self-employed, owners, family workers, civil servants (“Beamte”) and employees with small jobs below the thresholds for compulsory social security contributions. For the purposes of the ESWT survey this data source creates problems in the public sector and in small establishments where the excluded groups might represent a significant part of the workforce within an establishment.
• For these reasons we decided to use estimations based on the German Establishment Panel (“IAB-Betriebspanel”) for weighting of the ESWT data. The German Establishment Panel is a large scale establishment survey which covers all establishments with at least one employee who has to pay compulsory contributions to the social security systems and all sectors of activity. Data are collected from more than 15,000 establishments once a year. Sampling and weighting is made on the basis of the data which are available at the Federal Labour Agency about all employees with compulsory contributions to the social security system and the establishments employing these people. Additionally the survey collects data about the people who work in these establishments but do not have to pay compulsory social security contributions. For the weighting of the German part of the ESWT survey these data were used by courtesy of the Research Institute of the Federal Labour Agency (“IAB”). Special analyses were made in order to get the distribution of the establishments and the employees over the cells of the stratification matrix for the universe of the ESWT. For the definition of the size classes and for the distribution of the employees all employees (including self-employed, owners, family workers, civil servants and employees with small jobs below the thresholds for compulsory social security contributions) were considered.
49

5.04 Greece
Address-source: ICAP Business-Databank Type of Source: Databank of business addresses compiled and maintained by the
research institute TNS ICAP Sources for entries: * official sources * information gathered through interviews * others Unit: Covers both companies and establishments, but in case of multi-
site enterprises information on number of employees is only given for the company as a whole, not for the different local units
Screening: Additional screening procedure applied in order to obtain a randomly selected sample of establishments on base of the company-based databank
Coverage of Sectors: All relevant sectors except for Public Administration Codification of Sectors: NACE Size-bands: 10-19, 20-49, 50-199, 200-499, 500+; others also available
(company-size!) Nr. of addresses in 10+: About 20.000 randomly selected companies Updating: Regularly up-dated Comments/Assessment:
• Most complete and up-to-date business-register in Greece. An analysis of the net-sample achieved in the survey nevertheless indicates weaknesses of the address-source in the coverage of public entities in sectors NACE M (“Education”) and N (“Health and social work”) in which public institutions (schools, hospitals, public health services etc.) usually make up for a considerable part of the universe.
• Addresses in the ICAP-databank are “rotated” regularly, i.e. in order to avoid an over-research especially of the larger companies the randomly chosen sample is replaced from time to time by a new sample which is drawn from the remaining pool of addresses. Since the absolute number of large companies/establishments is very limited in Greece, this implies that in the largest size-classes only a relatively small amount of addresses is available for interviewing.
• No suitable establishment-based address-register available for Greece. • The fact that the various establishments of multi-site companies are already listed in
the ICAP-databank (but without information on their size) slightly alleviated the screening for Greece, since it was not necessary to ask for the addresses of the local units, but only for the size-classes to which the listed units belong to.
50
Additional address-source for Public Administration: White Pages (Greek telephone register) Type of Additional Source: Register of telephone numbers Sources for entries: Active telephone lines Unit: Establishments and partly also smaller units (such as
departments) Coverage of Sectors: Practically complete representation of Public Sector Codification of Sectors: Following logics of telephone registers, not codified according to
NACE or another acknowledged international classification Size-bands: No information on size of unit contained Updating: Regularly Comments/Assessment:
• Addresses taken from the White Pages were coded manually according to NACE (using the given headwords such as “municipality” etc.).
• White Pages-addresses first had to be screened for the size of the establishment due to lack of information on size in the addresses.
51
Source for Statistics: TNS ICAP Business-Statistics Type of Source: Statistics of the research institute TNS ICAP, based on the ICAP
address-register Statistics on establ.: Not available; only statistics on company-level Statistics on employees: Not available from any Greek source; therefore, estimations on
the distribution of employees had to be made, oriented on the data from the Labour Force Survey (LFS)
Coverage of Sectors: All relevant sectors except for Public Administration Codification of Sectors: NACE 2-digit Size-bands: 10-19, 20-49, 50-99, 100+; no finer breakdown of establishments
with more than 100 employees available Topicality: 2003 Comments/Assessment:
• Alternatively, a statistics on the universe of companies in Greece is available from the Greek national statistical office (NSSG), but this source is quite old (1995) and shows a considerably smaller universe than the ICAP-statistics. Apart from the out-datedness of the figures, a reason for this discrepancy is that in the NSSG-statistics a larger number of companies for which the NSSG does not dispose of information on sector and size is not taken into account. All in all, we considered the ICAP-statistics as more complete and more reliable and therefore opted to take the ICAP-figures as base for the weighting.
• Neither the ICAP nor the NSSG-statistics provide figures on the number of companies/establishments in the Public Administration (NACE L). The only available data for this sector are the figures on the number of employees in the Public Administration provided by the LFS. The number of establishments in the Public Administration had to be estimated on base of the distribution of employees according to the LFS.
• A quite high percentage (about 20%) of the employees working in establishments larger than 9 employees falls into the residual LFS-category “Unknown > 10 employees”. These cases were distributed among all size-classes according to their relative share of clearly attributable employees.
• Additionally information available form the screening interviews (weighted on a company basis) was used for estimations of the number and structure of establishments.
52
5.05 Spain
Address-source: SCHOBER Type of Source: Databank of business addresses compiled and maintained by the
commercial address-provider SCHOBER, an internationally active company specialized in providing addresses for business activities and research-purposes.
Sources for entries: * Proprietary Research * Public Records (not further specified) * Telemarketing Unit: Both companies and establishments Coverage of Sectors: All relevant sectors Codification of Sectors: SCHOBER-classifications, made compatible with NACE by the
address-provider Size-bands: 10-19, 20-49, 50-199, 200-499, 500+; others also available Nr. of addresses in 10+: About 150.000 establishments (according to web-site of
SCHOBER Spain) Updating: Regularly up-dated Comments/Assessment:
• Most comprehensive Spanish establishment-register available for the purpose of the study. The Spanish statistical institute INE has its own databank of both companies and local units (DIRCE), but the access to the INE-register is very restrictive.
• For a larger (but not clearly specified) number of entries in SCHOBER the number of employees working in the establishment is not known.
• All in all an analysis of the statistical variables in the ESWT suggest that SCHOBER Spain is a reasonably good source for the purposes of such a study. An important indicator for this is the quite high share of subsidiaries among the multi-site enterprises (43%) in the net-sample. Nevertheless, judging from the achieved net sample structures, the NACE sectors M (“Education”) and N (“Health and Social work”) seem to be under-represented in this address-base.
53
Source for Statistics: DIRCE (Directorio Central de Empresas) Type of Source: National Statistical Office INE (Instituto Nacional de Estadística) Statistics on establ.: Both company- and establishment level available Statistics on employees: INE does not provide sufficiently differentiated figures on the
number of employees working in either companies or establishments. The only official figures on the distribution of employees are provided by the Ministry of Working and Social Life and show the number of employees working in companies of the size-bands 1 to 10, 11 to 50, 51 to 250 and 251 or more employees. These figures are not differentiated between sectors of activity and the boundaries of the size-classes do not coincide precisely with the size-classes of the survey. Therefore additionally the data of the LFS had to be used for an estimation of the distribution of employees to the cells of the stratification matrix.
Coverage of Sectors: All relevant sectors except for Public Administration Codification of Sectors: NACE 3-digit Size-bands: 10-19, 20-49, 50-199, 200-499, 500+; others also available Topicality: 2004 Comments/Assessment:
• DIRCE is a reliable, comprehensive source for statistical background information, the given figures are fully compatible with the information contained in the sampling-source.
• No statistics exist about the distribution of establishments (or companies) of the public sector. According to a rough estimation of INE some 10.000 establishments larger than 9 employees exist in the Spanish Public Administration (NACE L).
• Estimation on the distribution of the given total number of establishments 10+ in the Public Administration among the 5 size-classes was made on base of the figures available for the German Public Administration.
• The Spanish LFS-data 2002 contain some 25% of employees which are not exactly attributable (“Unknown >10”, differentiated for “Industries” and “Services”). These cases were distributed among all size-classes according to their relative share of clearly attributable employees.
54

5.06 France
Address-source: SIRENE Address-Register (Système informatique pour le répertoire et des établissements)
Type of Source: Business-databank compiled and maintained by the national
statistical office INSEE (Institut National de la Statistique et des Études Économiques)
Sources for entries: All active firms are registered in the SIRENE-database; entries, deletions and changes reported by prefectures, trade councils, regional national health insurance funds, treasuries etc.
Unit: Establishments Coverage of Sectors: All relevant sectors Codification of Sectors: NAF-codes (Nomenclature d’Activités Francaise); compatible
with NACE 2-digit Size-bands: 10-19, 20-49, 50-199, 200-499, 500+; others also available Nr. of addresses in 10+: Practically complete coverage Updating: Regularly Comments/Assessment:
• Very comprehensive and up-to-date official address-register. • According to the experience of our French partner institute (TNS SOFRES) the
smaller size-classes (10-19 and 20-49) are somewhat under-represented in SIRENE. • The achieved net-sample structures suggest that the Education sector (NACE M)
might be somewhat under-represented in the address-source.
55

Source for Statistics: INSEE (Institut National de la Statistique et des Études Économiques)
Type of Source: National statistical office Statistics on establ.: Available Statistics on employees: Not available from INSEE. Information on the number of
employees and their distribution among the different sectors and size-classes had to be taken from Labour Force Survey (LFS).
Coverage of Sectors: All relevant sectors Codification of Sectors: NAF Size-bands: 10-19, 20-49, 50-199, 200-499, 500+; others also available Topicality: 2004 Comments/Assessment:
• As in the address-register SIRENE, the smaller size-classes (10-19 and 20-49) are somewhat under-represented in the INSEE-statistics, too. Yet, nothing is known about the degree of this under-representation.
• According to our information, the establishment statistics elaborated on base of the SIRENE databank are quite complete in the Industries sector. In the Services, a couple of sub-sectors respectively legal categories which are covered by the address-base SIRENE are not included in the statistics on the population of establishments derived from the SIRENE-register. The latter are rather confined to the so called ICS-field (Industry-Construction-Commerce-Services), which excludes e.g. banks and insurances as well as certain legal categories such as the state administration (i.e. NACE L), social security, foundations, real estate partnerships etc.
• For the figures on the distribution of the employees among the various sectors and size-classes we used the LFS data. The French LFS-data of 2004 fit reasonably well with the INSEE-statistics on establishments in the Industries sector, i.e. that in this sector the average establishment sizes for each size-class (resulting from a division of the number of employees within a size-class by the number of establishments) are quite plausible. Yet, in the services sector this is not the case. Here, the resulting averages are much too high for practically all size-classes which means that either the employee-figures are too high or the establishment figures too low. The reason for this incompatibility of the data could not finally be clarified, but is supposed to be found in the above described restrictions of the SIRENE-statistics. In order to establish a compatibility between the LFS-data on employees and the establishment data of INSEE we added a larger number of establishments in each size-class of the Services sector to the figures provided by INSEE. We consider the LFS-data (from the year 2004) for France all in all as fairly reliable, since in the Industries sector, which is not affected by the above mentioned limitations of the SIRENE statistics, LFS- and SIRENE-data are reasonably well compatible. Nevertheless, for France some question marks remain with regard to the base for the weighting.
• The French LFS-data of 2004 contain some 4,2% of employees which are not exactly attributable to one of the relevant size-classes (“Unknown >10”). For the calculation of the weighting factors, these cases were distributed among the 5 size-classes relevant for the survey.
56

5.07 Ireland
Address-source: BILL MOSS Partnership– Business Register Type of Source: Databank of business addresses compiled and maintained by the
commercial address-provider BILL MOSS, a company specialized in providing addresses for business activities and for research-purposes.
Sources for entries: * Different sources (not further specified) * Addresses checked annually by telephone interviews Unit: Companies Screening: Additional screening procedure applied in order to obtain a
randomly selected sample of establishments on base of the company-based databank
Coverage of Sectors: All relevant sectors Codification of Sectors: NACE-compatible Size-bands: 10-19, 20-49, 50-199, 200-499, 500+; others also available Nr. of addresses in 10+: About 19.000 Updating: Regularly Comments/Assessment:
• Most comprehensive Irish business address-register containing information on size and NACE.
• No suitable establishment-based address-register available for Ireland.
Source for Statistics: BILL MOSS Partnership Type of Source: Business statistics of address-provider Statistics on establ.: Not available from BILL MOSS; provided on Company-level only Statistics on employees: Not available from BILL MOSS nor from any other official Irish
source. Information on the number of employees and their repartition among the different sectors and size-classes had to be taken from Labour Force Survey (as base for estimations).
Coverage of Sectors: All relevant sectors Codification of Sectors: SIC, NACE Size-bands: 10-19, 20-49, 50-199, 200-499, 500+; others also available Topicality: 2004 Add. source for Statistics: Census of Industrial Production 2000 Type of Source: Central Statistics Office Statistics on establ.: Available (local units) Statistics on employees: Not available from this source either Coverage of Sectors: Only NACE C to E, i.e. “Industries” without NACE F =
Construction
57
Codification of Sectors: NACE 3-digit Size-bands: 10-19, 20-49, 50-199, 200-499, 500+; others also available Topicality: 2000 Comments/Assessment:
• Degree of reliability and comprehensiveness of BILL MOSS-statistics not known, but these statistics are used for most b2b-surveys in Ireland.
• Data of the Census of Industrial Production to be judged as very reliable, but available only for Industries without Construction (NACE F). For weighting of the Industries-interviews, the census-data were taken and amended by an estimated number of establishments in the construction sector. This estimation is based on the total share of employees in Construction (Eurostat-figures for all size-classes including 1-9 empl.), assuming a certain concentration of establishments of this sector on the smaller size-classes, especially 10-19 and 20-49.
• Estimation of the number and distribution of establishments on base of a) the given number of companies (from BILL MOSS), b) the given number of employees according to LFS and c) the average size of establishments within the various size-classes (oriented at confirmed official values from other, roughly comparable countries).
• No “Unknown >10” – cases contained in Irish LFS-data, all respondents are attributed to a size-class and sector. Estimated distribution of the not further specified LFS-size-class “50+” according to the repartition in countries with given official values.
• Estimations for the distribution of establishments in both the Industry and the Services sector are backed by a (weighted) analysis of the Irish screening-data.
58

5.08 Italy
Address-source: KOMPASS Type of Source: Commercial address-provider Sources for entries: * Yellow Pages-data, amended by further information such as the
number of employees * others Unit: Establishments, partly also smaller units (such as departments) Coverage of Sectors: All relevant sectors Codification of Sectors: NACE-compatible Size-bands: 10-19, 20-49, 50-199, 200-499, 500+; others also available Nr. of addresses in 10+: Practically full coverage of existing establishments Updating: Quarterly Comments/Assessment:
• Very comprehensive address-register, only establishments without registered telephone number are not included.
• Information on number of employees not available for all entries. • The Italian net sample of the ESWT shows a share of 53% subsidiaries among the
multi-site enterprises interviewed for the survey. This high share of subsidiaries is an indicator that KOMPASS indeed covers establishments in a comprehensive way and does not confine entries to headquarters.
Source for Statistics: ISTAT Census of establishments 2001 Type of Source: Census carried out by National Statistical Office ISTAT Statistics on establ.: Available Statistics on employees: Available on establishment-level Coverage of Sectors: All relevant sectors covered Codification of Sectors: NACE Size-bands: 10-19, 20-49, 50-199, 200-499, 500+; others also available Topicality: 2001 Comments:
• Comprehensive and reliable base for weighting. The census the data derive from was carried out in establishments of all sectors and sizes. Census-information is fully compatible with categorization in address-source.
59

5.09 Luxembourg
Address-source: Belfirst (Bureau Van Djik) Type of Source: Commercial address-compilation Sources for entries: Source for entries not exactly known for Belfirst Luxembourg;
probably same type of sources as Belfirst Belgium Unit: Company-based, only sporadically subsidiaries of multi-sites Coverage of Sectors: All relevant sectors except for Public Administration which is
clearly underrepresented Codification of Sectors: SIC, NACE 5-digit Size-bands: 10-19, 20-49, 50-199, 200-499, 500+; others also available Nr. of addresses in 10+: Not known Updating: weekly Comments/Assessment:
• Additional screening-procedure applied in Luxembourg in order to get addresses and statistical background data on establishment level.
• The achieved net-sample structures of the ESWT survey suggest a severe under-representation of the sub-sectors NACE M (“Education”) and N “(Health and social work”) in the address-register.
Additional address-source for Public Administration: Infobel Type of Additional Source: Yellow Pages-based Sources for entries: Mode of compilation not exactly known Unit: Establishments Coverage of Sectors: Almost complete representation of Public Sector Codification of Sectors: Following Yellow-Pages logics, not codified according to NACE
or another acknowledged international classification Size-bands: No information on size of unit contained Updating: Regularly Comments/Assessment:
• Addresses taken from Infobel coded manually according to NACE (using the given headwords such as “municipality” etc.).
• Infobel-addresses first screened for the size of the establishment due to lack of information on size in the addresses.
60
Source for Statistics: STATEC Type of Source: National statistical office STATEC (Service Central de la
Statistique et des Études Économiques) Statistics on establ.: Not available; statistics on companies only Statistics on employees: No figures on the breakdown of the employees according to
sectors and size-classes available from STATEC or any other official Luxembourgian source. STATEC only provides figures on the total number of employees (all sizes) working in Luxembourg (stratified only according to the main sectors Industries/Services/Public Administration). Figures on the distribution of employees among the establishments are therefore taken from the LFS.
Coverage of Sectors: STATEC-statistics on the number of companies exclude Public Administration.
Codification of Sectors: SIC, NACE Size-bands: 10-19, 20-49, 50-99, 100+ Topicality: Information on companies 2002, Information on employees
January 2003 Comments/Assessment:
• No information on establishment-level available from STATEC. • More detailed information on the distribution of companies with 100+ employees was
achieved by a separate analysis of the list of the major employers in Luxembourg which is published by STATEC (Les principaux employeurs Luxembourgeois, d'après les effectifs occupés, par ordre de grandeur; Situation au 1er Janvier 2004)
• According to STATEC, there are about 100.000 people employed in companies or organisations in Luxembourg which are not living in Luxembourg, but commuting regularly into Luxembourg from neighbouring countries. This explains the quite large discrepancy between the overall number of employees (all size-classes) according to the LFS and according to STATEC (STATEC figures are much higher), since the LFS is a household-based survey among individuals living in the respective country, whereas STATEC-data are derived from the companies active in the country.
• Additionally information available from the screening interviews (weighted on a company basis) was used for estimations of the number and structure of establishments.
61

5.10 The Netherlands
Address-source: Chamber of Commerce Establishment Register Type of Source: Establishment register of the Dutch Chamber of Commerce Sources for entries: All economically active establishments have to register at the
Chambers of Commerce. Unit: Establishment-based Coverage of Sectors: All relevant sectors except for Public Administration, Public
Education, Public Healthcare and the Mining Industries. Codification of Sectors: BIK 4-digit, compatible with NACE Size-bands: 10-19, 20-49, 50-199, 200-499, 500+; others also available Nr. of addresses in 10+: About 73.000 Updating: Regularly Comments/Assessment:
• Practically complete coverage of all economically active units (except for establishments of Public Administration, Public Education, Public Healthcare and the Mining Industries).
• Some “dead” addresses and inaccurate numbers of employees, as establishments are not bound to de-register or adjust alterations.
Additional address-source for Public Administration: LISA Type of Additional Source: Databank with telephone-numbers of all places where paid work
is carried out Sources for entries: Mode of compilation not exactly known Unit: Establishments Coverage of Sectors: Practically complete representation of Public Sector Codification of Sectors: NACE-compatible Size-bands: 10-19, 20-49, 50-199, 200+ Updating: last comprehensive update 2003 Comments/Assessment:
• Best accessible source for addresses of the Public Sector in the Netherlands.
62

Source for Statistics: Chamber of Commerce Type of Source: Statistics based on the compulsory registrations of economically
active units at the Chambers of Commerce Statistics on establ.: Available Statistics on employees: No statistics on the number of employees stratified according to
sectors and size-classes available from official sources in the Netherlands. The Labour Force Survey provides data on the distribution of employees according to sectors and size-classes only for the year 2003 (for 2002 the LFS does not provide any information on the size-class at all, while for 2004 only the distribution among size-classes, but not sectors is available).
Coverage of Sectors: All relevant sectors except for Public Administration, Public Education, Public Healthcare and the Mining Industries.
Codification of Sectors: BIK 4-digit Size-bands: 10-19, 20-49, 50-199, 200-499, 500+; others also available Topicality: 2002 Add. source for Statistics: LISA Type of Source: Statistics of LISA address-register Statistics on establ.: Establishments Statistics on employees: Not available from this source either. Coverage of Sectors: All relevant sectors; used for statistics on the number of
establishments in the Public Sector Codification of Sectors: NACE-compatible Size-bands: 10-19, 20-49, 50-199, 200+; no further break-down available for
the size-class 200+ of the Public Administration Topicality: 2003 Comments/Assessment:
• The LFS-data 2003 on the distribution of employees lead to uncommonly high (as compared to other countries), albeit not totally implausible average firm-sizes within the various size-classes for Industries and Services (without Public Administration). Since we have no hint at any systematic exclusion or under-representation of parts of the economy by the establishment-statistics of the Chamber of Commerce, we did not apply any “corrections” here.
• In the Public Administration sector, the compatibility of LFS-data and the statistics provided by LISA is more problematic. This is especially true for the lower size-classes in the range 10 to 199 employees. In the size-classes 10-19, 20-49 and 50-199 of the Public Administration, we therefore added a number of establishments in order to establish compatibility between employee- and establishment data.
63
5.11 Austria
Address-source: HEROLD Type of Source: Commercial address-provider (for marketing purposes etc.) Sources for entries: Yellow Pages-data and several other sources Unit: Establishments and smaller units Coverage of Sectors: All relevant sectors Codification of Sectors: NACE Size-bands: 10-19, 20-49, 50-199, 200-499, 500+; others also available Nr. of addresses in 10+: Wide coverage of existing establishments; total number of
registered companies (incl. < 10 employees): about 340.000 Updating: Continuously Comments/Assessment:
• Comprehensive address-register • Public Administration and other establishments of the public sector (in the Health and
Education-sector) are obviously somewhat under-represented in this address-base. • The relatively high share of headquarters (76%) among the surveyed multi-site
establishments can be interpreted as a hint that the address-source might not cover establishments in a fully representative way but might rather be focussed on the administrative headquarters.
Source for Statistics: Arbeitsstättenzählung 2001 Type of Source: Census of all establishments active in Austria, carried out by the
national statistical office “Statistik Austria” Statistics on establ.: Available Statistics on employees: Available on establishment-level Coverage of Sectors: All relevant sectors covered Codification of Sectors: NACE 4-digit Size-bands: 10-19, 20-49, 50-199, 200-499, 500+; others also available Topicality: 2001 (first published in 2004) Comments:
• Very comprehensive and reliable base for weighting. The census from which the data derive from was carried out in establishments of all sectors and sizes. Census-information fully compatible with categorization in address-source.
64

5.12 Portugal
Address-source: INE Company-Register Type of Source: Official company register of the National statistical office INE
(Instituto Nacional de Estadística) Sources for entries: Addresses from national census of companies Unit: Companies only Coverage of Sectors: All relevant sectors except for Public Administration (NACE L)
included Codification of Sectors: NACE 5-digit Size-bands: 10-19, 20-49, 50-249, 250-499, 500+ Nr. of addresses in 10+: About 45.000 (practically full coverage) Updating: Regularly on a voluntary basis (only firms which report changes) Comments/Assessment:
• No suitable establishment-register available for Portugal, therefore the screening-procedure was applied, taking the INE company-register as base.
• Quite comprehensive in all sectors which are dominated by private firms, but not very accurate and up-to-date register. Many addresses coded with wrong (mostly outdated) size-classes.
• The achieved net-sample structures point at a pronounced under-representation of public entities of the sectors NACE M (Education) and N (Health and Social Work) in the addfess source.
• • Addresses for the Portuguese Public Administration were drawn from telephone
registers.
Source for Statistics: INE (Instituto Nacional de Estadística) Type of Source: National statistical office; census-based data Statistics on establ.: Not available; statistics on companies only Statistics on employees: Only available for companies from INE. For information on the
number of employees working in establishments of the different sectors and size-classes Labour Force Survey-data had to be used additionally.
Coverage of Sectors: All relevant sectors except for Public Administration (NACE L). Codification of Sectors: NACE 5-digit Size-bands: 10-19, 20-49, 50-99, 100-249, 250-499, 500+ Topicality: 2001 Comments/Assessment:
• Figures on the number of companies are obviously quite complete, but somewhat outdated. Attributions to the size-classes are often not very up-to-date, too (due to changes in the number of employees in the last 3-4 years).
65

• Stratified information on the number of employees in the Public Administration available only from LFS.
• For a number (about 10%) of the companies registered at INE only the size-class is given, but no precise information on the number of employees.
• Additionally information available form the screening interviews (weighted on a company basis) was used for estimations of the number and structure of establishments.
66
5.13 Finland
Address-source: BLUEBOOK/Saleslead Type of Source: Commercial address-provider Sources for entries: * Trade registers * Tax registers of National Board of Taxes * Statistics Finland * Information gathered by direct telephone contact with the firms * Information gathered by mail-questionnaires from firms * Others Unit: Establishments Coverage of Sectors: All relevant sectors Codification of Sectors: NACE 4-digit Size-bands: 10-19, 20-49, 50-199, 200-499, 500+; others also available Nr. of addresses in 10+: 26.700 (i.e. > 80% of all establishments 10+) Updating: Continuously Comments/Assessment:
• Very comprehensive and up-to-date address-register. Source for Statistics: Statistics Finland Type of Source: National Statistical Office Statistics on establ.: Available Statistics on employees: Available on establishment-level Coverage of Sectors: All relevant sectors covered Codification of Sectors: NACE 3-digit Size-bands: 10-19, 20-49, 50-199, 200+ Topicality: 2001 Comments:
• Very comprehensive and reliable base for weighting. • Estimation of the finer break-down of size-class 200+ into the required size-classes
200-499 and 500+ was made on base of the ratio of this distribution in other countries (countries where the breakdown was provided by reliable official sources).
67
5.14 Sweden
Address-source: SCB Företagsregistret Type of Source: National statistical office SCB (Statistiska Centralbyran) Sources for entries: * VAT-register * Registration of all employers * Others Unit: Both establishments and companies Coverage of Sectors: All relevant sectors Codification of Sectors: Swedish Standard Industrial Classification SNI, compatible with
NACE Size-bands: 10-19, 20-49, 50-199, 200-499, 500+; others also available Nr. of addresses in 10+: Practically full coverage of existing establishments Updating: Weekly Comments/Assessment:
• Very comprehensive and up-to-date address-register. Source for Statistics: SCB (Statistika Centralbyran) Type of Source: National Statistical Office Statistics on establ.: Both companies and establishments available Statistics on employees: Available on both company- and establishment-level Coverage of Sectors: All relevant sectors covered Codification of Sectors: SNI, compatible with NACE Size-bands: 10-19, 20-49, 50-199, 200-499, 500+; others also available Topicality: 2003 Comments:
• Very comprehensive, reliable and up-to-date base for weighting. Fully compatible with categorization in address-source (same provider).
68
5.15 The United Kingdom
Address-source: DUN & BRADSTREET Type of Source: Databank of business addresses compiled and maintained by the
commercial address-provider Dun & Bradstreet, one of the largest internationally active companies specialized in providing addresses for business activities and research-purposes.
Sources for entries: * News and media sources * Commercial Registry * Information gathered in D & B call-centres * Public Record Offices * Active search for commercial telephone numbers * Others Unit: Establishments Coverage of Sectors: All relevant sectors; certain under-representation in some sectors
like e.g. the Public Administration Codification of Sectors: SIC, NACE Size-bands: 10-19, 20-49, 50-199, 200-499, 500+ Nr. of addresses in 10+: About 160.000 establishments Updating: Continuously up-dated Comments/Assessment:
• Comprehensive establishment-register, containing a surprisingly large number of subsidiaries of multi-site companies (74% of the multi-sites in the ESWT net-sample are subsidiaries).
• All in all Dun & Bradstreet UK proved to be a good source for the purposes of the study, even the Public Administration (NACE L) could be covered fairly well with the Dun & Bradstreet addresses.
Source for Statistics: “Commerce, Energy and Industry”- Size Analysis of United Kingdom Businesses
Type of Source: From National Statistical Office “National Statistics”, mainly
based on VAT-registrations Statistics on establ.: Available Statistics on employees: Not available from National Statistics or any other official source
in the UK; therefore the data of the LFS had to be used for the estimations on the distribution of employees among the cells of the stratification matrix.
Coverage of Sectors: All relevant sectors Codification of Sectors: NACE 4-digit Size-bands: 10-19, 20-49, 50-99, 100-249, 250-499, 500+ Topicality: 2003
69

Comments/Assessment:
• Coverage in VAT-exempt areas such as health, education and Public Administration is incomplete.
• Tables with employment size-bands exclude approximately 3500 VAT-units with large turnover with pending checking.
• Alternative statistics on establishments provided by Dun & Bradstreet proved to be much weaker.
• The LFS-data for the UK contain a larger number of not exactly attributable employees (“Unknown >10”). These employees were distributed among the size-classes 50+ only because otherwise the average size of the establishments within these size-classes would have become implausible.
70

5.16 The Czech Republic
Address-source: MERITUM Type of Source: Commercial address-compilation Sources for entries: * trade register * RES register of economically active subjects * data from the Chamber of commerce * information from print media and from internet * information from telemarketing activities etc. Unit: Companies Coverage of Sectors: All relevant sectors including Public Administration Codification of Sectors: NACE Size-bands: 10-19, 20-49, 50-199, 200-499, 500+ Nr. Of addresses in 10+: Not known Updating: Quarterly Comments/Assessment:
• According to our Czech partner institute MERITUM is the best business address-register available in the Czech Republic and it is often used for b2b surveys.
• In the Czech Republic, there is no establishment register available. Therefore the additional screening-procedure was applied in order to get addresses and statistical background data on establishment level.
Source for Statistics: CZECH STATISTICAL OFFICE Type of Source: Business Register of the National Statistical Office Statistics on establ.: Not available; statistics on companies only Statistics on employees: Only available for companies from the Statistical Office. For
information on the number of employees working in establishments of the different sectors and size-classes Labour Force Survey-data had to be used additionally.
Coverage of Sectors: All relevant sectors covered Codification of Sectors: NACE Size-bands: 10-19, 20-49, 50-199, 200-499, 500+ Topicality: 2005 Comments:
• Since the Statistical Office does not provide any statistics on establishments, the number and distribution of establishments 10+ were estimated on base of the LFS-data (2004) and the average size of establishments within each size-class according to the Czech net-sample of the ESWT. The results of this estimate are plausible if compared to the structures of companies given by the Czech Statistical Office and if compared to the patterns of distribution in other countries.
71
5.17 Cyprus
Address-source: Business Register of the Statistical Service of the Republic of Cyprus
Type of Source: Official address-register Sources for entries: Based on the Census of Establishments 2003 Unit: Companies Coverage of Sectors: All relevant sectors except for Public Administration (NACE L) Codification of Sectors: NACE Size-bands: 10-49, 50-249, 250+ Nr. of addresses in 10+: About 3.000 Updating: General update every few years; latest version 2003 Comments/Assessment:
• The address-register of the Statistical Office of Cyprus only includes companies with limited liability, but no private companies with “sole proprietorship”, i.e. where a single person is financially fully responsible. Since the statistical data on the universe of establishments in Cyprus is based on this register and therefore has the same limitations with regard to the type of ownership, it is not known how large the share of such establishments with “sole proprietorship” in Cyprus is.
• Judging on base of the achieved net sample, public entities of the “Education” and “Health and social work” section seem to be under-represented in the address-compilation of the Cypriote Statistical Service.
• No suitable establishment-based address-register available for Cyprus. Additional screening-procedure therefore applied in Cyprus in order to get addresses and statistical background data on establishment level.
Additional address-source for Public Administration: White Pages (Cypriote telephone register) Type of Additional Source: Register of telephone numbers Sources for entries: Active telephone lines Unit: Establishments and partly also smaller units (such as
departments) Coverage of Sectors: Practically complete representation of Public Sector Codification of Sectors: Following logics of telephone registers, not codified according to
NACE or another acknowledged international classification Size-bands: No information on size of unit contained Updating: Regularly Comments/Assessment:
• Addresses taken from the White Pages were coded manually according to NACE (using the given headwords such as “municipality” etc.).
• White Pages-addresses first had to be screened for the size of the establishment due to lack of information on size in the addresses.
72

Source for Statistics: Statistical Service of the Republic of Cyprus Type of Source: National Statistical Office Statistics on establ.: Available Statistics on employees: Not available from the Cypriote Statistical Office Coverage of Sectors: All relevant sectors covered Codification of Sectors: NACE Size-bands: 10-49, 50-249, 250+; no finer breakdown of establishments with
more than 100 employees available Topicality: 2003 Comments:
• For weighting, the number of establishments given for the summarized size-classes 10-49, 50-249 and 250+ had to be further broken down into the size-classes 10-19, 20-49, 50 – 199, 200 – 499 and 500+ by using a key of distribution derived from estimations elaborated on base of the “hard” figures given for the other countries (B, D, F, S, E, I, NL, A).
• Like the address-register, the statistics on the universe of establishments, too, is confined to firms with limited liability-ownership. Yet, information on the universe in the Public Sector is included in the statistics. Information for this sector is collected by the Statistical Office although addresses for the entities of the Public Administration are not provided for research purposes by the official address-register.
• Statistics on the distribution of employees across the various sectors and size-classes are not available from the Cypriote Statistical Office. In principle, these figures are available from the Labour Force Survey. Yet, the distribution of employees provided by the LFS is – unlike the figures for the distribution of establishments - not limited with regard to the legal form and/or type of ownership and is consequently not compatible with these figures. Therefore, LFS-data could not be used for weighting. Instead, the number of employees within the defined universe (i.e. establishments with limited liability ownership as listed in the Business Register of the Statistical Services of the Republic of Cyprus) was calculated by multiplying the given number of establishments with the average size of establishments within each size-class according to the net-sample of the ESWT.
• Due to the above described limitations of the universe, the total number of employees used in the base for the weighting is considerably lower than that given by the LFS. This is especially true for the lower size-classes, since the legal form of sole proprietorship can be assumed to be much more common in small than in large establishments.
73

5.18 Latvia
Address-source: Business Register of the Central Statistical Bureau of Latvia Type of Source: Commercial address-compilation Sources for entries: various Unit: Establishments (Companies also available) Coverage of Sectors: All relevant sectors including Public Administration Codification of Sectors: NACE Size-bands: 10-19, 20-49, 50-199, 200-499, 500+; others also available Nr. Of addresses in 10+: About 13.000 Updating: Last update in first quarter of 2005 Comments/Assessment:
• All in all a good and comprehensive address-register. • The high share of interviewed subsidiaries among the establishments of multi-site
enterprises indicates that the register is covering the various establishments of multi-site enterprises in a really comprehensive, systematic way.
Source for Statistics: Business Statistics of the Central Statistical Bureau of Latvia Type of Source: National Statistical Office Statistics on establ.: Made available (the count on establishments was exclusively
done for this project) Statistics on employees: Made available (the count of the distribution of employees across
the various sectors and size-classes, too, was exclusively made for the purposes of this project)
Coverage of Sectors: All relevant sectors covered Codification of Sectors: NACE Size-bands: 10-19, 20-49, 50-199, 200-499; 500+ Topicality: First quarter of 2005 Comments:
• A comparison of the distribution of employees as provided by the Central Statistical Bureau of Latvia with the distribution according to the LFS shows certain discrepancies. Both the distribution across the various cells and the overall number differ not only marginally. The universe of employees in establishments 10+ (sectors NACE C to NACE O) e.g. is considerably lower according to the data of the Latvian Statistical Office than according to the Labour Force Survey. Since the employee-statistics provided by the Latvian Statistical Bureau fit well with the figures on establishments provided by the same institution and due to the general limitations of the LFS (survey among individuals), we decided to take the official data of the Statistical Office as basis for the weighting.
74
5.19 Hungary
Address-source: Database of the Central Statistical Office Type of Source: Official address compilation Sources for entries: various Unit: Companies Coverage of Sectors: All relevant sectors including Public Administration Codification of Sectors: NACE Size-bands: 10-19, 20-49, 50-199, 200-499, 500+ Nr. Of addresses in 10+: About 35.000 Updating: Regularly updated; Latest update of register for the Industries
and Services: 2004; for Public Administration 2005 Comments/Assessment:
• The business database of the Central Statistical Office of Hungary is commonly regarded as the best and most comprehensive business address-register available for Hungary.
• Enterprises/organisations of NACE M (Education) and NACE N (Health and Social Services) are obviously under-represented in this official address-register.
• In Hungary, no establishment register is available which fits the specific requirements of this study.
• Additional screening-procedure applied in Hungary in order to get addresses and statistical background data on establishment level.
Source for Statistics: Database of the Hungarian Central Statistical Office Type of Source: National Statistical Office Statistics on establ.: Not available; only company-statistics are available Statistics on employees: Not available from the Statistical Office, neither for companies
nor for establishments; distribution of employees therefore had to be estimated, using the data from the Labour Force Survey (LFS 2004) for the estimation
Coverage of Sectors: All relevant sectors covered Codification of Sectors: NACE Size-bands: 10-19, 20-49, 50-199, 200-499, 500+; no finer breakdown of
establishments with more than 100 employees available Topicality: Industries and Services 2004; Public Administration 2005 Comments:
• The Hungarian Statistical Office counts in its company statistics only those companies for which information on the number of employees is available. The number of companies provided by the Statistical Office is therefore somewhat lower than the real number of Hungarian companies 10+.
75

• Since no establishment statistics are available for Hungary, for weighting the number of establishments had to be estimated. Base of the estimate were the LFS-figures on the distribution of employees and the average number of employees within each cell in the Hungarian net-sample of the ESWT.
76
5.20 Poland
Address-source: PCM (Polskie Centrum Marketingowe) Type of Source: Commercial address-compilation Sources for entries: various Unit: Establishments Coverage of Sectors: All relevant sectors including Public Administration Codification of Sectors: NACE Size-bands: 6-10; 11-20, 21-50, 51-100, 101-200, 201-500, 501-1.000, 1001-
2.000, 2.001+ Nr. Of addresses in 10+: Covers about 75% of all firms active in Poland Updating: Regularly (up-date of the whole data-base in six month-cycles) Comments/Assessment:
• Size-bands not exactly in line with the required size-bands (deviation of +-1 employee per cell)
• ESWT-results suggest a good coverage of the various establishments of multi-site companies by this address-base (high share of subsidiaries/branches among the surveyed multi-site enterprises).
Source for Statistics: Statistical Office of Poland Type of Source: National Statistical Office Statistics on establ.: Not available; only statistics on companies are provided Statistics on employees: Not available in the required breakdown; only the total of
employees working in establishments 10+ of the respective broad sectors Industries/Services/Public Administration is available; no finer breakdown into size-classes; distribution of employees therefore had to be estimated, using the data from the Labour Force Survey (LFS 2004)
Coverage of Sectors: All relevant sectors covered Codification of Sectors: NACE Size-bands: 10-49, 50-249, 250-999, 1000+; no alternative breakdowns
available Topicality: 2004 Comments:
• Since establishment statistics are not available for Poland, the establishment structures had to be estimated. For these estimates, the LFS-figures on the distribution of employees in the various size-classes were divided by the average number of employees within each cell in the Polish net-sample of the ESWT.
• The number of establishments per cell resulting from this procedure seems plausible when compared to the number of companies provided by the Statistical Office.
77

5.21 Slovenia
Address-source: IPIS Register of Slovene companies Type of Source: Commercial address-compilation Sources for entries: various sources, not further specified Unit: Establishments Coverage of Sectors: All relevant sectors including Public Administration Codification of Sectors: NACE Size-bands: 10-19, 20-49, 50-199, 200-499, 500+; others also available Nr. Of addresses in 10+: Almost full coverage of Slovenian firms Updating: Regularly Comments/Assessment:
• The results of the ESWT (MM101) show that among the multi-site units surveyed for this project about 88% were headquarters and only about 12% subsidiaries/branch offices. This might be a hint on a certain bias in the address-register: Perhaps local units of multi-sites are not systematically, but only partly included in the IPIS register.
Source for Statistics: Statistics of the IPIS Register of Slovene companies Type of Source: Statistics of a commercial address-provider Statistics on establ.: Available Statistics on employees: Not available – neither from IPIS nor from the Slovenian
Statistical Office; distribution of employees therefore had to be estimated, using the data from the Labour Force Survey (LFS 2004) for the estimates.
Coverage of Sectors: All relevant sectors covered Codification of Sectors: NACE Size-bands: 10-19, 20-49, 50-199, 200-499, 500+; size-bands 50-249 and
250-499 also available Topicality: 2004 Comments:
• The Statistical Office of Slovenia also provides business statistics, but these official statistics are based on the unit of companies, not establishments.
• Establishments for which there is no information on the number of employees are not included in the statistics.
• The establishment statistics provided by IPIS do not fit very well with the Labour Force data. Especially in the middle and larger size-classes, the test of dividing the number of employees within each cell by the number of establishments leads to implausible results for the average number of employees in some cells (e.g. an average of 35 employees in size-band 50-199 which is not plausible). Due to these inconsistencies with the LFS and due to the above mentioned presumable under-representation of subsidiaries in the IPIS-register, we have doubts on the quality of the IPIS-statistics.
78

Weighting was therefore done on base of the LFS-data. These were divided by the average number of employees in each category according to the Slovenian results of the ESWT. The establishment figures resulting from this seem plausible; in the lower size-classes (10-19 and 20-49) differences with the figures provided by IPIS are only slight. The total number of establishments 10+ resulting from this procedure is somewhat lower than that provided by IPIS.
79