estates strategy 2015 to 2025 - sherwood forest hospitals 16 esta… · · 2017-02-213.2 the...
TRANSCRIPT

Estates Strategy 2015 to 2025
October 2015
Final Draft v2.3
Sherwood Forest Hospitals NHS Foundation Trust Estates Strategy - October 2015 2
Contents
1 Executive Summary ................................................................................................................ 5 1.1 Introduction .............................................................................................................................. 5 1.2 Where Are We Now? ................................................................................................................ 5 1.3 Where Do We Want To Be? ..................................................................................................... 6 1.4 How Do We Get There? ............................................................................................................ 9 1.5 Summary ................................................................................................................................ 10
2 Introduction & Overview ...................................................................................................... 11 2.1 Our Trust Vision ...................................................................................................................... 11 2.2 Estate Strategy Aims............................................................................................................... 12 2.3 Success Criteria ....................................................................................................................... 12 2.4 Expected Benefits ................................................................................................................... 13
3 Strategic Context: Embedding the Strategy .......................................................................... 14 3.1 Our Trust ................................................................................................................................ 14 3.2 The National & Local Context ................................................................................................. 14
4 Developing Our Strategy ...................................................................................................... 16 4.1 The Estates Strategy Development Process ........................................................................... 16 4.2 The Three Key Questions........................................................................................................ 16 4.3 Triangulation and Iteration: Keeping it aligned ..................................................................... 17 4.4 Review Process ....................................................................................................................... 17
5 Where are we now? ............................................................................................................. 18 5.1 Our Existing Estate ................................................................................................................. 18 5.2 King’s Mill Hospital ................................................................................................................. 18 5.3 Newark Hospital ..................................................................................................................... 21 5.4 Mansfield Community Hospital .............................................................................................. 21 5.5 Estate Returns Information Collection (ERIC) Data ................................................................ 22 5.6 Physical Condition & Backlog Maintenance ........................................................................... 22 5.7 Risk Adjusted Backlog Maintenance ...................................................................................... 23 5.8 Environmental Performance .................................................................................................. 23 5.9 Our PLACE Assessment ........................................................................................................... 26 5.10 Updating Our Estates Information ....................................................................................... 27 5.11 High Level Key Performance Indicators ............................................................................... 27 5.12 Implications of doing nothing .............................................................................................. 32 5.13 Summary of current position ............................................................................................... 34
6 Where Do We Want to Be? .................................................................................................. 35 6.1 Our Organisational Objectives ............................................................................................... 35 6.2 The Impact of Service Changes .............................................................................................. 36 6.3 Our Financial Plans ................................................................................................................. 37 6.4 A Productive Estate ................................................................................................................ 38 6.5 Capital Investment Planning .................................................................................................. 38 6.6 Enhancing Our Care Environment .......................................................................................... 39 6.7 Meeting Our Regulatory Obligations ..................................................................................... 39 6.8 Our IM&T Strategy ................................................................................................................. 39 6.9 Our Workforce Strategy 2014-2017 ....................................................................................... 40 6.10 Our Travel Plan ..................................................................................................................... 41 6.11 Our Corporate Estate Needs ................................................................................................ 41 6.12 Principles for Estate Development ....................................................................................... 42 6.13 Environmental Performance ................................................................................................ 42 6.14 Estate Performance Targets ................................................................................................. 42 6.15 Identified Priorities for our Future Estate ............................................................................ 44

Sherwood Forest Hospitals NHS Foundation Trust Estates Strategy - October 2015 3
6.16 Aligning the Estates Strategy ............................................................................................... 45 7 How Do We Get There? ........................................................................................................ 46
7.1 Delivering the Estates Strategy Aims ..................................................................................... 46 7.2 Site rationalisation ................................................................................................................. 46 7.3 Strategic Estates Development Proposals .............................................................................. 47 7.4 Site Development Plan - 2020 ................................................................................................ 49 7.5 Future site configuration - 2020 ............................................................................................. 51 7.6 Capital Resourcing .................................................................................................................. 53 7.7 Impact of the Proposed changes on Estate KPIs .................................................................... 54
Appendix A – Trust SWOT Analysis ............................................................................................. 56 Appendix B - Site Block Plans ...................................................................................................... 57 Appendix C - Medium Acute Dataset indicators .......................................................................... 60 Appendix D - Phasing & Decants ................................................................................................. 64 Appendix E - Critical Path Gantt Charts ....................................................................................... 67

Sherwood Forest Hospitals NHS Foundation Trust Estates Strategy - October 2015 4

Sherwood Forest Hospitals NHS Foundation Trust Estates Strategy - October 2015 5
1 Executive Summary
1.1 Introduction
This document sets out the development of an Estates Strategy for Sherwood Forest Hospitals NHS Foundation Trust (SFHFT). It provides an integrated approach to the estate, relative to proposed service models and supports SFHFT's ambition to consolidate its place as the secondary care provider of choice within mid-Nottinghamshire. When considering the local health needs and services to be delivered from our Hospitals, the Trust has ensured alignment to the strategies and needs of the wider community identified through the Better Together Transformational Programme (BTTP) Established in 2001 as an NHS Trust, Sherwood Forest Hospitals became an NHS Foundation Trust in 2007 and currently benefits from working closely within the mid-Nottinghamshire health and social care community. A range of acute physical, community and mental health services are delivered from our sites, including services delivered from buildings either owned by, or leased to a number of third party occupiers. The last 2 years have been particularly challenging for us, and we are working work closely with Monitor and our primary Clinical Commissioning Groups (NHS Mansfield & Ashfield CCG and NHS Newark & Sherwood CCG) to implement a robust recovery plan. We recognise the significant challenges we - and our local stakeholders - face, and the role that we play in helping shape the financial recovery and on-going sustainability of local services. Further, we recognise that our recent PFI investment, whilst providing first-class accommodation for the delivery of high quality care to our patients, is a significant cost pressure and it is crucial that we maximise utilisation of our high quality assets and reduce costs wherever possible - we must achieve a productive estate. To this end, our Estates Strategy proposes a “no new build” approach, where we will not further expand the occupied floor area of the Trust, but seek to make significant reductions in legacy estate.
1.2 Where Are We Now?
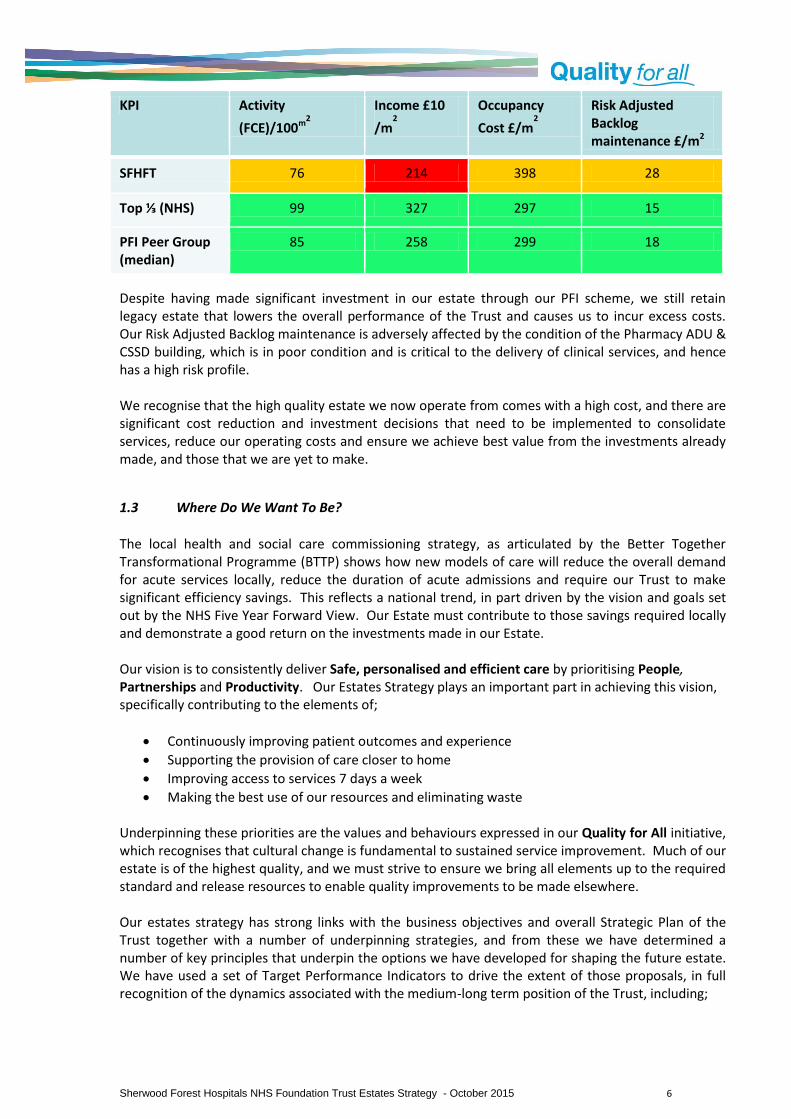
The Trust has invested heavily in the new build PFI accommodation that replaced much of the original King’s Mill Hospital. Mansfield Community Hospital was also fully re-developed, and further investment was made to bring Newark General Hospital up to acceptable standards for inclusion in the PFI contract. However, we do still have significant retained estate at King’s Mill Hospital, accommodating key services such as Theatres, our Critical Care Unit and our Emergency Care Centre, some of which is not ideally located, does not provide the highest quality experience and is in need of investment. Other parts of our retained estate are vacant or in ad-hoc use. Further, some Clinical support services accommodation, specifically Pharmacy ADU and CSSD are in poor condition and in need of replacement as a priority, and a number of clinical adjacencies are in need of improvement. High-level performance indicators show that we occupy excess estate for the volume of clinical activity we complete, and also against the Trust’s income. When compared against all Trusts, we occupy circa 19.2% too much estate by floor area. We have also calculated our performance against a group of 14 comparable acute trusts, all having a significant PFI development. Our overall performance is summarised in the table below:
Sherwood Forest Hospitals NHS Foundation Trust Estates Strategy - October 2015 6
KPI Activity
(FCE)/100m2
Income £10
/m2
Occupancy
Cost £/m2
Risk Adjusted Backlog maintenance £/m2
SFHFT 76 214 398 28
Top ⅓ (NHS) 99 327 297 15
PFI Peer Group (median)
85 258 299 18
Despite having made significant investment in our estate through our PFI scheme, we still retain legacy estate that lowers the overall performance of the Trust and causes us to incur excess costs. Our Risk Adjusted Backlog maintenance is adversely affected by the condition of the Pharmacy ADU & CSSD building, which is in poor condition and is critical to the delivery of clinical services, and hence has a high risk profile. We recognise that the high quality estate we now operate from comes with a high cost, and there are significant cost reduction and investment decisions that need to be implemented to consolidate services, reduce our operating costs and ensure we achieve best value from the investments already made, and those that we are yet to make.
1.3 Where Do We Want To Be?
The local health and social care commissioning strategy, as articulated by the Better Together Transformational Programme (BTTP) shows how new models of care will reduce the overall demand for acute services locally, reduce the duration of acute admissions and require our Trust to make significant efficiency savings. This reflects a national trend, in part driven by the vision and goals set out by the NHS Five Year Forward View. Our Estate must contribute to those savings required locally and demonstrate a good return on the investments made in our Estate. Our vision is to consistently deliver Safe, personalised and efficient care by prioritising People, Partnerships and Productivity. Our Estates Strategy plays an important part in achieving this vision, specifically contributing to the elements of;
Continuously improving patient outcomes and experience
Supporting the provision of care closer to home
Improving access to services 7 days a week
Making the best use of our resources and eliminating waste Underpinning these priorities are the values and behaviours expressed in our Quality for All initiative, which recognises that cultural change is fundamental to sustained service improvement. Much of our estate is of the highest quality, and we must strive to ensure we bring all elements up to the required standard and release resources to enable quality improvements to be made elsewhere. Our estates strategy has strong links with the business objectives and overall Strategic Plan of the Trust together with a number of underpinning strategies, and from these we have determined a number of key principles that underpin the options we have developed for shaping the future estate. We have used a set of Target Performance Indicators to drive the extent of those proposals, in full recognition of the dynamics associated with the medium-long term position of the Trust, including;

Sherwood Forest Hospitals NHS Foundation Trust Estates Strategy - October 2015 7
A requirement to significantly improve our underlying financial position
An expected downwards trajectory for overall clinical activity levels
A reduction in associated income for clinical activities
A required internal efficiency in bed occupancy and operating costs A summary of the Target Performance Indicators is shown below, using the 2013/14 national dataset (all trusts) as a reference;
Performance Indicator Top ⅓ NHS performance
Current Performance 2014/15
Target Performance by 2020-2021
Income £10/m2 327 214 214*
Activity / 100m2 99 76 83*
Asset Value £10/m2 176 183 226
Total Backlog £/m2 50 89 16
Critical Backlog £/m2 12 14 0
Risk Adjusted BL £/m2 15 28 2
Energy Costs £/m2 245 308 259
Occupancy Cost £/m2 297 398 415**
* Trust income and clinical activity reductions aligned to strategic plan. GIA reduces by 19.32% to 107,201m
2 but income
also reduces significantly over the period offsetting gains made. ** Occupancy Costs are reduced by circa £12.6 million, and GIA reduces significantly, but remaining cost is in PFI assets
where occupancy cost rates per m2 are proportionately higher.
These KPI’s may be represented in real terms, as shown below, using the planning timeframe and projections contained within the 2014/15 - 2018/19 Strategic Plan
Indicator 2014/15 2018/19 Change (%)
Income £284.1m £239.5m -15.69%
Activity 101,165 88,256* -14.62%
Beds 719 573 -25.48%
Gross Internal Area 132,881m2 107,201m2 -19.32%
Occupancy Cost £52.94m £44.59m -15.8%
Critical Risk Backlog £1.857m Nil -100%
Risk Adjusted Backlog £3.767m £221k -94.1%
Energy Costs** £4.09m £3.28m -18.9%
*estimated from data within the Strategic Plan 2014/15 to 2018/19

Sherwood Forest Hospitals NHS Foundation Trust Estates Strategy - October 2015 8
** based on present day unit costs - considerable volatility may be experienced in energy markets
The graph below shows how the key performance indicators of £10 of income per M2 of floor area and FCEs per 100m2 of floor area will change over the planning period, with and without reconfiguration of the estate, given that both income and activity are currently planned to decrease significantly.
From the above data, it can be seen that whilst the Trust currently has too much floor space in relation to its income and activity, the downwards trajectory of both income and activity will further compound the requirement to reduce estate significantly - in short, we must double our efforts to reduce floor area, compared to the status-quo activity / income scenario if we are to contain costs, improve quality, reduce risks and reduce future investment requirements. The trust will be left with significant stranded estate costs if income and activity reduce as expected, and steps are not taken to mitigate them urgently.
In recognition of the overall financial position of the Trust, our projected activity & income profile and the direction determined by the Better Together Transformational Programme, a set of key principles for reconfiguration of the estate to achieve the targets above have been identified, as included below;
Pro-actively plan for the reduction of gross internal floor area to reduce operating cost, risks, investment needs and liabilities;
Eliminate Critical Backlog Maintenance items through demolition, replacement or renewals;
Re-utilise existing buildings where replacement of life-expired assets is required. Minimise new builds. Maximise demolition of life-expired estate;
Maximise utilisation of PFI assets to achieve maximum return (productive estate principles);
Support the provision of a technology led and enabled environment
Establish a ‘Patient Core’, to maximise operational effectiveness and patient experience;
Improve adjacencies and quality of Theatres, ITU and Imaging by re-provision;
Re-designate areas of King’s Treatment Centre to improve utilisation, but minimise disruption to current accommodation and cost of change;
Relocate non-intensive services / low utilisation services from PFI areas;
0
50
100
150
200
250
2014/15 2015/16 2016/17 2017/18 2018/19
KPI’s With & Without Reconfiguration of the Estate
£10 Income per M2 WITHOUT reconfiguration
FCE per 100m2 WITHOUT reconfiguration
£10 Income per M2 WITH reconfiguration2
FCE per 100m2 WITH reconfiguration3
Sherwood Forest Hospitals NHS Foundation Trust Estates Strategy - October 2015 9
CSSD & Pharmacy ADU to be located in an existing building, - not a PFI asset but with suitable adjacencies;
Improve quality and patient experience though the provision of high quality environments;
Create capacity for the repatriation of services from Newark General Hospital and Mansfield Community Hospital, where appropriate; and
Enable the use of retained estate capacity for repatriation or for others (cost reduction)
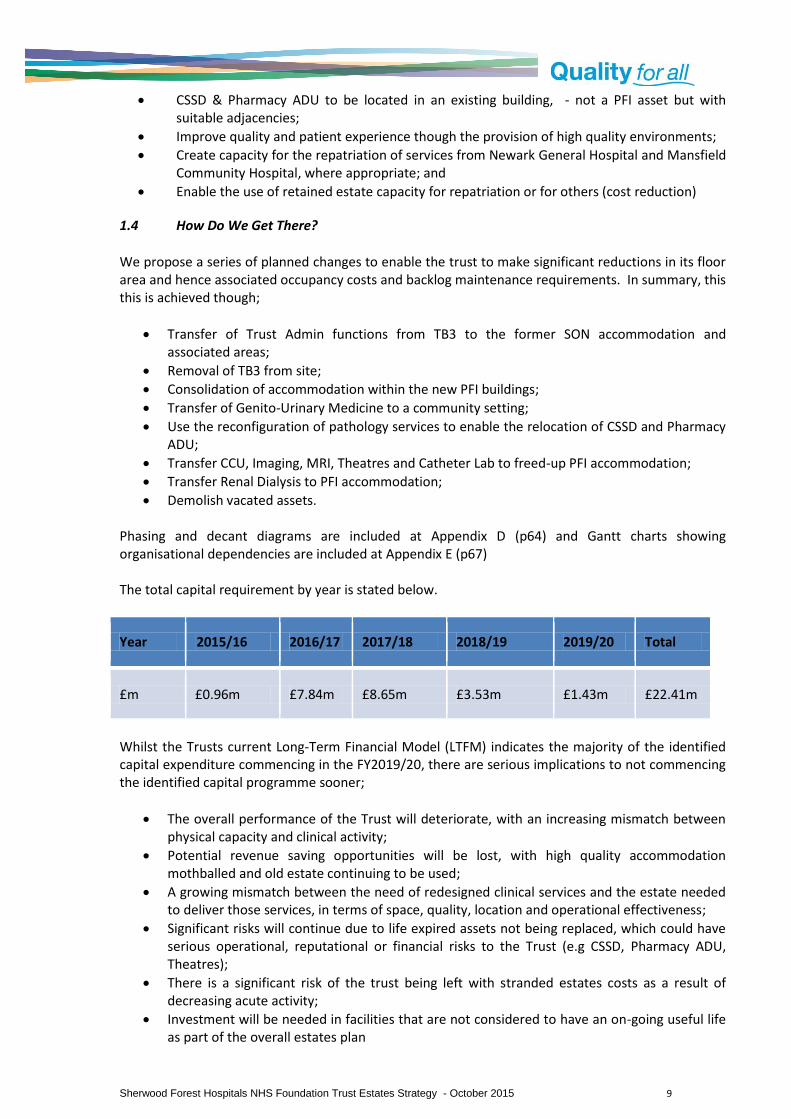
1.4 How Do We Get There?
We propose a series of planned changes to enable the trust to make significant reductions in its floor area and hence associated occupancy costs and backlog maintenance requirements. In summary, this this is achieved though;
Transfer of Trust Admin functions from TB3 to the former SON accommodation and associated areas;
Removal of TB3 from site;
Consolidation of accommodation within the new PFI buildings;
Transfer of Genito-Urinary Medicine to a community setting;
Use the reconfiguration of pathology services to enable the relocation of CSSD and Pharmacy ADU;
Transfer CCU, Imaging, MRI, Theatres and Catheter Lab to freed-up PFI accommodation;
Transfer Renal Dialysis to PFI accommodation;
Demolish vacated assets.
Phasing and decant diagrams are included at Appendix D (p64) and Gantt charts showing organisational dependencies are included at Appendix E (p67) The total capital requirement by year is stated below.
Year 2015/16 2016/17 2017/18 2018/19 2019/20 Total
£m £0.96m £7.84m £8.65m £3.53m £1.43m £22.41m
Whilst the Trusts current Long-Term Financial Model (LTFM) indicates the majority of the identified capital expenditure commencing in the FY2019/20, there are serious implications to not commencing the identified capital programme sooner;
The overall performance of the Trust will deteriorate, with an increasing mismatch between physical capacity and clinical activity;
Potential revenue saving opportunities will be lost, with high quality accommodation mothballed and old estate continuing to be used;
A growing mismatch between the need of redesigned clinical services and the estate needed to deliver those services, in terms of space, quality, location and operational effectiveness;
Significant risks will continue due to life expired assets not being replaced, which could have serious operational, reputational or financial risks to the Trust (e.g CSSD, Pharmacy ADU, Theatres);
There is a significant risk of the trust being left with stranded estates costs as a result of decreasing acute activity;
Investment will be needed in facilities that are not considered to have an on-going useful life as part of the overall estates plan

Sherwood Forest Hospitals NHS Foundation Trust Estates Strategy - October 2015 10
1.5 Summary
The overall position of key drivers, their impacts and our identified priorities are summarised in the table below, together with data gaps where reasonable planning assumptions have had to be made at this stage.
Drivers Affordability – Financial position Operational Effectiveness Under Utilisation of Built assets Investment needs for retained estate ‘Left shift’ of care to community settings PLACE scores Demographics of people we serve 7-day working Reduced LOS Reducing demand (A&E, NEL, OBDs, Referrals) Better Together Programme (BTTP) - £35m of savings in 5 years, then same again. Local and regional collaboration (e.g. Cancer, Pathology) Workforce Plans – reduction of c540 WTE Poor operational location / adjacencies
Impact High premises costs Excess Bed capacity Excess Floor area (GIA) Excess Outpatient capacity Buildings to demolish / dispose of Need to replace critical / life expired assets Sub-optimal quality and patient experience
Priorities Pharmacy ADU Re-provision (on-site or elsewhere) CSSD re –provision (on-site or elsewhere) Theatre Re-provision Imaging and MRI relocation Create a ‘Patient Core’ in high quality assets Maximise utilisation of PFI assets for income generating activity Reduce floor area, commensurate with activity and income Longer term provision for ITU/ Catheter lab Histopathology re-provision Infrastructure renewals where required Re-use of PFI / estate by others to reduce cost
Data Gaps Theatre activity planning to support re-provision Medical productivity mapping Endoscopy capacity plan Imaging capacity plan Longer term bed planning by specialty Agile working strategy and impact plan. Medical Records Strategy

Sherwood Forest Hospitals NHS Foundation Trust Estates Strategy - October 2015 11
2 Introduction & Overview
2.1 Our Trust Vision
Our vision is to consistently deliver Safe, Personalised and Efficient Care by prioritising People, Partnerships and Productivity. In prioritising People, we are committed to:
Continuously improving patient outcomes and experience
Being clinically-led and valuing mental and physical health equally
Always involving patients, carers, staff and communities
Promoting staff and public health and wellbeing Working in Partnership is fundamental to our future, as we:
Support the provision of care closer to home
Develop clinical networks to sustain local services and facilitate transfers of care to specialist centres when required
Make the most of our clinical and non-clinical support services
Improve access to services 7 days a week Improving Productivity is a vital part of our strategy, so we focus on
Safely reducing the time patients spend in hospital
Developing and retaining our workforce, reducing our reliance on temporary staff
Making the best use of our resources and eliminating waste
Getting it right the first time Underpinning these priorities are the values and behaviours expressed in our Quality for All initiative, which recognises that cultural change is fundamental to sustained service improvement. Quality for All describes our shared commitment to the following values and behaviours:
Communicating and working together
Aspiring and improving
Respectful and caring
Efficient and safe
Key section points:
The Estates strategy plays an important part in delivering the Trust vision to consistently deliver safe, personalised and efficient care, by prioritising people, partnerships and productivity. We must deliver a productive estate that supports the delivery of high quality clinical services and releases resources for direct patient care. We operate in a challenging economic environment and have invested heavily in our PFI buildings in recent years, and we must now ensure we obtain maximum value from that investment. We must consolidate our built assets to eliminate waste, improve access, improve patient experience and enable new ways of working for our teams. Locally, we must support the development of new clinical pathways, including the delivery of care closer to home and reducing length of stay. The Estates Strategy sits alongside other key strategies, with close dependencies and read-across.

Sherwood Forest Hospitals NHS Foundation Trust Estates Strategy - October 2015 12
2.2 Estate Strategy Aims
To support the Trust vision, the Estates Strategy 2015 to 2025 sets out the keys drivers and rationale for developing the built environment from which we deliver our services. Our patients and teams are at the heart of all we do, we will continually strive to ensure we provide a safe, high quality environment for care that best meets their needs, and in the most cost effective manner. In developing this strategy, we aim to;
Ensure we provide a safe, personalised and effective care environment for both inpatient and outpatient services;
To make best use of our resources and eliminate waste, to enable more resources to be used for delivering direct patient care;
Support the delivery of high quality clinical services, 7 days per week, with reduced lengths of stay;
To promote the health, wellbeing and experience of patients and staff through safe, healthy and inspiring buildings;
Support the provision of a technology led and enabled environment;
Support the overall delivery of the Trust’s Strategic Plan, as a strong NHS Foundation Trust, for both clinical and corporate services;
Ensure a flexible, fit-for-purpose and sustainable estate for the future delivery of clinical services;
Support the development of sustainable local services, including care closer to home and, access to specialist centres when required;
Improve the overall performance of our built assets, whilst reducing risks and removing inefficiencies;
Ensure our investment decisions are based upon strong principles to improve quality, improve access, reduce costs and enhance operational effectiveness;
Ensure our plans are integrated with, and support the delivery of, other Trust strategies, as part of a suite of documents.
2.3 Success Criteria
In determining the success criteria for the Estates Strategy a range of indicators have been considered, to provide a cohesive and overarching assessment in non-technical terms. These are;
A built environment that enhances care and quality – providing facilities that enhance and promote the ability of clinical services to delivery the best possible outcomes and experiences for people using our services;
Optimised revenue expenditure on the built environment – annual & lifecycle costs shown against agreed national benchmarks for quality and cost;
Deliver a ‘Right-Sized’ Estate - ensure our assets match the clinical activity of the trust, to contribute to our overall efficiency and sustainability;
Maximise the benefits achieved from our PFI investment - ensure we achieve high utilisation of our prime assets, and achieve value for money from the unitary charges we pay;
Optimal Capital Procurement - delivering new developments and improvements to key time, quality and cost targets, measurable against national benchmarks;
Reduced Backlog Maintenance Requirements – reduce reliance on our retained estate, improve the condition of our built environment, and reduce future liabilities;
Measurable improvement in Care Environment Quality Standards – assessing our current environments against a set of core quality standards for the care environment (What does good look like?);

Sherwood Forest Hospitals NHS Foundation Trust Estates Strategy - October 2015 13
Continual improvement against Estates Performance Indicators – verifiable improvements in key facet indicators (Space utilisation, functional suitability, environmental management, fire & statutory safety, adaptability);
Maximised receipts from any asset disposals – innovative and commercially focused proposals for any surplus property;
Provide a flexible and adaptable built environment – assets delivered in such a way that they are capable of supporting the future needs of the Trust, as a key provider within the local health & social care economy of mid-Nottinghamshire.
2.4 Expected Benefits
Through the implementation of the Estates Strategy we expect to achieve a range of tangible benefits for people who use our services and their carers, our staff, our commissioners and the wider health & social care community. We expect;
Demonstrable improvements in quality and patient experience;
The ability to target investments to achieve reduced risks, future liabilities and life-cycle costs;
A reduction in backlog maintenance requirements and operational cost of our premises;
A reduction in the floor area of estate requiring revenue and capital investment during the life of this strategy;
A reduction in the frequency and severity of adverse incidents;
Alignment with the expectations of our regulators (e.g. Monitor, CQC, HSE);
Improved environmental performance (including carbon reduction);
An Estate that better meets the current and future needs of the population we serve;
Improved flexibility to respond to new service developments or minimise the impact of service or activity retractions;
The ability to dispose of surplus or poorly performing assets and release capital for re-investment, driven by service needs.
Sherwood Forest Hospitals NHS Foundation Trust Estates Strategy - October 2015 14
3 Strategic Context: Embedding the Strategy
3.1 Our Trust
Sherwood Forest Hospitals NHS Trust was established in 2001 when the King’s Mill Hospital, Newark General Hospital and the Ashfield and Mansfield District Community Hospitals came together under the re-organisation of NHS bodies. We were subsequently authorised as Foundation Trust in February 2007.
Patients enjoy state-of-the-art facilities thanks to our flagship £320m redevelopment scheme at King’s Mill Hospital, developed through the Private Finance Initiative (PFI) and with phases opening from 2008 through to 2011. We completed the site redevelopment in 2013, with demolition of a number of life expired buildings. In recent years we have experienced severe financial challenges due in part to changes in the amount we are paid to deliver services, our staffing costs in delivering high quality, safe and effective care, and the costs of our estate and support services. A copy of our organisational SWOT is included at Appendix A. Further information on the Trust is available from the SFHFT website: http://www.sfh-tr.nhs.uk
3.2 The National & Local Context
We operate as part of a complex local and national framework with several key drivers taken into consideration that will impact on the future estate that we need. These include;
The NHS Five Year Forward View.
The Better Together Transformation Programme.
The development of Local Estates Strategies.
The regulatory frameworks (principally the CQC, Monitor & HSE).
Locally, The Better Together Transformation Programme (BTTP) brings together the NHS in Newark and Sherwood, Mansfield and Ashfield and Nottinghamshire County Council, ourselves and other partners to look at how we can join up health and social care services more effectively in the future. It is estimated that there could be a funding gap of £140 million in our area of Nottinghamshire alone, in ten years’ time.
Key section points:
In line with many NHS providers we have faced significant challenges in recent years, including being placed in Special Measures by Monitor. The longer term plan for the NHS is set out in the 5-Year Forward view which sets out very challenging efficiency targets and makes the case for change for how we will deliver services. In addressing the challenges locally, we work as part of the Better Together Transformation Programme, which is seeking to close a forecast financial gap of £140million over the next 10 years. Local plans include developing new models of care and pathways to reduce non-elective conditions, reduce length of stay in acute in-patient beds, reduce A& E attendances and enhance care closer to home. In summary, our like-for-like forecast activity and hence income will reduce. There is significant opportunity and requirement for the Estate to contribute to both the delivery of new models of care and the release of resources towards the efficiency targets.

Sherwood Forest Hospitals NHS Foundation Trust Estates Strategy - October 2015 15
In broad terms, the programme has the following objectives in terms of activity: -
15% reduction in A&E attendances 20% reduction in non-elective acute admissions 30% reduction in acute bed days 25% reduction in admissions to nursing and residential homes (not directly relevant to the
Trust but indicates direction of travel) 10% reduction in secondary care elective referrals 20% reduction in paediatric admissions to hospital
As part of the Better Together Transformational Programme, an Estates and Commercial Strategy has been developed, reflecting the emerging changes to health & social care locally, and to provide the strategic framework and plan for development of the estate across the locality. Our own Estates Strategy builds upon the recommendations of that document, in recognition of our collaborative approach with Commissioners and stakeholders. The key findings of the BTTP strategy are;
Care closer to home will lead to reduced demand for acute services;
Providers will need to reduce overall acute bed capacity;
Local service provision and de-centralisation of elective care will change how community assets are used;
Primary care provision will need to be increased and improved;
Utilisation of all premises will need to be improved, and seek re-use of some estate;
The estate is expected to form a significant contribution to the overall saving target of £140m over the next ten years.

Sherwood Forest Hospitals NHS Foundation Trust Estates Strategy - October 2015 16
4 Developing Our Strategy
4.1 The Estates Strategy Development Process
This Estates Strategy has been developed in accordance with the guidance and processes described in the Department of Health’s document “Developing an Estates Strategy”, modified to better meet the requirements of Monitor and commercial requirements. The process asks 3 principal questions in relation to the Trusts estate, set in the context of the Trusts objectives and service strategy;
Where are we now?
Where do we want to be?
How do we get there?
4.2 The Three Key Questions
Where are we now? This initial stage is aimed at developing a comprehensive understanding of how well the current estate supports the delivery of current services, using Estates Appraisal methods. For example;
What are the key metrics of the current Estate?
How well (or otherwise) is the Estates performing or managed?
What has been achieved by recent investments?
What are the known risks and issues with the Estate?
What are the Quality indicators saying?
Describe the context of the current Estate
How does the current estate limit or enhance the delivery of clinical services? Where do we want to be? This stage includes a detailed review of the known and anticipated service plans changes, with the aim of developing a clear understanding of current operational issues, factors likely to drive change and investment in the Estate and assess the potential for service expansion or contraction in terms of Estates needs. It also takes into account the Trust’s overall Service Delivery Strategy, Financial position and Commissioners intentions. Reference is taken from relevant strategies, to ensure strong alignment and inter-operability and to avoid duplication, and is based upon the same key trajectories for organisational performance. It assumes an awareness of these supporting documents including;
Trust Strategic Plan
Clinical Strategy
Key section points: The Estates strategy is developed in accordance with the process described by the Department of Health, modified to better meet the needs of a Foundation Trust and Monitor. It asks three key question; Where are we now? Where do we want to be? How do we get there? There is close alignment with the principal strategies of the Trust. The strategy is forward looking, based on the commissioning intent, national policy and the emerging direction for health and social care locally. An iterative process is used to ensure alignment, and where required data or plans will be reviewed to ensure they remain current and relevant. An estates strategy designed to be ‘best fit’ just for current services, soon goes out of date.
Sherwood Forest Hospitals NHS Foundation Trust Estates Strategy - October 2015 17
Financial Strategy
Workforce Strategy
Organisational Development Strategy
IM&T Plan
Annual Plan
Better Together Transformational Programme - Estates & Commercial Strategy
Travel Plan Through dialogue and engagement with key stakeholders, it has been possible to better understand the limitations posed by the current estate configuration and condition with the aim of developing potential solutions for improvement. Some of the underpinning strategies, aimed at setting the future direction of clinical services, are in the early stages of development and as part of an iterative process these will be re-visited and checked for alignment. The output from this stage is a schedule of key strategic aims and developments for the Trust, focused on meeting the aims and objectives set out earlier. There should also be strong correlation to the Trusts vision and values, its priorities and a direct correlation to addressing the areas identified as requiring improvement in the initial assessment of the current estate. How do we get there? This final stage in the strategy development process takes the information, data and output from the previous stages to develop key strategic themes and deliverables, which includes the capital investment requirements for a rolling 5-year period.
4.3 Triangulation and Iteration: Keeping it aligned
At each stage, reference is made to the supporting strategies and plans of the Trust, to ensure we align the outcomes for maximum benefit. The Estates Strategy is designed to fit as part of as suite of documents, with strong read across and avoiding duplication. An example of this would be ensuring the identified accommodation needs for a particular clinical team align with the workforce plan, are affordable within the financial plan, are underpinned by appropriate service lines that support the identified priorities of the Trust. Where full alignment is not achieved, iterations of the plan need to be undertaken to achieve the optimum ‘fit’
4.4 Review Process
Throughout the development of the Estates Strategy, we review the position of reference data, the targets we develop and also ‘sense check’ the emerging options for reconfiguration to ensure they are prudent, operationally sound and based upon firm foundations. It is essential that such key proposals are also discussed with senior colleagues and stakeholders, ensuring a shared understanding of the drivers, priorities and rationale behind them. Where provisional data or information is used as the basis of our plans for the estate, these are noted and will be revisited as required when new data becomes available.
Sherwood Forest Hospitals NHS Foundation Trust Estates Strategy - October 2015 18
5 Where are we now?
5.1 Our Existing Estate
We presently operate from three hospital sites; King’s Mill Hospital, Newark General Hospital and Mansfield Community Hospital. We have invested considerably in the estate in recent years, particularly at King’s Mill Hospital where some 80,000m2 of new hospital accommodation was built under a PFI contract, which runs from 2005 to 2043. The total investment for the Mansfield Acute Services (MAS) PFI scheme was £320m, including investment at all 3 hospitals. The Trust also provides a limited range of outpatient services from Ashfield Health Village, which is outside the scope of this strategy. The PFI investment was transformational for our organisation, with the wholesale replacement of life expired, poor quality assets that were simply unsustainable and not capable of improvement. Whilst we are currently challenged by the revenue implications of the new development, we must not lose sight of the huge quality gains that have been achieved and the costs and disruption that would have been incurred in any piecemeal site redevelopment. A significant contractual dispute with the PFI contractor curtailed plans for further redevelopment of the retained estate. In light of the mix of new build and retained estate we currently have mixed performance across a range of indicators, suggestive of the need to rationalise and resolve legacy issues.
5.2 King’s Mill Hospital
The new build assets house all of our inpatient accommodation at King’s Mill Hospital, most outpatients’ clinics (in the King’s Treatment Centre) and dedicated facilities for women and children, and were completed in 2013. King’s Mill Hospital is by far the largest and most intensely used of our three hospitals, with the first phases of the new development opening in 2007. The hospital provides medical, surgical, paediatric, obstetric and gynaecological services, with a total of 650 inpatient beds, a diagnostic and treatment centre, an emergency care centre, a critical care unit, a neonatal intensive care unit and a full range of diagnostic and support services King’s Mill Hospital also has approximately 43,503m2 of retained estate which includes an acute core housing imaging and theatres within buildings that have been built in a piecemeal fashion from the 1940s to early 2000s, and an Accident and Emergency Department, with Emergency Assessment
Key section points:
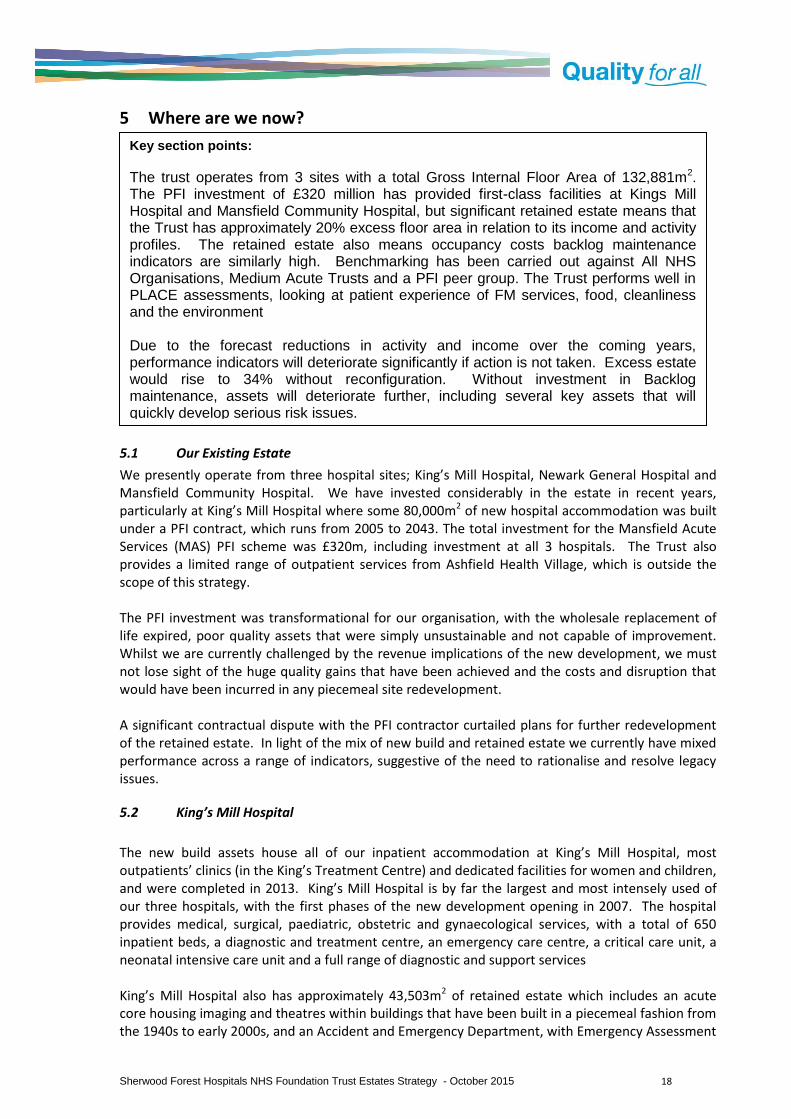
The trust operates from 3 sites with a total Gross Internal Floor Area of 132,881m2. The PFI investment of £320 million has provided first-class facilities at Kings Mill Hospital and Mansfield Community Hospital, but significant retained estate means that the Trust has approximately 20% excess floor area in relation to its income and activity profiles. The retained estate also means occupancy costs backlog maintenance indicators are similarly high. Benchmarking has been carried out against All NHS Organisations, Medium Acute Trusts and a PFI peer group. The Trust performs well in PLACE assessments, looking at patient experience of FM services, food, cleanliness and the environment Due to the forecast reductions in activity and income over the coming years, performance indicators will deteriorate significantly if action is not taken. Excess estate would rise to 34% without reconfiguration. Without investment in Backlog maintenance, assets will deteriorate further, including several key assets that will quickly develop serious risk issues.

Sherwood Forest Hospitals NHS Foundation Trust Estates Strategy - October 2015 19
Centre provided in retained 1980s accommodation. Most support services are provided across this retained estate. Despite the recent PFI investment, some key functions, notably theatres, imaging, Pharmacy ADU and CSSD are housed in accommodation that is no longer considered fit for purpose.
An overview of the King’s Mill Hospital site is shown overleaf, together with high-level issues to be addressed by the Estates Strategy. The current configuration of the King’s Mill site may be represented as shown below;
Current Configuration of the King’s Mill Hospital site

Sherwood Forest Hospitals NHS Foundation Trust Estates Strategy - October 2015 20

Sherwood Forest Hospitals NHS Foundation Trust Estates Strategy - October 2015 21
5.3 Newark Hospital
Newark Hospital is some 24 miles from King’s Mill Hospital, with two in-patient wards, outpatient clinics, day case theatres and diagnostic & imaging facilities. The hospital occupies at site of 2.3 hectares and has a gross internal area of 14,000m2, predominantly built between 1930 and 2002. Investment has been made recently, to bring elements up to EstateCode Condition B, to enable inclusion in the PFI service contract. Newark Hospital provides a comprehensive range of treatments on site, including an extensive range of consultant-led outpatient services, day-case procedures, diagnostic and therapy services, endoscopy, pre-operative assessment, a Minor Injuries Unit/Urgent Care Centre and a medical ward. Also included is the Fernwood Community Unit which provides recuperation for elderly or frail people and the Bramley Children's Unit, providing dedicated outpatient services for children. The hospital receives full back-up from the teams at King's Mill and the services are wholly compatible. Physiotherapy services are currently located in Byron House on the Newark Hospital site, in space rented from Nottinghamshire Healthcare NHS Foundation Trust. A full review of services to be delivered from Newark Hospital was completed in 2013, resulting a strategic direction being published. A block plan of the site is included at Appendix B
5.4 Mansfield Community Hospital
Mansfield Community Hospital lies 1.7 miles from King’s Mill Hospital, has a footprint of 1.5 hectares and a gross internal area of 14,759m2. It has two inpatient wards used by the Trust, and outpatient clinic facilities. The site was completely redeveloped as part of the PFI contract, and a cost recharge mechanism is in place, with SFHFT holding the Project Agreement on behalf of NHS Property Services, being the head tenant and recharging respective organisation for use of facilities accordingly. Mansfield Community Hospital provides 48 geriatric and ortho-geriatric rehabilitation beds, and short term and respite care for people with chronic neurological conditions (16 beds). The Sherwood Rehabilitation Unit, a specialist multidisciplinary rehabilitation team, based at Mansfield Community Hospital. It provides step-down care for patients leaving King’s Mill Hospital. A block plan is included at Appendix B.

Sherwood Forest Hospitals NHS Foundation Trust Estates Strategy - October 2015 22
5.5 Estate Returns Information Collection (ERIC) Data
Based upon the Trusts 2014/15 ERIC data return, the following high-level metrics are produced. This data is further used to enable performance against the national indicator dataset and also against comparable or particularly relevant Trusts.
Parameter King’s Mill Hospital
Newark Hospital
Mansfield Community
Hospital
Total
Gross Area 118,601m2 14,280m
2 NHSPS Site 132,881m
2
Net book Value £207m £12.9m NHSPS site £219.9m
Occupied Beds 636 35 48 719 beds
Critical Backlog Maintenance*
£1.546m £311k Nil £1.857m
Low / Moderate Backlog Maintenance*
£8.626m £1.038m Nil £9.664m
Risk Adjusted Backlog Maintenance*
£3.384m £382k Nil £3.769m
* note: Current data is not fully compliant with DH guidelines, and is currently being re-assessed
5.6 Physical Condition & Backlog Maintenance
The backlog maintenance position of the Trust is stated taking the provision of ‘Schedule 38’ (described in more detail in section 5.7) into account, and is shown below. Whilst this shows the financial exposure of the Trust, it does not fully represent the physical condition and operational risk to the Trust. In accordance with Department of Health Backlog Maintenance methodologies, the costs shown do not include fees, VAT or PFI provider margins, which have the potential to increase out-turn costs by approximately 40%
Ref. Backlog Risk King’s Mill Newark Total
A High £286,776 £62,647 £349,423
B Significant £1,259,527 £248,860 £1,508,387
C Moderate £4,490,945 £701,830 £5,192,775
D Low £4,135,522 £726,556 £4,862,078
E Critical (A+B) £1,546,302 £311,507 £1,857,809
F Total Backlog (A+B+C+D)
£10,172,769 £1,739,893 £11,912,663
G Risk Adjusted* £3,384,309 £382,926 £3,767,236
*See Risk Adjusted Backlog narrative at 6.7 below
Sherwood Forest Hospitals NHS Foundation Trust Estates Strategy - October 2015 23
5.7 Risk Adjusted Backlog Maintenance
The Risk Adjusted Backlog (RAB) Maintenance figure represents the figure that the Trust should have provision to address within any one financial year, on the basis that High and Significant items are those deemed to be at risk of imminent failure, and having significant service impact. RAB is calculated by adding together High and Significant Risk maintenance items (together known as Critical Backlog) with the annual portion of Low and Moderate Risk items taking the anticipated remaining life of each element into account. Once a trust has addressed the Critical elements of backlog maintenance in Year 1 of any plan, the Risk Adjusted figure rapidly falls to become an annual investment requirement, notwithstanding further items may increase in terms of risk profile, and new items may be added to the Backlog Maintenance register. Due to the provisions of Schedule 38 of the PFI agreement, an element of the Unitary Charge Payment (some £400,000 per annum) is made to include elements of the retained estate with an individual value not exceeding £1,300. The effect of this is to transfer the financial risk of failure of a very wide range of individual elements falling within the Low and Moderate backlog maintenance categories from the Trust to ProjectCo, thus producing a lower financial status. Advice has been received with regard to the reporting of Backlog figures, which will lead to a revised figure of actual condition rather than financial exposure being assessed and reported.
5.8 Environmental Performance
The Trust remains committed to reducing its impact on the environment and continually seeks opportunities to improve health, conserve energy and reduce carbon emissions. All trusts across the NHS are expected to reduce their estate running costs and carbon emissions and Sherwood Forest Hospitals is committed to reducing its impact on the environment and demonstrating good corporate citizenship by reducing carbon dioxide emissions to 80% below 2007 levels by 2050.
The new King’s Mill Hospital facilities provide energy efficient accommodation; the challenge to be met is improving energy efficiency in the retained estate and at Newark Hospital. This gives the Trust the opportunity to develop its sustainability, environmental and climate change strategies. As part of the Estates strategy, and to meet the challenges of climate change, the Trust will refine a number of its objectives and activity streams to further improve environmental performance and reduce costs, including:
Proactive management of energy, utilities and waste
Design of upgrades and new works to incorporate low energy technologies
Effective working with contract partners and other stakeholders
Driving value for money through dynamic procurement of utilities
Strong governance and communication
Pioneering geothermal technologies
Exploring options for combined heat and power systems at King’s Mill and Newark hospitals
A robust approach to carbon management.
The objectives are part of the latest draft of the Trust’s carbon reduction management plan (CRMP) and sustainable development management plan (SDMP). The Trust will demonstrate its commitment to sustainability in 2015 by applying for the Good Corporate Citizen (GCC) and Carbon Saver accreditations.

Sherwood Forest Hospitals NHS Foundation Trust Estates Strategy - October 2015 24
In achieving these standards the Trust will gain recognition for its activities to support sustainability both within the organisation and outside in the community.
NHS carbon footprint
As a member of the Government’s Carbon Reduction Commitment (CRC) Energy Efficiency Scheme, the Trust is required to report its emissions annually to the Department of Energy and Climate Change. The Trust’s emissions for 2014/2015 were 23,842 tCO2 (tonnes of equivalent carbon emissions). This was an increase on the previous year, demonstrating the need to engage staff as part of a wider effort to improve energy efficiency across the Trust.
* Data normalised for both activity (FCEs) and Hospital Degree Days (18.5
oC)
0
10000000
20000000
30000000
40000000
50000000
60000000
70000000
2012/13 2013/14 2014/15
Kil
ow
att
Ho
urs
Normalised Primary Energy Use - kWh
Coal
Electricity
Gas
Oil
Sherwood Forest Hospitals NHS Foundation Trust Estates Strategy - October 2015 25
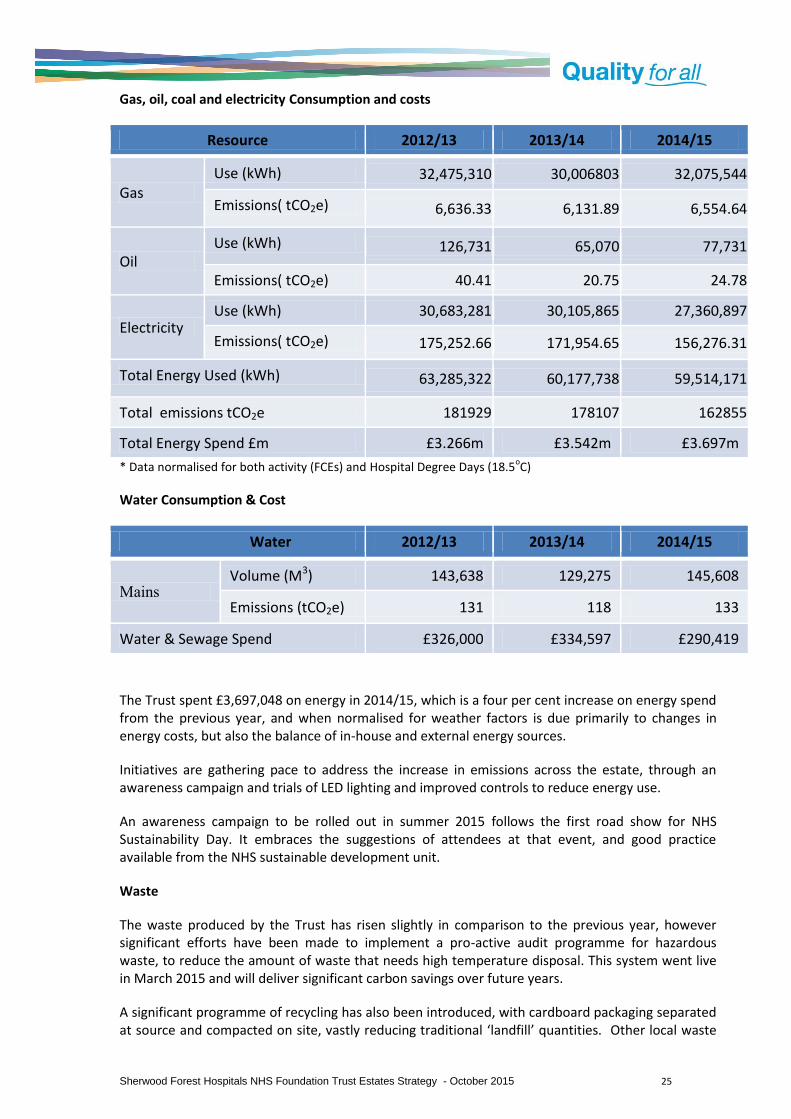
Gas, oil, coal and electricity Consumption and costs
Resource 2012/13 2013/14 2014/15
Gas Use (kWh) 32,475,310 30,006803 32,075,544
Emissions( tCO2e) 6,636.33 6,131.89 6,554.64
Oil Use (kWh) 126,731 65,070 77,731
Emissions( tCO2e) 40.41 20.75 24.78
Electricity Use (kWh) 30,683,281 30,105,865 27,360,897
Emissions( tCO2e) 175,252.66 171,954.65 156,276.31
Total Energy Used (kWh) 63,285,322 60,177,738 59,514,171
Total emissions tCO2e 181929 178107 162855
Total Energy Spend £m £3.266m £3.542m £3.697m
* Data normalised for both activity (FCEs) and Hospital Degree Days (18.5oC)
Water Consumption & Cost
Water 2012/13 2013/14 2014/15
Mains Volume (M3) 143,638 129,275 145,608
Emissions (tCO2e) 131 118 133
Water & Sewage Spend £326,000 £334,597 £290,419
The Trust spent £3,697,048 on energy in 2014/15, which is a four per cent increase on energy spend from the previous year, and when normalised for weather factors is due primarily to changes in energy costs, but also the balance of in-house and external energy sources.
Initiatives are gathering pace to address the increase in emissions across the estate, through an awareness campaign and trials of LED lighting and improved controls to reduce energy use.
An awareness campaign to be rolled out in summer 2015 follows the first road show for NHS Sustainability Day. It embraces the suggestions of attendees at that event, and good practice available from the NHS sustainable development unit.
Waste
The waste produced by the Trust has risen slightly in comparison to the previous year, however significant efforts have been made to implement a pro-active audit programme for hazardous waste, to reduce the amount of waste that needs high temperature disposal. This system went live in March 2015 and will deliver significant carbon savings over future years.
A significant programme of recycling has also been introduced, with cardboard packaging separated at source and compacted on site, vastly reducing traditional ‘landfill’ quantities. Other local waste

Sherwood Forest Hospitals NHS Foundation Trust Estates Strategy - October 2015 26
sources are being assessed with a local supplier to be disposed as ‘co-mingled’ waste for rollout later in 2015. If successful, this will result in a significantly increased rate of recycling with minimal waste going for landfill.
5.9 Our PLACE Assessment
April 2013 saw the introduction of PLACE, (Patient Led Assessment of the Care Environment) which is the new system for assessing the quality of the patient environment, replacing the old Patient Environment Action Team (PEAT) inspections. The assessments apply to hospitals, hospices and day treatment centres providing NHS funded care. Good environments for healthcare matter. Every NHS patient should be cared for with compassion and dignity in a clean, safe environment. Where standards fall short, they should be able to draw it to the attention of managers and hold the service to account. PLACE assessments provide motivation for improvement by providing a clear message, directly from patients, about how the environment or services might be enhanced. The assessments see local people go into hospitals as part of teams to assess how the environment supports patient’s privacy and dignity, food, cleanliness and general building maintenance. It focuses entirely on the care environment and does not cover clinical care provision or how well staff are doing their job. The assessments take place every year, and results reported publicly to help drive improvements in the care environment. The results will show how hospitals are performing nationally and locally, against others in their peer group. The most recent inspection of our services for which narrative feedback is available was completed in May 2014, and was highly positive in respect of cleanliness, environment, food quality, maintenance, accessibility and overall appearance. There were some minor comments for improvement, such as seating, way-finding and bins in limited areas. Concerns were expressed about the condition of the old link corridor at King’s Mill Hospital

Sherwood Forest Hospitals NHS Foundation Trust Estates Strategy - October 2015 27
In summary, the Lead Assessor concluded in their report;
“Excellent hospital in every field, staff cannot do enough, patients very satisfied, all treated with respect and dignity. Food service very good. I am very impressed. This is a modern building with very good standards of cleanliness, is well maintained and where patients are treated with dignity and respect and where the food service is generally very good. Caring staff who went that extra mile. Food service excellent with good variety. Patients spoken to were very happy. Hospital very clean and tidy “
2015 PLACE Results.
The 2015 PLACE results show a high standard is still being achieved across a range of indicators, based on patient experience, with the Trust exceeding national scores in all but one domain, Dementia, which is a new and emerging standard not fully inspected.
Site Cleanliness Food & Food Service
Privacy, Dignity & Wellbeing
Condition, Appearance and Maint.
Dementia Avg
King’s Mill Hospital 99.78% 90.20% 88.69% 96.54% 73.29% 89.70%
Newark Hospital 99.84% 95.79% 92.20% 93.43% 72.38% 90.73%
Mansfield Community Hospital
100% 97.43% 87.19% 93.13% 69.66% 89.48%
Trust Averages 99.87% 94.47% 89.36% 94.37% 71.78%
National Averages 97.6% 88.30% 86.00% 90.10% 74.50%
5.10 Updating Our Estates Information
We have made significant progress in updating and refining our Estates information, working with our PFI provider to ensure we collect data in the appropriate format and to agreed standards and definitions. We acknowledge we need to compete further work on several aspects of our 7-facet information, and have now established our use of the MiCad system, as the leading NHS FM asset management tool to help us improve our data collection. We are planning data collection for Functional Suitability, Space Utilisation and Energy Performance at individual asset level, to supplement the data we already hold from in legacy form.
5.11 High Level Key Performance Indicators
High-level performance indicators show that we occupy excess estate for the volume of clinical activity we complete, and also against the Trust’s income. When compared against all Trusts, we occupy circa 19.2% too much estate by floor area. Our overall performance is summarised in the table below:

Sherwood Forest Hospitals NHS Foundation Trust Estates Strategy - October 2015 28
KPI Activity
(FCE)/100m2
Income £10
/m2
Occupancy Cost
£/m2
Risk Adjusted Backlog maintenance £/m2
SFHFT 76 214 398 28
Top ⅓ (NHS) 99 327 297 15
PFI Peer Group (median)
85 258 299 18
Despite having made significant investment in our estate through our PFI scheme, we still retain legacy estate that lowers the overall performance of the Trust and causes us to incur excess costs. Our Risk Adjusted Backlog maintenance is adversely affected by the condition of the Pharmacy ADU & CSSD building, which is in poor condition and is critical to the delivery of clinical services, and hence has a high risk profile. We have also calculated our performance against a group of 14 comparable acute trusts, all having a significant PFI development. The criteria for the comparator group is; Acute trust, with a PFI development in excess of £200 million, completed by 2014.
The high level performance indicators for our Trust, as shown against the DH national data set are shown below (Cluster: All Trusts), together with radar charts and narrative upon each. All references are made against the top performing third of NHS Trusts (upper 33%)

Sherwood Forest Hospitals NHS Foundation Trust Estates Strategy - October 2015 29
SHERWOOD FOREST HOSPITALS NHS FOUNDATION TRUST - 2014/15 Trust data against 2013/2014 National position
Grouping PI (Percentile
Bands)
PI SUMMARY Trust PI
33% 34% 33%
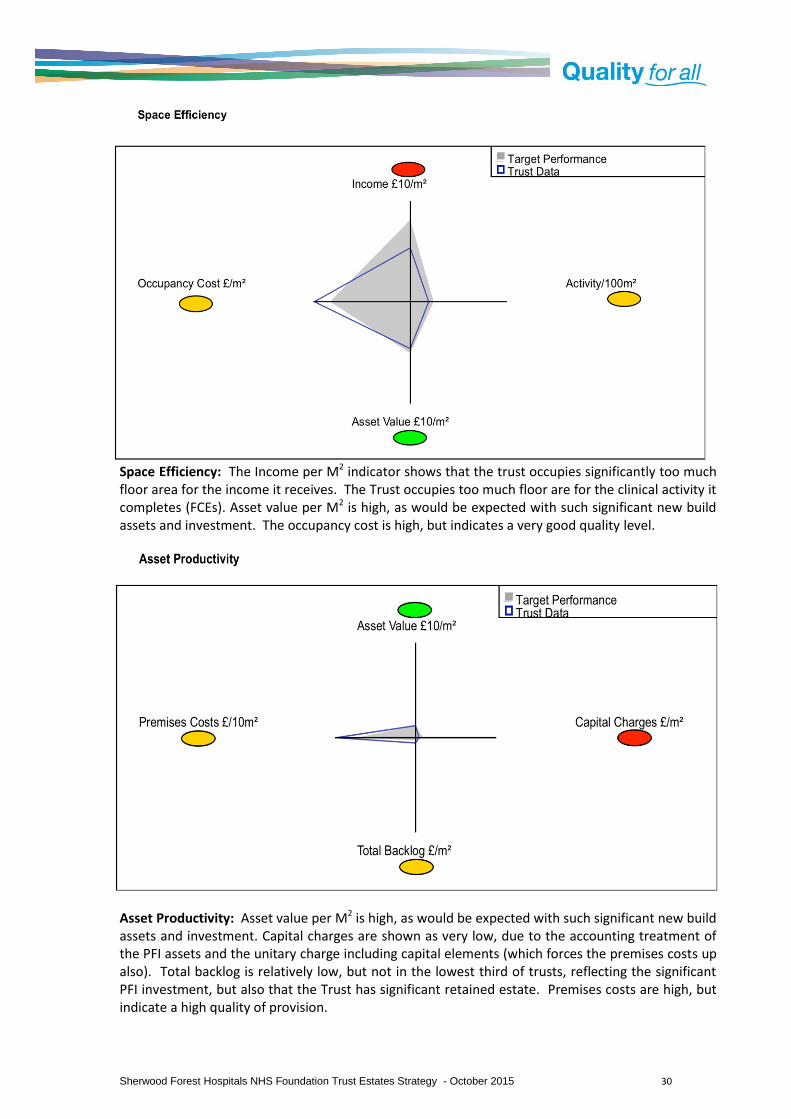
Space Efficiency
Income £10/m² 214 265 266 and 326 327
Activity/100m² 76
46 47 and 98 99
Asset Value £10/m² 183
135 136 and 176 177
Occupancy Cost £/m² 398 263 264 and 331 332
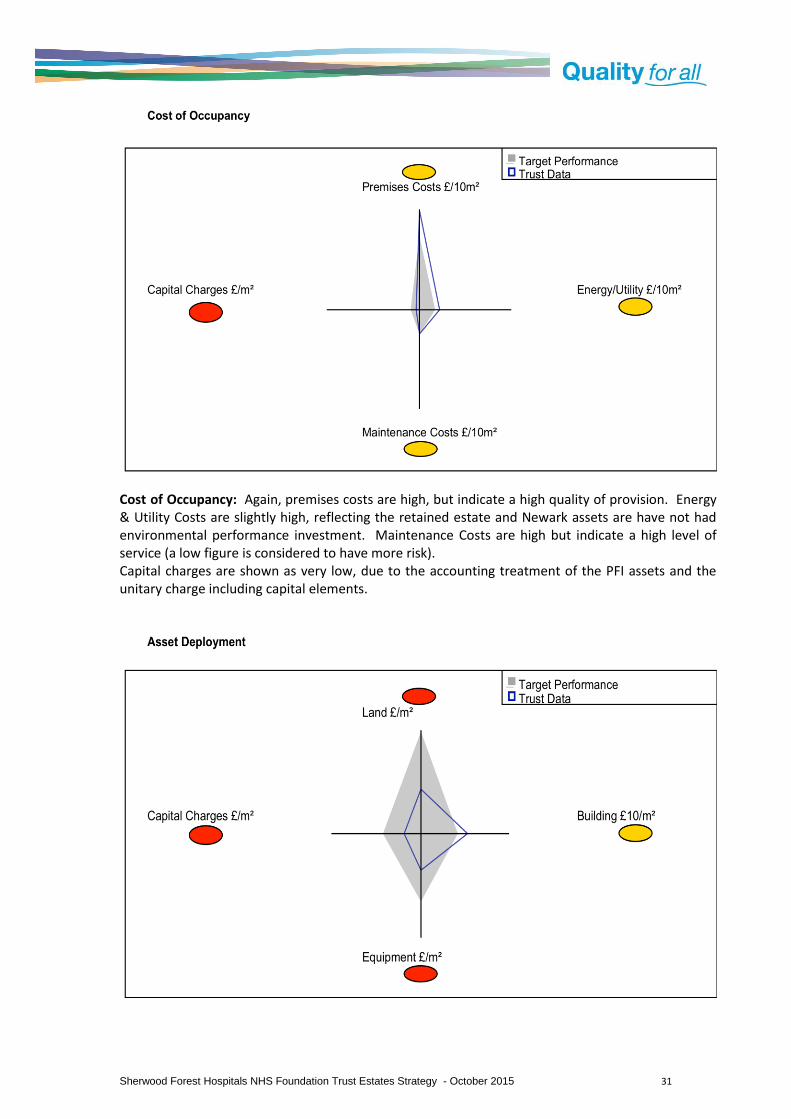
Asset Productivity
Asset Value £10/m² 183 135 136 and 176 177
Capital Charges £/m² 55
95 96 and 128 129
Total Backlog £/m² 90 50 51 and 164 165
Premises Costs £/10m² 1389 1022 1023 and 1409 1410
Asset Deployment
Land £/m² 131 161 162 and 297 298
Building £10/m² 159
98 99 and 128 129
Equipment £/m² 105
107 108 and 196 197
Capital Charges £/m² 55 95 96 and 128 129
Estate Quality
Asset Value £10/m² 183 135 136 and 176 177
Depreciation £/m² 55 66 67 and 94 95
Critical Backlog £/m² 14
12 13 and 48 49
Risk Adjusted Backlog £/m² 28 15 16 and 56 57
Cost of Occupancy
Premises Costs £/10m² 1389 1022 1023 and 1409 1410
Energy/Utility £/10m² 308
245 246 and 312 313
Maintenance Costs £/10m² 349
250 251 and 345 346
Capital Charges £/m² 55 95 96 and 128 129
Groupings:
All Trusts
The ‘all trusts’ grouping is used due to the multi-site nature of the Trust, delivering clinical activity including Newark Hospital and Mansfield Community Hospital. Data has been produced using the ‘medium acute’ grouping, which is included at Appendix C, which has also been referenced in reaching conclusions for future development and performance trajectories.
Sherwood Forest Hospitals NHS Foundation Trust Estates Strategy - October 2015 30
Space Efficiency: The Income per M2 indicator shows that the trust occupies significantly too much floor area for the income it receives. The Trust occupies too much floor are for the clinical activity it completes (FCEs). Asset value per M2 is high, as would be expected with such significant new build assets and investment. The occupancy cost is high, but indicates a very good quality level.
Asset Productivity: Asset value per M2 is high, as would be expected with such significant new build assets and investment. Capital charges are shown as very low, due to the accounting treatment of the PFI assets and the unitary charge including capital elements (which forces the premises costs up also). Total backlog is relatively low, but not in the lowest third of trusts, reflecting the significant PFI investment, but also that the Trust has significant retained estate. Premises costs are high, but indicate a high quality of provision.
Sherwood Forest Hospitals NHS Foundation Trust Estates Strategy - October 2015 31
Cost of Occupancy: Again, premises costs are high, but indicate a high quality of provision. Energy & Utility Costs are slightly high, reflecting the retained estate and Newark assets are have not had environmental performance investment. Maintenance Costs are high but indicate a high level of service (a low figure is considered to have more risk). Capital charges are shown as very low, due to the accounting treatment of the PFI assets and the unitary charge including capital elements.

Sherwood Forest Hospitals NHS Foundation Trust Estates Strategy - October 2015 32
Asset Deployment: The land value (relative to the floor area) indicates in part the Trust has too much land proportionately, but also that the value of the land is lower than many other Trusts, due largely to geography. Building Values per M2 are high, as would be expected with such a significant investment in new PFI assets, even with the retained estate elements which are not fully depreciated. Equipment values are low, and have fallen in recent years, which could indicate that the Trust is not renewing (purchased) assets at the expected rate. Capital charges are shown as very low, due to the accounting treatment of the PFI assets and the unitary charge including capital elements.
Estate Quality: Asset value per M2 is high, as would be expected with such significant new build assets and investment. Depreciation is low, which is considered to be a function of the PFI investment and accounting treatment, but does mean internally generated capital may be limited. Critical Backlog Maintenance, which is deemed high and should be addressed within one financial year is distorted by one very poor asset. Risk Adjusted Backlog Maintenance cost per M2 is in the mid-range, reflecting the significant investment required to address the Critical Backlog requirement.
5.12 Implications of doing nothing
We have shown how the Trust is performing currently, across a range of organisational and estates Key Performance Indicators. Over time, without the correct investments and reconfiguration, many of these indicators will deteriorate, risks will increase and quality standards fall. If the estate was not rationalised in line with Trust’s income and activity figures, and investment was not made to reduce Backlog Maintenance issues, the key performance indicators are projected to be as follows;

Sherwood Forest Hospitals NHS Foundation Trust Estates Strategy - October 2015 33
The backlog maintenance profiles, without investment, deteriorate rapidly due to the volume of assets considered to be have significant or moderate risk profiles. Without investment to offset deterioration of non-PFI asset conditions, low and moderate profiles will also increase. The provisions of Schedule 38 do provide some investment to reduce the financial impact and expose of such deterioration - this data reports on physical condition rather than financial liability. The profiles for Backlog Maintenance without investment are shown below;
0
50
100
150
200
250
300
350
400
450
2014/15 2015/16 2016/17 2017/18 2018/19
KPI’s Without Reconfiguration of the Estate
£10 Income per M2
FCE per 100m2
Occupancy Cost per M2
Risk Adjusted Backlog per M2
£0
£5,000,000
£10,000,000
£15,000,000
£20,000,000
2014/15 2015/16 2016/17 2017/18 2018/19
Backlog Maintenance Profile Without Planned Investment
High Risk
Significant Risk
Moderate Risk
Low Risk
Total Backlog

Sherwood Forest Hospitals NHS Foundation Trust Estates Strategy - October 2015 34
5.13 Summary of current position
The key issues to be drawn from the current Estates Key Performance Indicators are that:
The Trust occupies too much estate in relation to income and clinical activity;
Premises and Occupancy costs are high, but indicate a high quality provision;
There is an urgent need to address high and significant backlog maintenance needs, which are distorted by the urgent need to replace the Pharmacy ADU and CSSD asset;
Further investment and attention is required to reduce Energy & Utility Costs. Many of the indicators are significantly affected by the combination of both new PFI asset and a significant retained estate, with both elements having quite different characteristics. This makes comparison more challenging against a national picture, and in setting targets for improvement, reference is made to other NHS Foundation Trusts, known to Sherwood Forest Hospitals, who also have Acute PFI facilities but have completed the rationalisation of their asset base to remove retained estate and legacy issues.

Sherwood Forest Hospitals NHS Foundation Trust Estates Strategy - October 2015 35
6 Where Do We Want to Be?
6.1 Our Organisational Objectives
As we look ahead over the next five years and beyond, the Trust Board has agreed a strategic direction that will mark enormous progress on the journey to become a clinically and financially sustainable organisation. We will:-
Consolidate our position as the major provider of hospital based urgent and emergency care;
We will rapidly and decisively implement the “7-day working” agenda;
We will work with primary, community and social care services to be more proactive in the care of the frail elderly and those with single or multiple long-term conditions;
We will work with partners to reduce the numbers of people admitted to our hospitals through the lack of alternatives to better support them;
We will better manage our acute pathways for those that need them, at King’s Mill Hospital;
We will reduce our reliance on acute beds at Newark and Mansfield Community Hospitals, working with partners to develop those beds for ‘Intermediate Care’ services and enabling rehabilitation and patient flow in the most appropriate setting;
We will continue to develop planned care on an ambulatory basis, from the King’s Mill Treatment Centre and Newark Hospital;
We will continue to develop extended clinical networks that benefit the patients we serve;
We will improve our medical and workforce productivity;
We will pursue outsourcing and collaborative arrangements for some clinical and non-clinical support services;
We will continue to embed our “Quality for All” programme to instil our values and behaviours amongst our teams;
We will continue to participate in the delivery of the Better Together Transformational Programme, reflecting the full impact in our own plans to understand the implications for additional liquidity and transformational support that may be required;
We will direct our efforts towards ensuring improvement is measured and achieved within the 5 domains of the NHS Outcomes Framework.
Key section points:
As part of our financial recovery and delivering on the vision of the trust, as member of the BTTP we need to rationalise our estate significantly, to remove excess floor area, sub-standard elements and to remove or reduce backlog maintenance requirements. We need to enable the delivery of new models of care, improved pathways and the elimination of waste. Our acute in-patient capacity requirements are forecast to reduce by circa 146 beds as demand reduces and some beds will transition to sub-acute or ambulatory services. Investment opportunities will be limited and therefore must be focused on achieving organisational sustainability. We will plan for no further new builds; we will proactivity plan to reduce our floor area and hence backlog maintenance requirements; we will eliminate our critical backlog issues; we will maximise utilisation of our PFI assets; we will maximise enabling technology for our teams; we will improve the experience of our patients and we will improve our environmental performance. We have set targets for all key performance indicators.

Sherwood Forest Hospitals NHS Foundation Trust Estates Strategy - October 2015 36
6.2 The Impact of Service Changes
The Better Together Transformation Programme means that demand for our acute services is likely, in the main, to reduce significantly. In broad terms, the programme has the following objectives in terms of activity: -
15% reduction in A&E attendances 20% reduction in non-elective acute admissions 30% reduction in acute bed days
25% reduction in admissions to nursing and residential homes (not directly relevant to the Trust but indicates direction of travel)
10% reduction in secondary care elective referrals 20% reduction in paediatric admissions to hospital
Overall, we project a large reduction in demand for emergency care and hence non-elective admissions. By contrast, we are planning for growth in planned care through both demographic growth and gains in market share. These are partially offset by fewer outpatient attendences (new-to-follow up ratio) as we bring our clincical practice in line with top decile performance. Our forecast activity changes for the period 2013-14 (out-turn) to 2018/19 (forecast) are shown below.
We have calculated the future bed stock required to deliver the above activity, by the end of the planning period as to be a reduction of around 146 beds, (including Newark and MCH service impact) with a corresponding reduction in the capacity of support services required to deliver this level of activity. Also included in the assessment are the stated efficiency requirements in terms of reductions in Length of Stay, the impacts of 7-day working and our overall efficiency programme.

Sherwood Forest Hospitals NHS Foundation Trust Estates Strategy - October 2015 37
2013/14 (out-turn)
2014/15
2015/16 2016/17 2017/18 2018/19 Totals
Elective Inpatient Spells 6,385 6,571 6,754 7,088 7,422 7,756 35,591
% Year-on year change
2.91 2.78 4.95 4.71 4.50 19.86%
Non-elective Inpatient Spells 40,107 39,379 37,613 36,433 36,034 35,635 185,094
% Year-on-year change
-1.85 -4.70 -3.24 -1.11 -1.12 -12.01%
Occupied Bed Days 226,121 253,401 234,150 207905 219,809 210,043 -20.6%
Bed Capacity 719 719 668 627 599 573 -25.48%
Activity (FCE) 129,411 101,165 95,765 92,097 90,156 88,256 -14.62%
6.3 Our Financial Plans
Due to the changes brought about by the Better Together Transformation Programme and the changes to our demographic profile, producing changes by specialty, we have forecast a significant reduction in our operating income, reducing from £264,9m in the baseline year of 2013/14 to £239.5m in 2018/19, as shown in the table below:-

Sherwood Forest Hospitals NHS Foundation Trust Estates Strategy - October 2015 38
6.4 A Productive Estate
In light of our current position, both in terms of finance and estate performance, it is vital that we significantly improve the productivity of our estate, on multiple levels;
We must increase the utilisation of clinical space, to reduce inefficiency and maximise the use of our highest quality assets for tariff-earning activity.(net income generators);
We must reduce the amount of estate we use for non-clinical activities (net cost);
We must bring the operating costs of the estate to the fore with service lines, not just be a corporate overhead (incentivise efficient use);
We must improve the efficiency of our long-term assets and resolve underperforming assets though disposal, demolition or refurbishment;
We must support the provision of a technology led and enabled environment to enhance productivity and utilization of resources, including space;
We must adopt a set of metrics that show both the cost and performance of our built assets to support Service Line Management principles;
We must seek to reduce the operating costs of our estate through effective use of resources, good management and environmental performance improvements.
We have considered multiple options in developing our Estates Strategy, and in accordance with the above principles, we have concluded that we must adopt a “no new build” approach to our future configuration, for the following reasons;
We have invested very heavily in new, state-of-the-art facilities, and must focus upon increasing our return on investment for them;
We must reduce our operating cost (unitary charge and energy), and avoid increasing costs still further;
All our performance indicators show we have excess estate for our expected activity and income profiles, and can accommodate the changes required within our overall new build footprint, and make better use of our retained estate;
We must make best use of the capital resources available to us, and minimise the revenue consequences of such capital investments (e.g. capital charges).
6.5 Capital Investment Planning
We recognise that for some time, our Trust will require transitional financial support, and that any investments we make in our estate have to demonstrate value for money. Further, capital resources cannot be relied upon unless a good return on investment is achieved. We have shown that both currently and moving forwards, we have excess Estate, and for that reason we will, wherever possible, avoid further increasing our gross internal area with new build assets; we will increase utilisation of our new PFI assets to optimum levels and minimise costly moves and changes within the current provision. We firmly believe that this fundamental principal will reduce on-going revenue consequences, improve estate performance and significantly reduce the levels of capital required to complete our Estate transformation, from the levels often associated with new build solution in NHS estates strategies. We have considerable new build assets; now we must maximise their utilisation. It will be challenging to achieve, but necessary. We will work with our stakeholders and Monitor in ensuring our proposal represent good value for money, are affordable, support our recovery plans and are affordable within the expectations of all parties.

Sherwood Forest Hospitals NHS Foundation Trust Estates Strategy - October 2015 39
6.6 Enhancing Our Care Environment
It is widely recognised that our new PFI accommodation provides a first-class care environment for our patients and visitors. However, we must address the elements of our retained estate used for direct patient care, to ensure we provide the best possible environment within the resources available. To achieve this, we propose our future estate be based upon a consolidated ‘Patient Core’, whereby all of our patient facing accommodation is brought together, enabling us to focus our improvements of the retained estate, increase the utilisation of our new build assets and remove our reliance on out-lying assets that lead to poorer patient experience and operational effectiveness
6.7 Meeting Our Regulatory Obligations
We recognise the importance of working with our regulators to ensure we fully meet, if not exceed, the standards expected of a well run, high performing NHS Foundation Trust. These standards ensure we provide high quality, safe, effective care in an economically sustainable manner. We have an inherent obligation to protect our patients, visitors, staff and others, we must ensure the care we provide is of the highest standards and that we provide good value for money to the tax payer. Our aim must also to be ensuring as much money as possible is available to support the delivery of care, through the elimination of waste, duplication and inefficient use of resources in our Estate and how we operate it. Our Estates strategy must ensure we minimise risk in all forms; that our environments are safe and provide a high quality experience for patients and visitors. The environment in which we provide our clinical services must be maintained to a very high standard, and support our staff to deliver high quality care. We will strive to ensure all our services to patients and visitors are provided in our best assets. We will ensure we provide all our staff with safe, suitable and effective working environments, whatever their role. We will aim to eliminate, minimise or adequately control risks due to the built environment at every stage. We must ensure that any investment decisions are affordable and represent good value for money, and support our financial recovery plans
6.8 Our IM&T Strategy
Our Information Management & Technology strategy for the period 2013-2016 identifies a number of key objectives to be taken into consideration in determining our future estates configuration. These are shown in the table below, together with the anticipated implications for the Estates Strategy:-

Sherwood Forest Hospitals NHS Foundation Trust Estates Strategy - October 2015 40
IM&T Strategy Facet
Ad
dit
ion
al s
pac
e re
qu
irem
ent
Imp
rove
d S
pac
e u
tilis
atio
n
Incr
ease
d e
ner
gy
con
sum
pti
on
Dec
reas
ed
En
ergy
C
on
sum
pti
on
Infr
astr
uct
ure
re
qu
irem
ents
Red
uce
d s
tora
ge
req
uir
emen
ts
Sup
po
rts
agile
wo
rkin
g
Red
uce
d F
M
req
uir
emen
ts
Integrated Care Record Programme
Replacement of PAS
Removal of paper from clinical processes
Cloud solutions
Upgrade VitalPACS
Electronic Document Management Systems
Mobile working solutions
Mobile telephony
Printing strategy
Remote Access capability
Physical Server Hosting
Whilst none of the above developments have specifically identified energy requirements, it is widely acknowledged that the general growth and increased utilisation of electronic solutions leads to the majority of electrical demand increases in hospital settings, typically 3-5% per annum. Recent advances in technology energy performance are reducing the impact, and the replacement of older devices will further assist, but growth of at least 2% per annum is expected due to the number of devices, chargers and increased utilisation as we move away from paper based systems.
6.9 Our Workforce Strategy 2014-2017
Recognising the challenges we face in developing sustainable, high quality services, our workforce strategy identifies a number of initiatives to be factored into the future shape of our Estate, all aligned to the Trusts Strategic Plan and the Better together Programme. These include;
Nursing staffing levels
Newark Hospital Strategy
Recruitment and Retention of nursing and medical staff
Training and Development Strategy
Flexible Workforce and Flexible Working options
7-Day Working
Sickness, Absence, Health & Wellbeing
Performance Management
It is expected that our overall workforce will reduce by approximately 540 WTE in line with projected income and activity plans, adjusted for productivity gains and safe-staffing levels. Overall, it is anticipated our Workforce requirements will have a net reduction on the volume of estate required, but indicates improvements to functional suitability, operational effectiveness and quality are required.

Sherwood Forest Hospitals NHS Foundation Trust Estates Strategy - October 2015 41
6.10 Our Travel Plan
In 2015 the Trust completed its Travel Plan, which includes a number of proposals with direct relevance to the Estates Strategy. The Travel plan is developed in accordance with national and local government requirements, and is aligned to the Nottinghamshire County Council Local Travel Plan 2011-2026, and those of our neighbouring district councils. In summary, key elements include;
An Active Travel Plan, supporting walking, cycling and public transport as preferred modes of transport;
Meeting the requirements set out in NICE Public Health Guidance 41;
Promotion of sustainable travel (walking, cycling, public transport, car share);
Encouragement for patients, visitors and staff to use alternatives to personal cars;
Improving accessibility for patients, staff and visitors. The results of the travel survey have shown continued high use of personal cars, and we will improve facilities for non-car users to help promote alternatives as we develop our facilities. Car parking capacity is obviously a key spacial requirement and cost factor, and through our plans we will seek to reduce non-core parking spaces, and reduce the financial implication upon the trust for the provision of car parking, payable to our PFI partners whilst maintaining access for patients, visitors and staff through the promotion of alternatives. We will work with our advisors to ensure new developments include positive promotion on non-car methods of travel. Further, in planning the locations from which we deliver our services, we will be mindful of the overall
6.11 Our Corporate Estate Needs
We have identified a number of support service buildings that do not best match their current use, are vacant, underutilised or could offer potential to reduce costs. These include administrative functions, support functions and other non-patient facing services. Of particular note are the currently vacant Wards 1-3 within the retained estate, the School or Nursing accommodation, the Trust Administration Building (TB3) and the Training & Development Department. On an occupied cost per M2 basis, these buildings do not currently represent good value for money, with either poor utilisation or high cost factors. Further, proposals to form regional or sub-regional hubs for clinical support services such as Pathology create significant opportunities to improve the overall quality of long-term estates and reduce the requirement for new build, through re-designation of the current facilities. It is recognised that an electronic solution for Medical Records storage and retrieval is yet to be determined, and in any case may be some time away. The current facilities are under significant pressure and further capacity is required in the short-medium term. We have noted the overall workforce projections contained within the Strategic Plan and Workforce Strategy, which determines a reduction in both clinical and non-clinical staff levels of approximately 540WTEs. This reduction indicates a lower accommodation requirement for some teams than is currently provided.

Sherwood Forest Hospitals NHS Foundation Trust Estates Strategy - October 2015 42
6.12 Principles for Estate Development
In developing our Estates Strategy, and taking into account the issues discussed above, the prevailing financial resource limits and vision for the Trust, we have developed a set of principles to form the basis of our options for future estate development, as follows:
Pro-actively plan for the reduction of gross internal floor area to reduce operating cost, risks, investment needs and liabilities;
Eliminate Critical Backlog Maintenance items through demolition, replacement or renewals;
Re-utilise existing buildings where replacement is required. Minimise new builds. Maximise demolition of life-expired estate;
Maximise utilisation of PFI assets to achieve maximum return (productive estate principles)
Establish a ‘Patient Core’, to maximise operational effectiveness;
Improve adjacencies and quality of Theatres, ITU and Imaging by re-provision;
Re-designate areas of King’s Treatment Centre to improve utilisation, but minimise disruption to current accommodation and cost of change;
Relocate non-intensive services / low utilisation services from PFI areas;
CSSD & Pharmacy ADU to be located in an existing building, - not a new build PFI asset but one with suitable adjacencies;
Improve quality and patient experience;
Create capacity for the repatriation of services from Newark and MCH, where appropriate;
Enable use of retained estate capacity for repatriation or for others (cost reduction).
6.13 Environmental Performance
The trust has made considerable progress in recent years, both through the PFI scheme and through internal initiatives and improvement schemes, towards environmental performance improvements. Further, the Trust is a member of the Government’s Carbon Reduction Commitment (CRC) Energy Efficiency Scheme, and has a Carbon Reduction Plan. As part of the future Estate, we will seek to reduce the floor area (and hence heated volume) through the strategic reduction of poorly performing elements of the retained estate. We will continue to invest in innovative schemes to lower our energy consumption and costs, as well as promote good housekeeping practices and awareness amongst patients, visitors and our staff. We remain committed to our target of reducing our carbon emissions to 80% of our 2007 levels, by 2050, and the estates strategy will form a key feature of how we will achieve this.
6.14 Estate Performance Targets
We have used the “where are we now” data to identify the key areas in which our future Estate must deliver significant improvement, to meet both financial and operational performance requirements. Using the KPI’s discussed previously, interlinked with the changes identified in our Strategic Plan (in response to the Better Together Transformation Programme), a set of high level targets have been developed, to bring the Trust closer to “best in class performance”. These are further supported by the impact analysis of the key drivers of change articulated in the Strategic Plan 2014/15 to 2018/19. These targets are shown below, and form the basis of our option appraisals, and subsequent plan for delivery.

Sherwood Forest Hospitals NHS Foundation Trust Estates Strategy - October 2015 43
Performance Indicator Top ⅓ NHS performance
Current Performance
Target Performance 2020-2021
Income £10/m2 327 214 214*
Activity / 100m2 99 76 83*
Asset Value £10/m2 176 183 226
Total Backlog £/m2 50 89 16
Critical Backlog £/m2 12 14 0
Risk Adjusted BL £/m2 15 28 2
Energy Costs £/m2 245 308 259
Occupancy Cost £/m2 297 398 415**
* Trust income and clinical activity reductions aligned to strategic plan. GIA reduces by 19.32% to
107,201m2
but income also reduces significantly over the period offsetting gains made. ** Occupancy Costs are reduced by circa £12.6 million, and GIA reduces significantly, but remaining cost is in
PFI assets where occupancy cost rates per m2 are proportionately higher.
From the above data, it can be seen that whilst the Trust currently has too much floor space in relation to its income and activity; the downwards trajectory of both income and activity will further compound the requirement to reduce estate significantly - in short, we must double our efforts to reduce floor area, compared to the status-quo activity / income scenario. Without reconfiguring the estate, for forecast income and activity projections to the period 2018/19 will have a significant impact on the above performance indicators, as shown in the graph below. Should additional income be achieved, these indictors would of course improve.
214
191 186 181 180
76 72 69 68 66
0
50
100
150
200
250
2014/15 2015/16 2016/17 2017/18 2018/19
KPI’s Without Reconfiguration of the Estate
£10 Income per M2
FCE per 100m2
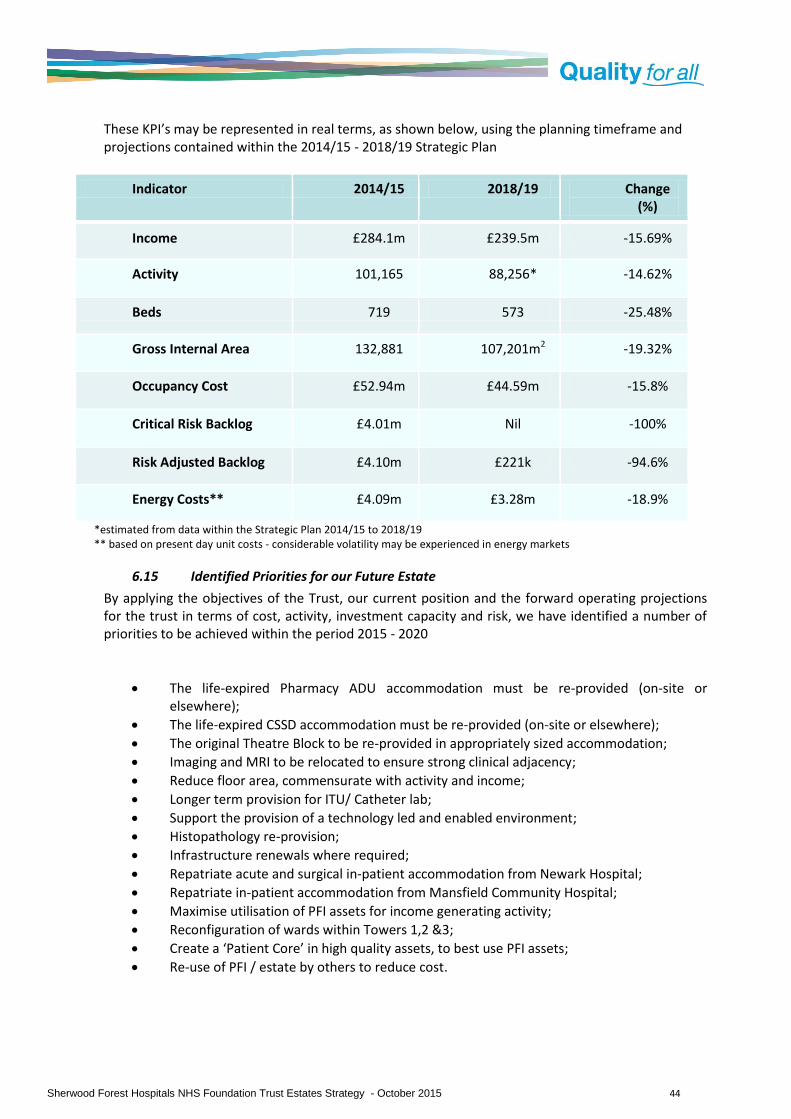
Sherwood Forest Hospitals NHS Foundation Trust Estates Strategy - October 2015 44
These KPI’s may be represented in real terms, as shown below, using the planning timeframe and projections contained within the 2014/15 - 2018/19 Strategic Plan
Indicator 2014/15 2018/19 Change (%)
Income £284.1m £239.5m -15.69%
Activity 101,165 88,256* -14.62%
Beds 719 573 -25.48%
Gross Internal Area 132,881 107,201m2 -19.32%
Occupancy Cost £52.94m £44.59m -15.8%
Critical Risk Backlog £4.01m Nil -100%
Risk Adjusted Backlog £4.10m £221k -94.6%
Energy Costs** £4.09m £3.28m -18.9%
*estimated from data within the Strategic Plan 2014/15 to 2018/19 ** based on present day unit costs - considerable volatility may be experienced in energy markets
6.15 Identified Priorities for our Future Estate
By applying the objectives of the Trust, our current position and the forward operating projections for the trust in terms of cost, activity, investment capacity and risk, we have identified a number of priorities to be achieved within the period 2015 - 2020
The life-expired Pharmacy ADU accommodation must be re-provided (on-site or elsewhere);
The life-expired CSSD accommodation must be re-provided (on-site or elsewhere);
The original Theatre Block to be re-provided in appropriately sized accommodation;
Imaging and MRI to be relocated to ensure strong clinical adjacency;
Reduce floor area, commensurate with activity and income;
Longer term provision for ITU/ Catheter lab;
Support the provision of a technology led and enabled environment;
Histopathology re-provision;
Infrastructure renewals where required;
Repatriate acute and surgical in-patient accommodation from Newark Hospital;
Repatriate in-patient accommodation from Mansfield Community Hospital;
Maximise utilisation of PFI assets for income generating activity;
Reconfiguration of wards within Towers 1,2 &3;
Create a ‘Patient Core’ in high quality assets, to best use PFI assets;
Re-use of PFI / estate by others to reduce cost.

Sherwood Forest Hospitals NHS Foundation Trust Estates Strategy - October 2015 45
6.16 Aligning the Estates Strategy
Throughout the development of our estates strategy, we have sought to take reference from other key strategies and plans of the Trust and our stakeholders, to ensure we support the delivery of over-arching objectives, but also as key references to ensure we achieve the ‘right-sized’ estate that can meet the future needs of mid-Nottinghamshire. We will continue to review, update and consult with others as we further develop our plans, always mindful of the inter-dependencies and projections upon which our plans are based. At this stage, we have largely focused on achieving considerable estate changes within a five-year planning frame, in line with other strategies, but also recognising the considerable changes that need to be delivered as a matter of urgency due to our financial position. Whilst we consider that the planning assumptions for the period 2020 to 2025 are not fully known, we can anticipate a requirement for continued cost efficiency, and the ability to respond to new service developments in an agile manner. Until further long-term service plans are identified, we will continue to consolidate our operational estate, seek commercial opportunities to reduce costs and continue to improve the quality of our estate through on-going maintenance and modest investments in refurbishment where required.
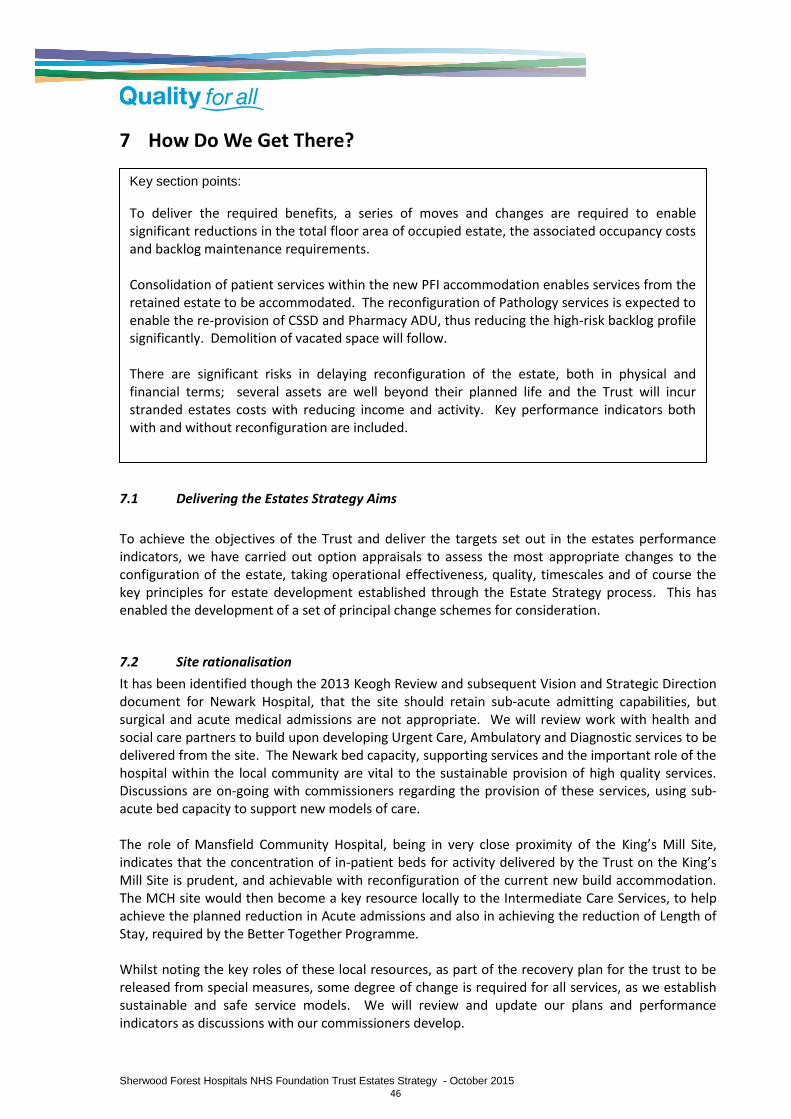
Sherwood Forest Hospitals NHS Foundation Trust Estates Strategy - October 2015 46
7 How Do We Get There?
7.1 Delivering the Estates Strategy Aims
To achieve the objectives of the Trust and deliver the targets set out in the estates performance indicators, we have carried out option appraisals to assess the most appropriate changes to the configuration of the estate, taking operational effectiveness, quality, timescales and of course the key principles for estate development established through the Estate Strategy process. This has enabled the development of a set of principal change schemes for consideration.
7.2 Site rationalisation
It has been identified though the 2013 Keogh Review and subsequent Vision and Strategic Direction document for Newark Hospital, that the site should retain sub-acute admitting capabilities, but surgical and acute medical admissions are not appropriate. We will review work with health and social care partners to build upon developing Urgent Care, Ambulatory and Diagnostic services to be delivered from the site. The Newark bed capacity, supporting services and the important role of the hospital within the local community are vital to the sustainable provision of high quality services. Discussions are on-going with commissioners regarding the provision of these services, using sub-acute bed capacity to support new models of care. The role of Mansfield Community Hospital, being in very close proximity of the King’s Mill Site, indicates that the concentration of in-patient beds for activity delivered by the Trust on the King’s Mill Site is prudent, and achievable with reconfiguration of the current new build accommodation. The MCH site would then become a key resource locally to the Intermediate Care Services, to help achieve the planned reduction in Acute admissions and also in achieving the reduction of Length of Stay, required by the Better Together Programme. Whilst noting the key roles of these local resources, as part of the recovery plan for the trust to be released from special measures, some degree of change is required for all services, as we establish sustainable and safe service models. We will review and update our plans and performance indicators as discussions with our commissioners develop.
Key section points:
To deliver the required benefits, a series of moves and changes are required to enable significant reductions in the total floor area of occupied estate, the associated occupancy costs and backlog maintenance requirements. Consolidation of patient services within the new PFI accommodation enables services from the retained estate to be accommodated. The reconfiguration of Pathology services is expected to enable the re-provision of CSSD and Pharmacy ADU, thus reducing the high-risk backlog profile significantly. Demolition of vacated space will follow. There are significant risks in delaying reconfiguration of the estate, both in physical and financial terms; several assets are well beyond their planned life and the Trust will incur stranded estates costs with reducing income and activity. Key performance indicators both with and without reconfiguration are included.

Sherwood Forest Hospitals NHS Foundation Trust Estates Strategy - October 2015 47
7.3 Strategic Estates Development Proposals
Year 1 - 2015/16
Ref Project Year Capital £k
Dependencies
A1 Link Corridor renewals and repair 2015/16 £225k None
A2 Removal of redundant substation 5 to release surplus land
2015/16 £85k None
A3 Backlog Maintenance Investments (KMH+NGH)
2015/16 £650 None
A4 Disposal of surplus land to front of KMH (subject to restrictive covenant)
2015/16 Receipt TBC
None
Year 2 - 2016/17
Ref Project Year Capital £k
Dependencies
B1 Trust Admin Building (TB3) decant to Ward 1 + SON
2016/17 £1.99m SON Space
B2 Remove TB3 and sell; vacate Northfield car park requirement (revenue saving)
2016/17 -£200k B1
B3 Consolidate KTC to create void space at Level 0
2016/17 £380k None
B4 Imaging, MRI, & Catheter Lab to KTC Level 0
2016/17 £3.6m B3
B5 Bereavement suite relocated to PFI asset
2016/17 £120k None
B6 Backlog Maintenance reduction schemes
2016/17 £450k None
B7 Remodel KMH Main reception 2016/17 £180k None
B8 Installation of Alkane plant for coal gas recovery (fees only)
2016/17 £40k None
B9 GUM moves from KMH to a community base
2016/17 £110k None

Sherwood Forest Hospitals NHS Foundation Trust Estates Strategy - October 2015 48
B10 Relocate Newark Physiotherapy from Byron House (NHCT)
2016/17 £90k None
Year 3 - 2017/18
Ref Project Year Capital £k
Dependencies
C1 Enabling works for shared Pathology Services programme
2017/18 £400k None
C2 CSSD, Pharmacy ADU and Histopathology to Block 15
2017/18 £2.2m C1
C3 Tower 3 moves to prepare for future acute services
2017/18 £310k None
C4 Backlog Maintenance reduction schemes
2017/18 £800k None
C5 New theatres to Tower 1 Level 0 2017/18 £4.76m Moves
C6 Consolidation of acute beds and re-commission sub-acute bed capacity
2017/18 £180k C3
Year 4 2018/19
Ref Project Year Capital £k
Dependencies
D1 Demolish Old CSSD & Pharmacy ADU Buildings (Blocks 21&22)
2018/19 £140k C1 & C2
D2 Demolish old theatres (Part Block 07) 2018/19 £110k C6
D3 CCU to Tower 1 Level 1 2018/19 £2.47m Ward Moves
D4 Backlog Maintenance Reduction schemes
2018/19 £600k None

Sherwood Forest Hospitals NHS Foundation Trust Estates Strategy - October 2015 49
Year 5 - 2019/20
Ref Project Year Capital £k
Dependencies
D5 MEMD to Block 06 2019/20 £170k None
D6 MEMD (Block 04) to expand Medical Records capacity
2019/20 £40k D5
Years 6 to 10 - 2020 - 2025
Ref Project Year Capital £k
Dependencies
E1 Demolish remainder Block 07 and 09 (Theatres, CCU, Catheter Lab)
2020/21 £90k B4, B5
E2 Renal (block 42) to Tower 1/2/3 2022/23 £740k None
E3 Re-provide SOL to create clinical / support space
2022/23 £600k
E4 Remove Renal Unit (Block 42) or redeploy if required
2023/24 - E2
Phasing diagrams are included at Appendix D, showing the key transitions, sequencing and moves required by the above programme. Gantt Charts showing dependencies and sequencing are included at Appendix E.
7.4 Site Development Plan - 2020
The site development plan overleaf indicates the changes made to the estate during the period 2015 - 2020, as outlined in the tables above. These represent the key strategic changes required to reduce the overall estate to the minimum level considered achievable within the planning timescale.
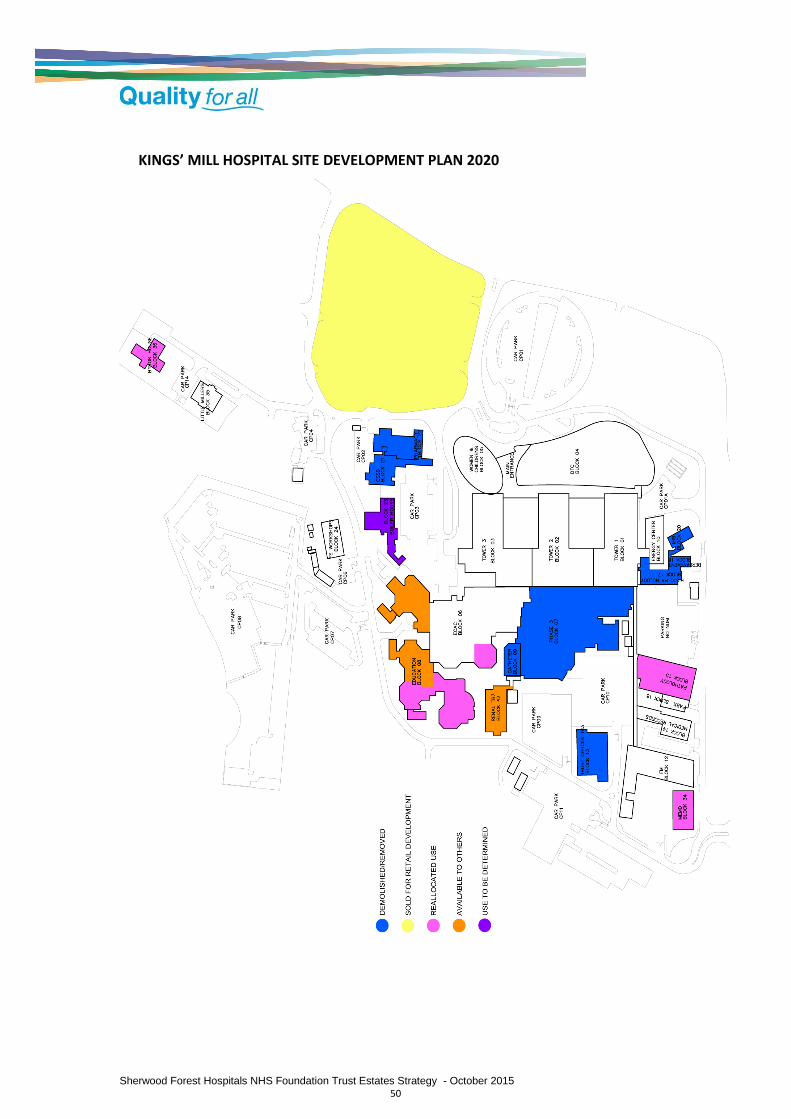
Sherwood Forest Hospitals NHS Foundation Trust Estates Strategy - October 2015 50
KINGS’ MILL HOSPITAL SITE DEVELOPMENT PLAN 2020
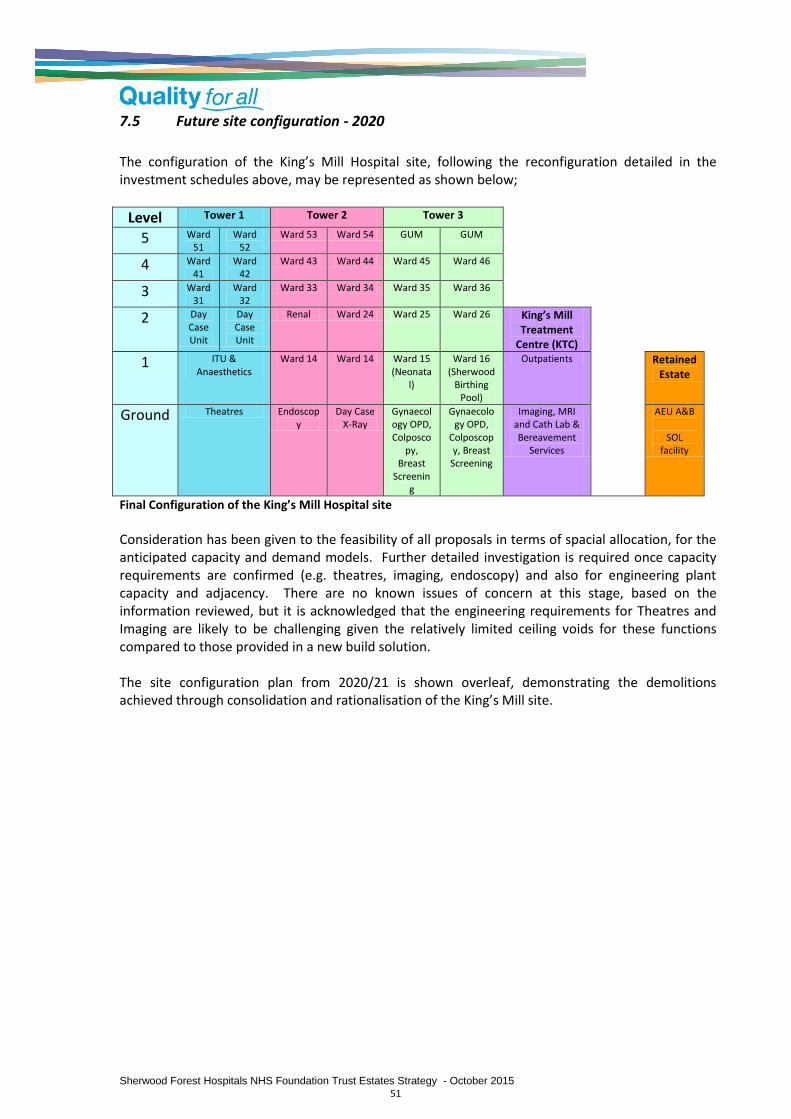
Sherwood Forest Hospitals NHS Foundation Trust Estates Strategy - October 2015 51
7.5 Future site configuration - 2020
The configuration of the King’s Mill Hospital site, following the reconfiguration detailed in the investment schedules above, may be represented as shown below;
Level Tower 1 Tower 2 Tower 3
5 Ward 51
Ward 52
Ward 53 Ward 54 GUM GUM
4 Ward 41
Ward 42
Ward 43 Ward 44 Ward 45 Ward 46
3 Ward 31
Ward 32
Ward 33 Ward 34 Ward 35 Ward 36
2 Day Case Unit
Day Case Unit
Renal Ward 24 Ward 25 Ward 26 King’s Mill Treatment
Centre (KTC)
1 ITU & Anaesthetics
Ward 14 Ward 14 Ward 15 (Neonata
l)
Ward 16 (Sherwood
Birthing Pool)
Outpatients Retained Estate
Ground Theatres Endoscopy
Day Case X-Ray
Gynaecology OPD, Colposco
py, Breast
Screening
Gynaecology OPD,
Colposcopy, Breast
Screening
Imaging, MRI and Cath Lab & Bereavement
Services
AEU A&B
SOL facility
Final Configuration of the King’s Mill Hospital site
Consideration has been given to the feasibility of all proposals in terms of spacial allocation, for the anticipated capacity and demand models. Further detailed investigation is required once capacity requirements are confirmed (e.g. theatres, imaging, endoscopy) and also for engineering plant capacity and adjacency. There are no known issues of concern at this stage, based on the information reviewed, but it is acknowledged that the engineering requirements for Theatres and Imaging are likely to be challenging given the relatively limited ceiling voids for these functions compared to those provided in a new build solution. The site configuration plan from 2020/21 is shown overleaf, demonstrating the demolitions achieved through consolidation and rationalisation of the King’s Mill site.
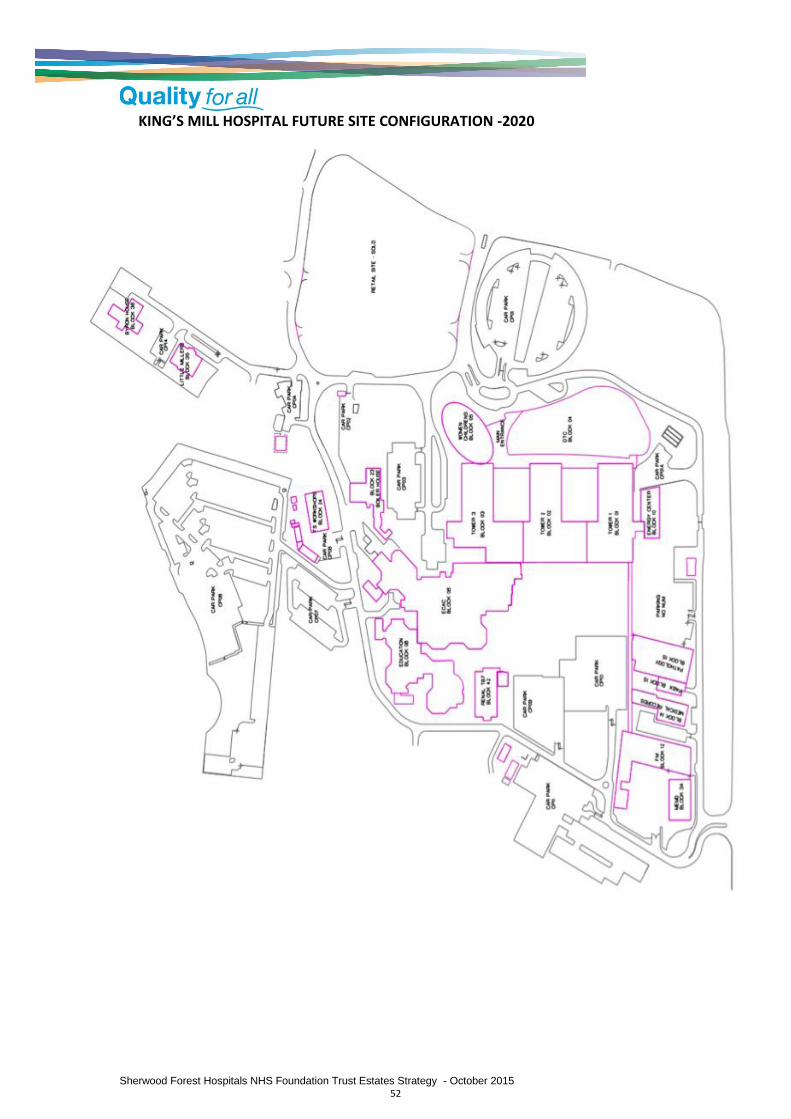
Sherwood Forest Hospitals NHS Foundation Trust Estates Strategy - October 2015 52
KING’S MILL HOSPITAL FUTURE SITE CONFIGURATION -2020

Sherwood Forest Hospitals NHS Foundation Trust Estates Strategy - October 2015 53
7.6 Capital Resourcing
The overall capital resource requirement for the implementation of the Estates Strategy is estimated at £40m including fees, VAT and on-costs. A number of options exist for funding the programme, as outlined below;
Internally generated capital - considered viable, however progress would be limited within each year without external resource, leading to an elongated programme and loss of key benefits. Possible in conjunction with external borrowing also.
Fund through the existing PFI Project Agreement - considered viable, although expensive. Would lead to increased unitary charge and life cycle payments, estimated at £6.2m per annum.
Create a Strategic Estates Partnership (SEP) Joint Venture - whilst having several advantages, not considered viable in conjunction with the existing PFI Project Agreement due to significantly increased complexity and risk, and a service profile that would be unattractive to the majority of potential partners.
External Borrowing from Foundation Trust Financing Facility - considered a viable option, although current financial position may increase risk and limit amount to be borrowed. Possible in conjunction with Internally Generated Capital.
Transformational Capital Grant form DH - In light of current position of the Trust, consideration should be given to applying for transformational support to the Trust / local health community in order to achieve the required performance improvements within the required timescale.
Whilst the Trusts current Long-Term Financial Model (LTFM) indicates the majority of the identified capital expenditure commencing in the FY2019/20, there are serious implications to not commencing the identified capital programme sooner;
The overall performance of the Trust will deteriorate, with an increasing mismatch between physical capacity and clinical activity;
Potential revenue saving opportunities will be lost, with high quality accommodation mothballed and old estate continuing to be used;
A growing mismatch between the need of redesigned clinical services and the estate needed to deliver those services, in terms of space, quality, location and operational effectiveness;
Significant risks will continue due to life expired assets not being replaced, which could have serious operational, reputational or financial risks to the Trust (e.g CSSD, Pharmacy ADU, Theatres);
Construction is a rising market, and the potential to lock in to beneficial rates (e.g. P21+ will be lost;
There is a significant risk of the trust being left with stranded estates costs as a result of decreasing acute activity;
Investment will be needed in facilities that are not considered to have an on-going useful life as part of the overall estates plan;
The range of potential funding routes, and the terms of those agreements may not be as beneficial or affordable as those currently available, and are unlikely to be improved upon in the foreseeable future;
If an adjustment to the PA is made to fund the required investment, the unitary charge payments will be proportionately higher due to the shorter term (retaining the same end-date), for the same level of capital investment, and hence the overall ROI will be reduced.
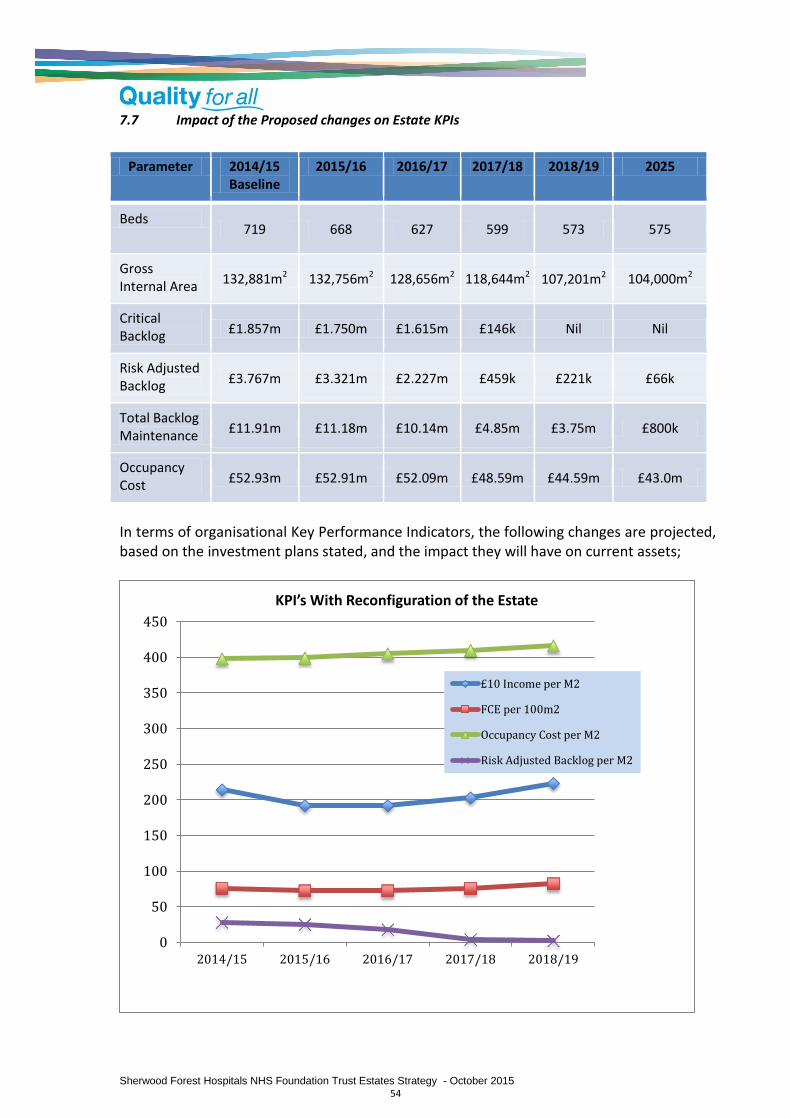
Sherwood Forest Hospitals NHS Foundation Trust Estates Strategy - October 2015 54
7.7 Impact of the Proposed changes on Estate KPIs
Parameter 2014/15 Baseline
2015/16 2016/17 2017/18 2018/19 2025
Beds 719 668 627 599 573 575
Gross Internal Area
132,881m2 132,756m2 128,656m2 118,644m2 107,201m2 104,000m2
Critical Backlog
£1.857m £1.750m £1.615m £146k Nil Nil
Risk Adjusted Backlog £3.767m £3.321m £2.227m £459k £221k £66k
Total Backlog Maintenance
£11.91m £11.18m £10.14m £4.85m £3.75m £800k
Occupancy Cost
£52.93m £52.91m £52.09m £48.59m £44.59m £43.0m
In terms of organisational Key Performance Indicators, the following changes are projected, based on the investment plans stated, and the impact they will have on current assets;
0
50
100
150
200
250
300
350
400
450
2014/15 2015/16 2016/17 2017/18 2018/19
KPI’s With Reconfiguration of the Estate
£10 Income per M2
FCE per 100m2
Occupancy Cost per M2
Risk Adjusted Backlog per M2
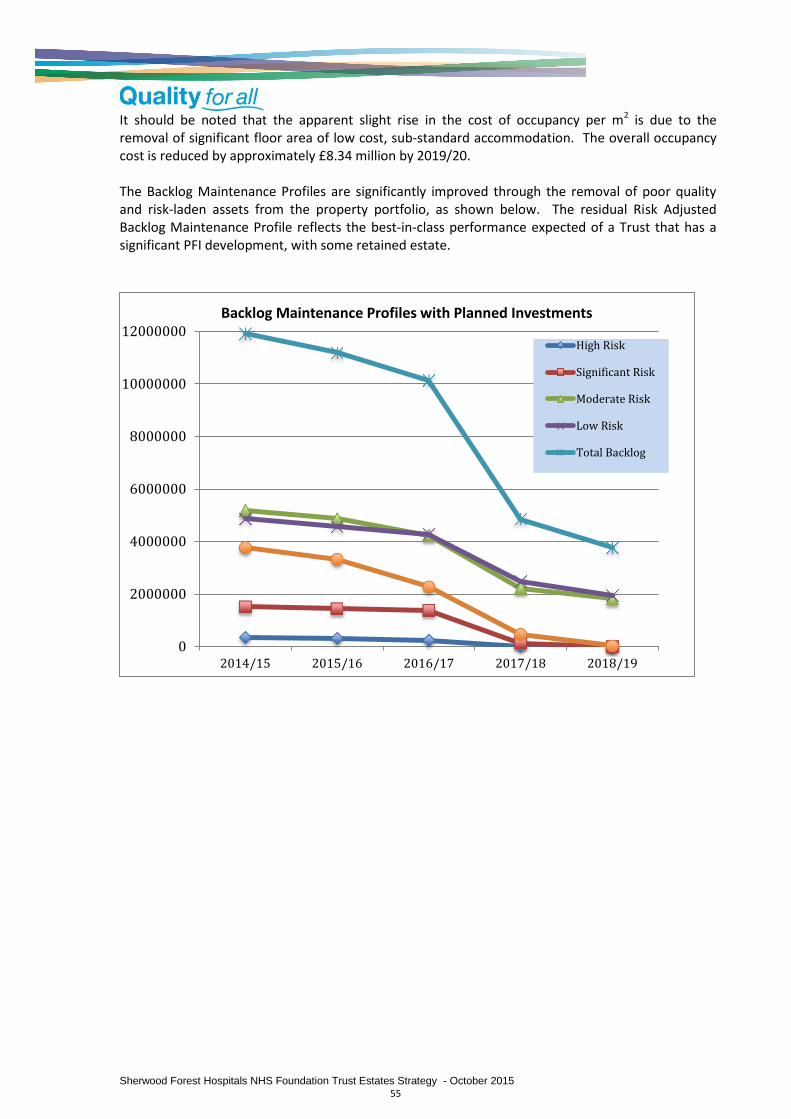
Sherwood Forest Hospitals NHS Foundation Trust Estates Strategy - October 2015 55
It should be noted that the apparent slight rise in the cost of occupancy per m2 is due to the removal of significant floor area of low cost, sub-standard accommodation. The overall occupancy cost is reduced by approximately £8.34 million by 2019/20. The Backlog Maintenance Profiles are significantly improved through the removal of poor quality and risk-laden assets from the property portfolio, as shown below. The residual Risk Adjusted Backlog Maintenance Profile reflects the best-in-class performance expected of a Trust that has a significant PFI development, with some retained estate.
0
2000000
4000000
6000000
8000000
10000000
12000000
2014/15 2015/16 2016/17 2017/18 2018/19
Backlog Maintenance Profiles with Planned Investments
High Risk
Significant Risk
Moderate Risk
Low Risk
Total Backlog
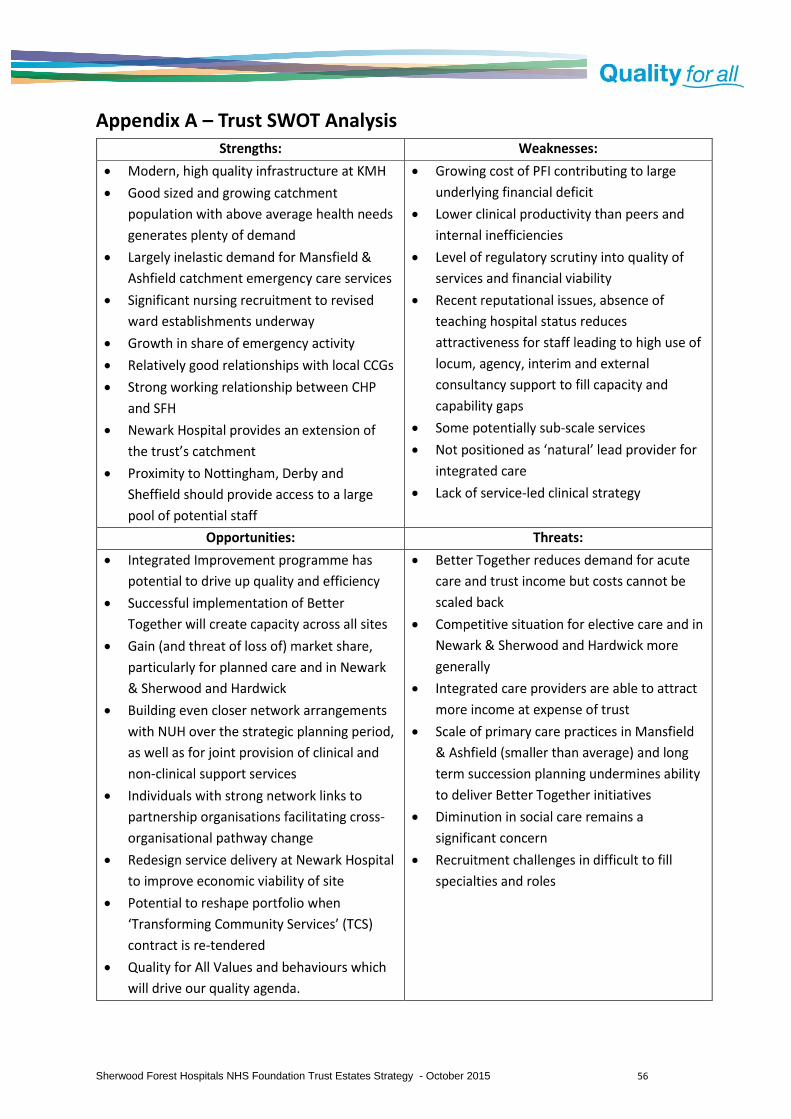
Sherwood Forest Hospitals NHS Foundation Trust Estates Strategy - October 2015 56
Appendix A – Trust SWOT Analysis

Sherwood Forest Hospitals NHS Foundation Trust Estates Strategy - October 2015 57
Appendix B - Site Block Plans
King’s Mill Hospital
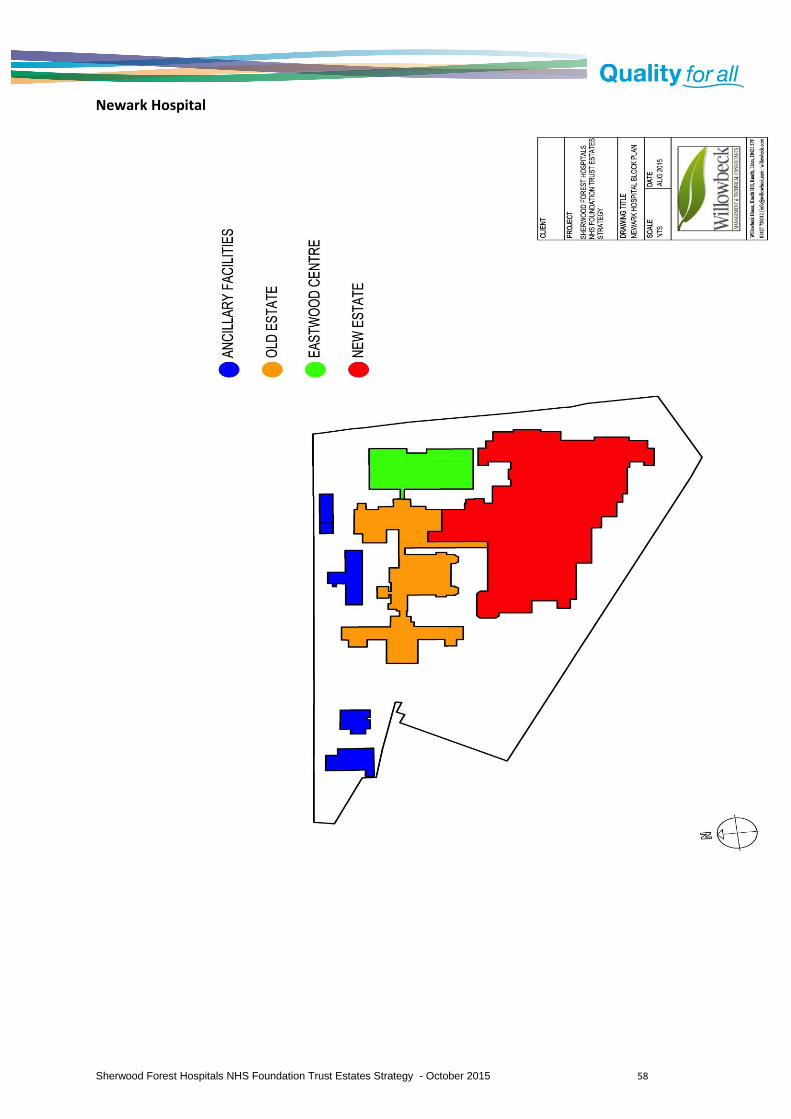
Sherwood Forest Hospitals NHS Foundation Trust Estates Strategy - October 2015 58
Newark Hospital

Sherwood Forest Hospitals NHS Foundation Trust Estates Strategy - October 2015 59
Mansfield Community Hospital
STREET
ST
OC
KW
ELL
GA
TE
CR
ED
& W
ard
Bd
y
123.
7m
58
1 to
21
2
Man
sfie
ld
Hou
se
Ale
xand
er
Sto
ckw
e ll C
our
t
Com
mun
ity H
ospi
tal
22
to 3
52
04
7
20615
2
3
PH
21
0
16
Ros
e Lo
dge
El S
ub S
ta
22
2
28
1
34
11
21
46
40
61
6465
68
63
60
62
6667
Covered Walkway
Str
ateg
ic P
lan
nin
g &
Co
mm
erci
al D
evel
op
men
t
Kin
g's
Mill
Hos
pita
l, M
ansf
ield
Roa
d
Sut
ton
in A
shfie
ld, N
ottin
gham
shire
, NG
17 4
JL
Tel
: 016
23 6
7611
6
SC
AL
ES
DA
TE
DR
AW
N
PR
OJE
CT
PU
RP
OS
E O
F I
SS
UE
PR
OJE
CT
NR
.D
RA
WIN
G N
R.
RE
V.
Fac
ilitie
s S
ervi
ces
TIT
LE
Rev
De
scrip
tion
Dat
eN
ame
Man
sfie
ld C
omm
unity
Hos
pita
l
Rec
ord
Dra
win
gs
Site
Blo
ck P
lan
1:10
00 @
A3
16-1
2-14
KIS
-AF
H
C1
C-1
001
-
C1
Firs
t Is
sue
16-
12-
14K
IS-A
FH
--
--
Num
ber
Blo
ck N
ame
60P
ilgrim
Cen
tre
61 62 63 64 65 66 67 68
Sit
e S
tati
stic
s
Site
Lan
d A
rea
31,
058
m²
3.1
06
ha
Le
ase
d O
ut L
and
Are
a0
m²
0 ha
Le
ase
d In
La
nd A
rea
0 m²
0 ha
ER
IC L
an
d A
rea
31,
058
m²
3.1
06
ha
Bu
ildin
g F
oot
prin
t8,
492
m²
Wa
lway
Fo
otp
rint
131
m²
ER
IC F
oo
tprin
t8,
623
m²

Sherwood Forest Hospitals NHS Foundation Trust Estates Strategy - October 2015 60
Appendix C - Medium Acute Dataset indicators
SHERWOOD FOREST HOSPITALS NHS FOUNDATION TRUST - 2014/15 Trust Data against 2013/2014National Data
Grouping PI (Percentile Bands)
PI SUMMARY Trust PI
33% 34% 33%
Space Efficiency
Income £10/m² 214 255 256 and 306 307
Activity/100m² 76
100 101 and 113 114
Asset Value £10/m² 183
145 146 and 183 184
Occupancy Cost £/m² 398 272 273 and 333 334
Asset Productivity
Asset Value £10/m² 183 145 146 and 183 184
Capital Charges £/m² 55
108 109 and 140 141
Total Backlog £/m² 90 73 74 and 203 204
Premises Costs £/10m² 1389 935 936 and 1312 1313
Asset Deployment
Land £/m² 131 110 111 and 257 258
Building £10/m² 159
107 108 and 132 133
Equipment £/m² 105
145 146 and 198 199
Capital Charges £/m² 55 108 109 and 140 141
Estate Quality
Asset Value £10/m² 183 145 146 and 183 184
Depreciation £/m² 55 78 79 and 99 100
Critical Backlog £/m² 14
28 29 and 67 68
Risk Adjusted Backlog £/m² 28 28 29 and 76 77
Cost of Occupancy
Premises Costs £/10m² 1389 935 936 and 1312 1313
Energy/Utility £/10m² 308
269 270 and 311 312
Maintenance Costs £/10m² 349
261 262 and 325 326
Capital Charges £/m² 55 108 109 and 140 141
Groupings:
Trust Cluster & Type: Basic - Medium Acute Outside London
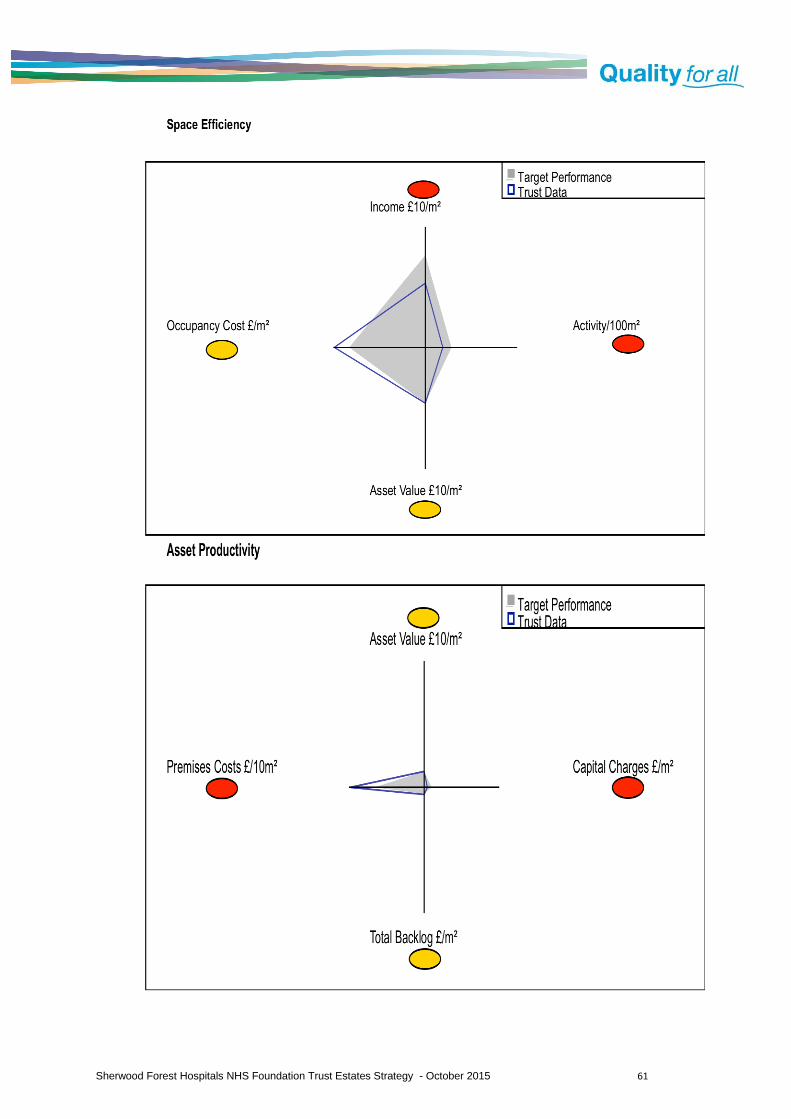
Sherwood Forest Hospitals NHS Foundation Trust Estates Strategy - October 2015 61

Sherwood Forest Hospitals NHS Foundation Trust Estates Strategy - October 2015 62

Sherwood Forest Hospitals NHS Foundation Trust Estates Strategy - October 2015 63

Sherwood Forest Hospitals NHS Foundation Trust Estates Strategy - October 2015 64
Appendix D - Phasing & Decants
Newark Hospital Physiotherapy relocated from Byron House to NGH space Backlog Maintenance Investments Alkane installation at KMH
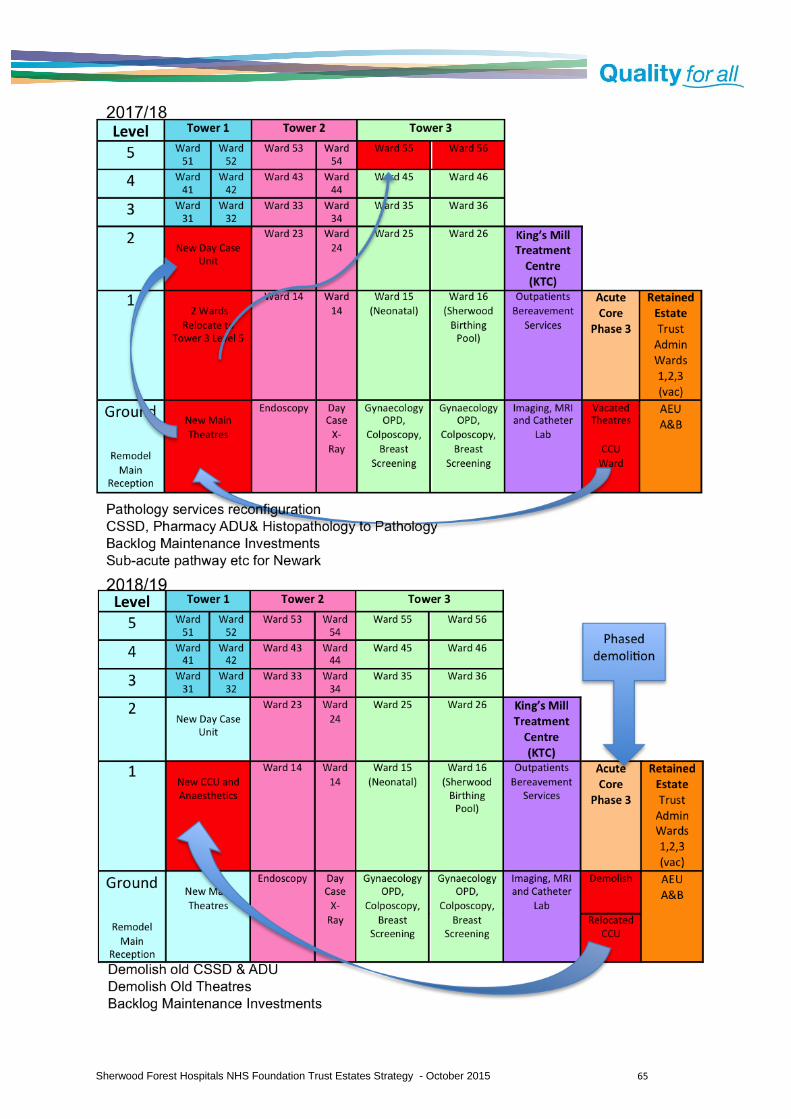
Sherwood Forest Hospitals NHS Foundation Trust Estates Strategy - October 2015 65

Sherwood Forest Hospitals NHS Foundation Trust Estates Strategy - October 2015 66

Sherwood Forest Hospitals NHS Foundation Trust Estates Strategy - October 2015 67
Appendix E - Critical Path Gantt Charts
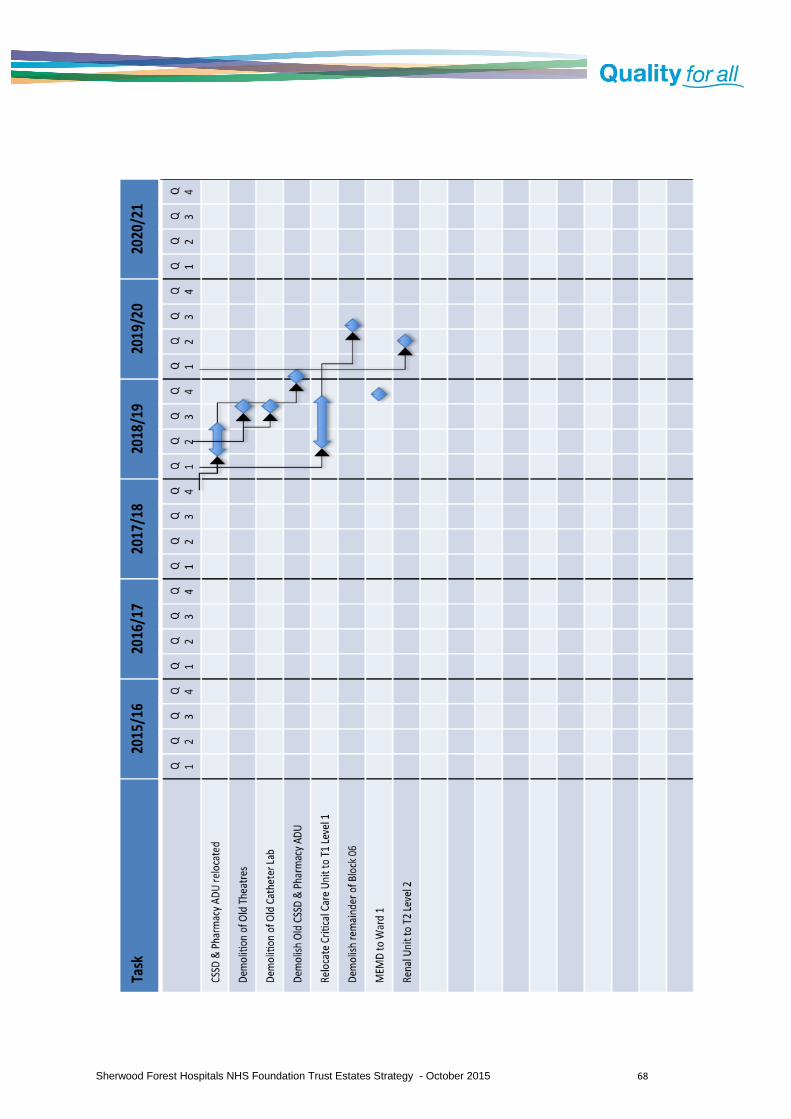
Sherwood Forest Hospitals NHS Foundation Trust Estates Strategy - October 2015 68