estcp cost and performance report - clu-in.org
TRANSCRIPT

ESTCPCost and Performance Report
EnvironmEntal SEcuritytEchnology cErtification Program
u.S. Department of Defense
(ER-200626)
Development of a Design Tool for Planning Aqueous Amendment Injection Systems
August 2012

i
COST & PERFORMANCE REPORT Project: ER-200626
TABLE OF CONTENTS
Page
1.0 EXECUTIVE SUMMARY ................................................................................................ 11.1 PROJECT OBJECTIVES ....................................................................................... 11.2 TECHNOLOGY DESCRIPTION .......................................................................... 11.3 DEMONSTRATION RESULTS ............................................................................ 1
1.3.1 Anaerobic Bioremediation with Emulsified Vegetable Oil (EVO) ............ 11.3.2 Anaerobic Bioremediation with Soluble Substrates (SS) ........................... 11.3.3 Chemical Oxidation with Permanganate (MnO4
- ) ...................................... 21.4 IMPLEMENTATION ISSUES .............................................................................. 2
2.0 INTRODUCTION .............................................................................................................. 52.1 BACKGROUND .................................................................................................... 52.2 PROJECT OBJECTIVES ....................................................................................... 52.3 REGULATORY DRIVERS ................................................................................... 6
3.0 TECHNOLOGY DESCRIPTION ...................................................................................... 73.1 TECHNOLOGY DEVELOPMENT AND APPLICATION .................................. 73.2 PREVIOUS TESTING OF TECHNOLOGY ......................................................... 7
4.0 TECHNICAL APPROACH AND METHODOLOGY ...................................................... 94.1 CONTACT EFFICIENCY .................................................................................... 114.2 SPREADSHEET-BASED DESIGN TOOLS ....................................................... 12
5.0 ANAEROBIC BIOREMEDIATION WITH EVO ........................................................... 135.1 NUMERICAL MODELING OF EVO DISTRIBUTION .................................... 135.2 AQUIFER VOLUME CONTACT EFFICIENCY (EV ) ....................................... 135.3 EFFECT OF SCALING FACTORS ON EV ........................................................ 135.4 EVO DESIGN TOOL DEVELOPMENT AND EVALUATION ........................ 15
6.0 ANAEROBIC BIOREMEDIATION WITH SS ............................................................... 176.1 NUMERICAL MODELING OF SS DISTRIBUTION ........................................ 176.2 STEADY STATE CONTACT EFFICIENCY (CESS ) ......................................... 176.3 EFFECT OF DESIGN PARAMETERS ON CESS ............................................... 176.4 SS DESIGN TOOL DEVELOPMENT AND EVALUATION ........................... 19
7.0 CHEMICAL OXIDATION WITH PERMANGANATE ................................................. 217.1 NUMERICAL MODELING OF PERMANGANATE DISTRIBUTION ........... 217.2 CDISCO DEVELOPMENT AND EVALUATION ............................................. 22
8.0 IMPLEMENTATION ISSUES ........................................................................................ 258.1 DESIGN TOOL LIMITATIONS ......................................................................... 25

TABLE OF CONTENTS (continued)
Page
ii
9.0 COST ANALYSIS ............................................................................................................ 27
10.0 REFERENCES ................................................................................................................. 29 APPENDIX A POINTS OF CONTACT......................................................................... A-1

iii
LIST OF FIGURES
Page Figure 1. Hypothetical injection grid showing model domain subarea. ................................. 9Figure 2. Model domain for base case condition – area treatment. ...................................... 10Figure 3. Hydraulic conductivity distribution used in model simulations: (a) plan
view; and (b) profile view for moderately heterogeneous aquifer (realization #1). ..................................................................................................... 11
Figure 4. Effect of volume scaling factor (SFV) and mass scaling factor (SFM) on volume contact efficiency for a moderately heterogeneous aquifer with well spacing approximately equal to row spacing. ....................................................... 14
Figure 5. Variation of SS treatment zone contact efficiency with time. .............................. 17Figure 6. Effect of dimensionless variables CI/Cmin, PV, TT/TH, and TR/TT on
steady-state contact efficiency (CESS). ................................................................. 18Figure 7. Typical output from permanganate transport model. ............................................ 23Figure 8. Typical output from injection scenario cost comparison ...................................... 24

iv
LIST OF TABLES
Page Table 1. Base case simulation conditions. .......................................................................... 10

v
ACRONYMS AND ABBREVIATIONS 𝜌𝐵 bulk density 𝜑 effective porosity 3-D 3-dimensional AFCEE Air Force Center for Environmental Excellence BTV base treatment zone CE contact efficiency CESSCDISCO Conceptual Design of In Situ Chemical Oxidation
steady-state, volume average contact efficiency
CIC
substrate injection concentration min
minimum concentration
DoD Department of Defense ESTCP Environmental Security Technology Certification Program EVEVO emulsified vegetable oil
aquifer volume contact efficiency
GCG Generalized Conjugate Gradient GMS Groundwater Modeling System GW groundwater ISAB in situ anaerobic bioremediation ISCO in situ chemical oxidation ITRC Interstate Technology & Regulatory Council K permeability KMnO4
potassium permanganate
MOC Method of Characteristics MODFLOW Modular Flow Model MnO4
-
MT3D Modular 3-D Transport Model permanganate
NFESC Naval Facilities Engineering Service Center NOD Natural Oxidant Demand NODINOD
Instantaneous Natural Oxidant Demand S
NPV net present value Slow Natural Oxidant Demand
ORM
maximum oil retention
PV pore volume

ACRONYMS AND ABBREVIATIONS (continued)
vi
Q injection rate per well ROI radius of influence RT3D Reactive Transport 3-D Model SFVSF
volume scaling factor M
SS soluble substrate mass scaling factor
SRS
row spacing W
well spacing
THT
half-life R
T time period between substrate reinjections
T
travel time
U fraction of un-reacted MnO4-
USEPA U.S. Environmental Protection Agency
Z saturated thickness

Technical material contained in this report has been approved for public release. Mention of trade names or commercial products in this report is for informational purposes only;
no endorsement or recommendation is implied.
vii
ACKNOWLEDGEMENTS We gratefully acknowledge the financial and technical support provided by the Environmental Security Technology Certification Program (ESTCP) including the guidance provided by Andrea Leeson (Environmental Restoration Program Manager), Hans Stroo (ESTCP reviewer), Marvin Unger (ESTCP reviewer), and the many long hours contributed by the graduate students working on this project including Ki Young Cha, Matthew Clayton, and Aaron Weispfenning. We would also like to thank the following members of Technical Advisory Committee, the ER-200623 project team, and external reviewers whose work greatly improved the quality and usefulness of the design tools:
• Brant Smith, XDD, LLC • Bruce Henry, Parsons, Inc. • Dean Williamson, CH2M HILL, Inc. • Dirk Pohlmann, Shaw Group, Inc. • Eliot Cooper, Vironex, Inc. • Erica Becvar, Air Force Center for Environmental Engineering • Fritz Krembs, TriHydro Corporation • Gene Ng, CH2M HILL, Inc. • John Wilson, U.S. Environmental Protection Agency • Kumar Mahinthakumar, North Carolina State University • Matt Dingens, Carus Chemical, Inc. • Michelle Crimi, Clarkson University • Michael Singletary, Naval Facilities Engineering Service Center • Michael Urynowicz, University of Wyoming • Niel Thomson, University of Waterloo • Robert Siegrist, Colorado School of Mines. • Scott Huling, U.S. Environmental Protection Agency • Wilson Clayton, TriHydro Corporation • Xiuyuan Xu, AMEC

This page left blank intentionally.

1
1.0 EXECUTIVE SUMMARY
In situ anaerobic bioremediation (ISAB) and chemical oxidation and can be useful for treating a variety of groundwater (GW) contaminants. However, to be effective the treatment reagent must be brought into close contact with the target contaminant. To reduce costs and improve effectiveness, designers need tools to quickly identify efficient systems for distributing reagents.
1.1 PROJECT OBJECTIVES
The overall objective of this project was to develop a set of tools to assist remediation system designers in developing effective, reasonably efficient systems for distributing aqueous amendments for in situ treatment of K contaminants. This project focused on the development and application of tools for the design of ISAB systems using soluble substrates (SS) and emulsified vegetable oil (EVO), and in situ chemical oxidation (ISCO) systems using permanganate (MnO4
-
1.2 TECHNOLOGY DESCRIPTION
).
In the first phase of work, currently available numerical models were used to understand the effects of site conditions (e.g., permeability (K), site heterogeneity) and design variables (e.g., location of wells, injection rates, volumes, amount of reagent, etc.) on reagent contact efficiency (CE). Results from 3-dimensional (3-D) numerical simulations in heterogeneous aquifers were used to develop relationships between reagent distribution and amount of fluid/reagent injected. This information was then used to develop simple, spreadsheet-based design tools to assist in planning injection systems for in situ aquifer treatment with EVO, SS, and MnO4
-
1.3 DEMONSTRATION RESULTS
. Using these tools, designers can evaluate the effect of different design variables (e.g., well spacing, amount of reagent, injection volume, etc.) on remediation system cost and expected performance.
1.3.1 Anaerobic Bioremediation with Emulsified Vegetable Oil
Sensitivity analysis results showed that aquifer volume CE is primarily controlled by the volume of EVO injected and the volume of water injected to distribute the EVO. Simple curves were developed to estimate CE and then incorporated into spreadsheet-based tools to compare the cost and performance of different designs. Capital and life-cycle costs appear to be relatively insensitive to site conditions, for both barrier and area treatment. Obviously, total costs are often higher for large, wide, deep sites. Unit costs are often higher for smaller sites due to the proportionately higher fixed costs associated with planning, design, and monitoring. Errors in estimation of the maximum oil retention (ORM) by the aquifer material can have a major impact on cost and performance for both barrier and area treatment. ORM
1.3.2 Anaerobic Bioremediation with Soluble Substrates
should be directly measured on field or lab samples whenever possible.
Anaerobic bioremediation with SS is most effective when the substrate concentration is greater than some minimum concentration (Cmin). However, CE will vary over time as substrate is depleted or washed out of the target treatment zone and as additional substrate is injected. To

2
account for these variations in time, the steady-state, volume average contact efficiency (CESS) was used as the primary measure of SS injection performance. Sensitivity analysis results showed that CESS greater than 50% can be achieved by periodic injection of 0.1 to 0.25 pore volumes (PV) of SS solution containing 20 to 100 times the Cmin required for effective treatment. Operating costs can be reduced by injecting substrate less frequently, but can result in a dramatic drop in CESS. Results from these sensitivity analyses were incorporated into a spreadsheet based tool to allow designers to compare different designs, and used to evaluate costs and performance for a range of site conditions. In most cases, increasing CESS also results in increasing costs. The highest ratio of CESS to cost often occurs when CESS
1.3.3 Chemical Oxidation with Permanganate
is between 70% and 80%.
MnO4- transport and distribution in the subsurface is controlled by reactions with the target
contaminant and non-productive reactions with Instantaneous Natural Oxidant Demand (NODI) and Slow Natural Oxidant Demand (NODS). Model simulations indicate that the two parameters with the greatest impact on aquifer CE are: (1) the mass of MnO4
- injected; and (2) the volume of water injected. When small amounts of MnO4
- are injected, the reagent is rapidly consumed and pollutant removal efficiency does not increase with time after the first 30 days. However, when larger amounts of MnO4
-
are injected, the reagent can persist for several months resulting in a gradual increase in CE with time.
For constant MnO4- mass, increasing fluid volume injected initially results in improved
treatment efficiency. However, further increases in the fluid volume injected result in little additional benefit. Conversely, when fluid volume is held constant and MnO4
- mass is increased, treatment efficiency steadily increases, due to downgradient drift/dispersion of MnO4
-
. However, increasing the mass of MnO4- injected may also increase the amount of MnO4
- that migrates out of the target treatment zone. The Conceptual Design of In Situ Chemical Oxidation (CDISCO) design tool was developed within an Microsoft Excel spreadsheet to allow users to design MnO4
-
1.4 IMPLEMENTATION ISSUES
injection systems based on a user specified minimum oxidant concentration and contact time, and evaluate the effect of different alternatives on costs.
The tools developed in this project are intended to help designers improve reagent distribution at a reasonable cost. However, designers should be aware of the numerous other factors that can lead to poor treatment including improper reagent selection, unfavorable environmental conditions, absence of required chemical catalysts or bacteria to facilitate the reaction, and chemical or biological inhibitors. Contaminant treatment efficiency will also be lower if the contaminants are primarily located in lower K zones that are not effectively contacted by the treatment reagent. Nonetheless, improving the fraction of aquifer contacted by the reagent should improve contaminant treatment efficiency at many sites. Users should also be aware that these design tools are strictly focused on improving reagent distribution. In virtually all cases, the tools predict that CE can be increased by injecting more reagent with more water to distribute the reagent. While this should improve reagent distribution, it may also increase the potential for adverse secondary impacts, possibly including

3
displacement of the contaminant and changes in aquifer geochemistry. These potential impacts need to be carefully considered before implementing any in situ remediation approach.

This page left blank intentionally.

5
2.0 INTRODUCTION
This Cost & Performance Report summarizes results generated during the development of spreadsheet-based tools for the design of injection systems to treat contaminated aquifers by: 1) ISAB using EVO; 2) ISAB using SS; and 3) ISCO using MnO4
-
2.1 BACKGROUND
. The work was funded by ESTCP Project Number. ER-200626.
ISAB and ISCO and can be effective approaches for treatment of a variety of K contaminants. However, to be effective the treatment reagent, EVO, SS, or MnO4
-
must be brought into close contact with the target contaminant. Although there are many common design features when injecting any reagent, each substrate has unique characteristics that impact the design process (notably longevity, mode of action, reactivity, and retention by aquifer materials), so that individual design tools are needed.
There are a variety of different approaches that can be used to distribute aqueous treatment amendments in the subsurface. Each approach has advantages and disadvantages with the “best” approach dependent on site-specific conditions. Cost and effectiveness are a function of the well layout and reagent injection procedures. Consequently, there will be an “optimum design” that will include a specific arrangement of injection wells, injection volumes and rates, and amount of reagent. Existing guidance documents provide general information on how the different remediation processes work and factors to consider when planning a remediation system. However, these documents do not provide specific information on how to actually design an injection system to provide good amendment distribution at a reasonable cost. In recent years, a number of very powerful modeling packages have been developed that can be used to simulate the reagent transport in the subsurface under heterogeneous conditions and evaluate the effect of these reagents on treatment system performance. With these tools, users can evaluate alternative injection approaches and identify the “best” design based on site-specific conditions including aquifer K and heterogeneity, contaminant distribution, site access limitations, drilling, labor and material costs, etc. Unfortunately, these models are rarely used to actually design in situ remediation systems. In the vast majority of cases, remediation systems are designed based on rules of thumb or prior experience. Sometimes this approach results in a good, efficient design. However, in some cases remediation systems are less effective and efficient than desired. To reduce costs and improve effectiveness, remediation system designers need tools to quickly identify an efficient design for the specific conditions at their site without extensive site characterization or a high level of modeling expertise.
2.2 PROJECT OBJECTIVES
The overall objective of this project was to develop a set of tools to assist remediation system designers in developing effective, reasonably efficient systems for distributing aqueous amendments for in situ treatment of K contaminants. The work has focused on developing and

6
applying user-friendly tools to design ISAB systems using either SS or EVO, and ISCO systems using MnO4
-
. Specific objectives of this project are listed below.
1. Use currently available numerical models to understand the effects of site conditions (e.g., K, site heterogeneity, etc.) and design variables (e.g., location of wells, injection rates, volumes, amount of reagent, etc.) on reagent distribution and associated CE. Develop simple curves or procedures relating reagent distribution efficiency to amount of fluid/reagent injected. To the extent possible, present the results in a normalized or non-dimensional form (e.g., ratio of reagent injected to theoretical demand). The information learned from the modeling will provide guidance to design tool users in selection of important design parameters (e.g., PVs of injection fluid, amount of reagent, etc.).
2. Develop simple, spreadsheet-based design tools to assist designers in planning injection systems for in situ aquifer treatment with EVO, SS, and MnO4
-. These tools will allow engineers to evaluate the effect of different design variables (e.g., well spacing [SW
3. Develop materials to train engineers with little or no modeling experience in the use of these design tools.
], amount of reagent, injection volume, etc.) on remediation system cost and expected performance. Different tools will be developed for each of the major design alternatives (e.g., type of reagent). Experienced users who have already compiled the input data for their site (e.g., K, contaminant concentrations, etc.) should be able to develop a preliminary design for one alternative in about 1 hour.
2.3 REGULATORY DRIVERS
The primary objective of this project was to develop design tools that are easy to learn, simple to use, and therefore will be widely applied. Educational materials were developed to allow new users to download the required materials, review background information, and then complete a preliminary injection system design in a few hours. The design tool is structured to allow easy use by designers with no K modeling experience. However, users are expected to be familiar with basic fundamentals of K flow, solute transport, and in situ remediation using chemical oxidation and anaerobic bioremediation.

7
3.0 TECHNOLOGY DESCRIPTION
3.1 TECHNOLOGY DEVELOPMENT AND APPLICATION
ISCO and ISAB are being implemented at numerous private and Department of Defense (DoD) sites. The general approach for both technologies is fairly similar. A chemical reagent (aqueous chemical oxidant or organic substrate) is distributed throughout the treatment zone using a system of temporary or permanent wells. With ISCO, an abiotic chemical reaction occurs between the chemical reagent and the contaminant to be treated. With ISAB, the organic substrate (e.g., lactate, molasses, EVO, etc.) stimulates growth of desired bacteria which catalyze a chemical reaction converting the contaminant (typically chlorinated solvents, perchlorate, or explosives) to a less toxic or less mobile form. For both ISCO and ISAB to be effective, sufficient reagent must be brought into close contact with the contaminant to be treated. This CE becomes the critical issue—distributing reagents effectively over large areas can be very expensive. Significant costs are associated with the planning and design of the injection system, temporary or permanent wells, labor to perform the injection, and material costs for the chemical reagent or substrate.
3.2 PREVIOUS TESTING OF TECHNOLOGY
ISCO and ISAB have been applied at thousands of contaminated sites throughout the United States. While these technologies have been very effective at some sites, there are other sites where treatment results have been less than desired. The most common problem is believed to be poor delivery of the chemical reagent to the treatment zone. Poor delivery can result from: (1) not injecting sufficient reagent; (2) not injecting enough water to thoroughly distribute the reagent; and/or (3) not properly locating the injection wells. Over the past two decades, considerable advances have been made in the ability to model transport of dissolved solutes (i.e., reagents) in the subsurface. This progress includes development of: (1) advanced numerical models for simulating the 3-D transport of reactive and non-reactive solutes in heterogeneous aquifers; (2) advanced stochastic techniques for describing subsurface heterogeneity with reasonably good databases on the statistical properties of a number of different aquifers; and (3) excellent visualization tools for examining the spatial and temporal distribution of contaminants in 3-D. With sufficient time and data, K modelers can simulate reagent movement in the subsurface. Unfortunately, at real sites, there is rarely enough time, data, or resources for modeling, so these advanced simulation and visualization models are rarely if ever used. However, these validated models can provide a credible basis for developing simpler, user-friendly design tools.

This page left blank intentionally.

9
4.0 TECHNICAL APPROACH AND METHODOLOGY
In the first phase of this project, a series of numerical model simulations were generated to evaluate the performance of different injection systems and develop guidelines on how to effectively distribute aqueous reagents in heterogeneous aquifers. Model simulations were performed using the numerical modeling packages Modular Flow Model (MODFLOW) (Harbaugh et al., 2000), Modular 3-D Transport Model (MT3D) (Zheng, 1990), and Reactive Transport 3-D Model (RT3D) (Clement, 1997) within Groundwater Modeling System (GMS) (Aquaveo, 2011) where transport of each reagent or compound was simulated by
𝑅𝐴𝜕𝐴𝜕𝑡
=𝜕𝜕𝑥
�𝐷𝜕𝐴𝜕𝑥� −
𝜕(𝑣𝐴)𝜕𝑥
+𝑞𝑆𝜑𝐴𝑆 + 𝑟𝐴
A = aqueous phase concentration of compound A RAD = dispersion coefficient (m/d
= retardation factor for compound A 2
v = velocity (m/d) )
𝜑 = porosity (dimensionless) qsA
= volumetric water flux of sources and sinks s
r = source/sink concentration for contaminant A
A
= reaction rate of compound A
Chemical reactions between the injected reagent (MnO4-
, SS, or EVO), the aquifer matrix, and the contaminant(s) were simulated using the user defined modules in RT3D, implemented using Visual Fortran compiler in dynamic link libraries.
Numerical simulations were performed for the hypothetical injection grid shown in figure 1. The injection system consists of five rows of injection wells. Alternating rows are offset to improve reagent distribution. It is not practical to simulate this large area with a 3-D heterogeneous K distribution, so a subsection of the treatment area (dashed rectangle near the center of figure 1) was simulated.
Figure 1. Hypothetical injection grid showing model domain subarea.

10
Figure 2 shows an enlarged view of the model domain subsection. CE was calculated for the rectangular zone between the first and third rows of wells (shaded red).
Figure 2. Model domain for base case condition-area treatment.
The effects of varying site conditions and design parameters on CE were evaluated for a standard “base case” condition (table 1). For the base case, SW perpendicular to K flow was 3.25 m and row spacing (SR) along the direction of K flow was 3.0 m. The model domain was 3.25 m by 18.25 m with an effective saturated thickness (Z) of 3 m. A bulk density (𝜌𝐵) of 2 g/cm3
and an effective porosity (𝜑) of 0.2 were assumed. In addition to flow induced by the injection wells, constant head boundaries located at the upgradient and downgradient limits of the model result in a background hydraulic gradient through the treatment zone. No flow boundaries are placed to simulate a recurring pattern of injection wells perpendicular to K flow. Emulsion transport was simulated with the Method of Characteristics (MOC) solver within the MT3D and RT3D numerical models. Dispersion was simulated with the Generalized Conjugate Gradient (GCG) Package including the full dispersion tensor. Chemical reaction terms were solved using the fourth order Runga-Kutta solver. Grid discretization was Δx = 0.23 m, Δy = 0.25 m and Δz = 0.05 m resulting in a 13x72x60 grid containing 56,160 cells.
Table 1. Base case simulation conditions.
Parameter Value Units Well spacing perpendicular to flow (Sx) 3 m Well spacing parallel to flow (Sy) 6 m Vertical thickness of treatment zone (Z) 3 m Effective porosity (𝜑) 0.2 … Bulk density (𝜌𝐵) 2,000 kg/mLongitudinal dispersivity (α
3 L 0.01 ) m
Transverse dispersivity (αT 0.001 ) m Vertical dispersivity (αV 0.0002 ) m Molecular diffusion coefficient 1.7x10 m-5 2
Horizontal correlation length (λ/d
x = λy 2.0 ) m Vertical correlation length (λz 0.2 ) m Injection rate per well (Q) 5.76 m3
/d
The hydraulic conductivity field was represented as a spatially correlated random field with low, medium, and high levels of heterogeneity (i.e., the variance of Ln K (σ2
GW Flow
1
5
2
3
4
) = 0.25, 1.0, and 4.0). Five realizations of the K distribution were simulated for each level of heterogeneity. The realizations were generated using the turning bands method (Tompson et al., 1989) with a horizontal correlation length of 2 m and a vertical correlation length of 0.2 m.

11
Figure 3 shows the hydraulic conductivity distribution in plan and longitudinal cross-section (profile) view. Higher K is indicated by the darker red and lower K is indicated by the lighter pink color. In plan view, the injected reagents appear to be concentrated close to the injection wells (data not shown). However in profile view, the effects of the heterogeneous K distribution are more apparent, causing reagents to be transported farther in high K layers and much less in lower K layers. Once injection ends, the ambient hydraulic gradient can carry a portion of the reagent downgradient, increasing CE. The extent of downgradient transport is controlled by the rate of K flow and the kinetics of reagent consumption/attachment to the solid aquifer material.
Figure 3. Hydraulic conductivity distribution used in model simulations: (a) plan view; and
(b) profile view for moderately heterogeneous aquifer (realization #1).
4.1 CONTACT EFFICIENCY
For in situ treatment to be effective, two things must occur: (1) the treatment reagent (EVO, SS, or MnO4
-
) must be brought into close contact with the contaminants; and (2) environmental conditions must be appropriate for the desired chemical or biological reaction. Potentially important environmental conditions include presence of required chemical catalysts or bacteria to facilitate the reaction, appropriate pH, temperature, nutrients, and absence of chemical or biological inhibitors.
The focus of this project was on developing designs that result in improved distribution of treatment reagent throughout the target treatment zone. Good reagent distribution does not guarantee good treatment. However, it is virtually impossible to get good treatment with poor reagent distribution. Users should be aware that contaminant treatment efficiency will often be less than the CE due to non-ideal environmental conditions (e.g., pH, temperature, etc.) and can be much lower if the contaminants are primarily located in lower K zones that are not effectively contacted by the treatment reagent. Nonetheless, improving reagent distribution can be reasonably expected to result in some improvement in contaminant treatment efficiency.
a. plan view
b. profile view

12
4.2 SPREADSHEET-BASED DESIGN TOOLS
For each of the technologies evaluated in this project (anaerobic bioremediation with EVO, anaerobic bioremediation with SS, and chemical oxidation with MnO4
-
), simple spreadsheet-based tools were developed to allow designers to evaluate the effect of different design variables (e.g., well spacing, amount of reagent, injection rate, etc.) on remediation system cost and expected performance. The design tools consist of a series of linked worksheets for data entry and evaluation of different design alternatives. In the first worksheets, users enter information on site characteristics (e.g., depth, aquifer material, K, porosity, etc.) and costs (e.g., labor, drilling, site access restriction, discount rate, etc.). This information feeds into separate spreadsheets for planning the remediation system and evaluating overall costs. However, the design tools are not intended to generate detailed cost estimates.

13
5.0 ANAEROBIC BIOREMEDIATION WITH EMULSIFIED VEGETABLE OIL
5.1 NUMERICAL MODELING OF EMULSIFIED VEGETABLE OIL DISTRIBUTION
Transport and retention of EVO in K was simulated using a rate limited sorption approach where the rate of mass transfer between the mobile and immobile phases is proportional to the concentration gradient between both phases. The rate of exchange with the solid phase can be simulated as:
𝜕𝐶𝑠𝜕𝑡
= 𝐾𝑚∅𝜌
(𝐶𝑎 − 𝐶∗)
where Cs is the solid phase concentration, Ca is the aqueous phase concentration, C* is the sorbed concentration in equilibrium with the aqueous phase, and Km
𝐶∗ = 𝐶𝑠(𝐾1𝐾2 − 𝐾1𝐶𝑠)−1
is the aqueous-solid mass transfer rate. Retention of oil droplets by the aquifer solids was represented with a Langmuir isotherm:
where K1 is the binding constant and K2
5.2 AQUIFER VOLUME CONTACT EFFICIENCY
is the maximum sorption capacity.
The performance of different injection systems for distributing EVO was evaluated based on the aquifer volume contact efficiency (EV) or the fraction of the target treatment zone where the oil concentration after injection is greater than 5% of the maximum possible oil retention (K2
5.3 EFFECT OF SCALING FACTORS ON CONTACT EFFICIENCY
). Currently, there is no well-established procedure to determine what oil concentration is required for effective treatment. Even very small amounts of oil will initially support anaerobic biodegradation. However, if the amount of oil retained is too low, the oil will be rapidly depleted and long-term performance will be reduced.
Results from an extensive series of sensitivity analyses demonstrated that EV is primarily controlled by the volume of EVO injected and the volume of water injected to distribute the reagent. To allow easy comparison between different simulations, the mass of oil injected and volume of fluid injected are presented as dimensionless scaling factors. The volume scaling factor (SFV
) is the ratio of fluid (emulsified oil plus water) injected per well to the PV within a base treatment zone (BTV) around each well or:
SFV
= Volume fluid injected per well/(𝜑BTV)
where 𝜑 is the effective porosity. For area treatment, the BTV = SW SR Z.

14
The mass scaling factor (SFM
SF
) is the ratio of oil injected per well to the oil required to fill all the attachment sites within the BTV or:
M = Mass oil injected per well / (ORM ρBwhere OR
BTV) M is the maximum oil retention per unit weight aquifer material. ORM is identical to
K2
used in the emulsion transport model.
Figure 4 shows the effect of varying water injection volume (represented by SFV) and mass of EVO (represented by SFM) on EV. The highest EV are obtained for large values of SFM and SFV
.
Figure 4. Effect of SFV and SFM
on volume contact efficiency for a moderately heterogeneous aquifer with well spacing approximately equal to row spacing.
Overall, the model simulation results indicate that it is relatively easy to achieve a volume CE of 50-60% for a moderately heterogeneous aquifer. However, it becomes progressively more difficult to achieve higher contact efficiencies and it may not be practical to achieve contact efficiencies above 70% in heterogeneous aquifers. Readers are reminded that CE is not the same as treatment efficiency. When emulsified oil is injected into the subsurface, it primarily migrates through and contacts the higher K zones. Contaminants present in these higher K zones will come in direct contact with the oil and should biodegrade relatively rapidly. Once contaminants in the higher K zones are degraded, contaminants will begin to slowly diffuse out of the lower K zones and will be treated. However, diffusion out of these lower K zones is a slow process, requiring years or even decades to occur. One of the major advantages of the emulsified oil process is that the oil biodegrades slowly, supporting biodegradation for years. As long as significant oil remains in the higher K zones, contaminant concentrations in monitor wells will remain low and the flux of contaminants transported downgradient will remain low. In addition, diffusion of contaminants out of the lower K zones will be enhanced and the rate of source area treatment will be increased. Under these conditions, EV of 40-50% may provide good treatment, and increasing EV
0
0.2
0.40.6
0.8
Mass Scaling Factor (SFM)
0
0.20.4
0.60.8
VolumeScalingFactor(SFV)
25
50
75
100
Volume Contact
Efficiency (%)
25
50
75
100
Volume Contact
Efficiency (%)
to 60% may provide little additional benefit. Unfortunately, the project team does not currently have any way to quantitatively relate volume CE to cleanup rate.

15
5.4 EMULSIFIED VEGETABLE OIL DESIGN TOOL DEVELOPMENT AND EVALUATION
A design tool was developed to assist engineers with the design of systems for distributing EVO for ISAB of K contaminants in barrier and area treatments. The design tool consists of several worksheets broken into four sections entitled: Site Data, Installation and Injection, Barrier Treatment, and Area Treatment. Details of the model development and all calculations are presented in Borden et al. (2008a, 2008b). Additional information on design of anaerobic bioremediation systems is available in Air Force Center for Environmental Excellence (AFCEE) et al. (2004) and in Solutions-IES (2006). A series of sensitivity analyses were performed to identify factors that had a major influence on cost and performance. In all analyses, results are presented for the well spacing with the lowest 30-year net present value (NPV). Results are compared to a base case intended to represent a typical site.
• For optimum contaminant removal, emulsified oil barriers and area treatments should be designed to achieve the highest CE that can be cost-effectively achieved. However, increasing CE also increases costs.
• Sensitivity analysis results indicate that both capital and life-cycle costs are relatively insensitive to site conditions, for both barrier and area treatment. Obviously, total costs are often higher for large, wide, deep sites. Unit costs are often higher for smaller sites due to the proportionately higher fixed costs associated with planning, design, and monitoring.
• The target CE for barriers does not typically have a major impact on cost for values less than 85%. However, increasing in the target CE for a barrier above 85% often results in a substantial cost increase. For area treatment, estimated costs increase approximately linearly with target CE.
• Errors in estimation of the ORM by the aquifer material can have a major impact on cost and performance for both barrier and area treatment. Given the importance of this parameter, ORM
should be directly measured on field or lab samples whenever possible.

This page left blank intentionally.

17
6.0 ANAEROBIC BIOREMEDIATION WITH SOLUBLE SUBSTRATE
6.1 NUMERICAL MODELING OF SOLUBLE SUBSTRATE DISTRIBUTION
A series of numerical model simulations were conducted to evaluate the effect of important design parameters on SS distribution assuming SS can be represented using first order irreversible kinetic reaction. Contaminant biodegradation was not explicitly simulated. Instead, contaminant biodegradation was assumed to be enhanced when the concentration of the organic substrate is greater than a user defined Cmin
6.2 STEADY STATE CONTACT EFFICIENCY
.
In this work, effective treatment was assumed to occur when the substrate concentration is greater than a user defined Cmin. However, CE varies over time as the SS is depleted or washed out of the target treatment zone and as additional substrate is injected (figure 5). Immediately after the start of injections, CE increases steadily with time as more and more of the treatment zone becomes contacted. However, CE eventually reaches a quasi-steady-state value when the amount of substrate injected is balanced by the loss of substrate due to decay and downgradient transport. This steady-state value is defined as the CESS
and was used as the primary measure of SS treatment performance.
Figure 5. Variation of SS treatment zone contact efficiency with time.
6.3 EFFECT OF DESIGN PARAMETERS ON STEADY-STATE, VOLUME AVERAGE CONTACT EFFICIENCY
An extensive series of sensitivity analyses were conducted to examine the impact of substrate injection concentration (CI), Cmin, K travel time (TT) between rows of injection wells, substrate half-life (TH), time period between substrate reinjections (TR), PVs of substrate solution injected, and CESS. Analysis of these results revealed that CESS can be accurately predicted based on four dimensionless variables: 1) CI/Cmin; 2) PV; 3) TT/TH; and 4) TR/TT
.
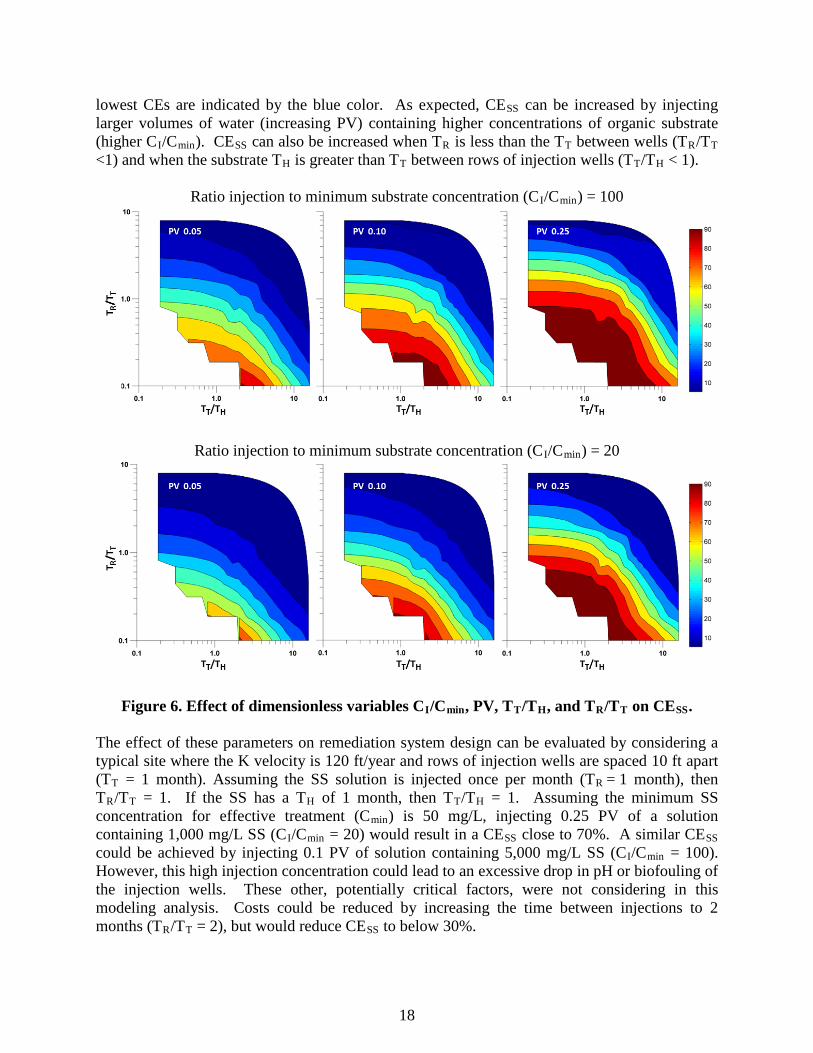
Figure 6 shows the effect of the dimensionless variables CI/Cmin, PV, TT/TH, and TR/TT on CESS
Time (Days)
Cont
act E
ffic
ienc
y [%
]
. The highest contact efficiencies are indicated by the dark red or maroon color while the
18
lowest CEs are indicated by the blue color. As expected, CESS can be increased by injecting larger volumes of water (increasing PV) containing higher concentrations of organic substrate (higher CI/Cmin). CESS can also be increased when TR is less than the TT between wells (TR/TT <1) and when the substrate TH is greater than TT between rows of injection wells (TT/TH
< 1).
Ratio injection to minimum substrate concentration (CI/Cmin
) = 100
Ratio injection to minimum substrate concentration (CI/Cmin
) = 20
Figure 6. Effect of dimensionless variables CI/Cmin, PV, TT/TH, and TR/TT on CESS
.
The effect of these parameters on remediation system design can be evaluated by considering a typical site where the K velocity is 120 ft/year and rows of injection wells are spaced 10 ft apart (TT = 1 month). Assuming the SS solution is injected once per month (TR = 1 month), then TR/TT = 1. If the SS has a TH of 1 month, then TT/TH = 1. Assuming the minimum SS concentration for effective treatment (Cmin) is 50 mg/L, injecting 0.25 PV of a solution containing 1,000 mg/L SS (CI/Cmin = 20) would result in a CESS close to 70%. A similar CESS could be achieved by injecting 0.1 PV of solution containing 5,000 mg/L SS (CI/Cmin = 100). However, this high injection concentration could lead to an excessive drop in pH or biofouling of the injection wells. These other, potentially critical factors, were not considering in this modeling analysis. Costs could be reduced by increasing the time between injections to 2 months (TR/TT = 2), but would reduce CESS to below 30%.

19
6.4 SOLUBLE SUBSTRATE DESIGN TOOL DEVELOPMENT AND EVALUATION
A design tool was developed to assist engineers with the design of systems for distributing SS for ISAB of K contaminants in area treatments. The design tool consists of several worksheets broken into four sections entitled: Site Data, Installation and Injection Cost, Substrate, and Remediation Design. Within each section, there are several subsections for data entry and design calculations. Details of how the model was developed and all calculations are presented in Borden et al. (2012). Additional information on design of anaerobic bioremediation systems is available in AFCEE et al. (2004). A series of sensitivity analyses were conducted with the design tool to identify factors that had a major influence on costs and performance. In all analyses, results are presented as NPV assuming a 5-year operating period. Results are compared to a base case condition intended to represent a typical site. Major results of this analysis include the following:
• Total costs to treat a site for 5 years using SS is relatively insensitive to site conditions. Obviously, total costs are often higher for large, wide, and deep sites. Unit costs are often higher for smaller sites due to the proportionately higher fixed costs associated with planning, design, and permitting.
• Estimated CESS can be increased by varying different design parameters including CI, Cmin, K TT between rows of injection wells, SS TH, TR, and PVs of substrate solution injected. In most cases, increasing CESS results in increasing costs. For many parameters, there is some middle range where the ratio of CESS
• Optimized designs can be developed by simultaneously varying several different design parameters to generate alternatives that result in the lowest cost for a specified value of CE
to 5-year costs is highest.
SS. In many cases, the highest ratio of CESS to cost occurs for CESS in the range of 70-80%. If higher CESS
results in more rapid cleanup, it may be desirable to aim for higher contact efficiencies to reduce total life cycle costs.

This page left blank intentionally.

21
7.0 CHEMICAL OXIDATION WITH PERMANGANATE
7.1 NUMERICAL MODELING OF PERMANGANATE DISTRIBUTION
A series of numerical model simulations were conducted to evaluate the effect of important design parameters on MnO4
- distribution. MnO4- consumption was simulated as an
instantaneous reaction with the contaminant and NODI, and a second order reaction with NODS
.
Model simulation results indicate that the two parameters with the greatest impact on EV and pollutant treatment efficiency are: (1) the mass of MnO4
- injected; and (2) the volume of water injected. When small amounts of MnO4
- are injected, the reagent is rapidly consumed and CE does not increase with time after the first 30 days. However, when larger amounts of MnO4
- are injected, the reagent can persist for several months resulting in a gradual increase in CE with time. For constant MnO4
- mass, increasing fluid volume injected initially results in an improvement in CE. However, further increases in fluid volume injected result in little additional benefit. Conversely, when fluid volume is held constant and MnO4
- mass is increased, CE steadily increases, due to downgradient drift/dispersion of MnO4
-. However, increasing mass of MnO4
- injected also increases the amount of MnO4-
that migrates out of the target treatment zone.
Common approaches for improving remediation system performance include: (1) reducing the injection well spacing; and (2) performing multiple MnO4
- injections in the same well. Numerical model simulation results indicate that both well spacing within a row and SR have only a modest impact on either EV or fraction of un-reacted MnO4
- (U), when relatively small amounts of MnO4
- and fluid are injected (SFV and SFM < 0.25). However, for larger amounts of reagent and fluid injected, increased SR
has a substantial negative impact, reducing volume CE and increasing the amount of U released downgradient.
Numerical model simulation results indicate that if the total volume of fluid injected and mass of reagent is held constant, multiple injection events will not increase CE compared to a single large injection event, and can increase the amount of U released downgradient. This result occurs because several small injections through the same wells repeatedly treat the same area around the wells, resulting in more complete removal of NODS near the injection well. In contrast, a single large injection can more rapidly transport MnO4
-
away from the injection well, increasing the fraction of aquifer contacted. However, at many sites it may not be practical to inject a large amount of water in a single injection due to pressure buildup in the aquifer and multiple injections are therefore required. In these cases, multiple small injections can significantly improve performance compared to a single small injection.
Aquifer heterogeneity appears to have a complex relationship with remediation system performance. The presence of higher K channels in the moderate and high heterogeneity simulations may allow more rapid transport of MnO4
- away from the injection well when only a small amount of fluid is injected, improving contaminant treatment. However, MnO4
- cannot penetrate the lower K zones in highly heterogeneous formations, reducing the maximum level of treatment that can be achieved.

22
7.2 CONCEPTUAL DESIGN OF IN SITU CHEMICAL OXIDATION DEVELOPMENT AND EVALUATION
The CDISCO design tool was developed in cooperation with ESTCP project ER-200623 to assist in planning MnO4
- injection systems. CDISCO is used to estimate the effective radius of influence (ROI) based on user-specified values for contact time and the critical MnO4
-
concentration. This ROI is then used to determine required well spacing and injection parameters, and to generate preliminary cost estimates. Injection parameters can be quickly changed, allowing designers to easily evaluate multiple alternatives and identify lower cost, more effective designs. Details of how CDISCO was developed and all calculations are presented in Borden et al. (2010). Additional information on design of ISCO systems is available in United States Environmental Protection Agency (USEPA) (1998), Interstate Technology & Regulatory Council (ITRC) (2005), Huling and Pivetz (2006), and Siegrist et al. (2009).
CDISCO is implemented within a Microsoft Excel spreadsheet. On the first worksheet, users enter information on aquifer characteristics (e.g., porosity, hydraulic conductivity, injection interval, NOD, contaminant concentrations, etc.), injection conditions (MnO4
- injection concentration, flow rate, and duration), and target conditions (minimum oxidant concentration and duration to calculate ROI). The MnO4
- transport model then computes the spatial distribution of MnO4
-, NODI, and NODS as a function of radial distance at various times. Figure 7 shows typical output from the MnO4
- transport model simulations. The graph shows the variation in MnO4
-
concentration versus distance at several different times (15, 30, 45, and 60 days for this simulation). The table at the bottom shows input parameters for a series of prior simulations. The effective ROI is computed for a user specified time and minimum oxidant concentration.
CDISCO also includes a simplified procedure to generate preliminary cost estimates based on the user-specified treatment area dimensions, injection ROI overlap (%), number of injection events planned; fixed cost; and unit costs for injection point installation, chemical reagents, and labor for injection. Two injection approaches are considered—injection through direct push rods or through wells. Cost factors are included for mobilization, labor, materials, equipment rental, travel, and subcontractor costs. Figure 8 shows typical output from the cost estimating procedure comparing preliminary estimates for several different design alternatives. Aquifer parameters, treatment area dimensions (100 ft x 100 ft), ROI overlap (25%), time to calculate ROI (30 days), minimum oxidant concentration (50 mg/L), and number of injection events (5) are constant for all alternatives. Alternative 1 has a relatively high cost because the short injection duration (3 days) required a large number of injection points. Alternative 5 has a lower cost because the longer injection duration (10 days) and higher oxidant concentration (20,000 mg/L potassium permanganate [KMnO4
]) reduced number of injection points required.

23
a
Figure 7. Typical output from permanganate transport model. Natur al Oxidant Demand
SelectedRun
NumberInjection Duration
Aquifer Thickness
Thickness of Mobile Zone
NOD Fraction Instantaneous NOD (g/kg)
Slow NOD Rate
Injection Oxidant Conc
(mg/L)
Injection Rate
gal/Day ROI
Minimum Oxidant Conc to
Calc ROI
Target Number of
Days to Calc ROI
1 3 20 10 0.1 5 0.001 10,000 3,000 10.41 50 30 2 5 20 10 0.1 5 0.001 10,000 3,000 14.46 50 30 3 10 20 10 0.1 5 0.001 10,000 3,000 21.25 50 30 4 10 20 10 0.1 5 0.001 5,000 3,000 15.56 50 30 5 10 20 10 0.1 5 0.001 20,000 3,000 27.23 50 30 6 5 20 10 0.1 5 0.001 20,000 3,000 19.64 50 30
0
1000
2000
3000
4000
5000
6000
7000
8000
9000
10000
0 5 10 15 20 25 30 35 40 45 50
Oxi
dant
Con
cent
ratio
n (m
g/L)
Radial Distance (ft)
Oxidant Concentration vs. Radial Distance
15 days
30 days
45 days
60 days
Target Oxidant Conc.
a

24
Figure 8. Typical output from injection scenario cost comparison.
Run 1 2 3 4 5 6Total Fixed Costs (injection) $94,800 $94,800 $94,800 $94,800 $94,800 $94,800Total Well Installation Costs $85,667 $47,700 $25,367 $41,000 $18,667 $29,833Total Injection Costs $478,800 $410,400 $364,800 $684,000 $228,000 $228,000Total Oxidant Cost $378,547 $324,469 $288,417 $270,391 $360,521 $360,521Total Installation and Injection Costs $1,037,814 $877,369 $773,384 $1,090,191 $701,988 $713,155Number of probes or wells required 35 18 8 15 5 10NOD (g/kg) 5 5 5 5 5 5Injection Oxidant Concentration 10000 10000 10000 5000 20000 20000Injection Oxidant Mass (lbs) 26288 22533 20029 18777 25036 25036Injection Duration (days) 3 5 10 10 10 5Volume Injected per Day (gal/d) 3000 3000 3000 3000 3000 3000Thickness of Mobile/Target Thickness 0.5 0.5 0.5 0.5 0.5 0.5
00
$0
$200,000
$400,000
$600,000
$800,000
$1,000,000
$1,200,000
1 2 3 4 5 6
Tota
l Ins
talla
tion
and
Inje
ctio
n Co
sts
Run #
Total Oxidant Cost
Total Injection Costs
Total Well Installation Costs
Total Fixed Costs (injection)

25
8.0 IMPLEMENTATION ISSUES
In this project, a series of spreadsheet-based tools were developed to assist in the design of injection systems to treat contaminated aquifers by: 1) ISAB using EVO; 2) ISAB using SS; and 3) ISCO using MnO4
-. The tools are relatively simple to use, allowing designers to evaluate the effect of different design variables (e.g., SW
, amount of reagent, injection volume, etc.) on remediation system cost and expected performance. After a few hours of study, designers can evaluate a proposed injection system in about an hour.
Design tool users do not need any formal training or background in K modeling. However, they should have a good understanding of the remediation technology being considered (anaerobic bioremediation or chemical oxidation) and common injection technologies. Prior to beginning use of these tools, users should already have completed a site characterization to define general site characteristics (lithology, K, flow velocity), contaminant distribution and conducted a preliminary screening to determine if the remediation approach is appropriate for the conditions at their site.
8.1 DESIGN TOOL LIMITATIONS
For effective treatment, the injected reagents must come into contact with the contaminant. The tools developed in this project are intended to help designers improve reagent distribution at a reasonable cost. In many cases, this should improve contaminant treatment efficiency. However, designers should be aware of the numerous other factors that can lead to poor treatment including improper reagent selection, unfavorable environmental conditions (e.g., pH, temperature, nutrients, etc.), absence of required chemical catalysts or bacteria to facilitate the reaction, and chemical or biological inhibitors. Contaminant treatment efficiency will also be lower if the contaminants are primarily located in lower K zones that are not effectively contacted by the treatment reagent. Nonetheless, improving the fraction of aquifer contacted by the reagent should improve contaminant treatment efficiency at many sites. Users should also be aware that these design tools are strictly focused on improving reagent distribution. In virtually all cases, the tools predict that CE can be increased by injecting more reagent and by injecting more water to distribute the reagent. While this approach should improve reagent distribution, it may also increase the potential for adverse secondary impacts, possibly including displacement of the contaminant and changes in aquifer geochemistry (e.g., increases in dissolved manganese, iron, sulfide, total organic carbon, methane, odor, color, etc.). These potential impacts need to be carefully considered before implementing any in situ remediation approach.

This page left blank intentionally.

27
9.0 COST ANALYSIS
The tools developed in this project for design of remediation systems with EVO, SS, and MnO4-
are based on the Microsoft Excel spreadsheet, so the actual training required to use the tools is minimal. Experienced remediation professionals can easily learn to use these tools after a 45 min overview presentation. Once trained, remediation system design with these tools is quicker and less expensive than current hand calculation approaches. Based on experience of the project team, it is relatively easy to reduce the cost of a $500,000 remediation project by 10-20% saving $50,000-$100,000 with 1-2 hours of work.
In addition to cost savings, the most important benefit of using these tools is the improved performance and reliability of the remediation systems. Prior to this project, remediation professionals did not have any way to quantify the potential benefits of a more effective design, but did have excellent tools for evaluating the impact on cost. Given the uncertain benefits associated with more robust designs (i.e., injecting more material or using more closely spaced wells) and the specific quantitative information on costs, most people will bias towards cheaper, less effective designs. While it is difficult to quantify the economic benefit of improved performance, remediation efforts are expensive. Reducing the likelihood of remediation system failure should have a strong economic benefit.

This page left blank intentionally.

29
10.0 REFERENCES
Aquaveo. 2011. The Department of Defense Groundwater Modeling System, GMS v8.1. South Jordan Utah: Aquaveo.
Air Force Center for Environmental Excellence (AFCEE), Naval Facilities Engineering Service Center (NFESC), and Environmental Security Technology Certification Program (ESTCP). 2004. Principles and Practices of Enhanced Anaerobic Bioremediation of Chlorinated Solvents. Prepared for Air Force Center for Environmental Excellence, TX, Naval Facilities Engineering Service Center, CA and Environmental Security Technology Certification Program, VA.
Borden, R.C., M. Clayton, A.M. Weispfenning, T. Simpkin, and M.T. Lieberman. 2008a. Technical Report - Design Tool for Planning Emulsified Oil Injection Systems. Environmental Science and Technology Certification Program, Washington, DC.
Borden, R.C., M. Clayton, A.M. Weispfenning, T. Simpkin, and M.T. Lieberman, 2008b. Emulsified Oil Design Tool USERS MANUAL. Environmental Science and Technology Certification Program, Washington, DC.
Borden, R.C., T. Simpkin, and M.T. Lieberman. 2010. Technical Report - Design Tool for Planning Permanganate Injection Systems. Environmental Science and Technology Certification Program, Washington, DC.
Borden, R.C., K.Y. Cha, and T. Simpkin. 2012. Technical Report - Design Tool for Planning Soluble Substrate Injection Systems. Environmental Science and Technology Certification Program, Washington, DC.
Clement, T.P. 1997. RT3D: A Modular Computer Code for Simulation of Reactive Multispecies Transport in 3-Dimensional Groundwater Systems. US Department of Energy.
Harbaugh, A.W., E.R. Banta, M.C. Hill, and M.G. McDonald. 2000. MODFLOW-2000, the US Geological Survey Modular Ground-Water Model - User Guide to Modularization Concepts and the Ground-Water Flow Process. Open-File Report 00-92, US Geological Survey, pg. 121.
Huling, S.G., and B. Pivetz. 2006. “In-Situ Chemical Oxidation - Engineering Issue”. US Environmental Protection Agency, National Risk Management Research Laboratory, R.S. Kerr Environmental Research Center, Ada, OK. EPA/600/R-06/072. (http://www.epa.gov/ada/download/issue/600R06072.pdf).
Interstate Technology & Regulatory Council (ITRC). 2005. Technical and Regulatory Guidance for In Situ Chemical Oxidation of Contaminated Soil and Groundwater 2nd Edition, ISCO-2. Washington, DC: Interstate Technology & Regulatory Council. http://www.itrcweb.org/gd_ISCO.asp

30
Siegrist, R.L. M.L. Crimi, B. Petri, T. Simpkin, T. Palaia, F.J. Krembs, J. Munakata-Marr, T. Illangasekare, G. Ng, M. Singletary, and N. Ruiz. 2009. In Situ Chemical Oxidation for Groundwater Remediation: Site Specific Engineering & Technology Application, ER-0623 Final project report. Environmental Security Technology Certification Program, Alington, VA
Solutions-IES. 2006. Protocol for Enhanced In Situ Bioremediation Using Emulsified Edible Oil Edible Oil Barriers for Treatment of Perchlorate Contaminated Groundwater. Environmental Security and Technology Certification Program, Arlington, VA. (www.estcp.org).
Tompson, A.F.B., R. Aboudu, and L.W. Gelhar. 1989. Implementation of the Three Dimensional Turning Bands Random Field Generator. Water Resources Research 25(10). pp. 2227-2243.
U.S. Environmental Protection Agency (USEPA). 1998. Field Applications of In Situ Remediation Technologies: Chemical Oxidation. U.S. Environmental Protection Agency, Solid Waste and Emergency Response, EPA 542-R-98-008.
Zheng, C. 1990. MT3D, A modular three-dimensional transport model for simulation of advection, dispersion and chemical reactions of contaminants in groundwater systems. US Environmental Protection Agency.

A-1
APPENDIX A
POINTS OF CONTACT
Point of Contact Organization
Phone Fax
E-Mail Role In Project Robert C. Borden, P.E., Ph.D.
North Carolina State University Campus Box 7908 Raleigh, NC 27695
Phone: 919-515-1625 Fax: 919-515-7908 E-Mail: [email protected]
Principal Investigator
Thomas Simpkin, P.E., Ph.D.
CH2M HILL, Inc. 9193 South Jamaica Street Englwood, CO 80112-5946
Phone: 720-286-5394 Fax: 720-286-9884 E-Mail: [email protected]
Co-Investigator
M. Tony Lieberman, R.S.M.
Solutions-IES, Inc. 3722 Benson Drive Raleigh, NC 27609
Phone: 919-873-1060 Fax: 919-873-1074 E-Mail: [email protected]
Co-Investigator
Erica Becvar HQ AFCEE/TDE Technology Transfer 2261 Hughes Avenue. Suite 155 Lackland AFB, TX 78236-9853
Phone: 210-395-8424 E-Mail: [email protected]
Contracting Officer’s Representative (COR)
Andrea Leeson ESTCP 4800 Mark Center Drive Suite 17008 Alexandria, VA 22350-3605
Phone: 571-372-6398 E-Mail: [email protected]
Environmental Restoration Program Manager

ESTCP Office4800 mark center DriveSuite 17D08alexandria, va 22350-3605
(571) 372-6565 (Phone)
E-mail: [email protected]