estermann wikimania2015 glam-survey_20150719
TRANSCRIPT

OpenGLAM Benchmark Survey: Preliminary Results from Finland, Poland, Switzerland and The Netherlands Beat Estermann, 19 July 2015 – Wikimania, Mexico City
▶ Bern University of Applied Sciences | E-Government Institute || Open Knowledge | OpenGLAM Working Group
Palacio de Bellas Artes, Mexico City. Photo by Xavier Quetzalcoatl Contreras Castillo. CC BY-SA 3.0 (Wikimedia Commons).
This work is licensed under the Creative Commons Attribution-ShareAlike 4.0 License.
▶ Introduction to the OpenGLAM Benchmark Survey Project
▶ Preliminary Results: Dutch, Finnish, Polish and Swiss Data Sets
▶ Implications for GLAM Outreach
▶ Outlook
Welcome!

Introduction to the OpenGLAM Benchmark Survey Project

▶ Online survey conducted among heritage institutions throughout the world in 2014/2015.
▶ Focusing on questions related to digitization, exchange of metadata, open data/open content, semantic web, social media, crowdsourcing
▶ Inspired by an earlier pilot survey, carried out in Switzerland in 2012
▶ Organized in a federative manner, which means that the organization depends on volunteers and partners in each country
What is the OpenGLAM Benchmark Survey about?

▶ Measure the state of advancement of OpenGLAM in the participating countries
▶ Inform the GLAM community about the latest developments in the area of OpenGLAM
▶ Identify potential partners for open data and/or crowdsourcing projects
▶ Use the study report as a communication instrument to promote OpenGLAM
▶ Provide international comparisons:• Allowing each country to see where it stands compared to other
countries. • Provide the international OpenGLAM community with a tool that helps it
better understand the particularities of each country
What do we want to achieve?

Overview of participating countries
Further countries are welcome to join; but hurry up!
Overview: https://outreach.wikimedia.org/wiki/GLAM/OpenGLAM_Benchmark_Survey/Participating_countries
Participation status (as of 10 July 2015)Dark Green: CompletedLight Green: Initial commitmentYellow: Clarification needed / presently insufficient support
Underlying graphic file: https://commons.wikimedia.org/wiki/File:BlankMap-World-v2.png Roke et al. (CC-by-sa)
Preliminary Results• Dutch, Finnish, Polish, and Swiss Data Sets• Focus on Open Content and
Collaborative Content Creation / Crowdsourcing

CH (incl. FL) FI NL PL
N institutions contacted[1]
1543 (11) 356 1393 669
N responses[2] 278 (2) 81 146 79
Response rate[3] 19% 26% 12% 12% – Archives 27% 50% 16% 21%
– Libraries 29% 37% 15% 17%
– Museums 16% 21% 10% 10%
N inhabitants (2013) 8.1 mio. 5.4 mio. 16.8 mio. 38.5 mio.
GLAM density (GLAMs/mio. inhabitants)
189 66 83 17
Dutch, Finnish, Polish, and Swiss Data Samples
Notes:[1] Number of institutions which have been contacted (each institution is counted once, even if it has been contacted via several email addresses or through different channels, e.g. follow-up phone calls in addition to e-mail reminders).[2] Number of institutions which have completed the questionnaire (almost) in full, i.e. institutions which have responded to at least 20 out of the 24 non-conditional questions of the questionnaire.[3] For the purpose of the calculation of the response rate, institutions which have started to fill in the questionnaire but dropped out after question A2 as they did not correspond to the survey's definition of heritage institutions, are counted as responses.

Where do GLAMs stand with regard to…
…Open Data?…Linked Data / Semantic Web?…Digitization…Open Content?…Engaging Audiences on the Internet…Collaborative Content Creation
What are the perceived risks and opportunities? (drivers vs. hindering factors)What are the expected benefits?
Awareness Evaluation
AdoptionTrialInterest
Innovation Diffusion Model, Everett Rogers, 1962 Early Adopters
13.5%
Share
of
inst
ituti
ons
(%
)
Innovators2.5%
Early Majority
34%
Late Majority34%
Laggards16%

Finland, Poland, Switzerland, The Netherlands, all institution types combined, N = 584.Cases with «stagnation» / «discontinuance» have been ignored.
Share
of
inst
ituti
ons
(%
)
Innovators2.5%
Early Majority
34%
Late Majority34%
Early Adopters13.5%
Laggards16%
Collaborative content creation
Social media
Open content
Digitization
Linked data
Open data
Advanced implementationAdoptionTrialEvaluationInterestNo interest
Diffusion of Innovative Practices among GLAMs

No interest Interest Evaluation Trial Adoption Advanced implementation
Stagnation / discontinuance
Open Data OD_interest = 0 (ODLD_interest = 0)
OD_interest = 1(ODLD_interest = 1)
OD_metadata_5yrs_avg >= 0.5%
OD_metadata_pres_avg >= 0.5%
OD_metadata_pres_avg > 10%
ANDOD_metadata_5yrs
_avg > OD_metadata_pres
_avg + 10
metadata_pres_avg > 50%
ANDOD_catalogues_pr
es > 50%
OD_metadata_pres_avg >= 0.5%
ANDOD_metadata_pres_avg
< 66%AND
OD_metadata_5yrs_avg <=
OD_metadata_pres_avgAND
imp_OD <= 3Linked Data LD_interest = 0
(ODLD_interest = 0)LD_interest = 1
(ODLD_interest = 1)LD_metadata_5yrs_
avg >= 0.5%LD_metadata_pres
_avg >= 0.5%LD_metadata_pres
_avg > 10%AND
LD_metadata_5yrs_avg >
OD_metadata_pres_avg + 10
LD_metadata_pres_avg > 50%
ANDLD_catalogues_pre
s > 50%
LD_metadata_pres_avg >=0.5%
ANDLD_metadata_pres_avg
< 66%AND
LD_metadata_5yrs_avg <=
LD_metadata_pres_avgAND
imp_LD <= 3Digitization DIGI_interest = 0 DIGI_interest = 1 DIGI_5yrs_avg >=
0.5%DIGI_pres_avg >=
0.5%(DIGI_pres_avg >
10%AND
DIGI_5yrs_avg > DIGI_pres_avg +5)
OR
(DIGI_pres_avg > 5%
ANDDIGI_5yrs_avg > DIGI_pres_avg
+10)
DIGI_pres_avg > 50%
DIGI_pres_avg >= 0.5%AND
DIGI_pres_avg < 66%AND
DIGI_5yrs_avg <= DIGI_pres_avg
ANDimp_DIGI <= 3
Documentation: Thresholds / Rules for the Assignment of Cases to Innovation Adoption Stages (1/2)

No interest Interest Evaluation Trial Adoption Advanced implementation
Stagnation / discontinuance
Open Content OC_interest = 0 OC_interest = 1 OC_5yrs_avg >= 0.5% OC_pres_avg >= 0.5%
(OC_pres_avg > 10%AND
OC_5yrs_avg > OC_pres_avg +5)
OR
(OC_pres_avg >5%AND
OC_5yrs_avg > OC_pres_avg +10)
OC_pres_avg > 50%
OC_pres_avg >= 0.5%AND
OC_pres_avg < 66%AND
OC_5yrs_avg <= OC_pres_avg
ANDimp_OC <= 3
Social Media SM_interest = 0 SM_interest = 1 SM_types_1yr_num > 0
SM_types_pres_num > 0
(SM_types_pres_num > 0
AND SM_types_1yr_num > SM_types_pres_num)
OR
(SM_types_pres_num > 1
AND SM_types_1yr_num
>= SM_types_pres_num)
SM_types_pres_num > 3
SM_types_pres_num > 0AND
SM_types_pres_num < 4 AND
SM_types_1yr_num < SM_types_pres_num
ANDimp_ENGAGE <= 3
Collaborative Content Creation
WPWM_interest = 0 WPWM_interest = 1 COLLAB_types_1yr_num > 0
COLLAB_types_pres_num > 0) OR
Collab_prof_num > 0
(COLLAB_types_pres_num > 0 AND
COLLAB_types_1yr_num >
COLLAB_types_pres_num)
OR
(COLLAB_types_pres_num > 1 AND
COLLAB_types_1yr_num >=
COLLAB_types_pres_num)
COLLAB_types_pres_num > 2
COLLAB_types_pres_num > 0
ANDCOLLAB_types_pres_num
< 3 AND COLLAB_types_1yr_num < COLLAB_types_pres_num
AND imp_COLLAB <= 3
Documentation: Thresholds / Rules for the Assignment of Cases to Innovation Adoption Stages (2/2)

Open data Linked data / semantic web Digitization Open content Social media Collaborative content creation0%
10%
20%
30%
40%
50%
60%
70%
37%
2%
44%
12%
45%
16%18%
5%
59%
20%
57%
12%
39%
14%
23%
9%
66%
10%
ArchivesMuseumsLibraries
Adoption Rates According to Institution Type

Adoption Rates – Country Comparison
Open data Linked data / semantic web
Digitization Open content Social media Collaborative content creation
0%
10%
20%
30%
40%
50%
60%
70%
80%
30%
6%
58%
15%
74%
26%28%
6%
38%
12%
75%
13%
18%
4%
44%
12%
34%
8%
38%
10%
71%
31%
70%
17%
FinlandPolandSwitzerlandThe Netherlands

▶ Heritage institutions with a local/regional focus are less likely to use social media than other institutions
▶ The institutions’ size is positively correlated with the adoption of:
▶ open data▶ linked data▶ social media use▶ collaborative content creation
▶ However, the institutions’ size is not related to their adoption of:
▶ digitization▶ open content
▶ Higher levels of public funding are:▶ positively related to the adoption of open data
▶ negatively related to the adoption of open content
Adoption Rates – Further Insights

Exch
angi
ng d
ata
Open
data
Linke
d da
ta /
sem
antic
web
Digiti
zatio
n
Open
cont
ent
Enga
ging
aud
ienc
es o
n th
e In
tern
et
Colla
bora
tive
cont
ent c
reat
ion
0%
10%
20%
30%
40%
50%
60%
70%
80%
90%
100%
25 2311
50
21 2110
2823
16
21
20 23
16
1 - Not important at all2345 - Very important
Importance of Various Practices
N = 584
Data Content Participation

0%
10%
20%
30%
40%
50%
60%
70%
80%
90%
100%
42
2428
62
24
35
23
32
27
28
23
26
29
30
1 - Risks clearly prevail
2
3
4
5 - Opportunities clearly prevail
Desirability of Various Practices (Opportunities vs. Risks)
N = 584
Data Content Participation

1 - Not important at all
2 3 4 5 - Very important0%
5%
10%
15%
20%
25%
30%
3%6% 7%
15%
20%
4%
3%
7%
7%
3%
11% 6%
4%
3%2%
Open data: importance vs. desirability (in % of institutions; N = 475)
Risks prevailEqual risks and opportunitiesOpportunities prevail
35%
21%
Open Data: Importance vs. Desirability
Motors

Open Content: Importance vs. Desirability
1 - Not important at all
2 3 4 5 - Very important
-5%
0%
5%
10%
15%
20%
25%
30%
3%5%
8%
16%18%
5%4%
7%
5% 2%
11%7%
6%
2% 2%
Open content: importance vs. desirability (in % of institutions; N = 466)
Risks prevailEqual risks and opportunitiesOpportunities prevail
Motors
34%
24%

Collaborative Content Creation: Importance vs. Desirability
1 - Not important at all
2 3 4 5 - Very important0%
5%
10%
15%
20%
25%
30%
9% 10% 9%
15%
9%
9% 8% 8%
2%
1%
10%
5%2%
1%
0%
Collaborative content creation: importance vs. desirability (in % of institutions; N = 438)
Risks prevailEqual risks and opportunitiesOpportunities prevail
24%
17%
Motors

Digitization as a Prerequisite for Open Content
0% 1-19% 20-49% 50-79% 80% or more0%
5%
10%
15%
20%
25%
30%
35%
40%
5%2% 2% 1% 2%
4%
19%21%
9% 4%
1%
7%
11%
6%
0%1%
2%
1%
0%
1%
2%
0%
Expected digitization activities over the next 5 years (in % of institutions; N = 457)
80% or more50-79%20-49%1-19%0%
Average percentage of objects already digitized

Digitization: Different types of objects(today / in 5 years)

Digitization Today – Country Comparison
Text
based re
source
s (365)
Two-dim
ensio
nal vis
ual res
ources (
357)
Archiva
l reso
urces (
281)
Three
-dimen
sional
man-m
ade m
ovable
objects
(314)
Natural
reso
urces (
47)
Geogra
phy base
d reso
urces (
119)
Time b
ased re
source
s (220)
0%
10%
20%
30%
40%
50%
60%
70%
80%
90%
100%
1%
17%
0%
30%
50%
10%
2%6%
1%7%
0% 0%2%
10%
1%
10%5%
10%13%
50%
10%
50%
25%
50%
Percentage of resources already digitized by the average institution (median)(N is indicated for each object type; the values for natural resources are not shown due to the small
sample size)
FinlandPolandSwitzerlandThe Netherlands

Digitization in 5 Years – Country Comparison
0%
10%
20%
30%
40%
50%
60%
70%
80%
90%
100%
3%
45%
10%
50% 50%
30%
12%
30%
15%
35%
28%
20%
10%
50%
10%
50%
45%
50%50%
80%
25%
80%
40%
50%
Percentage of resources expected to be digitized in 5 years by the average institution (median)(N is indicated for each object type; the values for natural resources are not shown due to the small
sample size)
FinlandPolandSwitzerlandThe Netherlands

Open Content: Different types of objects(today / in 5 years; in % of digitized objects)

Open Content Today – Country Comparison
Text
based re
source
s (344)
Two-dim
ensio
nal vis
ual res
ources (
340)
Archiva
l reso
urces (
278)
Three
-dimen
sional
man-m
ade m
ovable
objects
(297)
Natural
reso
urces (
46)
Geogra
phy base
d reso
urces (
112)
Time b
ased re
source
s (204)
Digital
inter
active
reso
urces (
123)0%
10%
20%
30%
40%
50%
60%
70%
80%
90%
100%
3% 5% 3% 1%
Percentage of resources already made available as open content by the average institution (median)(N is indicated for each object type; the values for natural resources are not shown due to the small sample
size; “0%” value tags have been suppressed)
FinlandPolandSwitzerlandThe Netherlands

Open Content in 5 Years – Country Comparison
Text
based re
source
s (289)
Two-dim
ensio
nal vis
ual res
ources (
290)
Archiva
l reso
urces (
239)
Three
-dimen
sional
man-m
ade m
ovable
objects
(252)
Natural
reso
urces (
38)
Geogra
phy base
d reso
urces (
93)
Time b
ased re
source
s (179)
Digital
inter
active
reso
urces (
108)0%
10%
20%
30%
40%
50%
60%
70%
80%
90%
100%
0%5% 2% 5%
10%
1% 3%5% 8%2%
10%
30%
0% 0%0%5%
0%5%
10%
0%5%
15%
50%
20%25%
18%10%
19%
Percentage of resources expected to be made available as open content in 5 years by the average institution (median)
(N is indicated for each object type; the values for natural resources are not shown due to the small sample size)
FinlandPolandSwitzerlandThe Netherlands

Copyright Clearance as a Prerequisite for Open Content
Note: The data may be somewhat biased as it does - by definition - not include the data from institutions who weren’t able to provide numbers regarding the copyright status of their objects.
Text
based re
source
s (192)
Two-dim
ensio
nal vis
ual res
ources (
217)
Archiva
l reso
urces (
172)
Three
-dimen
sional
man-m
ade m
ovable
objects
(169)
Natural
reso
urces (
25)
Geogra
phy base
d reso
urces (
62)
Time b
ased re
source
s (122)
Digital
inter
active
reso
urces (
58)0%
10%
20%
30%
40%
50%
60%
70%
80%
90%
100%
31% 29%
47% 42%
59%44%
18%28%
27% 35%
35% 40%
29%
37%
37%
50%
33% 23%
10% 12%8%
13%
34%
15%
8% 13% 8% 7% 4% 6% 11% 6%
What is the copyright situation of the objects in your collection? (average percentages for each object type; N is indicated for each object type)
copyright status unknowncopyright controlled by third partiescopyright controlled by the institutionpublic domain

Benefits of Open Content
D7: In the case of my institution, ‘open content’ is an important means…
N = 456

Challenges Related to Open Content
D8: For my institution, these are important challenges related to ‘open content’…
N = 480

Risks Related to Open Content
D9: For my institution, these are important risks related to ‘open content’…
N = 459

Conditions for Releasing Content
N = 457

▶ 14% of responding GLAMs have staff members who are involved in Wikipedia as part of their job (28% have staff members who are involved in Wikipedia either as part of their job or during leisure time)
▶ Wikimedia Commons: 4%
▶ Wikidata: 2%
GLAM Involvement in Wikipedia
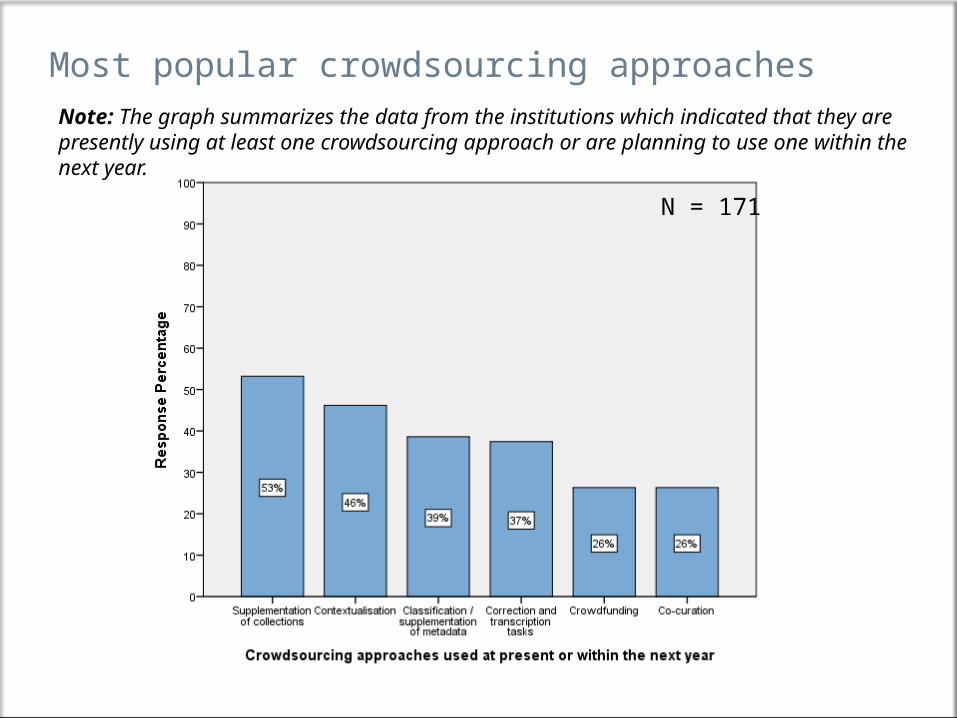
Most popular crowdsourcing approaches
N = 171
Note: The graph summarizes the data from the institutions which indicated that they are presently using at least one crowdsourcing approach or are planning to use one within the next year.

Purpose of crowdsourcingNote: This question was asked only to institutions which indicated that they are presently using at least one crowdsourcing approach or are planning to use one within the next year.
N = 133

Risks and Challenges of CrowdsourcingNote: This question was asked only to institutions which indicated that they are presently using at least one crowdsourcing approach or are planning to use one within the next year.
N = 132

What are the Implications for GLAM Outreach?Summing up the main findings...

▶ Digitization is a widespread practice in the Dutch and Finnish GLAM sector, with adoption rates well above 50%. (Switzerland and Poland are lagging behind; there are considerable differences between countries and institution types).
▶ The Use of Social Media is a widespread practice in the Finnish, Polish, and Dutch GLAM sector, with adoption rates of 70% and more.(Switzerland is lagging behind; there are considerable differences between countries and institution types).
▶ Open Data and Open Content are about to diffuse within the GLAM sector; for Open Data we are observing an overall adoption rate of ca. 26%; for Open Content the adoption rate is about 17%.(The Netherlands are ahead of the other three countries; there are considerable differences between countries and institution types).
▶ Collaborative Content Creation is diffusing slightly more slowly than Open Data / Open Content(There are considerable differences between countries).
▶ These findings are reflected in the importance accorded to the various practices; over 40% of respondents consider Open Data and Open Content as important; ca. 25% say so with regard to Collaborative Content Creation.
Diffusion of Various Practices

▶ Over the next 5 years we will see leaps in digitization activities and in freely licensed content. – Are we ready?
▶ 70% of institutions think that opening up content helps them better fulfill their core mission.
▶ In general, issues related to copyright clearance may be an excuse, but not a show-stopper regarding the opening up of content; across all object types, institutions may release at least 50% of their holdings as open content.
▶ When it comes to promoting the opening up of content, the present mindset of GLAMs poses two major challenges: their aversion against the prospect of commercial use of open content, and their reluctance to let third parties modify the content.
Prerequisites for Open Content

▶ The greatest challenges regarding open content are the time effort and expense related to the digitization and the documentation of content. Other important challenges comprise the time effort and expense related to rights clearance, lack of staff skills as well as technical challenges.
▶ The greatest risks associated with open content are re-use of content without proper attribution or mis-use / mis-interpretation of the content. Another important risk are copyright infringements.
▶ Roughly one third of the institutions is worried about issues related to rights clearance and tracking the use of the content.
▶ When it comes to opening up content, loss of revenues, or diminished brand value are only minor preoccupations.
Challenges / Risks related to Open Content

▶ Ca. 24% of GLAMs consider Collaborative Content Creation as important and believe that the opportunities prevail over the risks
▶ Ca. 14% of GLAMs are already involved in Wikipedia.
▶ Wikimedia Commons and Wikidata still seem to play a minor role for GLAMs (with 4% and 2% of institutions involved).
Involvement in Wikipedia
Outlook

▶ Data collection in further countries – Your support is appreciated… http://survey.openglam.ch
▶ Context analysis (searching for explanations for country differences)
▶ More detailed analyses – Feel free to join!▶ Publication of country reports▶ Publication of an international report in the first
half of 2016▶ Explore further uses of the GLAM inventory as a
by-product of the survey
What’s next?

▶ Discussion…
What else would you like to know?

▶ Contact Details:• Beat Estermann
E-mail: [email protected]: +41 31 848 34 38
▶ Project Portal:• http://survey.openglam.ch
Thank you for your attention!