estimates of meteoroid kinetic energies from observations of infrasonic...
TRANSCRIPT

ARTICLE IN PRESS
1364-6826/$ - se
doi:10.1016/j.ja
�CorrespondE-mail addr
Journal of Atmospheric and Solar-Terrestrial Physics 68 (2006) 1136–1160
www.elsevier.com/locate/jastp
Estimates of meteoroid kinetic energies from observations ofinfrasonic airwaves
Wayne N. Edwardsa,�, Peter G. Brownb, Douglas O. ReVellec
aDepartment of Earth Sciences, University of Western Ontario, 1151 Richmond St., London, Ont., Canada N6A 5B7bCanada Research Chair in Meteor Science, Department of Physics and Astronomy, University of Western Ontario,
1151 Richmond St., London, Ont., Canada N6A 3K7cAtmospheric, Climate and Environmental Dynamics, Meteorological Modeling Team, P.O. Box 1663, MS D401,
Los Alamos National Laboratory, Los Alamos, NM 87545, USA
Received 1 November 2005; received in revised form 22 February 2006; accepted 25 February 2006
Available online 18 April 2006
Abstract
Signal properties of the acoustic waves produced from meteoroids impacting the Earth’s atmosphere in the approximate
size range of 0.1–10m diameter have been analyzed at infrasonic frequencies. From these data, we have produced a series
of empirical relations between the far-field acoustic signature of the bolide shocks and meteor source energies by
correlating infrasonic observations of those fireballs which are also detected by earth-observing satellites. Adopting a
similar approach as has been previously employed for man-made explosives, signal properties such as acoustic amplitude,
signal energy/power and signal-to-noise ratio, are shown, after high-altitude wind corrections, to be useful tools in
estimating the kinetic energy of a bolide. Comparison of bolide infrasound data to ground-based explosive tests show that
the acoustic amplitudes from airwaves generated by small bolide events (o7 kt TNT equivalent) attenuate more rapidly
than nuclear or chemical explosions. As well, acoustic amplitude values for bolides are systematically lower than acoustic
amplitudes measured for equivalent ground-based explosions. This is interpreted to be largely due to bolide acoustic
sources being at high altitudes in the atmosphere. We find from our analysis that these heights are on average located
between 20 and 30 km. Larger events (47 kt) mimic man-made explosions in terms of range dependence, but offset in
amplitude equivalent to �20 km source altitudes. This is consistent with instrumental observations of fireballs and the
expectation that larger meteoroids (greater than a few meters in diameter), should penetrate deeper into the atmosphere on
average. Applying these new relationships to historical events, we find that the August 3, 1963 bolide detected
infrasonically near the Prince Edward Islands off the coast of South Africa, previously estimated to have an energy of
1100 kt, may have had a much smaller energy of 266790 kt. This energy revision brings the infrasonically determined Near
Earth Object (NEO) influx rate into much better agreement with that determined more recently using satellite and
telescopic survey data.
r 2006 Elsevier Ltd. All rights reserved.
Keywords: Infrasound; Meteor; Fireball; Bolide; Kinetic energy; Acoustic waves
e front matter r 2006 Elsevier Ltd. All rights reserved.
stp.2006.02.010
ing author. Tel.: +1 519 8502385; fax: +1 519 6612033.
ess: [email protected] (W.N. Edwards).

ARTICLE IN PRESSW.N. Edwards et al. / Journal of Atmospheric and Solar-Terrestrial Physics 68 (2006) 1136–1160 1137
1. Introduction
Meteoroids encounter the Earth’s atmosphere atvelocities between 11 and 72 km/s. The kineticenergy carried by particles at these velocities is tensto hundreds of times the equivalent energy of anequal mass of high explosive. The sudden depositionof this energy during the disintegration anddeceleration of large meteoroids produces a specta-cular light show which may be visible for hundredsof kilometers. During this interaction with theEarth’s atmosphere, the light, sound and ionizationproduced can be used to infer the original mass,orbit and other physical/chemical properties of theparent meteoroid. For larger meteoroids, somematerial may survive to reach the Earth’s surfacein the form of meteorites, providing one of the fewopportunities by which samples of other regions ofthe solar system can be studied at the Earth.
Historically, visual/optical observations havebeen the staple for study of bright fireballs, witheyewitness accounts, photographic and video ob-servations being the primary mode of data collec-tion (Ceplecha et al., 1998). However, otherobservational techniques can also play an importantrole in defining the processes occurring during thebrief period of meteoroid—atmosphere interaction.One such technique is infrasonic recordings of theacoustic signals produced when the original shockwaves produced by the hypersonic passage of themeteoroid decay at large ranges from the fireballtrajectory. This mode has been used infrequently inthe past due to limited numbers of deployeddetectors, but it is seeing increased usage in fireballstudies as the International Monitoring System ofthe Comprehensive Nuclear Test Ban Treaty nearscompletion, a component of which is a global 60station infrasound network.
Infrasound, the part of the acoustic spectrumlying below the range of human hearing and abovethe atmospheric Brunt–Vaisala frequency wheregravity waves begin (approximately between therange of 20–0.001Hz), is of particular interest dueto the lack of significant attenuation at thesefrequencies in the Earth’s atmosphere (Beer, 1974),allowing these acoustic waves to be observed evenafter traveling thousands of kilometres. Tradition-ally, it was the long observational range ofinfrasound which led to its adoption as the methodof choice for monitoring of nuclear and largechemical explosions during the 1950s and 1960sbefore the advent of satellite detectors. Interest in
infrasound waned, however, after the signing of theTri-Lateral Limited Test Ban Treaty which bannedatmospheric and undersea nuclear tests and forcingfurther tests to be held underground. This historyhas led to a legacy of terminology that is still in usein the infrasonic literature and observations. Themost obvious of these in the following sections willbe the use of the term ‘‘yield’’, meaning the totalenergy of the infrasonic wave source (in the presentstudy, the initial kinetic energy of the meteoroid),and the use of kilotons of equivalent TNT (1 ktTNT ¼ 4.185� 1012 J) as a measure of this energy.Since the late 1990s infrasound has seen a rebirth,again as a monitoring tool, but now for verificationand enforcement of the Comprehensive NuclearTest Ban Treaty (Christie et al., 2001); however thisglobal network of microbarometers is equallycapable of listening to the impacts of largemeteoroids on a global scale, a feature we exploitin the following study.
Large meteoroids, 0.1–10m in diameter, are anatural, impulsive source of infrasonic waves at theEarth’s surface, produced during the hypersonicpassage and fragmentation phases of meteoroid flight.The most famous example is the Great SiberianMeteor of 1908. Occurring over the Tunguska Riverin southern Siberia on June 30, 1908, the infrasonicwaves produced by the disintegration of the objectwere observed over most of Russia and EasternEurope (Whipple, 1930, 1934, Astapowitsch, 1933,1934). Meteors can produce infrasound by twomechanisms (1) the hypersonic shock of the meteor’spassage through the atmosphere and (2) fragmenta-tion of the meteoroid itself, which leads to efficientcoupling to the atmosphere and a sudden increase inthe fraction of total energy channeled into shockproduction. The degree to which either mechanismdominates infrasound production over the othervaries from event to event. Since the early work ofReVelle (1976) and more recently Brown et al.(2002a–c, 2004), enough additional bolide infrasonicsignals have been well observed by this network tobegin to look at bolide infrasound in a statistical way.The goals of the present study are to use a largedatabase of bolide infrasound observations with thefollowing specific aims:
1.
Examine infrasonic signal properties statisticallyas a function of range, atmospheric winds andbolide yield (as derived by satellite observations)to derive empirical relations between sourceenergy and these infrasound signal metrics.
ARTICLE IN PRESSW.N. Edwards et al. / Journal of Atmospheric and Solar-Terrestrial Physics 68 (2006) 1136–11601138
2.
Compare the source energies measured with theseempirical relations to previous (mainly theoreti-cal ) estimates of bolide energies3.
Apply these new relations to several majorhistorical bolide infrasound events.We begin by reviewing previous techniques usedto estimate bolide source energy from infrasoundobservations. Next we define the methods used toidentify fireball airwaves in infrasound data, thespecific signal processing and analysis methodologywe have employed and our expectations of the formof the empirical relations from theoretical consid-erations. Finally, we compare our relations to thosefound from high explosive and nuclear tests, applyour results to the Revelstoke, Kincardine and theAfrican Prince Edward Islands fireballs to makenew estimates for their yields and compare ourenergy estimates to those from other techniques.
2. Previous methods of energy determination using
infrasound
Prior to the work presented here, kinetic energyestimates for bolides using infrasound have beenaccomplished through both theoretical methods andpreviously determined empirical calibration curvesoriginally produced from man-made ground-levelatmospheric explosions. The first theoretical treat-ment of the production, propagation and attenua-tion of meteor infrasound was presented by ReVelle(1974, 1976). Extensions of this early work have led
Dp ¼ðg� 1ÞESðR
0 � cStÞ exp �ðz=2HÞ � ðcSt� R0Þ2=ða2 sin2 yþ L2 cos2 yÞ� �
2p3=2R0ða2 sin2 yþ L2 cos2 yÞ3=2, (4)
to several methods of energy estimation using weakshock propagation theory. Valid in the weak shockregime, using observed acoustic wave period andamplitude for line sources (Ceplecha et al., 1998)leads to
ES ¼ 11:5prmR03 Dpffiffiffiffiffiffiffiffiffi
pSpgp
!4c3SV
, (1)
where the variables are defined below. Equivalently,the wave period method for line sources, wherelinear propagation is assumed at great range afteran initial weak shock phase (Ceplecha et al., 1998)
produces
ES ¼p12
rmt
1:579
� �4 c7SV
R0�1, (2)
while the acoustic efficiency method for ductedpoint and line sources (ReVelle and Whitaker, 1995)produces
ES ¼2pR2Eaw
eac
1� f R
1þ f R
� �f �nR ,
where
n ¼ R=Rmax, (3)
where ES is the bolide source energy (J), Eaw theobserved acoustic wave energy per unit area at theobservation point (J/m2); rm the density of themeteor (kg/m3); Dp the observed signal overpressure(Pa); pg the ambient pressure at the ground (Pa); pSthe ambient pressure at the source altitude (Pa); cSthe average acoustic sound speed (m/s); V themeteor velocity (m/s); t the observed period ofsignal at maximum amplitude (s); eac the acousticefficiency; fR the ground reflection factor of Cox(1958); R0 the slant range between source andreceiver (m); R the ground projected range tosource (m); Rmax the ducted wave skip distance,counterwind (200 km), downwind (400 km) (m).
A similar detailed analytical treatment of meteorinfrasound was also attempted by Golitsyn et al.(1977) and recently applied to infrasonic observa-tions of the Vitim bolide by Shumilov et al. (2003).Here the overpressure of the wave was found tovary as
where the remaining undefined quantities are asfollows: g is the ratio of specific heat at constantpressure and constant volume (diatomic gasg ¼ 1.4), t the time (s), z the observation altitude(m), H the scale height of the atmosphere (m), a thesource’s characteristic dimension (i.e. width) (m), L
the length of the meteor trail (m), y the observationangle as measured from the trajectory plane(radians).
Despite its complexity and the enormous effortwhich has gone into its development, in practice wefind the Golitsyn et al. (1977) expression workspoorly as a source energy estimator for the events

ARTICLE IN PRESS
Fig. 1. Comparison of Infrasound–Source Energy calibrations
for nuclear explosions as determined by the United States Air
Force Technical Applications Centre (AFTAC) (Clauter and
Blandford, 1998) and from French nuclear tests (Blanc et al.,
1997).
W.N. Edwards et al. / Journal of Atmospheric and Solar-Terrestrial Physics 68 (2006) 1136–1160 1139
we have examined as the wave periods it predicts aregenerally far larger than observations show.
Unfortunately a common issue with all thesetheoretical methods is that they contain variableswhich are often unknown for a specific event, suchas the meteoroid density, velocity, source altitude,trail length and acoustic efficiency. In practice, thesevalues are usually given observed averages or simplyassume average values. These theoretical ap-proaches are only really effective when a bolidehas a well-observed trajectory and velocity and hasrecovered meteorites, a situation rarely achieved.
As an alternative method to these theoreticaltreatments, bolide infrasound observations havebeen combined with empirical calibration curvesof range–yield–amplitude (or period) derived fromman-made nuclear and chemical explosives basedon many observations. It has not been clear howrobust these empirical fits would be to bolides;however, the impulsive nature of the two types ofsources should provide at the very least order ofmagnitude correct energy estimates for bolides.
The most commonly used of all empirical energyestimators have been those produced by the US AirForce Technical Applications Centre (AFTAC). Thefirst of these relates the observed period of the signalduring maximum amplitude to the source energy:
logðES=2Þ ¼ 3:34 logðPÞ � 2:58; ES=2p100 kt;
(5a)
logðES=2Þ ¼ 4:14 logðPÞ � 3:61; ES=2X40 kt;
(5b)
where P is the period at maximum amplitude for thesignal in seconds and the source yield, ES, is themeasured in kt of TNT (Ceplecha et al., 1998). Ithas been argued this relationship between periodand energy is a fundamental property of point andline source explosions (ReVelle, 1976), however, aswill be seen (Section 7) this argument is not withoutits problems. Note the factor of 1/2 in the energyestimates results from the original expressions beingderived for nuclear explosions, where approximately50% of the initial energy is carried away byradiation (Glasstone and Dolan, 1977) and thusnot available for shock production.
The second empirical energy estimator, againproduced by AFTAC, relates observed infrasonicpeak amplitudes (in Pa), P, from nuclear weaponstests, to source energy (Clauter and Blandford, 1998):
log ES ¼ 2 log Pþ 2:94 log D� 1:84, (6)
where D is the range from source to receiver indegrees. Similar relationships have been found byothers and been used to estimate bolide kineticenergies. For example, based on French nuclearweapons test observations a similar curve to that ofthe AFTAC amplitude curve was found (Blancet al., 1997):
log ES ¼ 2 log Pþ 3:52 log R� 10:62. (7)
Noting that despite both these calibrations usingmany observations of nuclear explosives withknown source energies at known distances, thevariation within the observations can be significant,as seen when comparing the two calibrations side byside (Fig. 1).
Using more conventional chemical explosives,ammonium nitrate fuel oil (ANFO), Davidson andWhitaker (1992) found that for the Miser’s GoldTest the infrasonic observations best fit a curve ofthe form:
log ES ¼ 1:55 log Pc þ 2 log R� 8:45. (8)
While some time later using a data set containinga wider variety of ANFO yields as observed by theLos Alamos National Labs’ infrasound network,Whitaker (1995) found that more generally
log ES ¼ 1:47 log Pc þ 2 log R� 4:96, (9)

ARTICLE IN PRESSW.N. Edwards et al. / Journal of Atmospheric and Solar-Terrestrial Physics 68 (2006) 1136–11601140
where Pc is wind corrected amplitude (Davidsonand Whitaker, 1992) (discussed later in Section 6).All pressure amplitudes for these calibrations (Eqs.(6)–(9)) are measured in Pascals, ground range, R, inkilometres and source energy, ES, in kilotons ofTNT equivalent explosive energy. We will comparethese earlier relations to our final empirical yieldestimations to establish the range of expected yieldsfor given amplitude–range combinations.
3. Fireball acoustic signal identification and details of
the data set
The combination of space-based sensors, oper-ated by the US Department of Defense (DoD) andDepartment of Energy (DoE), recordings’ of fire-balls and the growth of the global infrasoundnetwork portion of the International MonitoringSystem (IMS) (operated by the ComprehensiveNuclear Test Ban Treaty Organization (CTBTO)since the late 1990s) have proven to be excellentcomplementary tools for globally identifying bolideinfrasonic airwaves. Space-based optical and infra-red observations of bolide explosions in the atmo-sphere not only provide both a tool for identifyingthe location and time of the source, but also anindependent estimate of the explosive yield of theevent using the relation between optical energy andthe total energy of the event (Tagliaferri et al., 1994;Brown et al., 2002a). The source yields, determinedfrom optical sensors, are somewhat uncertain; theenergies derived assume the bolides radiate as6000K blackbodies, an approximation at best.However, the values measured using this assump-tion have proven remarkably close to energy
Table 1
Initial velocity, initial mass and total energy estimates for six recent wel
satellite yield estimates for events where satellite observations are avail
Meteorite fall name Initial velocity
(km/s)
Initial mass
(kg)
B
es
Villalbeto de la Pena 1771 7507150 0.
Park Forest 19.570.3 1100073000a 0
Neuschwanstein 20.9570.04 5007200 0.
Moravka 22.570.3 15007500 0.
Tagish Lake 15.870.5 7030078300 2
St. Robert 13.070.3 17507250 0.
All satellite-measured energies are determined via Eqs. (10) and (11) u
Note: Satellite energies derived assuming a 6000K blackbody.aAverage/std. error of all stated initial mass estimates.
estimates found independently from other techni-ques and ground-truthed events where meteoriteshave been recovered (and for which initial massesare known with greater precision than is typicallythe case). Table 1 compares several specific caseswhere satellite optical yields have been measuredand energies from techniques other than infrasoundand/or meteorites are available. Although theagreement with yield in these cases is quite good(all agree within error), we caution that events withunusual composition/porosity, such as might beexpected from cometary sources or from ironmeteoroids, would be expected to have atypicalradiation efficiencies (ReVelle, 2005). Nevertheless,the level of agreement between satellite data and thefour ground-truthed events (all chondritic ‘‘normal’’fireballs) suggests that for most cases the accuracyof the satellite energy estimations should be betterthan 20–30%.
Once satellite geographic locations for a bolideare obtained, it becomes a straight forward taskto determine the estimated arrival time window forany infrasonic waves associated with the event,assuming average signal propagation velocities from0.285 to 0.310 km/s stratospheric arrivals) and0.260–0.220 km/s (thermospheric arrivals) (cf. Ce-plecha et al. (1998) for a complete description ofexpected infrasonic arrival modes). Here the aver-age propagation velocity of an infrasonic wave isdefined as the great circle distance separating sourceand receiver divided by the total time required forthe wave to travel this distance. In addition, thedirection from which a signal may be expected toarrive is also determined. Signals arriving at amicrobarometer array within the estimated arrival
l-observed fireballs which produced meteorites and comparison to
able
olide energy best
timate (kt)
Satellite observed
energy (kt)
Reference
02670.006 — Llorca et al. (2005)
.5070.14 0.4170.11 Brown et al. (2004)
02670.011 — Spurny et al. (2003),
ReVelle et al. (2004)
09170.030 0.08970.034 Borovicka et al.
(2003)
.1070.28 2.5370.27 Brown et al. (2002c)
03570.005 0.05070.022 Brown et al. (1996)
sing the original published optical energy observations.

ARTICLE IN PRESSW.N. Edwards et al. / Journal of Atmospheric and Solar-Terrestrial Physics 68 (2006) 1136–1160 1141
window and with back azimuths at or near theexpected direction, can, with a high degree ofcertainty, be associated with the observed satelliteobservation. The signal processing methods andgeneral techniques for infrasound array angle ofarrival measurements are described in Evers andHaak (2003) and Brown et al. (2002b).
All of the bolide events used in the followingstudy were observed both by optical and infraredspace-based sensors operated by the DoD and DoEand have a minimum of one infrasonic, or micro-barograph array detection. The data set currentlyincludes 31 separate bolide events, with 64 indivi-dual observations by various infrasound arrayslocated worldwide. The bolide locations also rangeworldwide with events located over the Pacific andIndian oceans and every continent including Ant-arctica and the European sub-continent. In general,most infrasonic observations in the data set (�80%)are concentrated between the ranges of1500–5500 km, although outliers include observa-tions at closer ranges of �300 km and extremelydistant observations at ranges greater then 9000 km(Fig. 2). All infrasonic observations with ranges lessthan 250 km, roughly corresponding to the mini-mum range required to observe a stratosphericallyducted wave, were removed from the data set.Additionally all observations with average propaga-tion velocities less then 0.260 km/s were removed (asthese may have been thermospheric returns), alongwith a single anomalous observation (Fig. 3a,b),hence the final data set is composed exclusively of
Fig. 2. Histogram and cumulative frequency plot of the
observational ranges for the entire bolide infrasound database.
the most commonly observed infrasonic waves;stratospherically ducted arrivals. Statistics of theaverage wave propagation speed confirm this withan average signal velocity for all observations of0.30270.017 km/s, which is expected to be almostsolely composed of stratospherically ducted signals(Ceplecha et al., 1998). The observed scatteramongst the stratospheric propagation velocities(Fig. 3a/b) is in part due the anisotropic effects due
Fig. 3. Average signal velocity cutoff distinguishing between
observed thermospheric and stratospheric ducted acoustic waves
for (a) small bolides (o7 kt) and (b) large bolides (47 kt). Note:
The circled small bolide observation was also removed due to an
unexplained and unusual 1801 rotation of the observed back
azimuth relative to the expected azimuth.

ARTICLE IN PRESSW.N. Edwards et al. / Journal of Atmospheric and Solar-Terrestrial Physics 68 (2006) 1136–11601142
to the presence of high-altitude winds; increasingvelocity downwind, decreasing upwind. Correctionof measurements for wind effects and the signifi-cance of the UKMO-SCI index, a measure of thestrength and direction of these winds, are discussedin detail later in Section 6. Although portions ofsome signals may include some thermosphericcomponents, these contributions are thought toprovide minimal contamination, due to the largedispersion and absorption of a wave propagatingover the range of heights of a thermospheric path.
Lastly, the bolide events that meet the qualifica-tions outlined above are then separated into twogroups, ‘‘large’’ events are defined here as thosewhose estimated source energies are greater than7 kt and ‘‘small’’ events, with source energies below7 kt. This step, suggested previously by Edwardset al. (2005), is an attempt to test the hypothesis thatlarger, more energetic bolides should penetratedeeper into the atmosphere and thus depositacoustic energy lower in the atmosphere thansmaller bolides. The separation of these two groupshas been made possible by recent detections of veryenergetic bolides by several IMS infrasound arrays(Klekociuk et al., 2005). The choice of using theseemingly arbitrary 7 kt as the cutoff for these twogroups comes from a natural gap in our bolideinfrasound database near this energy. Currentlythere are no events with satellite estimated sourceenergies between 5 and 7 kt.
4. Data processing methodology
To ensure that no systematic biases were intro-duced in the processing of detected airwave signals,a homogenous process was developed and auto-matically applied to all raw bolide airwave signals.
After an infrasonic signal from a bolide wasidentified, a series of pre-processing steps weretaken before signal measurements were made. Thesesteps remained unchanged for most of the detectedsignals, save for those few events which warrantedan increase to the bandpass width due to largeestimated yields (as deduced from satellite observa-tions and the raw waveforms) or the presence ofsignal energy at higher frequencies seen in spectro-grams of the raw waveforms due to the relativeproximity of the infrasound station to the sourcebolide. Typically, bandpass adjustments for verylarge events required a slight lowering to the lowercutoff frequency, while those stations closer to thesource required an increase to the upper cutoff
frequency to include energies in the signal at higherfrequencies ensuring that all the signal energy wascovered in the chosen bandpass. Numerical testsinvolving variations in the bandpasses for mostevents outside the nominal range produced negli-gible differences in the final results (except for thecases just mentioned).
Once preprocessing was completed, various measure-ments of the properties of each signal were made. Theprecise steps in this reduction methodology are outlinedin detail to allow other researchers to reconstruct ourresults from the raw digital data and to allowcomparison with future airwave bolide measurements.These data were processed using the analysis packageMatSeis 1.7 (Harris and Young, 1997, Young et al.,2002) (available from http://www.nemre.nnsa.doe.gov/cgi-bin/prod/nemre/matseis.cgi).
Step 0: Instrument response correction for large
events
The initial step of correcting for the response ofthe instrument (typically composed of a microba-rometer and digitizer) is particularly important forvery energetic events where significant componentsof the signal spectrum may be at very lowfrequencies. Currently, the two most commonlyused microbarometers (MB2000 & Chaparral 5)have responses which begin to roll off in sensitivityat �0.05Hz. This loss of sensitivity is approximately�5 dB between 0.05 and 0.01Hz for the Chaparral 5sensor and �3 dB for the MB2000 sensor in thesame frequency range. Correcting for this sensitivityloss ensures that the bolide signal content is ascomplete as possible for each event. Thus, in ourstudy, before any measurement is made, eachinfrasound channel has the instrument responseabove 0.01Hz (provided by the CTBTO for eachstation) applied to the signal. This provides a bestestimate of the original atmospheric waveformindependent of the instrument.
Step 1: Onset and duration of the signal
This step is an extension of the identificationmethod already discussed. The signal onset (orarrival time) was determined by the start of aconstant azimuth, (defined as settling to within aconsistent value within 101 over 5 windows), fromthe generally random azimuths of typical back-ground noise. For extremely short ranges (less thena few 100 km) this azimuth will often vary greatly(depending on orientation) as a bolide moves acrossthe sky. Such close range observations are removedfrom the data set through the requirement that thesignal be truly stratospherically ducted and hence at
ARTICLE IN PRESSW.N. Edwards et al. / Journal of Atmospheric and Solar-Terrestrial Physics 68 (2006) 1136–1160 1143
least one ‘‘skip’’ distance separate source andreceiver. For the remaining signals typically occur-ring at ranges of many 100s–1000s of kilometresdistance, often very little variation in back azimuth isseen as the moving-source better approximates apoint-source. Similarly, the end of the signal (andthus its duration) was determined by the return of thecomputed azimuths from an approximately constantvalue to that of the random noise. In cases where thisazimuth change may be ambiguous, the element pair-wise cross correlation maximum and/or the FisherF-statistic (Melton and Bailey 1957) were used asguides to the onset and duration of the signal.
Step 2: Average signal azimuth and trace velocity
Signal averages for back-azimuth and tracevelocity were calculated for each signal over theentire duration of the signal as defined in step 1,using the computed azimuths and velocities fromthe cross correlation procedure. These two valueswere then taken to define a single velocity vector forthe entire incoming wave, which we assume is aplane wave, over the size-scale of the infrasoundarray. An example of this process is shown in Fig. 4.
Step 3: Waveform stacking
Using the average back-azimuth and trace velo-city, delay times to the onset of the signal werecalculated for each element in the particular array,relative to the prime array element or the averageelement position. These delay times were then usedto shift and phase align each element’s observedwaveform, again assuming the signal propagatedacross the array as a plane wave. After phasealignment, the array elements were then stacked toproduce an ‘‘optimum’’ waveform, (often referredto as the best beam), with the result that incoherentnoise should be reduced by a theoretical factor of1=
ffiffiffiffiffiNp
, where N is the number of array elementsstacked.
Step 4: Maximum signal envelope amplitude
To pick the maximum amplitude of the signalenvelope, the stacked, raw waveform is firstbandpass filtered using a second-order Butterworthfilter with corner frequencies of 0.2 and 3.0Hz,except in circumstances mentioned previously. Oncefiltered, the waveform’s amplitude envelope is thencomputed using the Hilbert Transform (Dziewonskiand Hales, 1972). The peak of the envelope is takenas the maximum amplitude of the signal.
Step 5: Peak-to-peak amplitude and the period at
maximum amplitude
The more common method of amplitude mea-surement, used when dealing with atmospheric
explosions (e.g. nuclear free air bursts), is themaximum peak to trough distance of the waveform.This was measured within the time pick of thepreviously found envelope maximum. Additionally,the times of four zero-crossings about the peakamplitudes were taken and used to compute theperiod of the signal during the signal maximum.This method of period determination was used inorder to maintain consistency with the methodologyemployed to construct the empirical period–energyrelationships (Eqs. (5a) and (5b)) by AFTAC. Thisrelation has been found to provide a reliable methodto determine explosive yields for larger (i.e. nuclear)explosions (ReVelle, 1997).
Step 6: Total integrated signal energy/power and
background noise levels
Estimates of the observed signal’s total energy (orpower) content were determined by squaring andthen summing each sample of the filtered, optimumwaveform (best beam) over the entire duration of thesignal. A similar procedure was also performed forthe stacked and filtered measurements, of equalduration, taken prior to the onset of the signal andafter the signal had ended. Here the assumption ismade that the ambient noise levels have remainedconstant throughout the duration of the signal. Thismay not be an entirely valid assumption for longduration signals at all observation sites. These valueswere then averaged to evaluate the energy associatedwith the ambient background noise. This back-ground noise energy was then subtracted from theraw signal energy to obtain an estimate of the totalamount of energy due solely to the bolide airwave atthe observation site (Brown et al., 2002b).
Step 7: Integrated energy signal-to-noise ratio
Finally, in an attempt to account for the varyingbackground noise levels at each array site, whichmay contaminate simple amplitude measurements,an estimate of the signal-to-noise ratio for theduration of each observed signal is made. This isachieved using the raw integrated signal energy/power and the average background energy/power,values found in Step 6.
5. Bolide yields and scaling laws
Bolide yield, or equivalently the initial kineticenergy of a bolide, is calculated for each event usingthe total radiated optical energy observed by satelliteand the radiation efficiency of Brown et al. (2002a):
tI ¼ 0:1212E0:115Opt , (10)

ARTICLE IN PRESS
Fig. 4. Example of signal duration and average azimuth/trace velocity procedure using the observed signal at I10CA for the Park Forest
fireball on March 27, 2003 and the Infra Tool analysis package of MatSeis (Young et al., 2002). Windows (top to bottom) show:
correlation, trace velocity, back azimuth and the filtered waveform (in Pascals) of array element H1 (0.3–3.0Hz). Shaded region is the
approximately constant azimuth/trace velocity which marks the onset of the observed bolide signal as well as its duration. Azimuth and
trace velocity values within this region are averaged; in this case 152.11 and 0.335 km/s, respectively.
W.N. Edwards et al. / Journal of Atmospheric and Solar-Terrestrial Physics 68 (2006) 1136–11601144
where tI is the radiation efficiency and EOpt is theobserved radiation energy in the space-based sensorsilicon-bandpass (cf. Tagliaferri et al., 1994) in
kilotons of TNT equivalent (1 kt ¼ 4.185� 1012 J).Note that this relationship is quasi-independent as itused the AFTAC period relationship (Eqs. (5a) and

ARTICLE IN PRESSW.N. Edwards et al. / Journal of Atmospheric and Solar-Terrestrial Physics 68 (2006) 1136–1160 1145
(5b)) in part as one method of energy determination.Although it will be shown that the AFTAC period–energy relation is more uncertain for energy estimatesof small events (less then �0.2 kt) and very largeevents (410kt), it appears to be a robust energyindicator for modest energy bolides of order �1 kt.Fortunately, at smaller energies the radiation effi-ciency calibration is well supplemented with higherprecision events which were given more weight, thuswe believe Eq. (10) should remain a robust means ofenergy measurement. Once the radiation efficiency isknown, the total bolide yield may be calculateddirectly from the satellite observed energy by theratio:
ES ¼ EOpt=tI , (11)
where ES is bolide yield in kilotons of TNTequivalent. The radiation yield assumes spectralemission equivalent to a 6000K blackbody (cf.Tagliaferri et al., 1994; Brown et al., 2004). Notethat this empirical relation is very similar to thatexpected on theoretical grounds for H-chondrite-type meteoroids.
Once the bolide yield is known, comparisonsbetween multi-station infrasonic observations of asingle event may be made. However, to comparebetween multiple events, the laws governing howinfrasonic wave amplitude increases with sourceenergy must be known. Here we make the assump-tion that the signals detected originated from apoint source. This approximation is valid in the casewhere a terminal detonation is a major feature ofthe ablation profile and/or when the observationrange is large compared to the length of the bolide’strail. Since our source–receiver range is always4250 km (and typically 41000 km) and fireballpath lengths rarely exceed 200 km, this approxima-tion is almost always satisfactory. From thisassumption, we next adopt the scaling laws dis-covered during the early work with nuclear free airexplosions during the 1950s and 1960s where it wasobserved that range and yield were related by theratio:
R
R0¼
ES
E0
� �1=3
, (12)
where R0 and E0 are the reference range and yield(Glasstone, 1964). This expression physically scaleseach energy to a reference yield (1 kt)—the largerthe yield the further away the receiver needs to be todetect an equivalent overpressure. A more completeversion of this scaling law, as is relates specifically to
the overpressure (amplitude) of an infrasonic wave,is given by ReVelle and Whitaker (1997)
Dp ¼ Cp0
p
� �ðq�3Þ=3R�qE
q=3S , (13)
where C is a constant, p0/p is the ratio of atmo-spheric pressures at the source and observationaltitudes and q ¼ 1 in the linear far-field acousticregime, 1.1 pqp2 in the intermediate field andq ¼ 3 in the near field. Without further informationfor each event concerning the equivalent height ofthe bolide at the time of its detonation height/rangeof primary energy deposition, we treat the first twoterms as constants (regaining Eq. (12)) and scale theknown range by the observed optical yield toproduce a scaled range which should ideally beindependent of a bolide’s energy:
RS ¼R
E1=3S
, (14)
where R is in kilometers and ES is in tons of TNTequivalent energy (note yield here is not expressed inkilotons as a majority of observed bolides haveenergies of only a fraction of a kiloton).
This proportionality between yield and range is aresult of the physical geometry of point sourceexplosions. Within the immediate region surround-ing the source, there exists a zone where the initialwave propagation is highly nonlinear (shockwaves).To describe the dimensions of this zone, consider apoint source located at an altitude with a pressure,p0. After detonation the source energy, ES, becomesdistributed over a sphere of radius, RB, where
RB ¼ES
ð4=3Þpp0
� �1=3
. (15)
This is often described as the blast radius of theexplosion. Within this zone, propagation of theoverpressure is as a highly nonlinear shock, whileoutside of this radius the overpressure continues topropagate but instead as a weakly nonlinear shock.Physically, this is the region where the energydensity in the explosion is greater than the ambientatmospheric thermal energy density. Eventually,after some distance, this weakly nonlinear wave willalso decay into a linearly propagating wave. Here itis observed that the blast radius, by virtue of a pointsource’s spherical symmetry, is proportional to thecube root of the source energy or yield. Sincequantities such as the initial overpressure and thefundamental period of the wave depend upon RB,

ARTICLE IN PRESSW.N. Edwards et al. / Journal of Atmospheric and Solar-Terrestrial Physics 68 (2006) 1136–11601146
the scaling factor of yield to the 1/3 power will tendto appear in the observations of point source-likeexplosions.
For bolides, the majority of the meteoroidsacoustic energy is radiated over a short section nearthe end of the luminous trajectory where atmosphericpenetration is deepest (cf. ReVelle, 2005). Viewedfrom large distances, (as is the case for most of theinfrasonically observed bolides), this short sectionapproximates a point source. However, it is notedthat both the point source and cylindrical line sourceapproximations make the additional assumption thatthe blast radius is small when compared to the scaleheight of the atmosphere (�7km). When the blastradii begin to exceed this limit the sphericalsymmetry of the point source is lost and theaforementioned relationship begins to break downas internal gravity waves begin to dominate theatmosphere’s response to the deposition of the sourceenergy. For all bolides in our sample this assumptiondoes not pose a problem as gravity waves are not thedominant type of observed wave, the bolide energiesbeing well below the range where gravity waveswould become important (cf. ReVelle, 1976).
6. Results: infrasound observations of bolides
Upon plotting the four measured signal propertiesfor each fireball airwave, namely maximum signalenvelope amplitude, peak-to-peak amplitude, totalintegrated signal energy/power and integrated signal-to-noise ratio as a function of scaled range, twonotable features of the data were immediatelyobvious; the first was that all four measures, for bothlarge and small events appear to be related to scaledrange in a power-law-type distribution. The apparentlinearity in log–log space appears to confirm the initialtheoretical assumption of using an ES
1/3 scaling law,although given the scatter of these data a similarobservation is made using ES
1/2 scaling. In accordancewith a power law distribution, a regression equationfor all measurements is chosen to be of the form:
A ¼ 10aRbS, (16)
where A is the amplitude of the measurement, RS, isscaled range, and a and b are the constants to be fit.
Comparing this regression equation to Eq. (13)with q ¼ 1:
Dp ¼ Cp0
p
� ��2=3R
E1=3S
!�1(17)
and a rearranged version of the line source weakshock propagation model (Ceplecha et al., 1998,Eq. (1)):
Dp ¼V ðpzpgÞ
1=2
11:5prmc3S
!1=4R
E1=3S
!�3=4, (18)
it is seen that all three Eqs. (16)–(18) show a similarpower law dependence; the amplitude is equal to aneffectively constant term which decays by someexponent of scaled range. Thus a power law fit tothe observations is justifiable on both observationaland theoretical bases.
The second observation, seen in the raw observa-tions, is that these data show significant scatter,particularly for small events o7 kt. This is reflectedin their fitted R2 values which range between 0.262and 0.352 for small events and 0.339 and 0.741 forlarge events. Here R2 (calculated in log–log space) isthe commonly used estimator of the variance in thedata and the quality of a linear regression and isdefined as
R2 ¼
Pðxi � xÞðyi � yÞ
Nsxsy
� �2
, (19)
where xi, x and sx are the values, mean andstandard deviation of the scaled range observations,respectively (similar for the amplitudes, y) and isequivalent to the square of the data correlation. If ausable relation to deduce bolide source energy(yield) from infrasonic observations is to be found,the observational scatter must be reduced. Note thatwe use R2 as a first-order goodness of fit and areignoring the uncertainty in both x and y variables.
Reducing the scatter in scaled range requiresprimarily a reduction in error in satellite deducedyield (since the error in physical range is negligibleby comparison), which itself requires reductionof scatter in the luminous efficiency calibration(Eq. (10)). This may only be fulfilled by increasingthe number of observed bolides with well-deter-mined energies. As time is the primary factorrequired to achieve this goal, scatter in scaled rangemay be viewed as currently irreducible, until enoughnew, highly calibrated fireball-meteorite eventsobserved by satellite can be obtained. However,scatter along the amplitude axes may be reducedmore easily through an estimate of the directionaleffects of atmospheric winds. We expect theamplitude scatter in the raw observations reflectvariations in (a) the wind conditions along each ofthe different source—receiver paths, (b) variations
ARTICLE IN PRESSW.N. Edwards et al. / Journal of Atmospheric and Solar-Terrestrial Physics 68 (2006) 1136–1160 1147
in the height of primary energy deposition for eachevent as well as (c) differences in nonlinear losses foreach event. Only the first of these mechanisms canbe taken into account meaningfully for each event;the other two need to be estimated statistically orfrom numerical modeling.
At upper stratospheric altitudes of approximately30–60 km, the Earth’s wind profile reaches a localpeak, with winds reaching speeds up to 100m/s.These winds occur from generally easterly directionsduring the summer months and reverse to morewesterly winds during winter months in the North-ern hemisphere and in the opposite sense in theSouthern hemisphere (Webb, 1966). These highwinds are appreciable when compared with the localambient sound speeds (�300m/s) and produce adirectional anisotropy in the acoustic velocity fieldthat tends to focus acoustic wave energy whenpropagation is along downwind directions, while atthe same time inhibiting propagation upwind. Theobservational result of this effect is that acousticsignals propagating along downwind directionsshow systematically larger amplitudes and areobserved at more distant ranges than are thosemoving in upwind directions. Observations of thiseffect are documented mainly for man-made ex-plosive sources (e.g. Davidson and Whitaker, 1992),but are expected to be just as common for naturalsources, such as bolides.
To correct for this amplitude altering effect weintroduce a similar correction method introduced byMutschlecner and Whitaker (1990), used previouslyby Davidson and Whitaker (1992) for the Miser’sGold high explosive test and by Stevens et al. (2002)for analysis of nuclear tests undertaken by theformer Soviet Union. The method uses a windcorrection of the form:
AW ¼ 10kvhA, (20)
where A is the measured quantity to be corrected, vhis the horizontal component of the wind vectordirected toward the receiver in metres/second and k
is an empirical constant in seconds per meter. In aslight modification to the scheme of Mutschlecnerand Whitaker, who used the wind component of theStratospheric Circulation Index (Webb, 1966), wehave used an average of the mean wind componentdirected toward the observation between 40 and60 km altitude as measured by the Upper Atmo-sphere Research Satellite (UARS) and assimilatedinto daily global wind maps by the United KingdomMeteorological Office (UKMO) (Swinbank and
O’Neill, 1994). By using UKMO wind data asopposed to strictly modeled numbers, such as theNaval Labs Horizontal Wind Model (Hedin et al.,1996) used previously by Edwards et al. (2005), webelieve the best possible estimate for the actualwinds present at the time of an event are being used,as opposed to using average global winds.
Using the assimilated UKMO data at steps of125 km in range (half the minimum allowed range inour study) along the great circle path connectingsource and receiver, the wind components along thesource to receiver direction are computed at andbetween standard pressure intervals given by
pi ¼ 1000� 10�i=6, (21)
where i ¼ 1,2,3 y n and pi is in units of hPa ormbars. Wind components at levels corresponding tobetween 40 and 60 km altitude (�2.5 and 0.3 hPa)are then averaged. These mean wind componentsare then further averaged again along the entiregreat circle path. This process is repeated for eachevent, providing an average wind value along thepropagation path length for each observation.Using this method, local seasonal and globalvariations in stratospheric winds are all includedin the final horizontal wind correction component,vh.
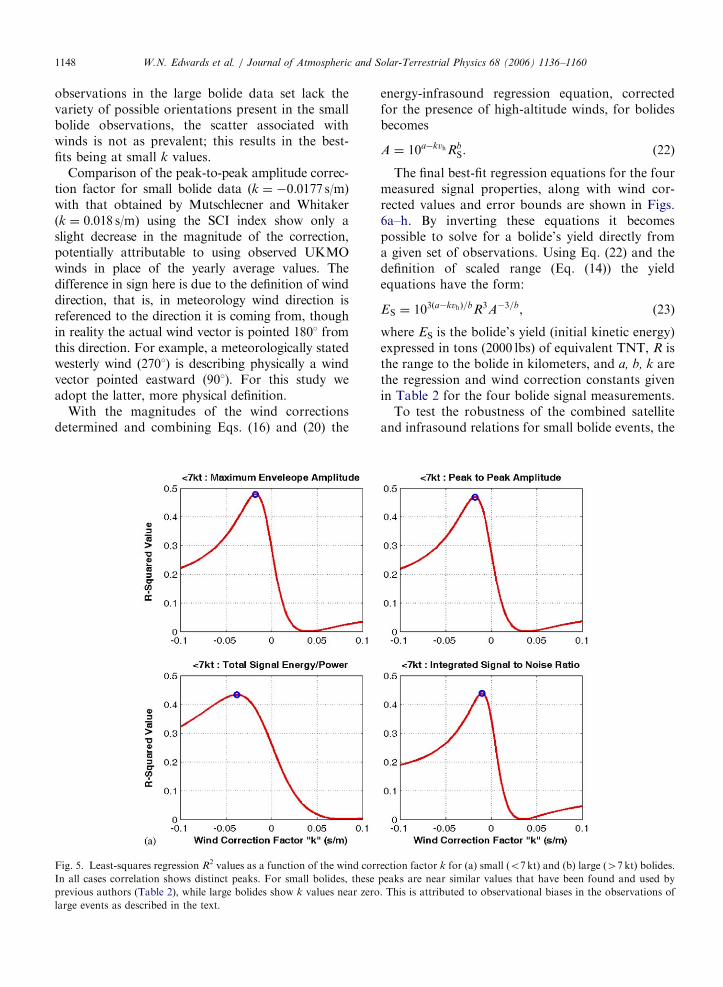
The magnitude of the wind correction, deter-mined by the value k, was found by iteration over awide range of potential values from �0.1 to +0.1.For each trial value of k, all observations werescaled by Eq. (20) and a least-squares solutionfound; next the R2 value of the new regression wascomputed and compared until a peak in the R2
value was identified (Fig. 5a/b). The value of k atthis peak, as well as the parameters of the least-squares regression were then taken to be the bolideinfrasound calibration curves. The correction forstratospheric winds improves scatter along theregressed fit significantly for the small event dataset, increasing R2 values from 24% (signal-to-noiseratio) to 68% (peak-to-peak amplitude), while forthe large bolide event data set very little improve-ment was seen (0.1–1%). This apparent insensitivityto the effects of winds for the large bolide data islikely the result of a particular bias in the observa-tions for these events. For most of the (smallnumber) of large bolide observations, average windvalues are small to moderate as a result of either theweather conditions at the time of the event or nearlymeridonal propagation paths, cutting across theprimarily zonal stratospheric wind flow. Since
ARTICLE IN PRESSW.N. Edwards et al. / Journal of Atmospheric and Solar-Terrestrial Physics 68 (2006) 1136–11601148
observations in the large bolide data set lack thevariety of possible orientations present in the smallbolide observations, the scatter associated withwinds is not as prevalent; this results in the best-fits being at small k values.
Comparison of the peak-to-peak amplitude correc-tion factor for small bolide data (k ¼ �0.0177 s/m)with that obtained by Mutschlecner and Whitaker(k ¼ 0.018 s/m) using the SCI index show only aslight decrease in the magnitude of the correction,potentially attributable to using observed UKMOwinds in place of the yearly average values. Thedifference in sign here is due to the definition of winddirection, that is, in meteorology wind direction isreferenced to the direction it is coming from, thoughin reality the actual wind vector is pointed 1801 fromthis direction. For example, a meteorologically statedwesterly wind (2701) is describing physically a windvector pointed eastward (901). For this study weadopt the latter, more physical definition.
With the magnitudes of the wind correctionsdetermined and combining Eqs. (16) and (20) the
Fig. 5. Least-squares regression R2 values as a function of the wind corr
In all cases correlation shows distinct peaks. For small bolides, these
previous authors (Table 2), while large bolides show k values near zero
large events as described in the text.
energy-infrasound regression equation, correctedfor the presence of high-altitude winds, for bolidesbecomes
A ¼ 10a�kvhRbS. (22)
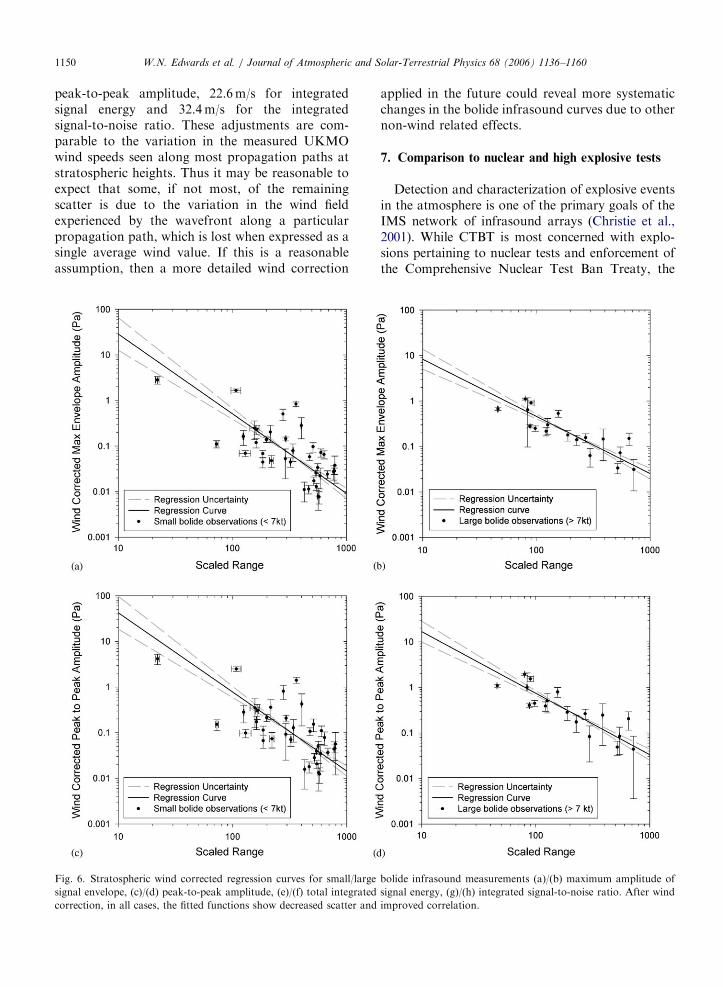
The final best-fit regression equations for the fourmeasured signal properties, along with wind cor-rected values and error bounds are shown in Figs.6a–h. By inverting these equations it becomespossible to solve for a bolide’s yield directly froma given set of observations. Using Eq. (22) and thedefinition of scaled range (Eq. (14)) the yieldequations have the form:
ES ¼ 103ða�kvhÞ=bR3A�3=b, (23)
where ES is the bolide’s yield (initial kinetic energy)expressed in tons (2000 lbs) of equivalent TNT, R isthe range to the bolide in kilometers, and a, b, k arethe regression and wind correction constants givenin Table 2 for the four bolide signal measurements.
To test the robustness of the combined satelliteand infrasound relations for small bolide events, the
ection factor k for (a) small (o7 kt) and (b) large (47 kt) bolides.
peaks are near similar values that have been found and used by
. This is attributed to observational biases in the observations of

ARTICLE IN PRESS
Fig. 5. (Continued)
W.N. Edwards et al. / Journal of Atmospheric and Solar-Terrestrial Physics 68 (2006) 1136–1160 1149
infrasound observations with well-determined en-ergies are plotted together with the measured yieldcalibration curves (Figs. 7a–d). These events includeinfrasound observations of the recent Villalbeto dela Pena, Park Forest, Neuschwanstein and Moravkafireballs and use the same signal methodologydiscussed in the previous section. Appropriatescaled ranges for these measurements were deter-mined using the initial mass and velocity estimates,determined from analysis of either video, photo-graphic, radiometric, radionuclide or other inde-pendent observations of the individual fireballs/recovered meteorites (see Table 1 as given earlier formeasurement details), rather then using the lumi-nous efficiency method of Eqs. (10) and (11). In allcases, the infrasound observations plot within the95% confidence interval of the satellite-infrasoundobservations and confirm that satellite determinedenergies and locations are consistent with equivalentground-based measurements. Only in the case of thetotal integrated signal energy does there appear tobe notable deviation from the regression curve;however, of all the measured quantities in our studyintegrated energy also shows the greatest variation.Conversely the integrated SNR shows the best
correlation between satellite and ground-basedinfrasound observations; this emphasizes the im-portance of taking into account the noise floor at aparticular infrasound station to make accuratesource energy estimates. This consistency, coupledwith the slightly smaller effect of high-altitudewinds, makes this particular signal property themost robust bolide energy estimator. More gener-ally, this indicates that well determined ground-based camera and infrasound observations of fire-balls that provide ground truth in the form ofmeteorites should be used to refine and calibrate thesatellite–infrasound relation from Brown et al.(2002a) in the future as more such events becomerecorded.
Finally, analysis of the remaining scatter aboutthe newly wind corrected data for the small bolidepopulation demonstrates the variability associatedwith applying a wind correction of the type adoptedhere. If all the small bolide infrasound observationsare forced to lie upon their respective regressioncurves, the required wind magnitude value used inthe wind correction would need to be adjusted(increased/decreased) by an average of: 21.8m/s formaximum signal envelope amplitude, 21.2m/s for
ARTICLE IN PRESSW.N. Edwards et al. / Journal of Atmospheric and Solar-Terrestrial Physics 68 (2006) 1136–11601150
peak-to-peak amplitude, 22.6m/s for integratedsignal energy and 32.4m/s for the integratedsignal-to-noise ratio. These adjustments are com-parable to the variation in the measured UKMOwind speeds seen along most propagation paths atstratospheric heights. Thus it may be reasonable toexpect that some, if not most, of the remainingscatter is due to the variation in the wind fieldexperienced by the wavefront along a particularpropagation path, which is lost when expressed as asingle average wind value. If this is a reasonableassumption, then a more detailed wind correction
Fig. 6. Stratospheric wind corrected regression curves for small/large
signal envelope, (c)/(d) peak-to-peak amplitude, (e)/(f) total integrated
correction, in all cases, the fitted functions show decreased scatter and
applied in the future could reveal more systematicchanges in the bolide infrasound curves due to othernon-wind related effects.
7. Comparison to nuclear and high explosive tests
Detection and characterization of explosive eventsin the atmosphere is one of the primary goals of theIMS network of infrasound arrays (Christie et al.,2001). While CTBT is most concerned with explo-sions pertaining to nuclear tests and enforcement ofthe Comprehensive Nuclear Test Ban Treaty, the
bolide infrasound measurements (a)/(b) maximum amplitude of
signal energy, (g)/(h) integrated signal-to-noise ratio. After wind
improved correlation.

ARTICLE IN PRESS
Fig. 6. (Continued)
Table 2
Regression and UKMO wind correction constants for bolide
infrasonic signal measurements (see text for more details)
Signal property k (s/m) a b
Max. sig. env. ampl. (o7 kt) �0.0174 3.2170.59 �1.7570.24
Peak-to-peak ampl. (o7 kt) �0.0177 3.3670.60 �1.7470.24
Tot. Int. Sig. Energy (o7 kt) �0.0380 9.271.3 �3.6470.53
Int. SNR (o7 kt) �0.0100 4.1270.51 �1.4470.20
Max. sig. env. ampl. (47 kt) �0.0024 2.1870.39 �1.2670.17
Peak-to-peak ampl. (47 kt) �0.0018 2.5870.41 �1.3570.18
Tot. Int. Sig. Energy (47 kt) +0.0010 5.9870.99 �1.9970.43
Int. SNR (47 kt) �0.0023 4.5370.88 �1.6270.38
W.N. Edwards et al. / Journal of Atmospheric and Solar-Terrestrial Physics 68 (2006) 1136–1160 1151
observation and interpretation of bolide airwavesworldwide can provide an efficient means of bothtesting this network and eventually allowing thesignals to be efficiently differentiated from actualnuclear explosions (Chyba et al., 1998). Historicalinfrasonic observations of above-ground (free-air)nuclear and high yield chemical explosive tests (ofknown yields and locations) provide an effectivemeans of comparison to these more recent bolideobservations.
The method most commonly used in the past todetermine the energy of an airborne explosion

ARTICLE IN PRESS
Fig. 7. Small bolide infrasound observations with well-determined, ground-based measurements of the initial kinetic energies in
comparison to the general bolide infrasound regressions. (a) Maximum amplitude of signal envelope, (b) peak-to-peak amplitude, (c) total
integrated signal energy, (d) integrated signal-to-noise ratio. In all cases, these well-determined observations plot well within the formal
95% confidence margins of the empirical energy relations. A particularly good regression fit is found for the integrated signal-to-noise
measurement.
W.N. Edwards et al. / Journal of Atmospheric and Solar-Terrestrial Physics 68 (2006) 1136–11601152
source (such as a bolide) from acoustic signals is theAFTAC empirical equations. These relate a signal’speriod at maximum amplitude to the yield of theexplosion (Eqs. (5a) and (5b)). Unfortunately, theserelations were derived using sources much largerthan typical bolide energies, and as a result theAFTAC relations tend to break down at smallsource energies. To illustrate this effect, the sourceenergies obtained using the AFTAC period relation(Eq. (5a)) and the measured periods for each bolidein our study are plotted against the satellite derived
energies in Fig. 8. Here it can be seen that scatterincreases both below �0.2 kt as well as above 2 kt,with the tightest fitting region (and thus best sourceenergy estimates) lying between these regimes. Inaddition, to the large amount of scatter at smallenergies, the shift produced by the wind on thesignal period (Beer, 1974) is clearly seen when theseperiods are separated into with wind and counterwind observations (Fig. 9). Counter wind observa-tions are preferentially observed at slightly longerperiods and so produce larger energy estimates,
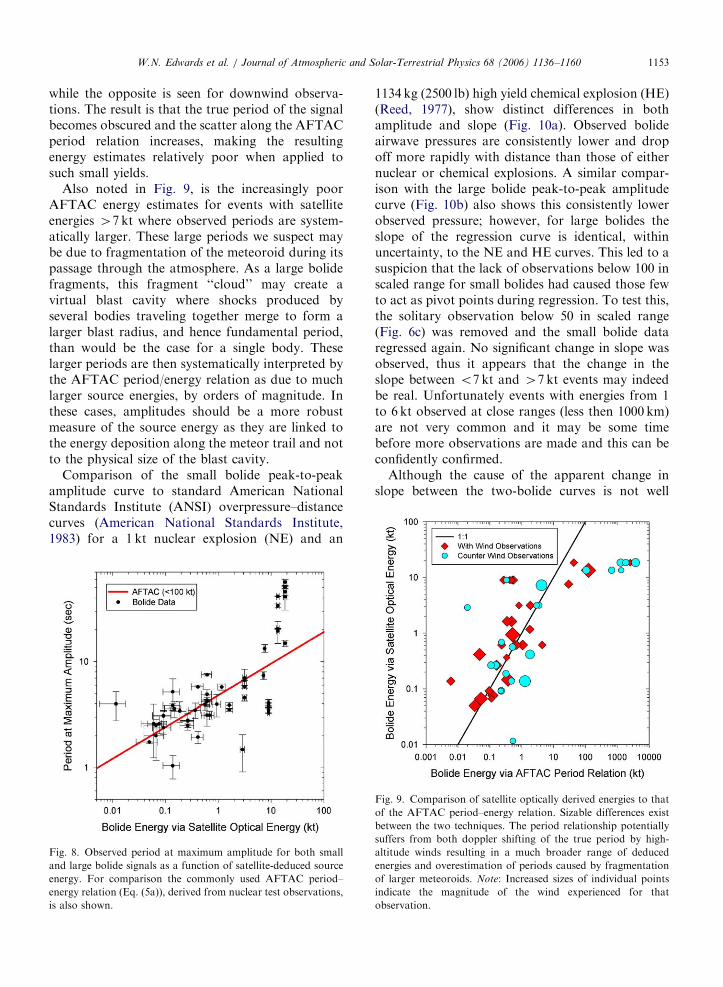
ARTICLE IN PRESSW.N. Edwards et al. / Journal of Atmospheric and Solar-Terrestrial Physics 68 (2006) 1136–1160 1153
while the opposite is seen for downwind observa-tions. The result is that the true period of the signalbecomes obscured and the scatter along the AFTACperiod relation increases, making the resultingenergy estimates relatively poor when applied tosuch small yields.
Also noted in Fig. 9, is the increasingly poorAFTAC energy estimates for events with satelliteenergies 47 kt where observed periods are system-atically larger. These large periods we suspect maybe due to fragmentation of the meteoroid during itspassage through the atmosphere. As a large bolidefragments, this fragment ‘‘cloud’’ may create avirtual blast cavity where shocks produced byseveral bodies traveling together merge to form alarger blast radius, and hence fundamental period,than would be the case for a single body. Theselarger periods are then systematically interpreted bythe AFTAC period/energy relation as due to muchlarger source energies, by orders of magnitude. Inthese cases, amplitudes should be a more robustmeasure of the source energy as they are linked tothe energy deposition along the meteor trail and notto the physical size of the blast cavity.
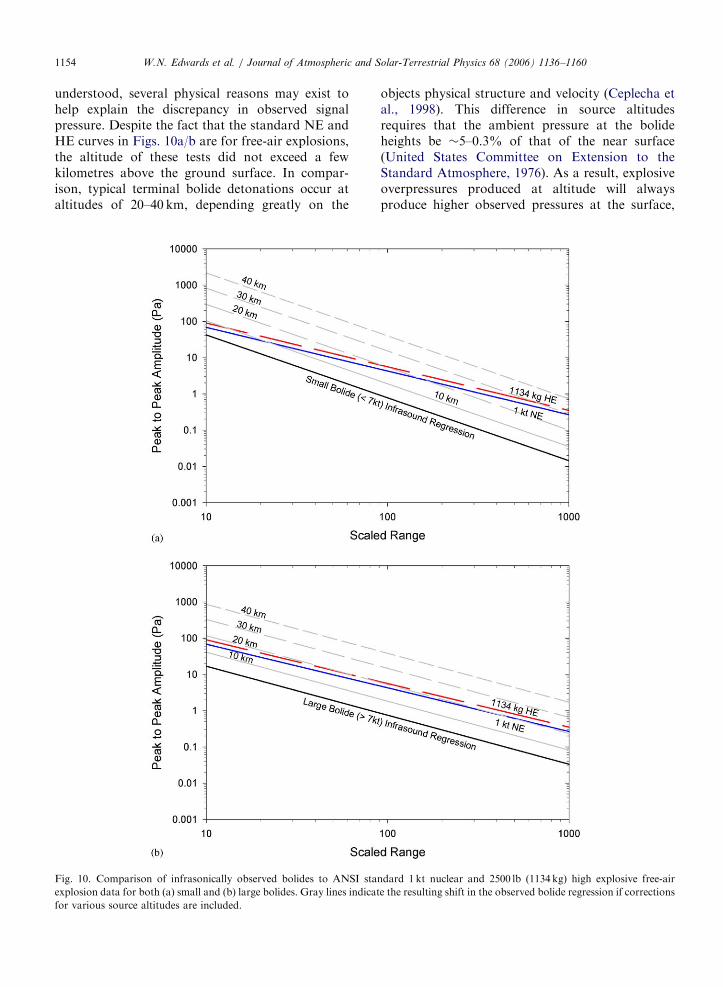
Comparison of the small bolide peak-to-peakamplitude curve to standard American NationalStandards Institute (ANSI) overpressure–distancecurves (American National Standards Institute,1983) for a 1 kt nuclear explosion (NE) and an
Fig. 8. Observed period at maximum amplitude for both small
and large bolide signals as a function of satellite-deduced source
energy. For comparison the commonly used AFTAC period–
energy relation (Eq. (5a)), derived from nuclear test observations,
is also shown.
1134 kg (2500 lb) high yield chemical explosion (HE)(Reed, 1977), show distinct differences in bothamplitude and slope (Fig. 10a). Observed bolideairwave pressures are consistently lower and dropoff more rapidly with distance than those of eithernuclear or chemical explosions. A similar compar-ison with the large bolide peak-to-peak amplitudecurve (Fig. 10b) also shows this consistently lowerobserved pressure; however, for large bolides theslope of the regression curve is identical, withinuncertainty, to the NE and HE curves. This led to asuspicion that the lack of observations below 100 inscaled range for small bolides had caused those fewto act as pivot points during regression. To test this,the solitary observation below 50 in scaled range(Fig. 6c) was removed and the small bolide dataregressed again. No significant change in slope wasobserved, thus it appears that the change in theslope between o7 kt and 47 kt events may indeedbe real. Unfortunately events with energies from 1to 6 kt observed at close ranges (less then 1000 km)are not very common and it may be some timebefore more observations are made and this can beconfidently confirmed.
Although the cause of the apparent change inslope between the two-bolide curves is not well
Fig. 9. Comparison of satellite optically derived energies to that
of the AFTAC period–energy relation. Sizable differences exist
between the two techniques. The period relationship potentially
suffers from both doppler shifting of the true period by high-
altitude winds resulting in a much broader range of deduced
energies and overestimation of periods caused by fragmentation
of larger meteoroids. Note: Increased sizes of individual points
indicate the magnitude of the wind experienced for that
observation.
ARTICLE IN PRESSW.N. Edwards et al. / Journal of Atmospheric and Solar-Terrestrial Physics 68 (2006) 1136–11601154
understood, several physical reasons may exist tohelp explain the discrepancy in observed signalpressure. Despite the fact that the standard NE andHE curves in Figs. 10a/b are for free-air explosions,the altitude of these tests did not exceed a fewkilometres above the ground surface. In compar-ison, typical terminal bolide detonations occur ataltitudes of 20–40 km, depending greatly on the
Fig. 10. Comparison of infrasonically observed bolides to ANSI sta
explosion data for both (a) small and (b) large bolides. Gray lines indicat
for various source altitudes are included.
objects physical structure and velocity (Ceplecha etal., 1998). This difference in source altitudesrequires that the ambient pressure at the bolideheights be �5–0.3% of that of the near surface(United States Committee on Extension to theStandard Atmosphere, 1976). As a result, explosiveoverpressures produced at altitude will alwaysproduce higher observed pressures at the surface,
ndard 1 kt nuclear and 2500 lb (1134 kg) high explosive free-air
e the resulting shift in the observed bolide regression if corrections

ARTICLE IN PRESSW.N. Edwards et al. / Journal of Atmospheric and Solar-Terrestrial Physics 68 (2006) 1136–1160 1155
but lower overpressures (Dp/p) as the blast wavemust conserve energy while propagating downwardinto the denser, higher pressure regions of the loweratmosphere.
This source altitude effect has been ignored inthe observed bolide infrasound regression curves(Eq. (22)), due to unknown individual terminaldetonation altitudes for most of the observedbolides; however, a correction for this effect doesexist in Eq. (13). In the linear regime, the over-pressure is proportional the ratio of source andground pressures as (po/p) to the negative 2/3 power;scaling all values upward to match what would beobserved if the source was located at the surface.Applying this correction to both the small and largebolide population curves for a series of sourcealtitudes, an estimate for the average detonationaltitude for 0.1 to 1m diameter and 1–10m classbolides, respectively can be made. These sourcealtitude shifts are shown in gray in Fig. 10a/b for10–40 km source altitudes. Observing where thesource altitude shifted bolide curves cross thenuclear/chemical explosion line, a value of between20 and 30 km altitude is determined for the averageacoustic source altitude for the small bolide (o7 kt)infrasound data, consistent with the altitude rangedetermined previously by Edwards et al. (2005) andin good agreement with independent observationaldata for fireballs and bolides in these size ranges (cf.Halliday et al., 1989). For the large bolide data,however, an altitude of �20 km is found. Thissmaller source altitude correction result conforms tothe physically expected result that large bolidesshould penetrate deeper into the atmosphere, and isconsistent physically with the survivability of somematerial from 1 to 10m class meteoroids (cf. Blandand Artemieva, 2003).
In addition to source altitude, another potentialcause for the discrepancy between the bolide andman-made explosion curves may lie in the type ofpropagation the airwave undergoes before reachingthe point of observation at the ground. Previouslywe have assumed that all propagation is essentiallylinear along the entire propagation path, though weknow this is not strictly true. A more realistic modelwould be an initially nonlinear shock in the vicinityof the bolide, which after some distance will decayto a weakly nonlinear shock wave that eventually(after some unknown distance) transitions into alinearly propagating acoustic wave. It is during thesecond weakly nonlinear stage of this model, whereattenuation of the overpressure is more rapid,
decaying at the rate of
DWSx�3=4. (24)
As compared to the linear case, which decays atthe slower rate of
DLx�1=2, (25)
where DWS and DL are the associated dampingfunctions for weak shock and linear propagation,respectively and x is the distance from the source inunits of blast radii (ReVelle, 1976). Here the blastradius for a meteor hypersonic shock (approxi-mated as a cylindrical line source) is
R0 � 1:05Mdm, (26)
where R0 is the blast radius, M is the mach numberand dm is the meteoroid diameter (ReVelle, 1976).The overall effect of the nonlinear-to-linear treat-ment is to cause observed pressures to be somewhatlower than is the case for the strictly lineartreatment. The combination of bolide sourcesoccurring at higher altitudes and our selection oflong distance, stratospherically ducted airwaveobservations should ensure that weakly nonlinearshocks will propagate for longer distances beforethe transition to a linear acoustic wave occurs.However, precisely how far airwaves propagatenonlinearly through stratospheric waveguides, andthus how poor the linear approach approximationis, remains a matter of some speculation and is noteasily definable quantitatively for bolide events inour study. Thus we acknowledge that althoughnonlinearity of the airwaves may affect the struc-ture of the empirical relations, it is difficult todetermine the magnitude of this effect on theobservations without further work on the durationof the nonlinear signal propagation at stratosphericaltitudes.
8. Comparison to theoretical models
Next we compare these empirical relations totheoretical treatments of initial bolide sourceenergy. Fig. 11 shows source energy estimates fromthe two best correlated empirical small boliderelationships (peak-to-peak amplitude and inte-grated signal-to-noise ratio) compared to similarestimates using line source theory (Eq. (2)) whichmakes use of the measured signal periods. In mostcases, several parameters remain unknown forbolide events in the data set; in these instancesestimated mean values are used, however, on

ARTICLE IN PRESS
Fig. 11. Comparisons between theoretical and empirical source
energy predictions for bolide infrasound using the small bolide
peak-to-peak amplitude and integrated signal-to-noise ratio
relationships.
W.N. Edwards et al. / Journal of Atmospheric and Solar-Terrestrial Physics 68 (2006) 1136–11601156
physical grounds the actual values are expected totypically vary by no more than factors of 2 or 3.These parameters (together with their assumedaverage values) are: meteoroid bulk density(3400 kg/m3), meteoroid velocity (20 km/s) (Bottkeet al., 2003) and acoustic velocity (0.300 km/s). Alsoamong this list of unknowns is the source altitude.Since the source altitude has a rather broad range,with any particular case depending on initialmeteoroid velocity, mass and composition thisprevents meaningful comparison of our empiricalenergy estimates with energy estimates using theweak shock model (Eq. (1)). This is a directconsequence of the fireball end height rangetypically varying from 20 to 40 km. As such thesource altitude pressure (pz) will vary more than anorder of magnitude over this range, or roughly threeatmospheric scale heights. Despite this shortcoming,for the case of the linear wave method for linesources (Eq. (2)), the theoretical energy estimatesappear to be in moderate agreement with bothempirical methods for lower yield events (Fig. 11),with progressively poorer agreement as the yieldincreases. Although outliers in the empirical rela-tions (Figs. 6c/g) produce estimates 410 kt, thelinear wave method for line sources systematicallyunderestimates the source energy for long distanceinfrasonic observations of bolides. This is likely theresult of exceeding the limits to which Eq. (2)
applies, as at long ranges 41000 km the distancefrom the source will be far greater then the length ofa meteoroid’s trajectory. This is substantiated inpart by a trend of increasing differences betweenestimates and observational range. As well, errors inthe period measurement, potentially due to meteor-oid fragmentation effects or caustics, will lead tolarge changes in source energy due to the largeperiod dependence (fourth power) in Eq. (2). Thusfor long range infrasonic observations of bolidesthere appear to be few options with regards tomethods of source energy estimation; the bestapproach seems to be use of the new relationspresented here and/or the nuclear weapons basedrelationships between period or amplitude andenergy (Eqs. (5)–(9)).
9. Application to historical bolide infrasound
observations
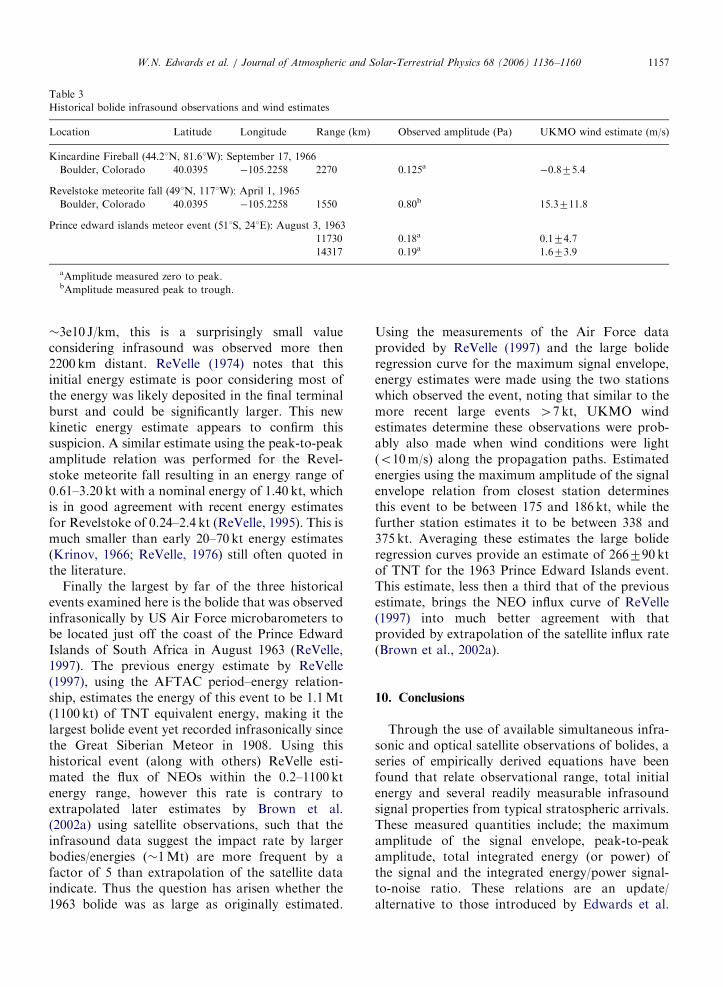
One of the important applications of these newcalibrations is re-examination of historical fireballswhere infrasonic observations were made and whereuncertainty remains about the energy of the bolide.Three particular cases were chosen, due to theavailability of acoustic measurements and priorattempts to estimate source energies. They are (1)The Kincardine Fireball—September 17, 1966, (2)The Revelstoke meteorite fall—March 31, 1965 and(3) the August 3, 1963 bolide located off thesoutheastern coast of the South African PrinceEdward Islands. One deficiency in analyzing suchevents is a lack of upper atmospheric data. Here wemake use of the average of computed UKMO windestimates, for the day in question, between 1992(first complete year of UARS satellite observations)to the present along the individual great circlepropagation paths for each observation. Thoughnot specific to the particular year and day of theevent, this provides a mean expected wind value anda measure of its variability. A complete listing of theinfrasonic measurements and wind estimates used isprovided in Table 3.
Using these values, and the maximum signalenvelope amplitude relation as a proxy for peakamplitude measurements, we find that the Kincar-dine fireball may have had an energy between 0.76and 1.60 kt, for the range of wind conditionsbetween lightly pro-wind and moderately counterwind, with a ‘‘nominal’’ energy of 1.10 kt. Forcomparison ReVelle (1976) estimated that thisfireball had an equivalent line-source energy of
ARTICLE IN PRESS
Table 3
Historical bolide infrasound observations and wind estimates
Location Latitude Longitude Range (km) Observed amplitude (Pa) UKMO wind estimate (m/s)
Kincardine Fireball (44.21N, 81.61W): September 17, 1966
Boulder, Colorado 40.0395 �105.2258 2270 0.125a �0.875.4
Revelstoke meteorite fall (491N, 1171W): April 1, 1965
Boulder, Colorado 40.0395 �105.2258 1550 0.80b 15.3711.8
Prince edward islands meteor event (511S, 241E): August 3, 1963
11730 0.18a 0.174.7
14317 0.19a 1.673.9
aAmplitude measured zero to peak.bAmplitude measured peak to trough.
W.N. Edwards et al. / Journal of Atmospheric and Solar-Terrestrial Physics 68 (2006) 1136–1160 1157
�3e10 J/km, this is a surprisingly small valueconsidering infrasound was observed more then2200 km distant. ReVelle (1974) notes that thisinitial energy estimate is poor considering most ofthe energy was likely deposited in the final terminalburst and could be significantly larger. This newkinetic energy estimate appears to confirm thissuspicion. A similar estimate using the peak-to-peakamplitude relation was performed for the Revel-stoke meteorite fall resulting in an energy range of0.61–3.20 kt with a nominal energy of 1.40 kt, whichis in good agreement with recent energy estimatesfor Revelstoke of 0.24–2.4 kt (ReVelle, 1995). This ismuch smaller than early 20–70 kt energy estimates(Krinov, 1966; ReVelle, 1976) still often quoted inthe literature.
Finally the largest by far of the three historicalevents examined here is the bolide that was observedinfrasonically by US Air Force microbarometers tobe located just off the coast of the Prince EdwardIslands of South Africa in August 1963 (ReVelle,1997). The previous energy estimate by ReVelle(1997), using the AFTAC period–energy relation-ship, estimates the energy of this event to be 1.1Mt(1100 kt) of TNT equivalent energy, making it thelargest bolide event yet recorded infrasonically sincethe Great Siberian Meteor in 1908. Using thishistorical event (along with others) ReVelle esti-mated the flux of NEOs within the 0.2–1100 ktenergy range, however this rate is contrary toextrapolated later estimates by Brown et al.(2002a) using satellite observations, such that theinfrasound data suggest the impact rate by largerbodies/energies (�1Mt) are more frequent by afactor of 5 than extrapolation of the satellite dataindicate. Thus the question has arisen whether the1963 bolide was as large as originally estimated.
Using the measurements of the Air Force dataprovided by ReVelle (1997) and the large bolideregression curve for the maximum signal envelope,energy estimates were made using the two stationswhich observed the event, noting that similar to themore recent large events 47 kt, UKMO windestimates determine these observations were prob-ably also made when wind conditions were light(o10m/s) along the propagation paths. Estimatedenergies using the maximum amplitude of the signalenvelope relation from closest station determinesthis event to be between 175 and 186 kt, while thefurther station estimates it to be between 338 and375 kt. Averaging these estimates the large bolideregression curves provide an estimate of 266790 ktof TNT for the 1963 Prince Edward Islands event.This estimate, less then a third that of the previousestimate, brings the NEO influx curve of ReVelle(1997) into much better agreement with thatprovided by extrapolation of the satellite influx rate(Brown et al., 2002a).
10. Conclusions
Through the use of available simultaneous infra-sonic and optical satellite observations of bolides, aseries of empirically derived equations have beenfound that relate observational range, total initialenergy and several readily measurable infrasoundsignal properties from typical stratospheric arrivals.These measured quantities include; the maximumamplitude of the signal envelope, peak-to-peakamplitude, total integrated energy (or power) ofthe signal and the integrated energy/power signal-to-noise ratio. These relations are an update/alternative to those introduced by Edwards et al.

ARTICLE IN PRESSW.N. Edwards et al. / Journal of Atmospheric and Solar-Terrestrial Physics 68 (2006) 1136–11601158
(2005) as they include data previously unavailable,particularly for large yield events.
Using a correction for signal modification bystratospheric winds similar to that used by previousauthors incorporating measured UKMO wind data,rather then the SCI index or modeled winds, it isfound that similar wind correction factor magni-tudes used for nuclear and conventional explosiveinfrasound also produce R2 maxima when appliedto ‘‘small’’ bolide data (source energies o7 kt).Wind corrections for ‘‘large’’ bolide data (energies47 kt) are slight, likely due the low to moderatewinds experienced along most of the propagationpaths for these events in our data set. As a self-consistency check that these corrections makephysical sense and are not just a statisticalconvenience, it is found for the small bolide datathat the wind correction factor for integrated signalenergy/power is nearly twice that of the indepen-dently measured signal amplitudes. This is exactlythe behavior that would be expected for therelationship between acoustic amplitude and energy.
Comparison of the peak-to-peak amplitude rela-tions to those of the standard free-air nuclear andchemical high explosive data indicate that bolideinfrasound is consistently observed with lower ampli-tudes and, for small bolide events, is more highlyattenuated. This apparent difference in the slopes ofthe small and large bolide data set suggests that theremay be some mechanism occurring between sourceenergies of 3–7kt that causes larger source energies toattenuate more slowly and/or biases in the observationof these large events at long ranges.
Differences in the magnitude of observed signalpressures from bolides are attributed primarily tothe higher source altitudes than their equivalentman-made near-surface explosive data and someunknown amount of nonlinear propagation. Cor-rection for the higher source altitudes places theaverage bolide detonation altitude between 20 and30 kilometres for small events (o7 kt) and at�20 km altitude for events (47 kt). These altitudesare in good agreement with typical terminalaltitudes determined through more conventionalinvestigations for 0.1–1m class meteoroids and areconsistent with the expectation that larger 1–10mclass bodies should survive to lower altitudes (cf.Ceplecha et al., 1998). Quantifying the correction toacoustic amplitudes associated with nonlinear pro-pagation is left for future work.
Further comparisons of observed bolide signalperiods to the commonly used AFTAC energy–per-
iod relationships, derived from nuclear test data,show that at the very smallest source energies,scatter about the AFTAC curve correspondinglyincreases. This scatter can be attributed to thegenerally smaller source energies of typical bolidesas compared to that of the nuclear tests used todevelop the AFTAC relationship, in addition to thedoppler shift of the observed period by high-altitudewinds. Indeed, were it not for this effect, the period-energy relationship would likely improve signifi-cantly. However, it is not clear how to easily correctthe observed period for this wind-induced dopplershift without significant computational efforts andcomplete global models of the atmospheric windpresent at the time of individual events. Thus forbolides, in its uncorrected current state, the AFTACperiod energy relation after regression demonstratesno better correlation (R2
¼ 0.478) then most of theother infrasonic signal properties examined. As well,there is a consistent overestimation in source energy(in some cases by several orders of magnitude)between satellite derived energies and the energiesderived from the AFTAC period relationship whenapplied to the largest events (47 kt) in ourdatabase. We suggest that this is an effect of large-scale fragmentation of these more massive meteor-oids in the atmosphere and subsequent creation ofan artificially large collective blast cavity producinglonger fundamental wave periods. Despite theselimitations and potential biases, the AFTAC periodrelation does seem to be a reasonable means ofestimating energies for events in the 0.1—a few ktrange.
Acknowledgements
The author’s extend thanks to Catherine Wood-gold and David McCormack for their assistance inacquiring some of the recent bolide infrasound dataused in this study and for helpful discussions. TheBritish Atmospheric Data Centre provided access toUKMO weather data. PGB acknowledges NaturalResources Canada, the Canada Research ChairProgram and the Natural Sciences and EngineeringResearch Council for funding support.
References
American National Standards Institute, 1983. Airblast Charac-
teristics for Single Point Explosions in Air, ANSI Standard
S2.20-1983. Acoustical Society of America, New York.

ARTICLE IN PRESSW.N. Edwards et al. / Journal of Atmospheric and Solar-Terrestrial Physics 68 (2006) 1136–1160 1159
Astapowitsch, I.S., 1933. New data about the fall of the great
meteorite on June 30, 1908, in central Siberia. Astronomical
Journal of the Soviet Union 10, 465–483 (in Russian).
Astapowitsch, I.S., 1934. Air waves caused by the fall of the
meteorite on 30th June, 1908, in Central Siberia. Quarterly
Journal of the Royal Meteorological Society 60, 493–504.
Beer, T., 1974. Atmospheric Waves. Halsted Press, New York,
USA.
Blanc, E., Millies-Lacroix, J.C., Issartel, J.P., Perez, S., 1997.
Detection of nuclear explosions in the atmosphere. Chocs 17,
23–34.
Bland, P.A., Artemieva, N.A., 2003. Efficient disruption of small
asteroids by Earth’s atmosphere. Nature 424, 288–291.
Borovicka, J., Spurny, P., Kalenda, P., Tagiaferri, E., 2003. The
Moravka meteorite fall: 1. Description of the events and
determination of the fireball trajectory and orbit from video
records. Meteoritics and Planetary Science 38, 975–987.
Bottke, W.F., Vokrouhlicky, D., Rubincam, D.P., Broz, M.,
2003. The effect of Yarkovsky thermal forces on the
dynamical evolution of asteroids and meteoroids. In: Aster-
oids III. University of Arizona Press Tucson, AZ,
pp. 395–408.
Brown, P., Hildebrand, A.R., Green, W.E., Page, D., Jacobs, C.,
ReVelle, D., Tagliaferri, E., Wacker, J., Wetmiller, B., 1996.
The fall of the St-Robert meteorite. Meteoritics and Planetary
Science 31, 502–517.
Brown, P., Spalding, R.E., ReVelle, D.O., Tagliaferri, E.,
Worden, S.P., 2002a. The flux of small near-Earth objects
colliding with the Earth. Nature 420, 314–316.
Brown, P.G., Whitaker, R.W., ReVelle, D.O., Tagliaferri, E.,
2002b. Multi-station infrasonic observations of two bolides:
signal interpretation and implications for monitoring of
atmospheric explosions. Geophysical Research Letters 29.
Brown, P.G., ReVelle, D.O., Tagliaferri, E., Hildebrand, A.R.,
2002c. An entry model for the Tagish Lake fireball using
seismic, satellite and infrasound records. Meteoritics and
Planetary Science 37, 661–675.
Brown, P.G., Pack, D.W., Edwards, W.N., ReVelle, D.O., Yoo,
B.B., Spalding, R.E., Tagliaferri, E., 2004. The orbit, entry
dynamics and initial mass of the Park Forest Meteorite.
Meteoritics and Planetary Science 29, 1605–1625.
Ceplecha, Z., Borovicka, J., Elford, W.G., ReVelle, D.O.,
Hawkes, R.L., Porubcan, V., Simek, M., 1998. Meteor
phenomena and bodies. Space Science Reviews 84, 327–471.
Christie, D.R., Vivas Veloso, J.A., Campus, P., Bell, M.,
Hoffmann, T., Langlois, A., Martysevich, P., Demirovic, E.,
Carvalho, J., 2001. Detection of atmospheric nuclear explo-
sions: the infrasound component of the International
Monitoring System. Kerntechnik 66, 96–101.
Chyba, C.F., van der Vink, G.E., Hennet, C.B., 1998. Monitoring
the Comprehensive Test Ban Treaty: possible ambiguities due
to meteorite impacts. Geophysical Research Letters 25,
191–194.
Clauter, D.A., Blandford, R.R., 1998. Capability modeling of the
proposed International Monitoring System 60-Station Infra-
sonic Network, LAUR-98-56, Los Alamos National Labs
Report, Los Alamos, NM.
Cox, E.G., 1958. Sound Propagation in Air, Handbuch der
Physik, vol. 48. Springer, Berlin, pp. 455–478.
Davidson, M., and Whitaker, R.W., 1992. Miser’s Gold, LA-
12074-MS, Los Alamos National Laboratory Report,
pp. 1–28.
Dziewonski, A., Hales, A., 1972. Methods in Computational
Physics, vol. 11. Academic Press, New York, pp. 39–84.
Edwards, W.N., Brown, P.G., ReVelle, D.O., 2005. Bolide energy
estimates from infrasonic measurements. Earth, Moon and
Planets, doi:10.1007/s11038-005-2244-4.
Evers, L.G., Haak, H.W., 2003. Tracing a meteoric trajectory
with infrasound. Geophysical Research Letters 30, 1.
Glasstone, S., 1964. The Effects of Nuclear Weapons. United
States Atomic Energy Commission, Washington, DC, USA.
Glasstone, S., Dolan, P.J., 1977. The Effects of Nuclear
Weapons. United States Department of Defense and Depart-
ment of Energy, Washington, DC, USA.
Golitsyn, G.S., Grigor’yev, G.I., Dokuchayev, V.P., 1977.
Generation of acoustic-gravity waves by meteor motion in
the atmosphere. Izvestiya 13, 633–639.
Halliday, I., Blackwell, A.T., Griffin, A.A., 1989. The typical
meteorite event, based on photographic records of 44
fireballs. Meteoritics 24, 65–72.
Harris, J.M., Young, C.J., 1997. MatSeis; a seismic graphical user
interface and toolbox for MATLAB. Seismological Research
Letters 68, 307–308.
Hedin, A.E., Fleming, E.L., Manson, A.H., Schmidlin, F.J.,
Avery, S.K., Clark, R.R., Franke, S.J., Fraser, G.J., Tsuda,
T., Vial, F., Vincent, R.A., 1996. Empirical wind model for
the upper, middle and lower atmosphere. Journal of Atmo-
spheric and Terrestrial Physics 58, 1421–1447.
Klekociuk, A.R., Brown, P.G., Pack, D.W., ReVelle, D.O.,
Edwards, W.N., Spalding, R.E., Tagliaferri, E., Bernard,
Y.B., Zagari, J., 2005. Lidar, satellite and acoustic measure-
ments of an asteroidal airburst in Earth’s atmosphere. Nature
436, 1132–1135.
Krinov, E.L., 1966. Giant Meteorites. Pergamon Press, Oxford,
New York, USA.
Llorca, J., Trigo-Rodrıguez, J.M., Ortiz, J.L., Docobo, J.A.,
Garcıa-Guinea, J., Castro-Tirado, A.J., Rubin, A.E., Eugster,
O., Edwards, W.N., Laubenstein, M., Casanova, I., 2005. The
Villalbeto de la Pena Meteorite Fall: I. Fireball energy,
meteorite recovery, strewn field and petrography. Meteoritics
and Planetary Science 40, 795–804.
Melton, B.S., Bailey, L.F., 1957. Multiple signal correlators.
Geophysics 22, 565–588.
Mutschlecner, J.P., Whitaker, R.W., 1990. The correction of
infrasound signals for upper atmospheric winds, NASA,
Langley Research Center. Proceedings of the Fourth Inter-
national Symposium on Long-Range Sound Propagation, pp.
143–153.
Reed, J.W., 1977. Attenuation of explosion waves. Journal of the
Acoustical Society of America 61, 39–47.
ReVelle, D.O., 1974. Acoustics of meteors—effects of the
atmospheric temperature and wind structure on the sounds
produced by meteors. Ph.D. Dissertation, University of
Michigan, Ann Arbor, MI.
ReVelle, D.O., 1976. On meteor-generated infrasound. Journal of
Geophysical Research 81, 1217–1229.
ReVelle, D.O., 1995. The fall of the Revelstoke meteorite: March
31, 1965: seismic and infrasonic analyses of the impact
location of the meteorites and search for catering features,
LAUR-95-1952, pp. 1–2.
ReVelle, D.O., 1997. Historical detection of atmospheric impacts
by large bolides using acoustic-gravity waves. In: J.L. Remo
(Ed.), Annals of the New York Academy of Sciences,
Near-Earth Objects—The United Nations International

ARTICLE IN PRESSW.N. Edwards et al. / Journal of Atmospheric and Solar-Terrestrial Physics 68 (2006) 1136–11601160
Conference, New York Academy of Sciences, vol. 822,
pp. 284–302.
ReVelle, D.O., 2005. Recent Advances in bolide energy modeling:
a bolide potpourri. Earth, Moon and Planets doi:10.1007/
s11038-005-9064-4, 1–36.
ReVelle, D.O., Whitaker, R.W., 1995. Acoustic Efficiency
Analysis using Infrasound from NEOS, LAUR-95-4121, Los
Alamos National Laboratory Report, Los Alamos, New
Mexico.
ReVelle, D.O. and Whitaker, R.W., 1997. Acoustic efficiency
analysis using infrasound from NEOs. In: S.W. Johnson
(Ed.), Proceedings of the Fifth International Conference of
Space 96, Albuquerque, New Mexico.
ReVelle, D.O., Brown, P.G., Spurny, P., 2004. Entry dynamics
and acoustics/infrasonic/seismic analysis for the Neuschwan-
stein meteorite fall. Meteoritics and Planetary Science 39,
1605–1626.
Shumilov, O.I., Kasatkina, E.A., Tereshchenko, E.D., Kulich-
kov, S.N., Vasil’ev, A.N., 2003. Journal of Experimental and
Theoretical Physics Letters 77, 115–117.
Spurny, P., Oberst, J., Heinlein, D., 2003. Photographic
observations of Neuschwanstein, a second meteorite from
the orbit of the Prıbram chondrite. Nature 423, 151–153.
Stevens, J.L., Adams, D.A., Baker, G.E., Xu, H., Murphy, J.R.,
Divnov, I. and Bourchik, V.N., 2002. Infrasound modeling
using Soviet Explosion Data and Instrument Design Criteria
from Experiments and Simulations. Proceedings of the 22nd
Annual DoD/DoE Seismic Research Symposium, New
Orleans, USA.
Swinbank, R., O’Neill, A.A., 1994. Stratosphere–Troposphere
Data Assimilation System. Monthly Weather Review 122,
686–702.
Tagliaferri, E., Spalding, R., Jacobs, C., Worden, S.P., Erlich, A.,
1994. Hazards Due to Comets and Impacts. University of
Arizona Press, Tucson, AZ, p. 199.
United States Committee on Extension to the Standard Atmo-
sphere, 1976. U.S. Standard Atmosphere 1976, U.S. Govern-
ment Printing Office, Washington.
Webb, W.L., 1966. Structure of the Stratosphere and Meso-
sphere. Academic Press, New York, USA.
Whipple, F.J.W., 1930. The Great Siberian meteor and the waves,
seismic and aerial, which it produced. Quarterly Journal of
the Royal Meteorological Society 56, 287–304.
Whipple, F.J.W., 1934. On phenomena related to the great
Siberian meteor. Quarterly Journal of the Royal Meteorolo-
gical Society 60, 505–513.
Whitaker, R.W., 1995. Infrasonic monitoring, In: Proceedings of
the 17th Seismic Research Symposium on Monitoring a
Comprehensive Test Ban Treaty, pp. 997–1000.
Young, C.J., Chael, E.P., Merchant, B.J., 2002. Version 1.7 of
MatSeis and the GNEM R&E regional seismic analysis
tools. Proceedings of the 24th Seismic Research Review,
pp. 915–924 (CD-ROM).