estimating cash flows - new york...
TRANSCRIPT
Aswath Damodaran
1
Estimating Cash Flows
DCF Valuation
Aswath Damodaran
2
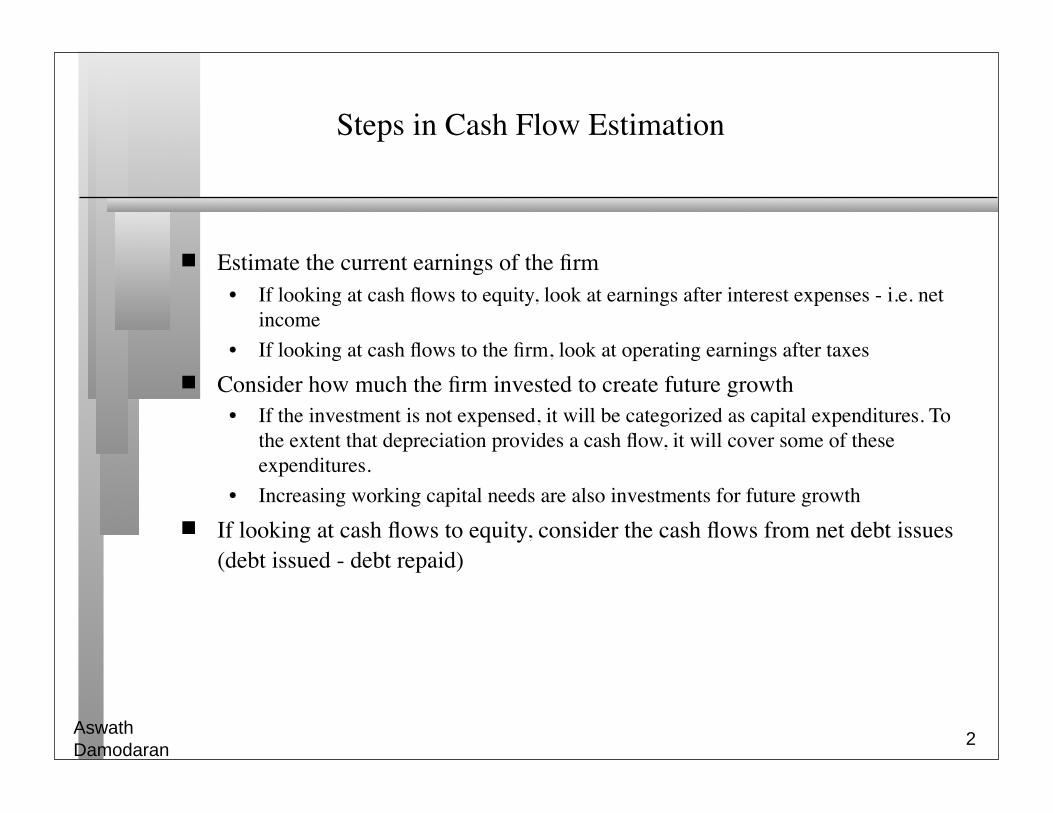
Steps in Cash Flow Estimation
Estimate the current earnings of the firm• If looking at cash flows to equity, look at earnings after interest expenses - i.e. net
income• If looking at cash flows to the firm, look at operating earnings after taxes
Consider how much the firm invested to create future growth• If the investment is not expensed, it will be categorized as capital expenditures. To
the extent that depreciation provides a cash flow, it will cover some of these expenditures.
• Increasing working capital needs are also investments for future growth If looking at cash flows to equity, consider the cash flows from net debt issues
(debt issued - debt repaid)
Aswath Damodaran
3
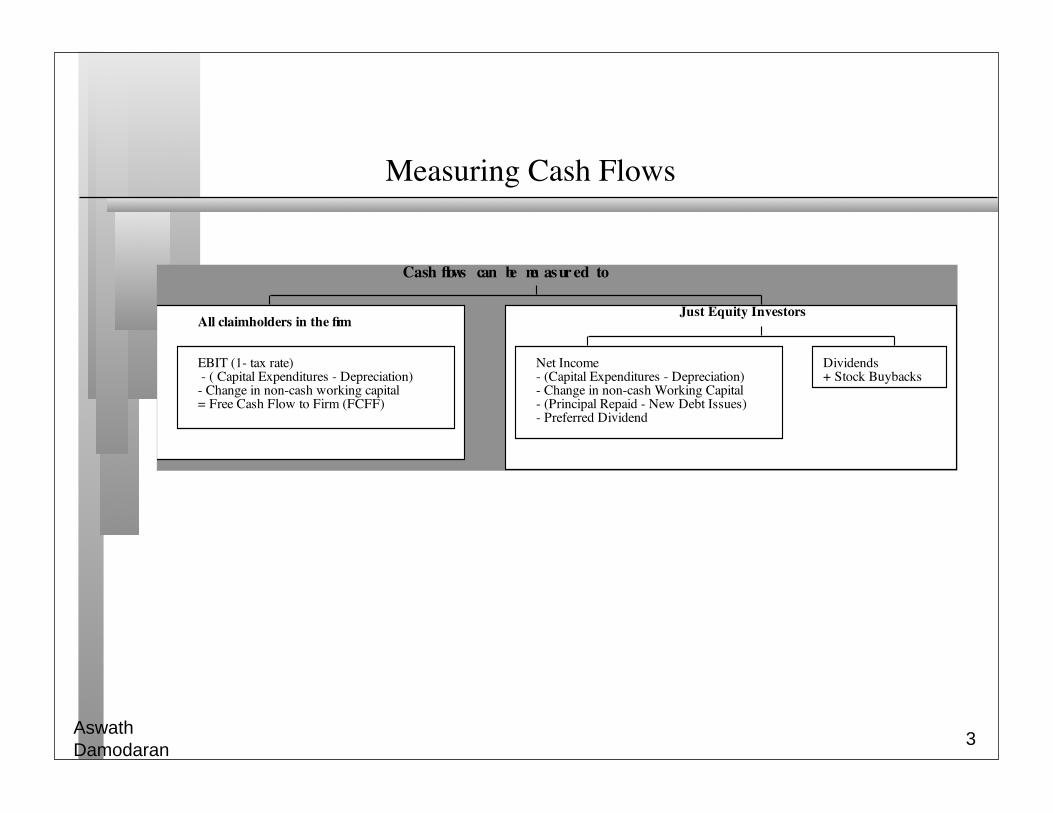
Measuring Cash Flows
Aswath Damodaran
4
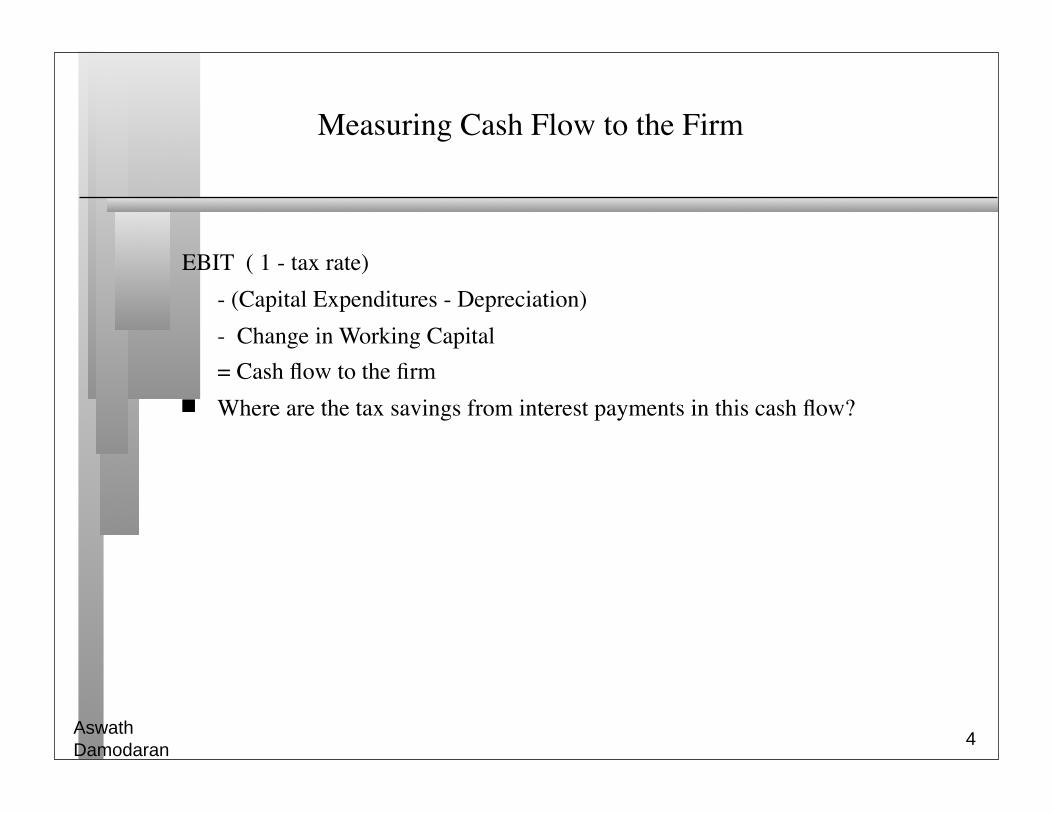
Measuring Cash Flow to the Firm
EBIT ( 1 - tax rate) - (Capital Expenditures - Depreciation) - Change in Working Capital = Cash flow to the firm Where are the tax savings from interest payments in this cash flow?
Aswath Damodaran
5
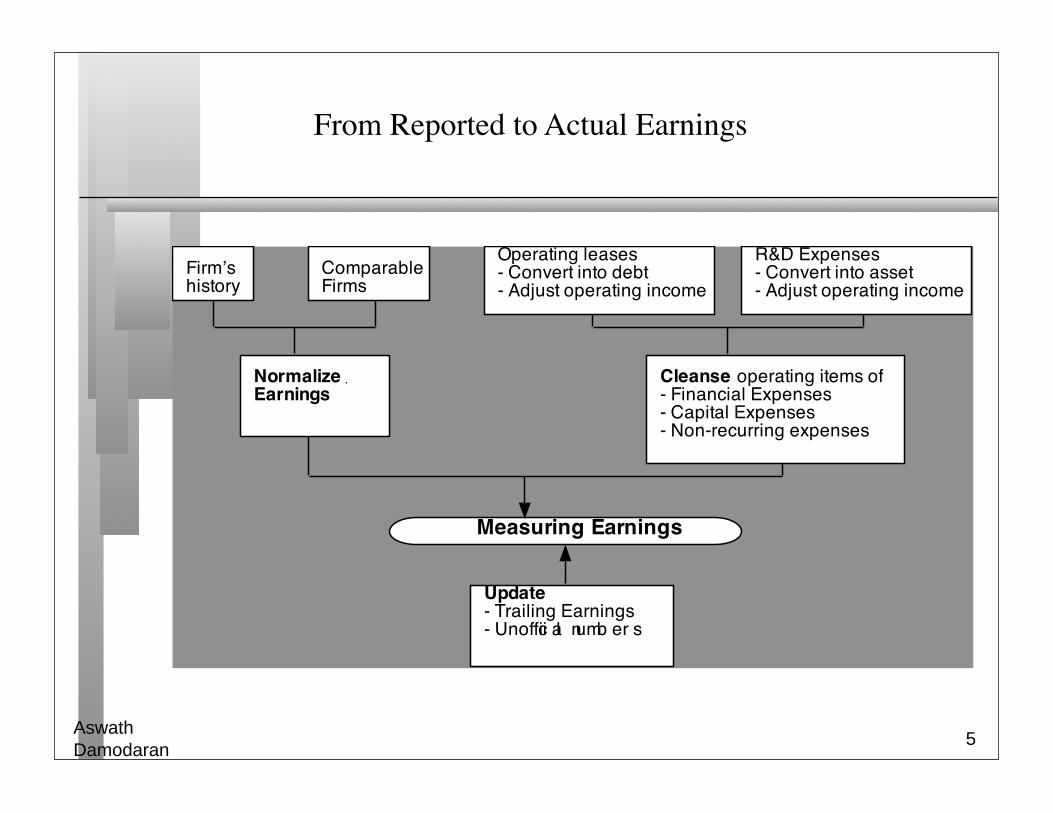
From Reported to Actual Earnings
Aswath Damodaran
6
I. Update Earnings
When valuing companies, we often depend upon financial statements for inputs on earnings and assets. Annual reports are often outdated and can be updated by using-
• Trailing 12-month data, constructed from quarterly earnings reports.• Informal and unofficial news reports, if quarterly reports are unavailable.
Updating makes the most difference for smaller and more volatile firms, as well as for firms that have undergone significant restructuring.
Time saver: To get a trailing 12-month number, all you need is one 10K and one 10Q (example third quarter). Use the Year to date numbers from the 10Q:
Trailing 12-month Revenue = Revenues (in last 10K) - Revenues from first 3 quarters of last year + Revenues from first 3 quarters of this year.
Aswath Damodaran
7
II. Correcting Accounting Earnings
Make sure that there are no financial expenses mixed in with operating expenses
• Financial expense: Any commitment that is tax deductible that you have to meet no matter what your operating results: Failure to meet it leads to loss of control of the business.
• Example: Operating Leases: While accounting convention treats operating leases as operating expenses, they are really financial expenses and need to be reclassified as such. This has no effect on equity earnings but does change the operating earnings
Make sure that there are no capital expenses mixed in with the operating expenses
• Capital expense: Any expense that is expected to generate benefits over multiple periods.
• R & D Adjustment: Since R&D is a capital expenditure (rather than an operating expense), the operating income has to be adjusted to reflect its treatment.
Aswath Damodaran
8
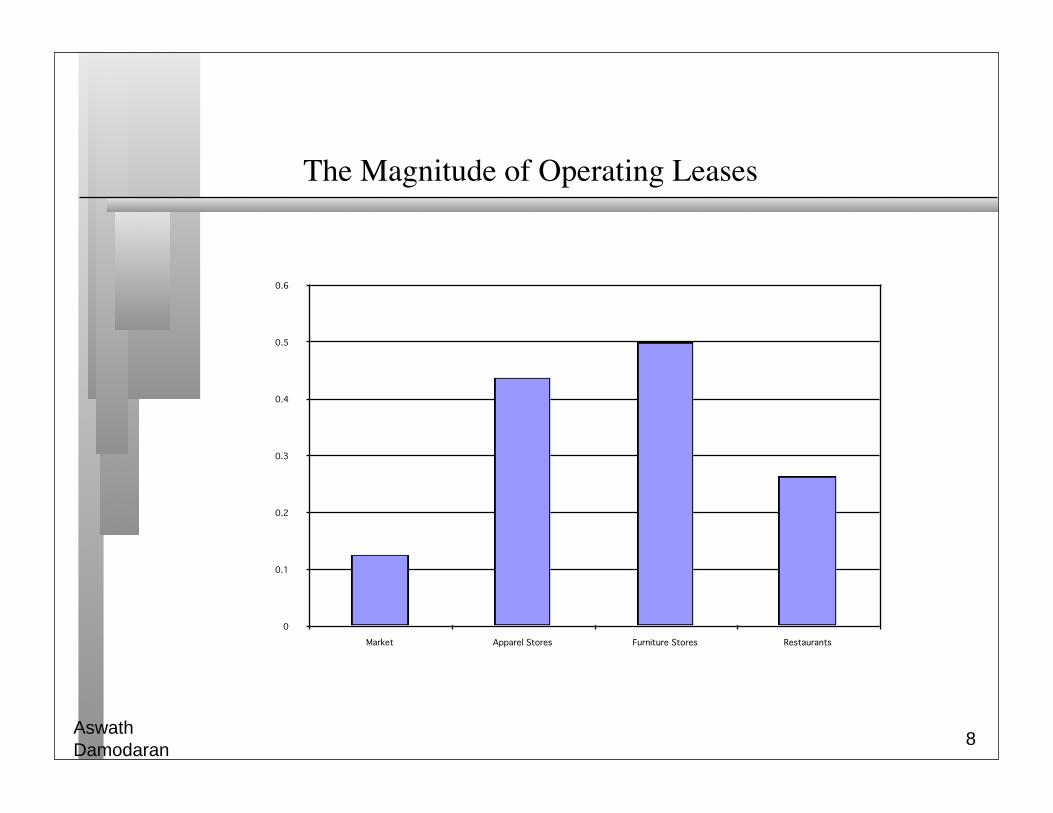
The Magnitude of Operating Leases
0
0.1
0.2
0.3
0.4
0.5
0.6
Market Apparel Stores Furniture Stores Restaurants
Aswath Damodaran
9
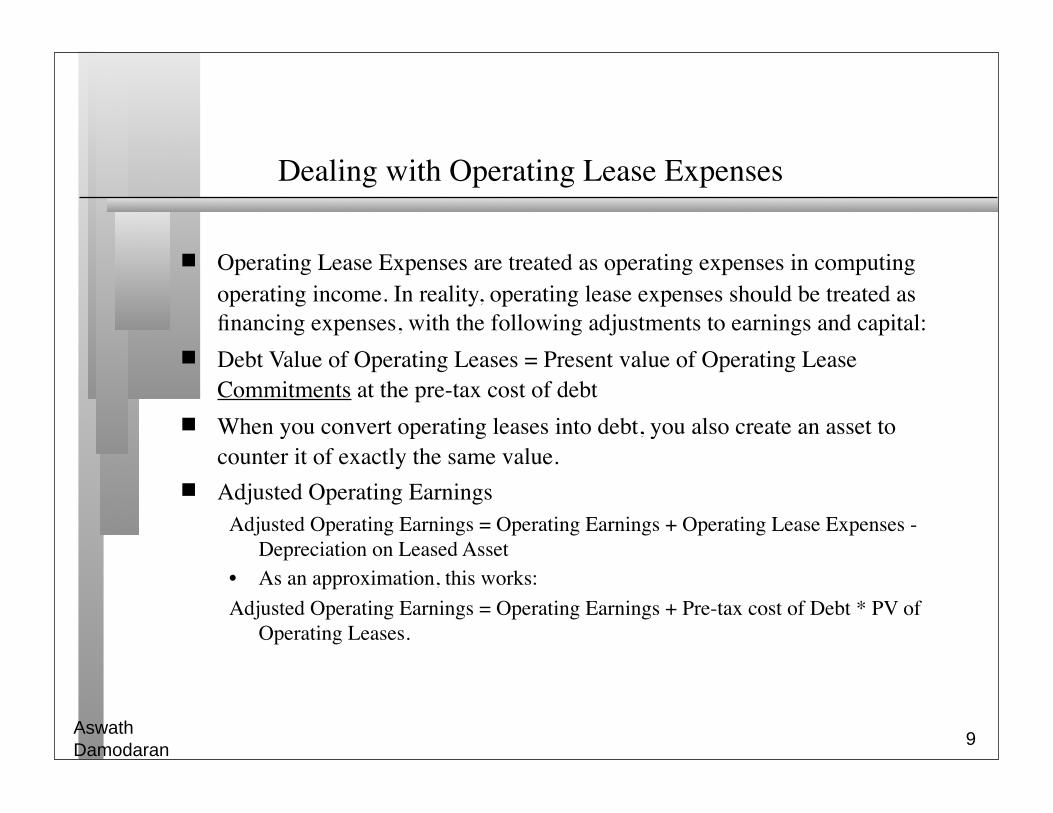
Dealing with Operating Lease Expenses
Operating Lease Expenses are treated as operating expenses in computing operating income. In reality, operating lease expenses should be treated as financing expenses, with the following adjustments to earnings and capital:
Debt Value of Operating Leases = Present value of Operating Lease Commitments at the pre-tax cost of debt
When you convert operating leases into debt, you also create an asset to counter it of exactly the same value.
Adjusted Operating EarningsAdjusted Operating Earnings = Operating Earnings + Operating Lease Expenses -
Depreciation on Leased Asset• As an approximation, this works:Adjusted Operating Earnings = Operating Earnings + Pre-tax cost of Debt * PV of
Operating Leases.
Aswath Damodaran
10
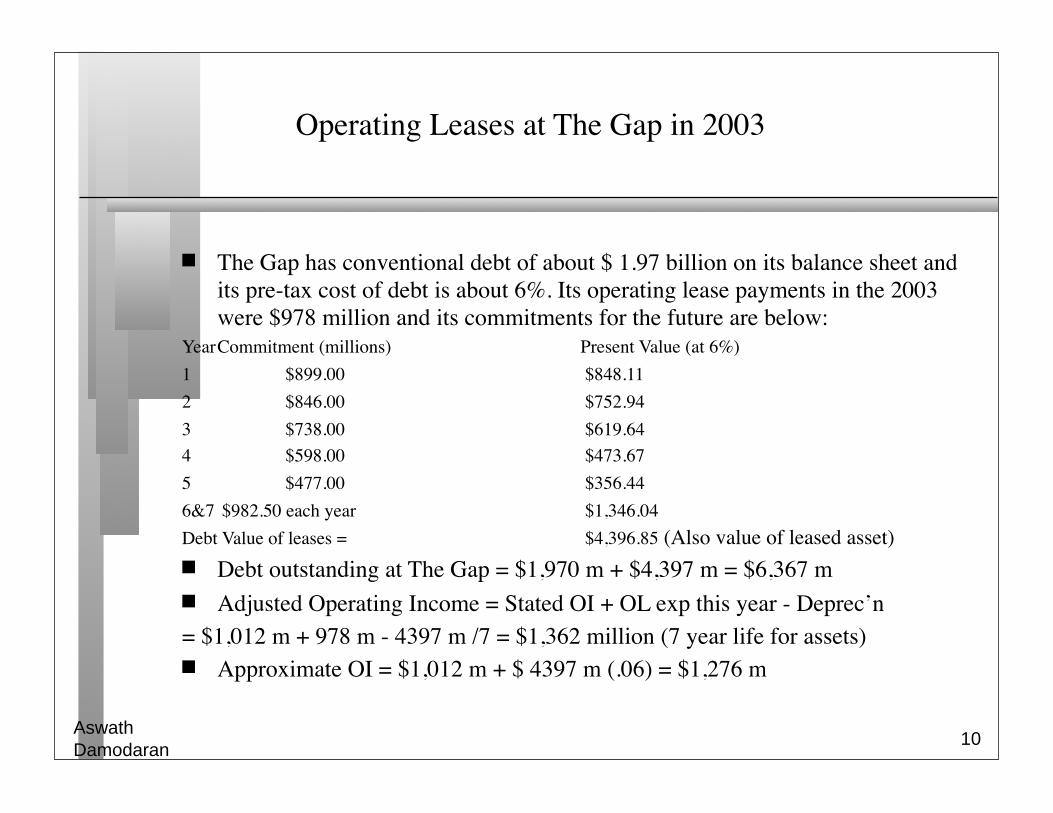
Operating Leases at The Gap in 2003
The Gap has conventional debt of about $ 1.97 billion on its balance sheet and its pre-tax cost of debt is about 6%. Its operating lease payments in the 2003 were $978 million and its commitments for the future are below:
Year Commitment (millions) Present Value (at 6%)1 $899.00 $848.11 2 $846.00 $752.94 3 $738.00 $619.64 4 $598.00 $473.67 5 $477.00 $356.44 6&7 $982.50 each year $1,346.04 Debt Value of leases = $4,396.85 (Also value of leased asset) Debt outstanding at The Gap = $1,970 m + $4,397 m = $6,367 m Adjusted Operating Income = Stated OI + OL exp this year - Deprec’n= $1,012 m + 978 m - 4397 m /7 = $1,362 million (7 year life for assets) Approximate OI = $1,012 m + $ 4397 m (.06) = $1,276 m
Aswath Damodaran
11
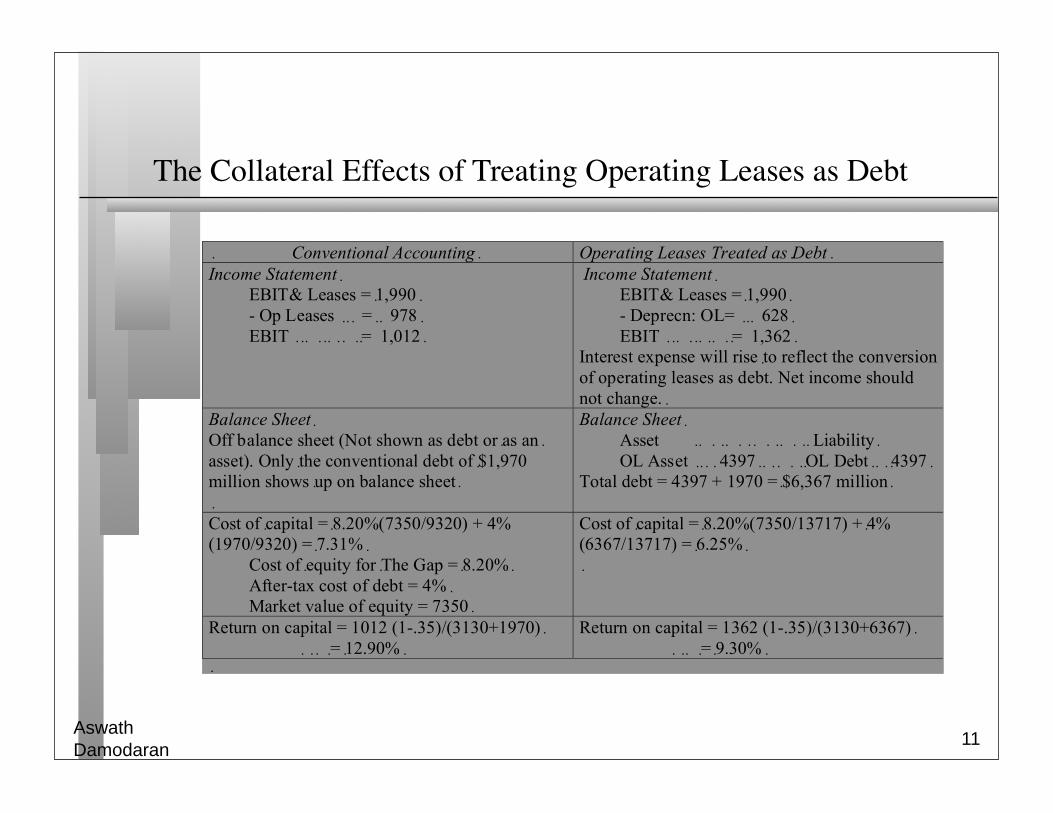
The Collateral Effects of Treating Operating Leases as Debt
Aswath Damodaran
12
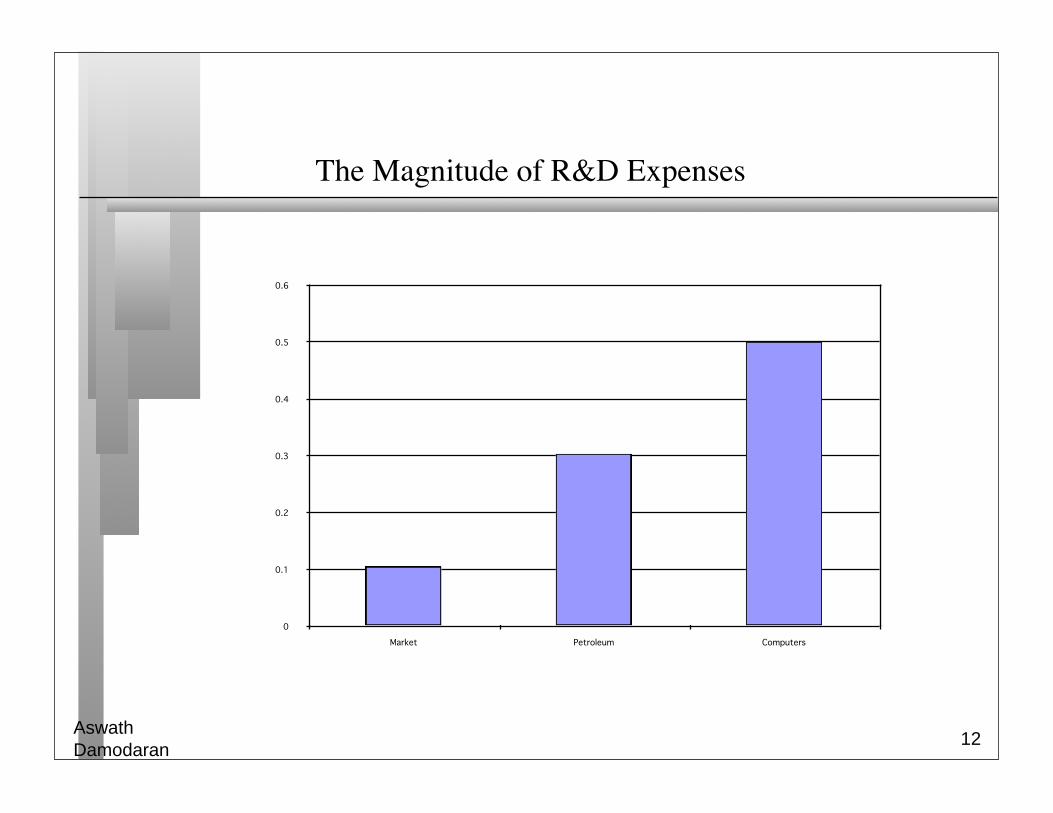
The Magnitude of R&D Expenses
0
0.1
0.2
0.3
0.4
0.5
0.6
Market Petroleum Computers
Aswath Damodaran
13
R&D Expenses: Operating or Capital Expenses
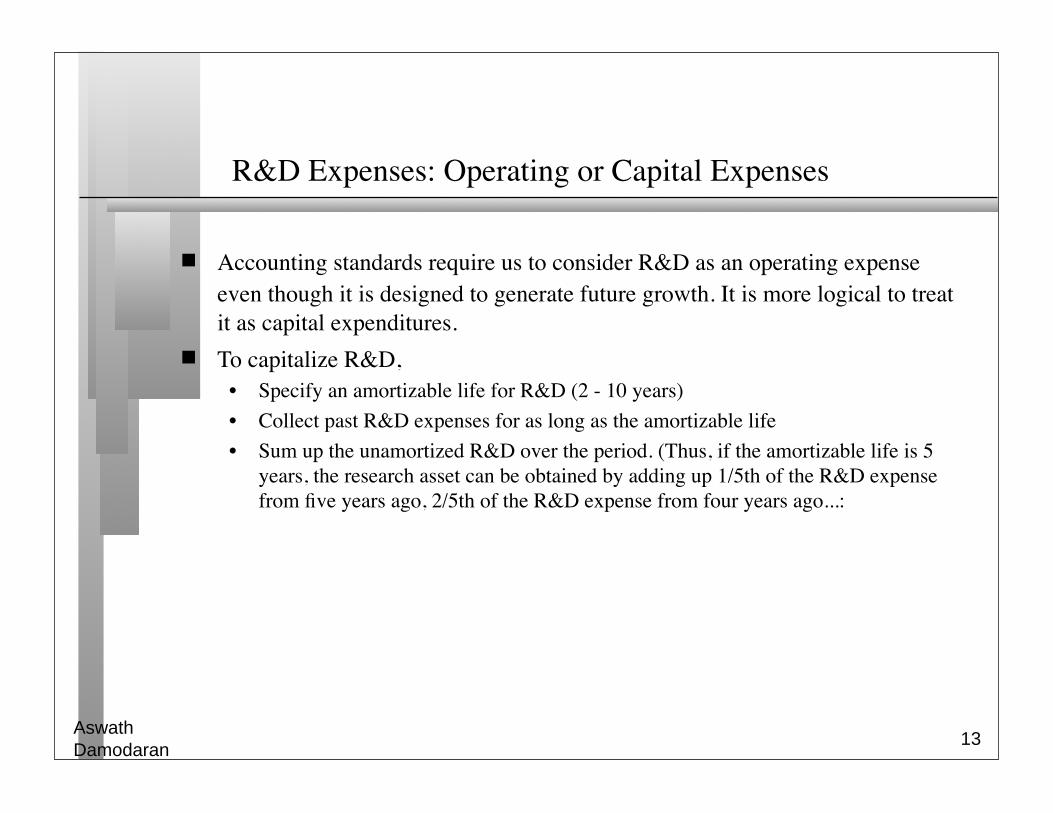
Accounting standards require us to consider R&D as an operating expense even though it is designed to generate future growth. It is more logical to treat it as capital expenditures.
To capitalize R&D,• Specify an amortizable life for R&D (2 - 10 years)• Collect past R&D expenses for as long as the amortizable life• Sum up the unamortized R&D over the period. (Thus, if the amortizable life is 5
years, the research asset can be obtained by adding up 1/5th of the R&D expense from five years ago, 2/5th of the R&D expense from four years ago...:
Aswath Damodaran
14
Capitalizing R&D Expenses: SAP in 2004
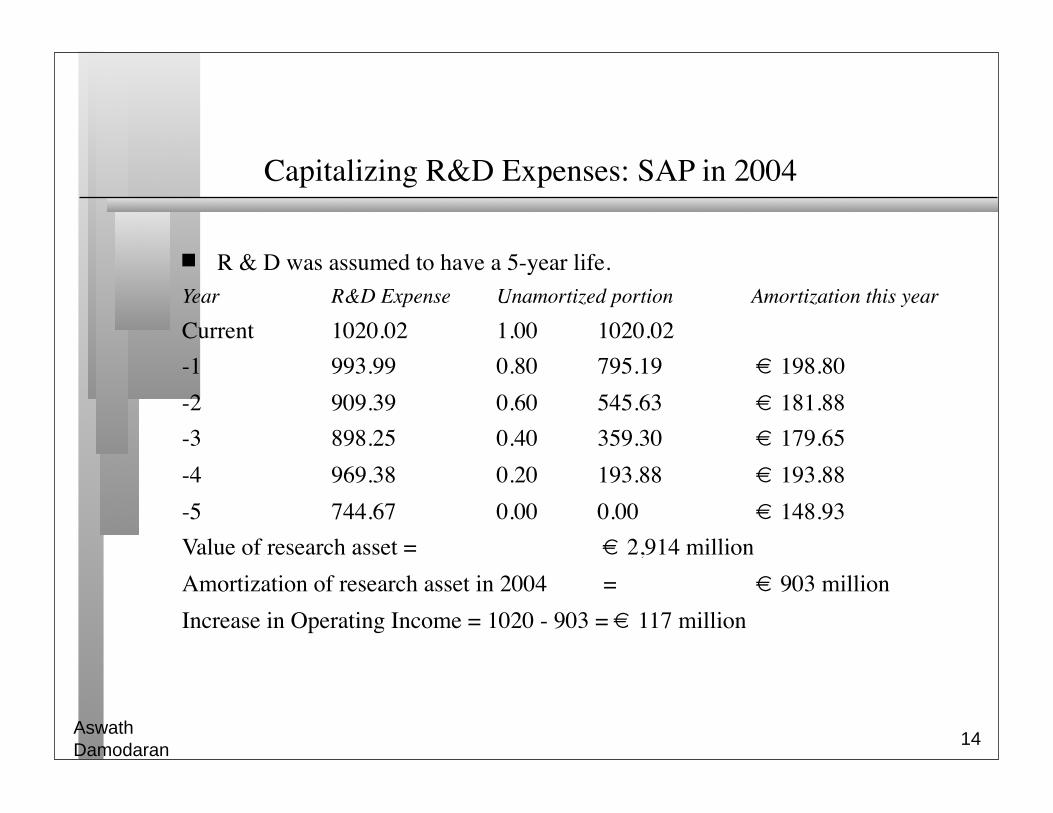
R & D was assumed to have a 5-year life. Year R&D Expense Unamortized portion Amortization this year
Current 1020.02 1.00 1020.02 -1 993.99 0.80 795.19 € 198.80 -2 909.39 0.60 545.63 € 181.88 -3 898.25 0.40 359.30 € 179.65 -4 969.38 0.20 193.88 € 193.88 -5 744.67 0.00 0.00 € 148.93 Value of research asset = € 2,914 millionAmortization of research asset in 2004 = € 903 millionIncrease in Operating Income = 1020 - 903 = € 117 million
Aswath Damodaran
15
The Effect of Capitalizing R&D: SAP
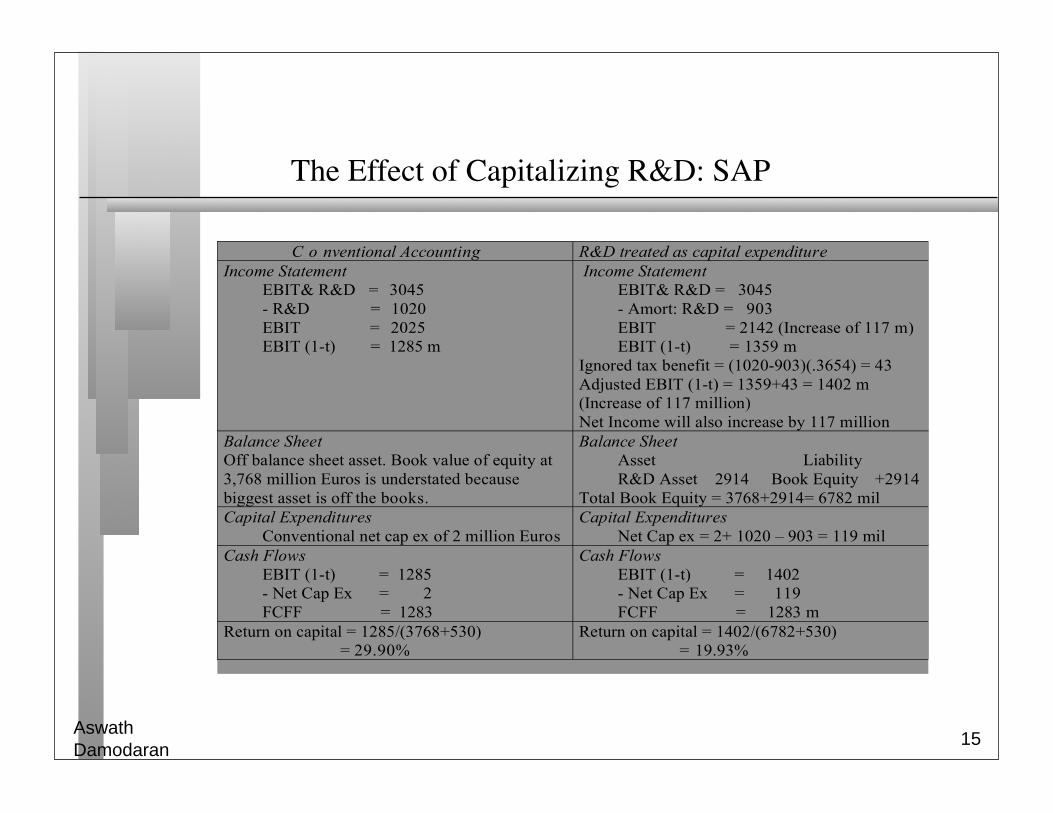
C o nventional Accounting R&D treated as capital expenditure Income Statement
EBIT& R&D = 3045 - R&D = 1020 EBIT = 2025 EBIT (1-t) = 1285 m
Income Statement EBIT& R&D = 3045 - Amort: R&D = 903 EBIT = 2142 (Increase of 117 m) EBIT (1-t) = 1359 m
Ignored tax benefit = (1020-903)(.3654) = 43 Adjusted EBIT (1-t) = 1359+43 = 1402 m (Increase of 117 million) Net Income will also increase by 117 million
Balance Sheet Off balance sheet asset. Book value of equity at 3,768 million Euros is understated because biggest asset is off the books.
Balance Sheet Asset Liability R&D Asset 2914 Book Equity +2914
Total Book Equity = 3768+2914= 6782 mil Capital Expenditures
Conventional net cap ex of 2 million Euros Capital Expenditures
Net Cap ex = 2+ 1020 – 903 = 119 mil Cash Flows
EBIT (1-t) = 1285 - Net Cap Ex = 2 FCFF = 1283
Cash Flows EBIT (1-t) = 1402 - Net Cap Ex = 119 FCFF = 1283 m
Return on capital = 1285/(3768+530) = 29.90%
Return on capital = 1402/(6782+530) = 19.93%
Aswath Damodaran
16
III. One-Time and Non-recurring Charges
Assume that you are valuing a firm that is reporting a loss of $ 500 million, due to a one-time charge of $ 1 billion. What is the earnings you would use in your valuation?
A loss of $ 500 million A profit of $ 500 millionWould your answer be any different if the firm had reported one-time losses like
these once every five years? Yes No
Aswath Damodaran
17
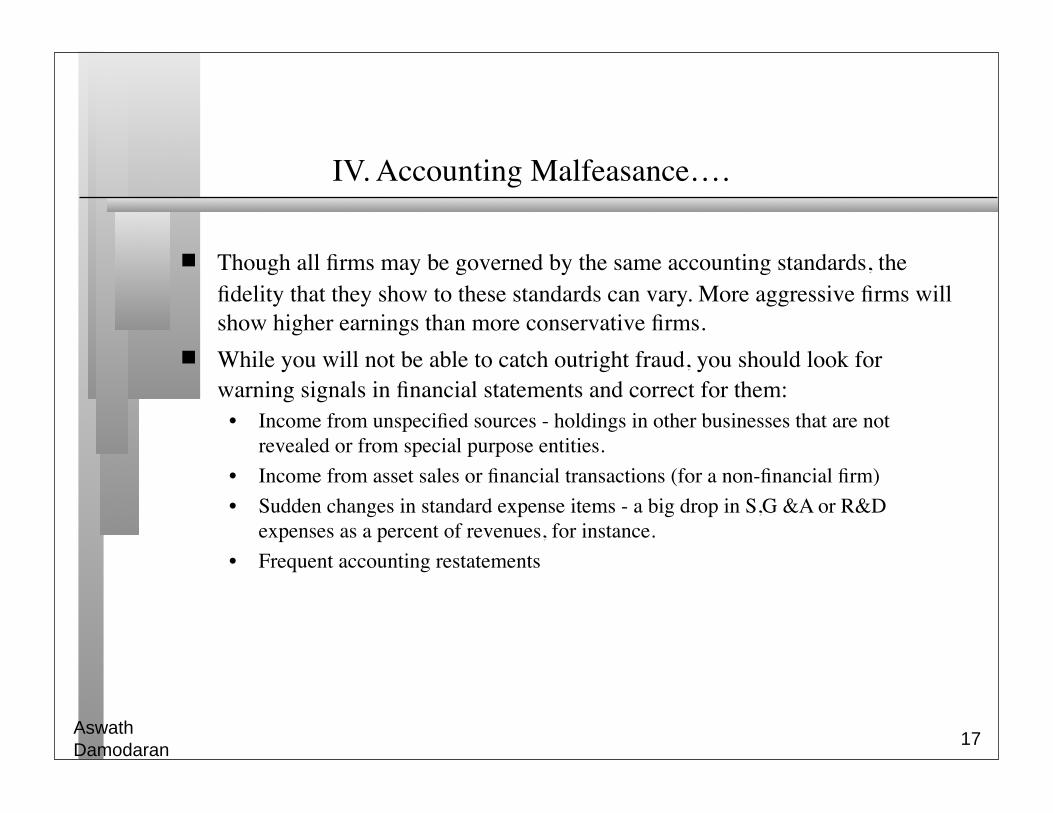
IV. Accounting Malfeasance….
Though all firms may be governed by the same accounting standards, the fidelity that they show to these standards can vary. More aggressive firms will show higher earnings than more conservative firms.
While you will not be able to catch outright fraud, you should look for warning signals in financial statements and correct for them:
• Income from unspecified sources - holdings in other businesses that are not revealed or from special purpose entities.
• Income from asset sales or financial transactions (for a non-financial firm)• Sudden changes in standard expense items - a big drop in S,G &A or R&D
expenses as a percent of revenues, for instance.• Frequent accounting restatements
Aswath Damodaran
18
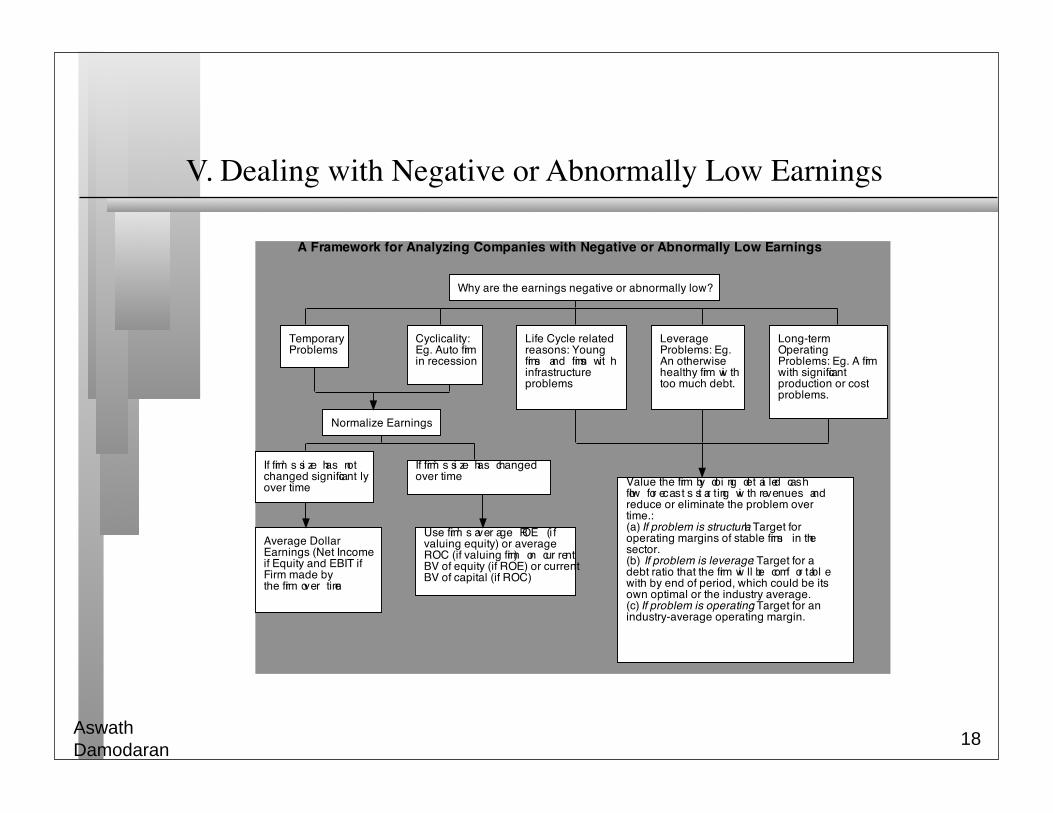
V. Dealing with Negative or Abnormally Low Earnings
Aswath Damodaran
19
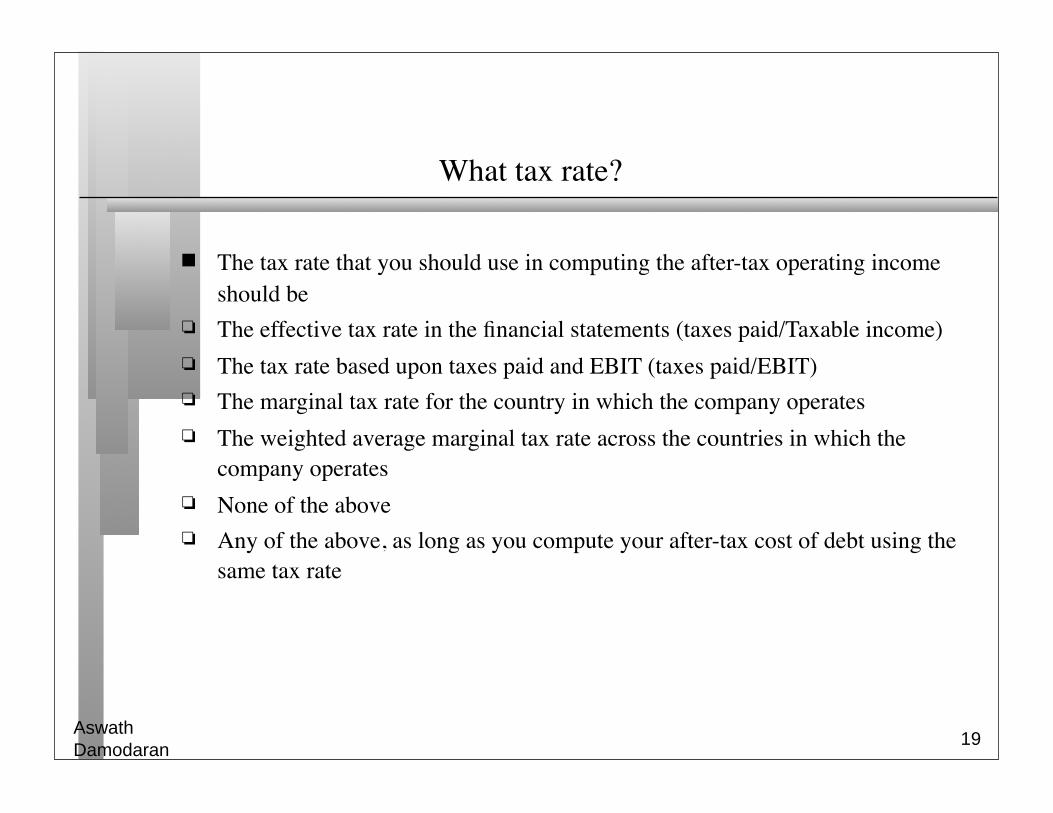
What tax rate?
The tax rate that you should use in computing the after-tax operating income should be
The effective tax rate in the financial statements (taxes paid/Taxable income) The tax rate based upon taxes paid and EBIT (taxes paid/EBIT) The marginal tax rate for the country in which the company operates The weighted average marginal tax rate across the countries in which the
company operates None of the above Any of the above, as long as you compute your after-tax cost of debt using the
same tax rate
Aswath Damodaran
20
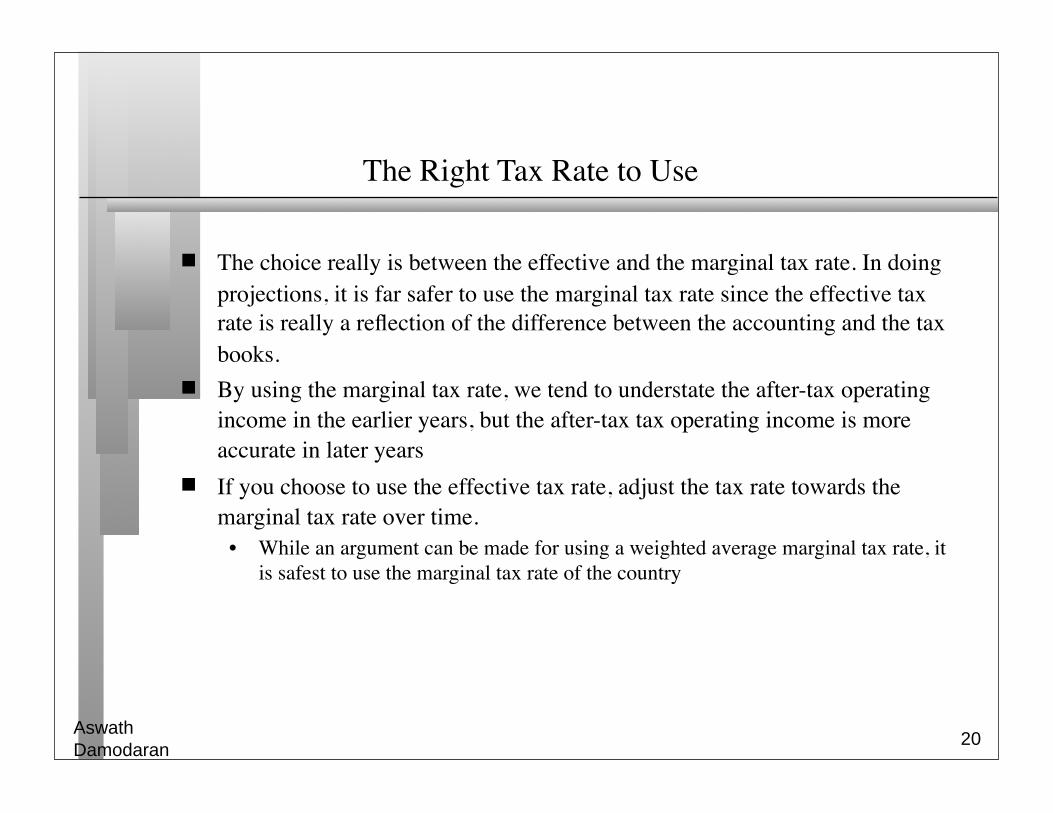
The Right Tax Rate to Use
The choice really is between the effective and the marginal tax rate. In doing projections, it is far safer to use the marginal tax rate since the effective tax rate is really a reflection of the difference between the accounting and the tax books.
By using the marginal tax rate, we tend to understate the after-tax operating income in the earlier years, but the after-tax tax operating income is more accurate in later years
If you choose to use the effective tax rate, adjust the tax rate towards the marginal tax rate over time.
• While an argument can be made for using a weighted average marginal tax rate, it is safest to use the marginal tax rate of the country
Aswath Damodaran
21
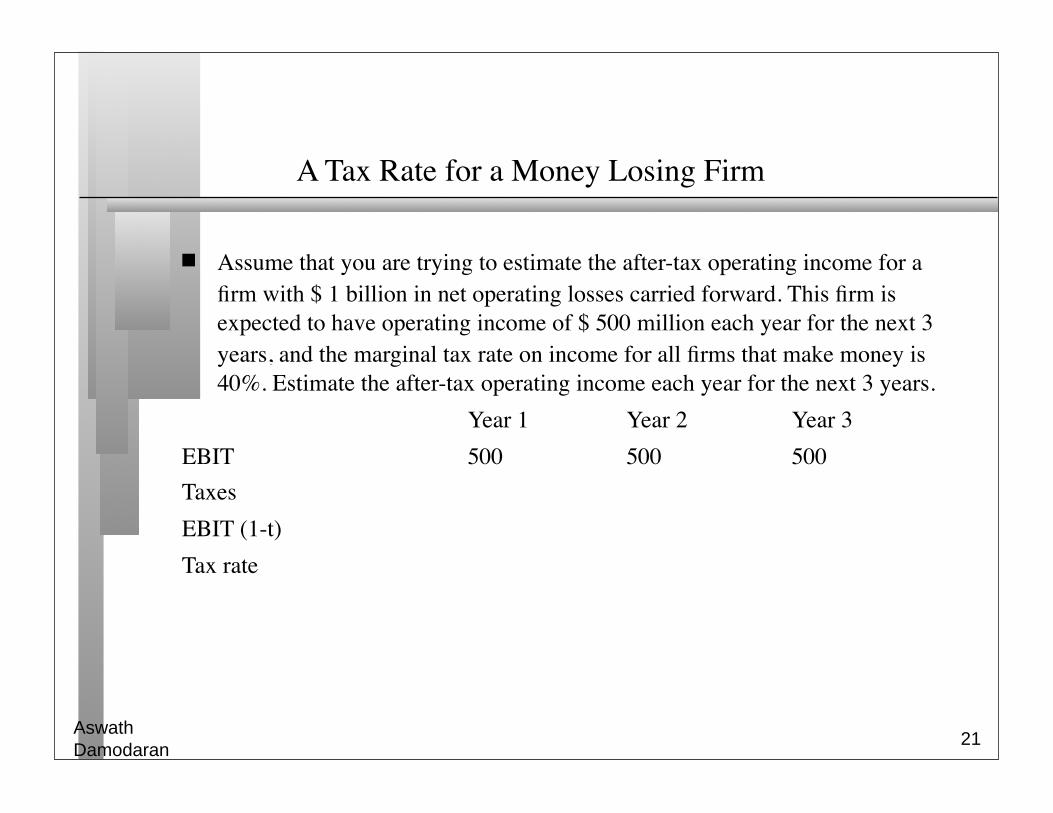
A Tax Rate for a Money Losing Firm
Assume that you are trying to estimate the after-tax operating income for a firm with $ 1 billion in net operating losses carried forward. This firm is expected to have operating income of $ 500 million each year for the next 3 years, and the marginal tax rate on income for all firms that make money is 40%. Estimate the after-tax operating income each year for the next 3 years.
Year 1 Year 2 Year 3EBIT 500 500 500TaxesEBIT (1-t)Tax rate
Aswath Damodaran
22
Net Capital Expenditures
Net capital expenditures represent the difference between capital expenditures and depreciation. Depreciation is a cash inflow that pays for some or a lot (or sometimes all of) the capital expenditures.
In general, the net capital expenditures will be a function of how fast a firm is growing or expecting to grow. High growth firms will have much higher net capital expenditures than low growth firms.
Assumptions about net capital expenditures can therefore never be made independently of assumptions about growth in the future.
Aswath Damodaran
23
Capital expenditures should include
Research and development expenses, once they have been re-categorized as capital expenses. The adjusted net cap ex will be
Adjusted Net Capital Expenditures = Net Capital Expenditures + Current year’s R&D expenses - Amortization of Research Asset
Acquisitions of other firms, since these are like capital expenditures. The adjusted net cap ex will be
Adjusted Net Cap Ex = Net Capital Expenditures + Acquisitions of other firms - Amortization of such acquisitions
Two caveats:1. Most firms do not do acquisitions every year. Hence, a normalized measure of
acquisitions (looking at an average over time) should be used2. The best place to find acquisitions is in the statement of cash flows, usually
categorized under other investment activities
Aswath Damodaran
24
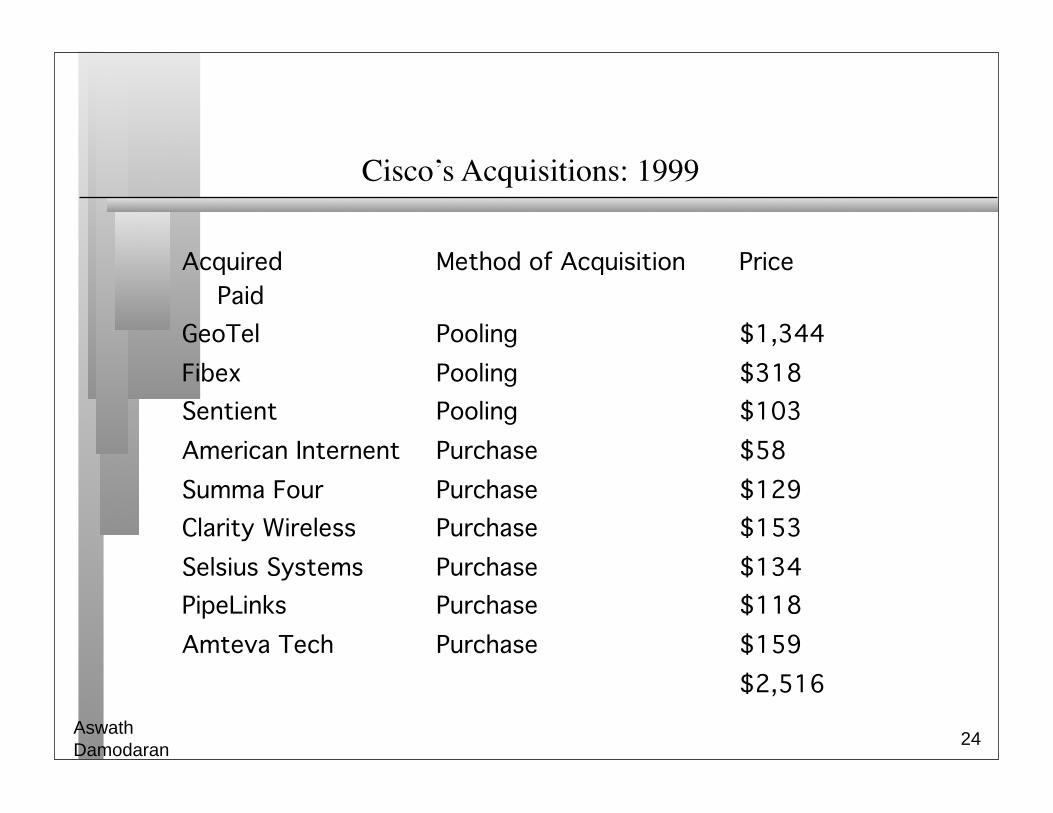
Cisco’s Acquisitions: 1999
Acquired Method of Acquisition Price Paid
GeoTel Pooling $1,344 Fibex Pooling $318 Sentient Pooling $103 American Internent Purchase $58 Summa Four Purchase $129 Clarity Wireless Purchase $153 Selsius Systems Purchase $134 PipeLinks Purchase $118 Amteva Tech Purchase $159 $2,516
Aswath Damodaran
25
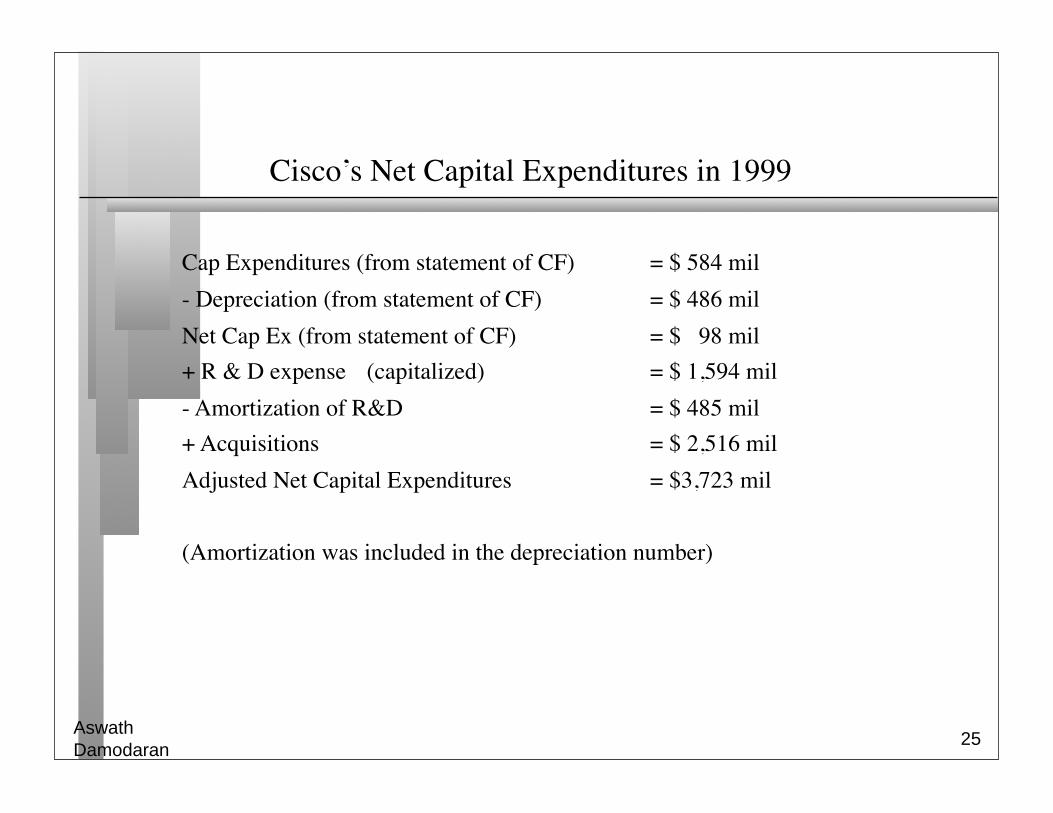
Cisco’s Net Capital Expenditures in 1999
Cap Expenditures (from statement of CF) = $ 584 mil- Depreciation (from statement of CF) = $ 486 milNet Cap Ex (from statement of CF) = $ 98 mil+ R & D expense (capitalized) = $ 1,594 mil- Amortization of R&D = $ 485 mil+ Acquisitions = $ 2,516 milAdjusted Net Capital Expenditures = $3,723 mil
(Amortization was included in the depreciation number)
Aswath Damodaran
26
Working Capital Investments
In accounting terms, the working capital is the difference between current assets (inventory, cash and accounts receivable) and current liabilities (accounts payables, short term debt and debt due within the next year)
A cleaner definition of working capital from a cash flow perspective is the difference between non-cash current assets (inventory and accounts receivable) and non-debt current liabilities (accounts payable)
Any investment in this measure of working capital ties up cash. Therefore, any increases (decreases) in working capital will reduce (increase) cash flows in that period.
When forecasting future growth, it is important to forecast the effects of such growth on working capital needs, and building these effects into the cash flows.
Aswath Damodaran
27
Working Capital: General Propositions
Changes in non-cash working capital from year to year tend to be volatile. A far better estimate of non-cash working capital needs, looking forward, can be estimated by looking at non-cash working capital as a proportion of revenues
Some firms have negative non-cash working capital. Assuming that this will continue into the future will generate positive cash flows for the firm. While this is indeed feasible for a period of time, it is not forever. Thus, it is better that non-cash working capital needs be set to zero, when it is negative.
Aswath Damodaran
28
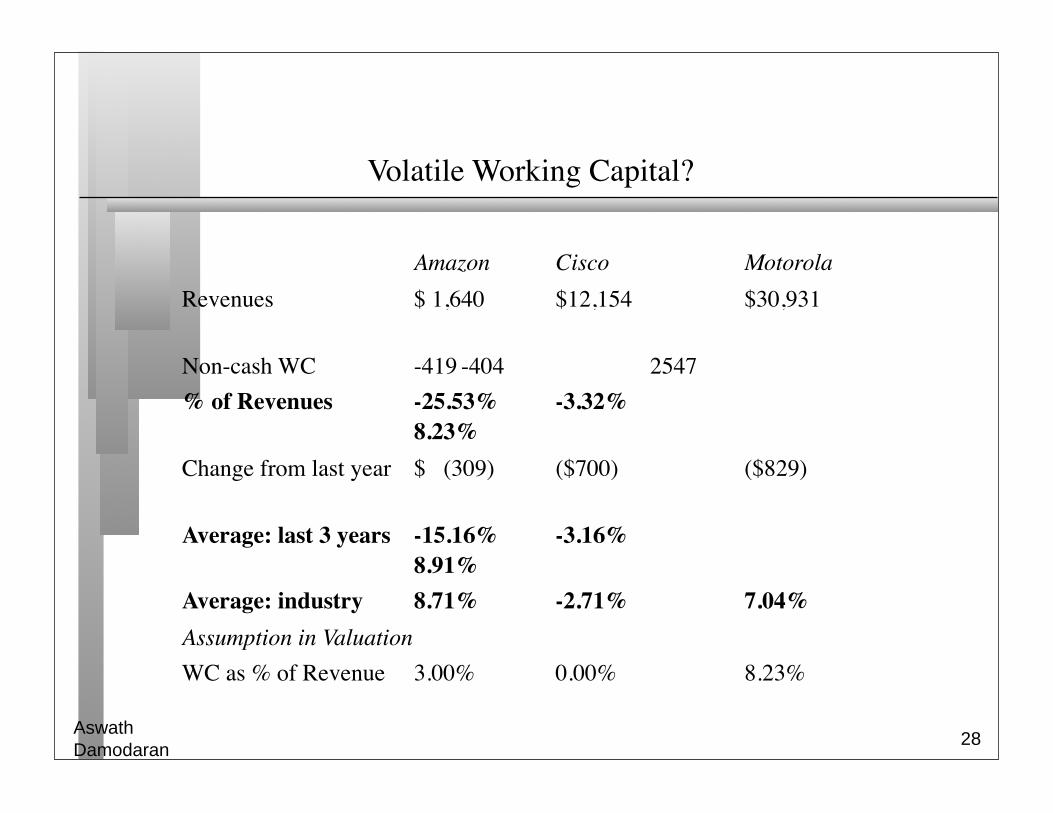
Volatile Working Capital?
Amazon Cisco Motorola Revenues $ 1,640 $12,154 $30,931
Non-cash WC -419 -404 2547 % of Revenues -25.53% -3.32% 8.23%
Change from last year $ (309) ($700) ($829)
Average: last 3 years -15.16% -3.16% 8.91%
Average: industry 8.71% -2.71% 7.04% Assumption in ValuationWC as % of Revenue 3.00% 0.00% 8.23%
Aswath Damodaran
29
Dividends and Cash Flows to Equity
In the strictest sense, the only cash flow that an investor will receive from an equity investment in a publicly traded firm is the dividend that will be paid on the stock.
Actual dividends, however, are set by the managers of the firm and may be much lower than the potential dividends (that could have been paid out)
• managers are conservative and try to smooth out dividends• managers like to hold on to cash to meet unforeseen future contingencies and
investment opportunities When actual dividends are less than potential dividends, using a model that
focuses only on dividends will under state the true value of the equity in a firm.
Aswath Damodaran
30
Measuring Potential Dividends
Some analysts assume that the earnings of a firm represent its potential dividends. This cannot be true for several reasons:
• Earnings are not cash flows, since there are both non-cash revenues and expenses in the earnings calculation
• Even if earnings were cash flows, a firm that paid its earnings out as dividends would not be investing in new assets and thus could not grow
• Valuation models, where earnings are discounted back to the present, will over estimate the value of the equity in the firm
The potential dividends of a firm are the cash flows left over after the firm has made any “investments” it needs to make to create future growth and net debt repayments (debt repayments - new debt issues)
• The common categorization of capital expenditures into discretionary and non-discretionary loses its basis when there is future growth built into the valuation.
Aswath Damodaran
31
Estimating Cash Flows: FCFE
Cash flows to Equity for a Levered Firm Net Income - (Capital Expenditures - Depreciation) - Changes in non-cash Working Capital - (Principal Repayments - New Debt Issues) = Free Cash flow to Equity
• I have ignored preferred dividends. If preferred stock exist, preferred dividends will also need to be netted out
Aswath Damodaran
32
Estimating FCFE when Leverage is Stable
Net Income - (1- δ) (Capital Expenditures - Depreciation) - (1- δ) Working Capital Needs = Free Cash flow to Equityδ = Debt/Capital RatioFor this firm,
• Proceeds from new debt issues = Principal Repayments + δ (Capital Expenditures - Depreciation + Working Capital Needs)
In computing FCFE, the book value debt to capital ratio should be used when looking back in time but can be replaced with the market value debt to capital ratio, looking forward.
Aswath Damodaran
33
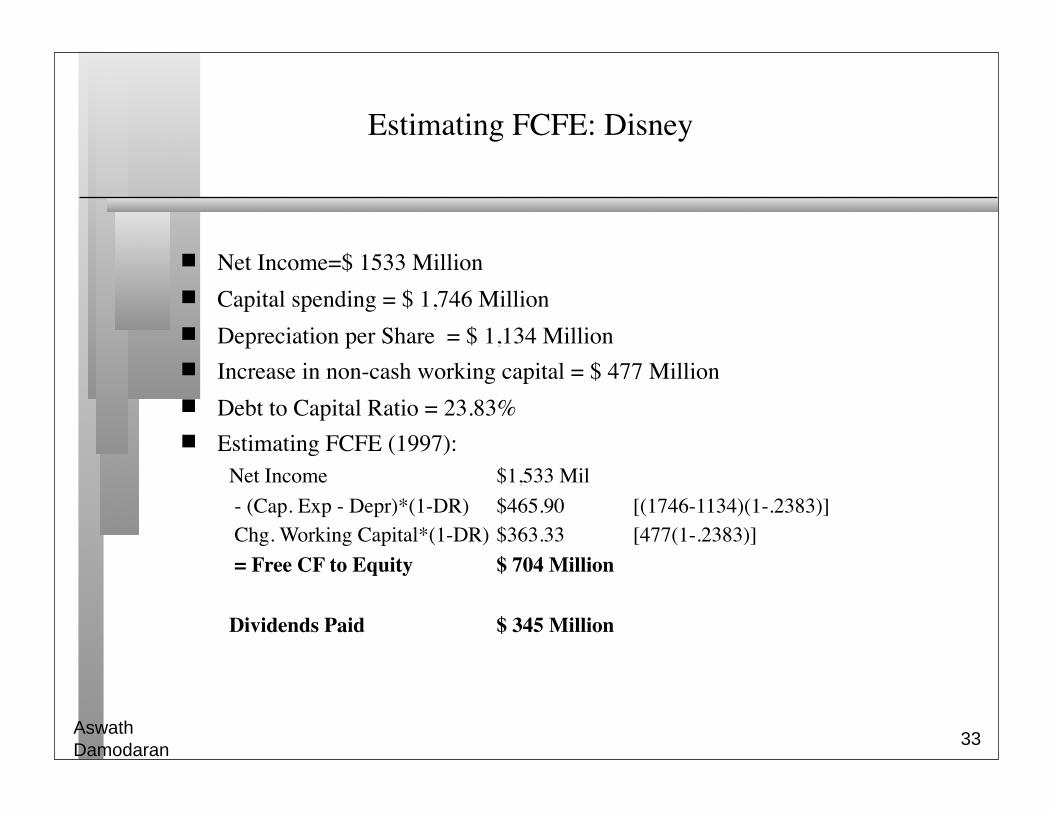
Estimating FCFE: Disney
Net Income=$ 1533 Million Capital spending = $ 1,746 Million Depreciation per Share = $ 1,134 Million Increase in non-cash working capital = $ 477 Million Debt to Capital Ratio = 23.83% Estimating FCFE (1997):
Net Income $1,533 Mil - (Cap. Exp - Depr)*(1-DR) $465.90 [(1746-1134)(1-.2383)] Chg. Working Capital*(1-DR) $363.33 [477(1-.2383)] = Free CF to Equity $ 704 Million
Dividends Paid $ 345 Million
Aswath Damodaran
34
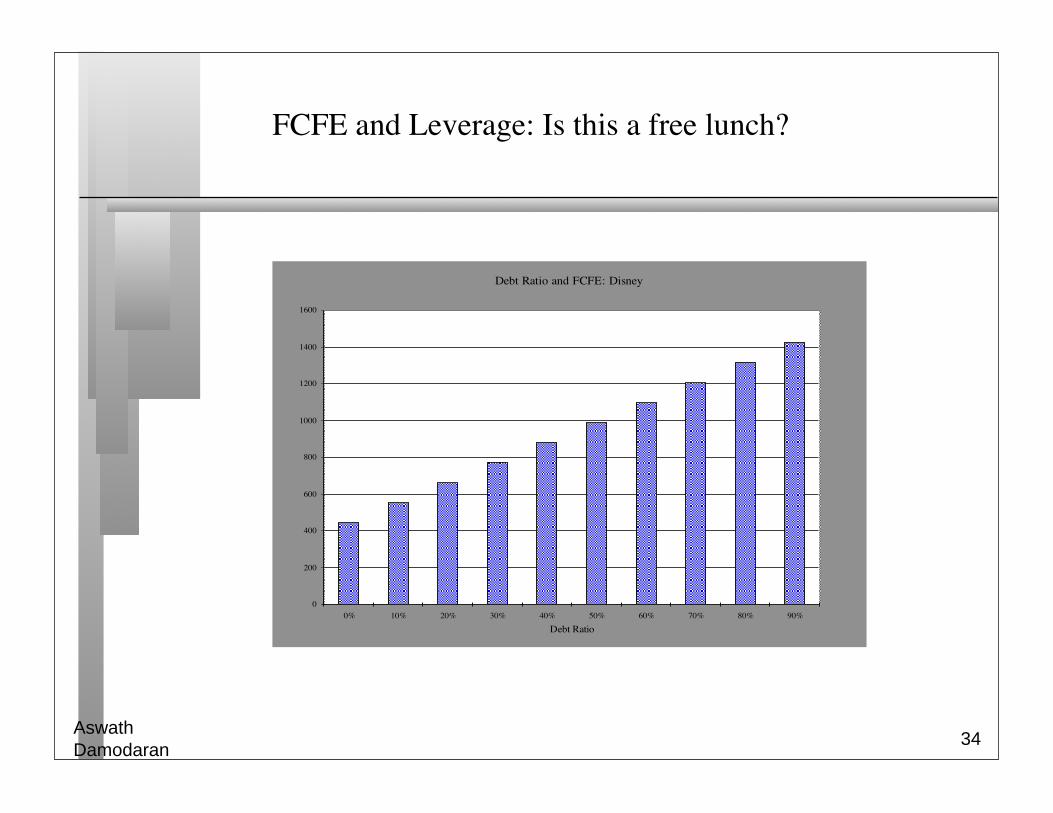
FCFE and Leverage: Is this a free lunch?
Aswath Damodaran
35
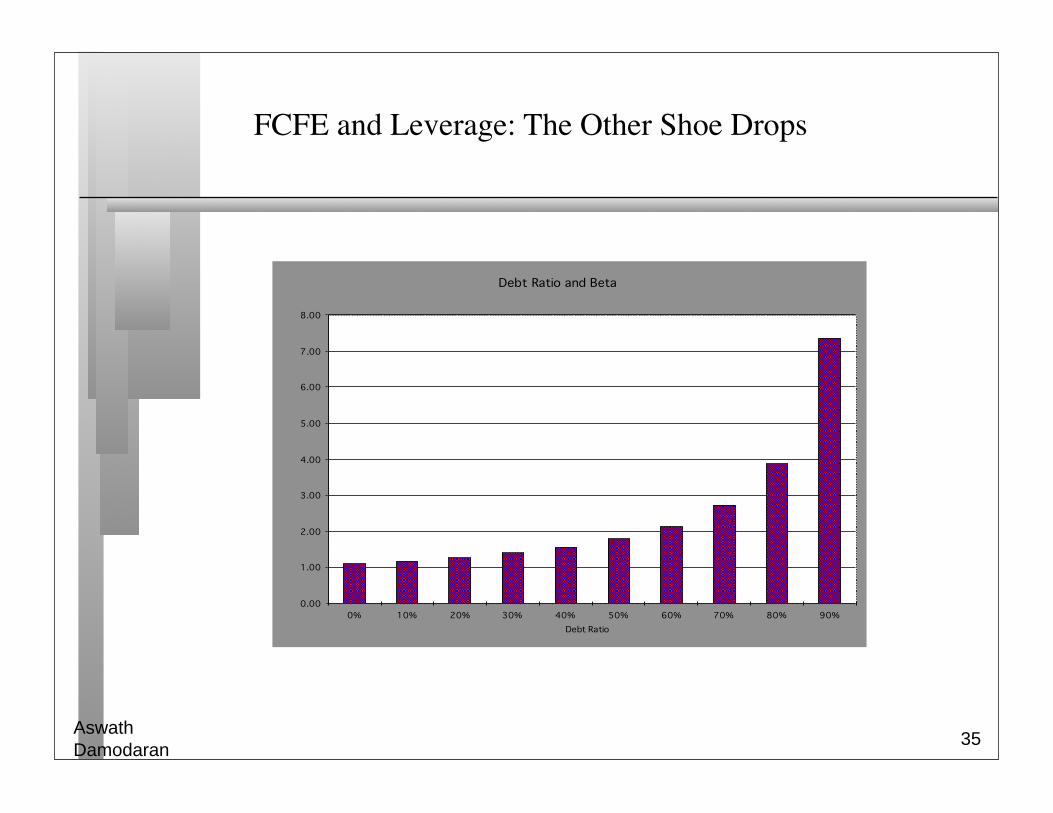
FCFE and Leverage: The Other Shoe Drops
Aswath Damodaran
36
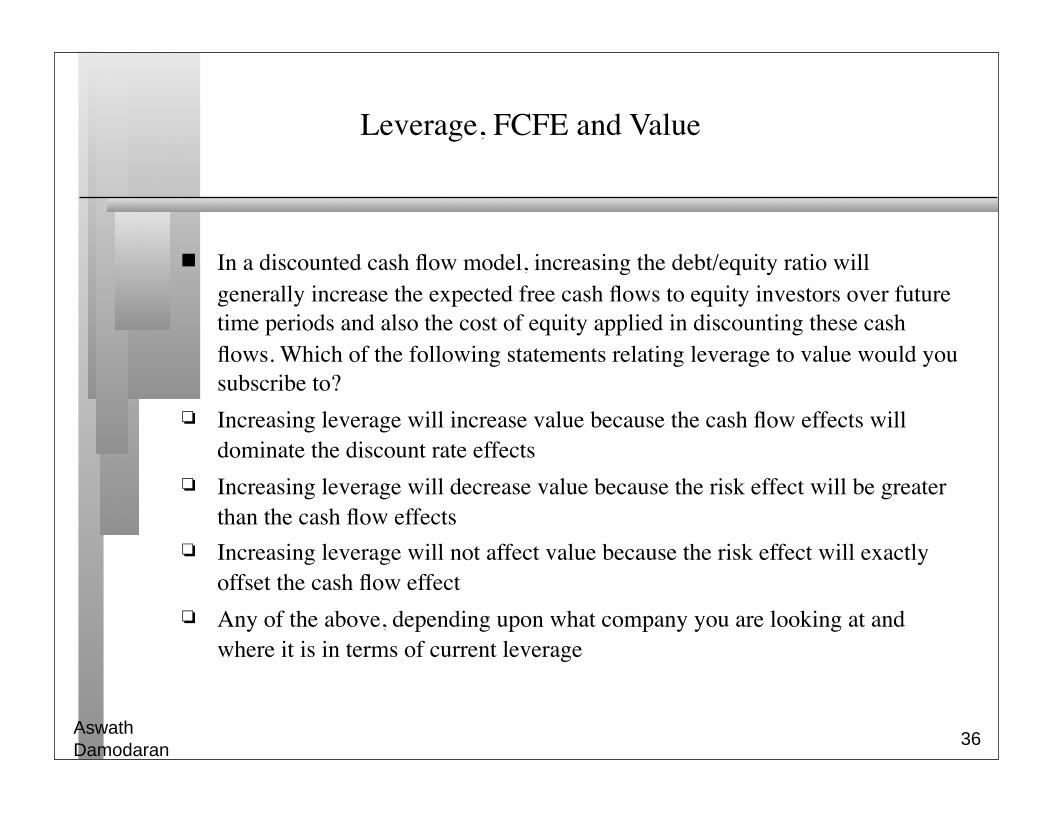
Leverage, FCFE and Value
In a discounted cash flow model, increasing the debt/equity ratio will generally increase the expected free cash flows to equity investors over future time periods and also the cost of equity applied in discounting these cash flows. Which of the following statements relating leverage to value would you subscribe to?
Increasing leverage will increase value because the cash flow effects will dominate the discount rate effects
Increasing leverage will decrease value because the risk effect will be greater than the cash flow effects
Increasing leverage will not affect value because the risk effect will exactly offset the cash flow effect
Any of the above, depending upon what company you are looking at and where it is in terms of current leverage