estimating mean body masses of marine mammals from …
TRANSCRIPT

886
Estimating mean body masses of marinemammals from maximum body lengths
Andrew W. Trites1 and Daniel Pauly
Abstract: Generalized survival models were applied to growth curves published for 17 species of cetaceans (5 mysticetes,12 odontocetes) and 13 species ofpinnipeds (1 odobenid, 4 otariids, 8 phocids). The mean mass of all individuals in thepopulation was calculated and plotted against the maximum body length reported for each species. The data showed stronglinearity (on logarithmic scales), with three distinct clusters of points corresponding to the mysticetes (baleen whales),odontocetes (toothed whales), and pinnipeds (seals, sea lions, and walruses). Exceptions to this pattern were the sperm whales,which appeared to be more closely related to the mysticetes than to the odontocetes. Regression equations were applied to themaximum lengths reported for 76 species of marine mammals without published growth curves. Estimates of mean body masswere thus derived for 106 living species of marine manunals.
Resume: Des modeles generalises de survie ont ete appliques aux courbes de croissance publiees de 17 especes de cetaces(5 mysticetes, 12 odontocetes) et 13 especes de pinnipedes (1 odoMnide, 4 otariides, 8 phocides). La masse moyenne de tousles individus de la population a ete calcuIee et confrontee, dans un diagramme, ala longueur corporelle maximale de chaqueespece. Les diagrammes ont mis en lumiere une forte Iinearite (sur des echelles logarithmiques) et regroupe trois nuagesdistincts de points correspondant aux mysticetes (baleines afanons), aux odontocetes (baleines adents) et aux pinnipedes(phoques, otaries et morses). Les cachalots font exception dans cette classification, puisqu'ils se rapprochent plus desmysticetes que des odontocetes. Des equations de regression ont permis de determiner la masse moyenne de 76 especes demammiferes marins alongueur maximale connue, mais dont les courbes de croissance n'ontjamais ete publiees. Nous avonsdonc pu obtenir I'estimation de la masse moyenne chez 106 especes vivantes de mammiferes marins.[Traduit par la Redaction]
Methods
The functional relationship between the maximum body length of agiven species, Lmax and the mean mass of all individuals in the population, M, is expressed as
[I] M=aL~ax
Maximum body lengths were assumed to be the longest recorded froma given population with known growth curves (Appendix). Maximumlengths of species without growth curves were taken primarily fromKlinowska (1991), McLaren (1993), and Jefferson et al. (1993).
Mean mass equalled the total biomass of all age-classes dividedby the total population size:
The following outlines a method for estimating the meanmasses of marine mammal populations from measurements ofmaximum body length, and is based upon the strong correlations that exist among growth rate, survival, longevity, andmaximum length. We regress maximum length against meanmass for 30 species with known growth curves (13 pinnipedsand 17 cetaceans), then apply these equations to the longestbody lengths reported for an additional 76 species. Estimatesofmean mass are thus derived for 106 living species ofmarinemammals, and the relationships between growth rate, survival, longevity, and maximum length are briefly explored interms of the energy needs and functional evolution of marinemammals.
Introduction
Knowing the amount of living matter is fundamental toassessing energy fluxes within ecosystems. One of the keyparameters required for estimating the amount of food eatenby marine mammals occupying the top trophic layers of theworld's oceans is biomass. The simplest way to estimate thetotal food consumption of a population is to multiply themean individual body mass by the total population size andrelative ration (e.g., Trites et al. 1997). Mean body massescan, in tum, be calculated from life tables and growth curves.
Unfortunately, mean masses cannot be directly calculatedfor many marine mammals because growth curves have onlybeen constructed for about 30 of the living species, and lifetables are available for even fewer. In a number of species, little more is known about their morphology than a few measurements of body length.
Received January 15, 1997. Accepted November 19,1997.
A.W. Trites.1 Marine Mammal Research Unit, Fisheries Centre,and Department ofZoology, University ofBritish Columbia, 2204Main Mall,Vancouver, BC V6T IZ4, Canada.D. Pauly. International Center for Living Aquatic ResourcesManagement, Manila, Philippines, and Fisheries Centre, University of British Columbia, 2204 Main Mall, Vancouver, BC V6TIZ4, Canada.
Author to whom all correspondence should be addressed(e-mail: [email protected]).
Can. J. Zoo!' 76: 886-896 (1998)
[2]
n
I NxMx- .AlM=---
© 1998 NRC Canada

Trites and Pauly
Table 1. Parameters for the general survival models (eq. 3) ofmale and female pinnipeds (PI and Pz) and cetaceans (CI and Cz).Model PI describes the survival of male pinnipeds with strongsexual dimorphism (elephant seals, sea lions, and fur seals);model Pz was applied to all female pinnipeds and allnon-dimorphic male pinnipeds.
Northern fur seals Humans/cetaceansModel
variable F M F M
a l 14.343 8.857 21.274 23.969az 0.171 2.419 0.420 0.383aJ 0.012 0.044 0.011 0.016b l 10.259 11.821 78.936 73.142bz 6.688 4.398 6.766 6.252Q 19 13 81 78
Model Pz PI Cz CI
where Mx is the mean mass of an individual aged x years, Nx is thenumber of individuals of age x alive, and n is the maximum ageattained. N.< can be replaced in eq. 2 with life-table values of l< (theprobability of an individual surviving to age x), given that these twovariables are proportional to each other.
The functional relationship between maximum length and meanmass of all individuals in a population (eq. I) was thus derived fromthe known growth curves of 30 species, then used to predict the meanmasses of an additional 76 species of marine mammals from theirmaximum recorded body lengths.
Life tablesAge-specific survival rates were calculated using Siler's (1979)model as described by Barlow and Boveng (1991). The probability ofsurviving to a given age Ux) is expressed as a function of three components: an exponentially decreasing risk with age of dying fromsources of juvenile mortality (~.J; an exponentially increasing riskdue to mortality factors associated with senescence Us); and an ageindependent base mortality Uc•x)' Thus,
[3] lx = ~,x ls,x lc,x
where
[4] ~,x = exp{(-a/b[)[1 - exp(-b[x/Q)]}
[5] ls,x = exp{(-a3/b3)[1 - exp(-b3x/Q)]}
and
[6] lc,x = exp[(-a2x/Q)]
Age is expressed as a fraction oflongevity (Q) to produce a generalmodel that can be applied over a wide range of life-spans. Longevityis here defined as the 99th percentile of the age distribution ofa sample (i.e., only 1% of the sample is older than Q; Barlow and Boveng1991).
We derived separate, sex-specific general models of survivorshipfor pinnipeds and cetaceans as per Barlow and Boveng (1991). Thepinniped survival curves were calculated from the sampled age distribution ofnorthern fur seals tabulated by Lander (1981) for males andby Smith and Polacheck (1981) for females. Longevity was estimated to be 13 and 19 years for males and females, respectively. Asper Barlow and Boveng (1991), an alternative-model life table wascalculated for cetaceans, using age-stmcture data from humans (circa1900; Merriam 1902) because insufficient data were available forcetaceans and because humans share life-history traits with cetaceans. Human longevity was estimated at 78 years for males and 81years for females.
887
We calculated the probability of surviving to a given age for malefur seals and for male and female humans/cetaceans by fitting eq. 3to their respective age distributions, using the Nonlin SimplexAlgorithm (SYSTAT 1988). Survival parameters for female fur sealswere taken from Barlow and Boveng (1991).
Growth curves and longevityGrowth curves showing changes in body mass of 30 species ofmarine mammals were compiled from published sources (see theAppendix for details). In a few cases, body mass was estimated fromlength curves, using M< = a L;. A potential confounding factor, atleast among some male pinnipeds, was seasonal fattening associatedwith breeding. We therefore tried to establish the mean mass of anage-class over the course of a year, or failing this, we used conservative estimates (i.e., postbreeding masses).
Longevity was calculated for most species from the age stmctureof the samples used to constmct their growth curves, using the 99thpercentile mle. For some species of cetaceans, however, estimates oflongevity were taken from Ohsumi (1979) and were based on earpluggrowth layers or on maximum number ofcorpora, ovulation rate, andage at sexual maturity.
Results
Parameter estimates for the general models of pinniped andcetacean survivorship are given in Table 1. Estimates of meanmass for the 30 species of marine mammals with knowngrowth curves are contained in Table 2, along with estimatesof their longevity and maximum recorded body lengths.These 30 pairs of points (masses and lengths) were plotted onlogarithmic scales (Fig. 1). The data show strong linearity,with three distinct clusterings of points corresponding to themysticetes (baleen whales), odontocetes (toothed whales),and pinnipeds (seals, sea lions, and walruses). Within malepinnipeds, however, there were two distinct groupings relatedto the presence or absence of strong sexual dimorphism inbody size (Fig. 1). Only one species, the sperm whale (No.6in Fig. 1), did not fit within its family grouping. Spermwhales appear to be more closely related to the mysticetesthan to the odontocetes (see below), and were thus pooledwith the former for regression analysis.
The linear regressions fitted to each of the grouped datawere all highly significant (Table 3). Figure 2 shows the slopeof the regressions plotted against their intercept. Estimates ofmean population body mass were derived for the 76 speciesof marine mammals without growth curves by applying theregression equations to maximum recorded body lengths(Table 4).
Discussion
The 30 estimates of mean body mass (Table 2) were based ongrowth and survival curves constructed from relatively largesamples, and should be reliable. However, the reliability ofthe mean masses estimated for the 76 species without growthcurves, such as the beaked whales, depends upon the singlemeasurements of body length reported as their maximumlength. Such estimates will undoubtedly be refined as moredata are collected from stranded and incidentally caughtmarine mammals.
We were not able to substantiate the maximum lengthsreported in the species compilations by Klinowska (1991) andJefferson et al. (1993). Original data sources should be con-
© 1998 NRC Canada

888 Can. J. Zool. Vol. 76, 1998
Table 2. Estimates of longevity, maximum length, and mean body mass for 30 species of marine mammals withknown growth curves (for details see the Appendix).
Longevity"(years) Max. length (em) Mean mass (kg) Group
No. Species F M F M F M F M
Balaenopteridae
I Blue whale 100 100 3358 3190 110 126 95347 A A2 Fin whale 98 98 2700 2500 59819 51 361 A A3 Sei whale 69 69 1800 1710 17387 16235 A A4 Humpback whale 75 75 1860 1768 32493 28323 A A5 Minke whale 47 47 1070 980 7 Oil 6 121 A A
Physeteridae
6 Sperm whale 69 69 1200 1800 10 098 26939 A A
Monodontidae
7 White whale 32 36 420 460 289 337 B B
Delphinidae
8 Killer whale 50 50 850 980 1 974 2587 B B9 Long-finned pilot whale 45 38 570 762 672 1 029 B B
10 Short-finned pilot whale 45 45 550 610 467 819 B B11 Bottlenose dolphin 47 47 367 381 172 203 B B12 Striped dolphin 30 32 253 260 115 117 B B13 Spotted dolphin 35 42 218 223 59.1 71.7 B B14 Spinner dolphin 17 18 196 197 39.5 43.1 B B15 Hector's dolphin 19 20 153 138 36.7 29.8 B B
Phocoenidae
16 Harbour porpoise 13 13 189 178 32.6 29.5 B B
Platanistidae
17 Franciscana dolphin 12 9 171 152 31.3 22.3 B B
Odobenidae
18 Walrus 29 36 312 356 530 643 C C
Phocidae
19 Bearded seal 30 30 265 250 200 200 C C20 Weddell seal 14 13 265 262 162 154 C C21 Grey seal 39 27 235 265 152 168 C C22 Harp seal 26 26 192 192 92.2 92.2 C C23 Harbour seal 31 28 170 190 58.4 68.8 C C24 Ringed seal 28 27 158 165 40.7 44.3 C C25 Southern elephant seal 17 12 304 490 327 543 C D26 Northern elephant seal 17 13 282 415 330 412 C D
Otariidae
27 Steller sea lion 22 14 247 330 186 214 C D28 Northern fur seal 19 13 147 208 25.3 30.2 C D29 Subantarctic fur seal 23 18 143 181 24.6 30.1 C D30 Antarctic fur seal 16 11 141 198 22.7 30.7 C D
Note: Mean masses were determined by applying the survival models (Table 1) to the growth data (Appendix). Speciesgroupings (A-D) were assigned according to the grouped relationships between mean mass and maximum length shown in Fig. 1.
"Given as the 99th percentile.
sulted wherever possible, given the wide range of unsubstan- humpback whale that was actually a fin whale (data suggesttiated maximum lengths reported for many marine mammals that the maximum length of a humpback whale is 61 ft;on the World Wide Web and in the published literature. Hump- Clapham et al. 1997).back whales, for example, have been reported to have a wide The maximum length used should be the length of a mem-range of maximum lengths. Unfortunately, a number of the ber of the general population and not that of a giant or freakcited lengths are incorrect, such as the 75-ft ( 1 ft = 0.305 m) of nature. One approach to safeguarding against choosing an
© 1998 NRC Canada

Trites and Pauly 889
Fig. 1. Relationship between mean body mass and maximum body length for 30 species ofmysticetes (Nos. 1-5) (A), odontocetes (Nos. 7-17)(B), and pinnipeds (Nos. 18-30) (C). Male pinnipeds (C and D) include those with and without sexual dimorphism (lower and upper line,respectively). Species numbers and group letters correspond to those in Table 2 and the Appendix. Circled data points denote male and femalespenn whales (No.6) among the baleen whales.
Y. 4~• 3
5
89
107
11121314
151617
Males
. .
Cetaceans
Pinnipeds
1000 C
f:• 18 --ffi--2S--
I26 25 2627 19 1921 27
100 21 20 2022 2223 2324 28 D 24 293028
10 30 29
100 1000 100 1000
Females
100 000 Cetaceans y 1243
10 000 65
• 81 000
B9- 10
0) 7.::£ 11--en 100 12
en 13CO 15 14
:a: 101716
>.-g 100 000 Pinnipeds
COcCO 10 000Q)
:a:
Maximum Length (em)
Table 3. Linear regression coefficients describing the relationship loge A1.ncao = a + b loge Lmax>where mass is measured in kilograms and length in centimetres.
Group Species Sex a b SEb r n
A Mysticetes M -7.347 2.329 0.450 0.971 6A Mysticetes F -7.503 2.347 0.454 0.985 6B Odontocetes M -8.702 2.382 0.310 0.978 11B Odontocetes F -9.003 2.432 0.349 0.970 11C Pinnipeds (monomorphic) M -12.609 3.217 0.571 0.982 7C Pinnipeds (all) F -14.265 3.532 0.420 0.974 13D Pinnipeds (dimorphic) M -13.732 3.259 0.473 0.982 6
Note: Regressions were run on the data groupings shown in Fig. 1. They correspond to baleen whales(mystieates), toothed whales (odontoeetes), and pinnipeds (otariids, phoeids, and odobenids). Male pinnipedswere split between dimorphic and non-dimorphic species. Note the low standard errors of the estimatedslopes (SEb).
unrepresentative individual may be to apply the 99th percentile rule to length distributions (such as to those plotted inMcLaren 1993). Maximum lengths may also vary amongstocks and subspecies with known size differences and could
be used with our regressions (Table 3) to predict corresponding mean masses.
The biomass of an entire population equals the mean bodymass (Tables 2 and 4) multiplied by the total population num-
© 1998 NRC Canada

890 Can. J. Zool. Vol. 76, 1998
Table 4. Maximum body lengths (from Klinowska 1991; Mclaren 1993; Jefferson et al. 1993)and estimated mean body masses for 76 species of marine mammals calculated using one of the
. sex-specific regression equations shown in Table 3 (groups A-D).
Max. length (cm) Group Mean mass (kg)
Species F M F M F M
Balaenidae
Northern right whale 1830 1710 A A 24960 21 805Southern right whale 1650 1520 A A 19576 16574Bowhead whale 2000 2000 A A 30745 31406
Eschrichtidae
Gray whale 1500 1460 A A 15 653 15090
Balaenopteridae
Bryde's whale 1550 1472 A A 16905 15 381
Ziphiidae
Tasman beaked whale 660 700 B B 886 789Arnoux's beaked whale 885 960 B B I 809 I 656Baird's beaked whale 1200 1140 B B 3794 2479Longman's beaked whale 750 750 B B I 210 928Sowerby's beaked whale 505 550 B B 462 448Blainville's beaked whale 471 580 B B 390 508Gervais's beaked whale 520 456 B B 496 289Strap-toothed whale 615 584 B B 746 516Hector's beaked whale 443 430 B B 336 252Gray's beaked whale 533 564 B B 527 475Stejneger's beaked whale 525 525 B B 508 402Andrews' beaked whale 457 467 B B 363 305True's beaked whale 510 533 B B 473 416Ginkgo-toothed beaked whale 490 477 B B 430 321Hubb's beaked whale 532 532 B B 525 414Pygmy beaked whale 352 370 B B 192 177Cuvier's beaked whale 660 693 B B 886 771Northern bottlenose whale 850 980 B B I 640 I 738Southern bottlenose whale 780 714 B B I 331 827
Physeteridae
Pygmy spenn whale 340 340 B B 177 177Dwarf spenn whale 270 270 B B 101 101
Monodontidae
Narwhal 400 470 B B 262 388
Delphinidae
Rough-toothed dolphin 255 265 B B 87.7 96.3Tucuxi 182 182 B B 38.6 38.6Indo-Pacific hump-backed
dolphin 244 320 B B 78.8 152Atlantic hump-backed dolphin 235 248 B B 71.9 82.0Irrawaddy dolphin 232 275 B B 69.7 105Melon-headed whale 275 273 B B 105 104Pygmy killer whale 243 287 B B 78.0 117False killer whale 506 596 B B 464 692White-beaked dolphin 305 315 B B 136 147Atlantic white-sided dolphin 243 275 B B 78.0 105Dusky dolphin 193 211 B B 44.6 55.3Hourglass dolphin 183 163 B B 39.2 29.5Peale's dolphin 216 216 B B 58.6 58.6Pacific white-sided dolphin 236 250 B B 72.7 83.6Fraser's dolphin 264 264 B B 95.4 95.4
© 1998 NRC Canada

Trites and Pauly 891
Table 4 (concluded).
Max. length (cm) Group Mean mass (kg)
Species F M F M F M
Risso's dolphin 366 383 B B 211 236.Atlantic spotted dolphin 229 226 B B 67.5 65.4Clymene dolphin 197 197 B B 46.8 46.8Common dolphin 230 260 B B 68.3 92.0Southern right whale dolphin 230 210 B B 68.3 54.7Northern right whale dolphin 230 310 B B 68.3 141Heaviside's dolphin 170 170 B B 32.7 32.7Black dolphin 165 167 B B 30.4 31.3Commerson's dolphin 163 158 B B 29.5 27.3
PhocoenidaeVaquita 150 140 B B 24.1 20.4Burmeister's porpoise 189 189 B B 42.3 42.3Spectacled porpoise 204 224 B B 51.0 64.0Dall's porpoise 220 220 B B 61.3 61.3Fin1ess porpoise 181 190 B B 38.1 42.9
PhocidaeLarga seal 160 170 C C 38.9 50.0Ribbon seal 190 190 C C 71.4 71.5Hooded seal 230 285 C D 140 109Mediterranean monk seal 280 280 C C 281 249Hawaiian monk seal 240 210 C C 163 98.6Crabeater seal 260 260 C C 216 196Ross seal 240 228 C C 163 128Leopard seal 338 320 C C 546 382
OtariidaeCalifornia sea lion 200 240 C D 85.6 62.1South American sea lion 220 280 C D 120 103Australian sea lion 180 250 C D 59.0 70.9Hooker's sea lion 200 330 C D 85.6 175Guadalupe fur seal 140 190 C D 24.3 29.0Juan Fernandez fur seal 150 210 C D 31.0 40.2Galapagos fur seal 130 160 C D 18.7 16.6South American fur seal 150 190 C D 31.0 29.0South African fur seal 180 230 C D 59.0 54.0Australian fur seal 180 230 C D 59.0 54.0New Zealand fur seal 150 200 C D 31.0 34.3
Note: The species names and their sequence follow those in Jefferson et al. (1993).
ber, and includes all age categories (from the newborn to thesenescent). Estimating the mean mass of one component of apopulation, such as adult males in a population of Californiasea lions, would thus require a new set of calculations usingeq. 2. Sex ratios of the entire population, as determined fromthe survival models (Table 1), were approximately 50% forall species except the sexually dimorphic species, which had apopulation sex ratio of 40% males and 60% females. Thismeans, for example, that the biomass of 1 million northern furseals with 60% females would be 27 000 t (i.e., 0.6 x1 000 000 x 25.3 + 0.4 x 1 000 000 x 30.2).
The relationship we established between mean body massand maximum length (Fig. 1) supports the traditional separation of whales into two suborders (Barnes et al. 1985;
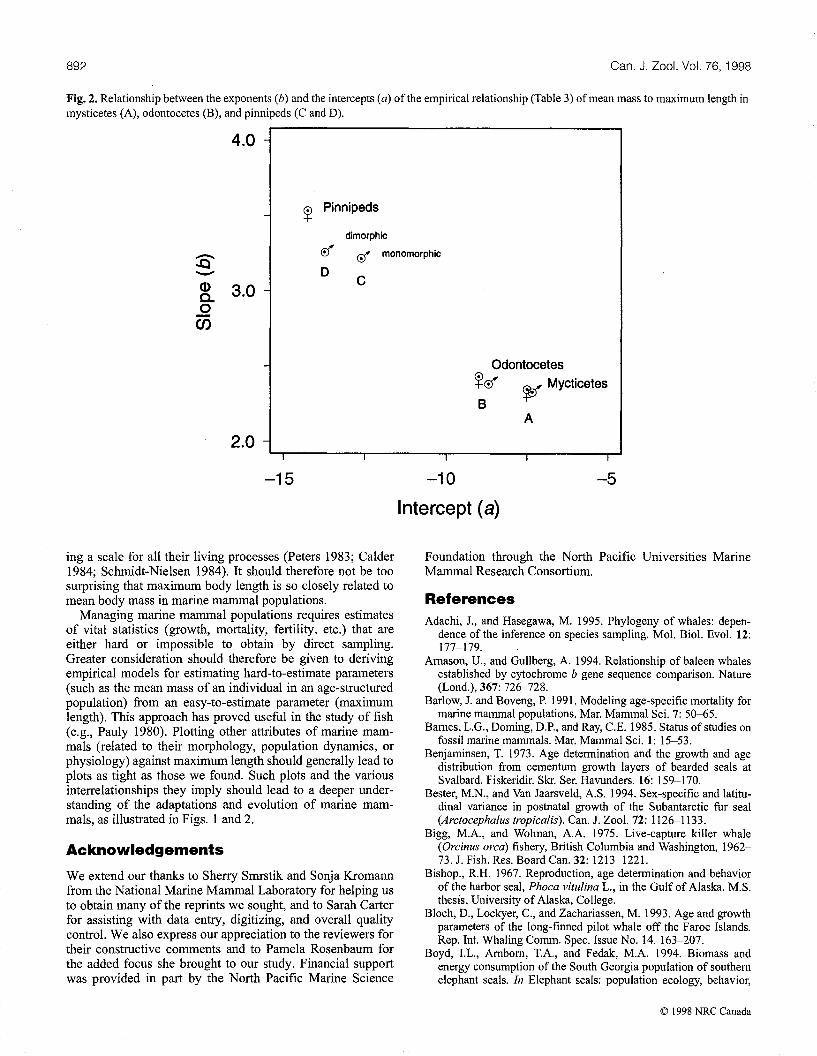
Novachek 1992, 1993), with one exception. Our data suggestthat sperm whales are more closely related to the baleenwhales than to other toothed whales, and are in agreementwith recent molecular phylogeny (Milinkovitch et al. 1993,1994, 1995; Amason and Gullberg 1994; Adachi and Hasegawa 1995). The exponents of our maximum length - meanmass relationship for each of the taxonomic orders (Table 3,Fig. 2) ranged from 2.3 to 3.5 and imply sex and taxonomicdifferences in the balance between growth and survivalamong different groups of marine mammals (as expressed byeq. 1). These exponents should not be confused with those oftraditional length-mass relationships, which often have avalue near 2.8.
Size is an important attribute of individual animals, provid-
© 1998 NRC Canada
892 Can. J. Zool. Vol. 76, 1998
Fig. 2. Relationship between the exponents (b) and the intercepts (a) of the empirical relationship (Table 3) ofmean mass to maximum length inmysticetes (A), odontocetes (B), and pinnipeds (C and D).
4.0 -
- ~Pinnipeds
dimorphic
JS0" 0" monomorphic-- D
Q) 3.0 -c
a...Qen
- Odontocetes~0" $f MycticetesB
A
IIIII
2.0 -~----.,.------r----...,...------,.....J
-15 -10
Intercept (a)
-5
ing a scale for all their living processes (Peters 1983; Calder1984; Schmidt-Nielsen 1984). It should therefore not be toosurprising that maximum body length is so closely related tomean body mass in marine mammal populations.
Managing marine mammal populations requires estimatesof vital statistics (growth, mortality, fertility, etc.) that areeither hard or impossible to obtain by direct sampling.Greater consideration should therefore be given to derivingempirical models for estimating hard-to-estimate parameters(such as the mean mass of an individual in an age-structuredpopulation) from an easy-to-estimate parameter (maximumlength). This approach has proved useful in the study of fish(e.g., Pauly 1980). Plotting other attributes of marine mammals (related to their morphology, population dynamics, orphysiology) against maximum length should generally lead toplots as tight as those we found. Such plots and the variousinterrelationships they imply should lead to a deeper understanding of the adaptations and evolution of marine mammals, as illustrated in Figs. 1 and 2.
Acknowledgements
We extend our thanks to Sherry Smrstik and Sonja Kromannfrom the National Marine Mammal Laboratory for helping usto obtain many of the reprints we sought, and to Sarah Carterfor assisting with data entry, digitizing, and overall qualitycontrol. We also express our appreciation to the reviewers fortheir constructive comments and to Pamela Rosenbaum forthe added focus she brought to our study. Financial supportwas provided in part by the North Pacific Marine Science
Foundation through the North Pacific Universities MarineMammal Research Consortium.
ReferencesAdachi, 1, and Hasegawa, M. 1995. Phylogeny of whales: depen
dence of the inference on species sampling. Mol. BioI. Evo!. 12:177-179.
Amason, U., and Gullberg, A. 1994. Relationship of baleen whalesestablished by cytochrome b gene sequence comparison. Nature(Lond.), 367: 726-728.
Barlow, 1 and Boveng, P. 1991. Modeling age-specific mortality formarine mammal populations. Mar. Mammal Sci. 7: 50-65.
Barnes, L.G., Doming, D.P., and Ray, C.E. 1985. Status of studies onfossil marine mammals. Mar. Mammal Sci. 1: 15-53.
Benjaminsen, T. 1973. Age detennination and the growth and agedistribution from cementum growth layers of bearded seals atSvalbard. Fiskeridir. Skr. Ser. Havunders. 16: 159-170.
Bester, M.N., and Van Jaarsve1d, A.S. 1994. Sex-specific and latitudinal variance in postnatal growth of the Subantarctic fur seal(Arctocephalus tropicalis). Can. 1 Zoo!' 72: 1126-1133.
Bigg, M.A., and Wolman, A.A. 1975. Live-capture killer whale(Orcinus orca) fishery, British Columbia and Washington, 196273. J. Fish. Res. Board Can. 32: 1213-1221.
Bishop., R.H. 1967. Reproduction, age detennination and behaviorof the harbor seal, Phoca vitulina L., in the Gulf of Alaska. M.S.thesis, University of Alaska, College.
Bloch, D., Lockyer, c., and Zachariassen, M. 1993. Age and growthparameters of the long-finned pilot whale off the Faroe Islands.Rep. Int. Whaling Comm. Spec. Issue No. 14. 163-207.
Boyd, I.L., Amborn, T.A., and Fedak, M.A. 1994. Biomass andenergy consumption of the South Georgia population of southernelephant seals. In Elephant seals: population ecology, behavior,
© 1998 NRC Canada

Trites and Pauly
and physiology. Edited by B.J. Le Boeuf and R.M. Laws. University of California Press, Berkeley. pp. 98-117.
Braham, H.W. 1984. Review of reproduction in the white whale,Delphinapterus leucas, narwhal, Monodon monoceros, andIrrawaddy dolphin, Orcaella brevirostris, with comments onstock assessment. Rep. Int. Whaling Comm. Spec. Issue No.6.
Brodie, P.F. 1971. A reconsideration of aspects of growth, reproduction, and behavior of the white whale (Delphinapterus leucas),with reference to the Cumberland Sound, Baffin Island, population. J. Fish. Res. Board Can. 28: 1309-1318.
Brown, S.G., and Lockyer, C.H. 1984. Whales. In Antarctic ecology.Vol. 2. Edited by RM. Laws. Academic Press, London. pp. 717781.
Bryden 1986. Age and growth. In Research on dolphins. Edited byM.M. Bryden and R. Harrison. Clarendon Press, Oxford. pp. 211224.
Bryden, M.M., Smith, M.S.R., Tedman, RA., and Featherston, D.W1984. Growth of the Weddell seal, Leptonychotes weddelli (pinnipedia). Aust. 1 Zool. 32: 33--41.
Bums, lJ., and Frost, K.l 1983. The natural history and ecology ofthe bearded seal, Erignathus barbatus. In Environmental assessment of the Alaskan Continental Shelf, Final Report, Outer Continental Shelf Environmental Assessment Program, U.S. Department of Commerce, National Oceanic and Atmospheric Administration, Juneau, Alaska. Vol. 19. pp. 311-392.
Bums, ll, and Seaman, G.A 1985. Investigations of belukhawhales in coastal waters ofwestern and northern Alaska: II. Biology and ecology. Final report prepared for U.S. Department ofCommerce, National Oceanic and Atmospheric Administration,National Ocean Service, Anchorage, Alaska, Contract No.NA81RAC00049. Alaska Department of Fish and Game, Fairbanks.
Calder, WA 1984. Size, function and life history. Harvard University Press, Cambridge, Mass.
Calkins, D., and Goodwin, E. 1988. Investigations of the decliningsea lion population in the Gulf of Alaska. Unpublished reportavailable from the Alaska Department of Fish and Game, 333Raspberry Road, Anchorage, AK 99502, U.S.A.
Calkins, D., and Pitcher, K. 1982. Population assessment, ecologyand trophic relationships of Steller sea lions in the Gulf ofAlaska.In Environmental assessment of the Alaskan Continental Shelf,Final Report, Outer Continental Shelf Environmental AssessmentProgram, U.S. Department of Commerce, National Oceanic andAtmospheric Administration, Juneau, Alaska. Vol. 19. pp. 447546.
Calkins, D., Becker, E.F., and Pitcher, K.W 1998. Reduced bodysize of female Steller sea lions from a declining population in theGulf of Alaska. Mar. Mammal Sci. 14: 232-244.
Clapham, P.l, Leatherwood, S., Szczepaniak, I. and Brownell, R.L.,Jr. 1997. Catches of humpback and other whales from shore stations at Moss Landing and Trinidad, California, 1919-1926. Mar.Mammal Sci. 13: 368-394.
Christensen, I. 1984. Growth and reproduction of killer whales,Orcinus orca, in Norwegian coastal waters. Rep. Int. WhalingComm. Spec. Issue No.6. pp. 253-258.
Clinton, W.L. 1994. Sexual selection and growth in male northernelephant seals. In Elephant seals: population ecology, behavior,and physiology. Edited by B.l Le Boeuf and RM. Laws. University of California Press, Berkeley. pp. 154-168.
Deutsch, C.l, Crocker, D.E., Costa, D.P., and Le Boeuf, B.l 1994.Sex- and age-related variation in reproductive effort of northernelephant seals. In Elephant seals: population ecology, behavior,and physiology. Edited by B.l Le Boeuf and R.M. Laws. University of California Press, Berkeley. pp. 169-210.
Doidge, D.W 1990. Age-length and length-mass comparisons inthe beluga, Delphinapterus leucas. Can. Bull. Fish. Aquat. Sci.No. 224. pp. 59-68.
893
Evans, P.G.H. 1987. The natural history of whales and dolphins.Christopher Helm, London.
Fay, F.H. 1982. Ecology and biology of the Pacific walrus, Odobenus rosmarus divergens IlIiger. N. Am. Fauna, 74.
Gaskin, D.E., Smith, G.lD., Watson, AP., Yasui, WY., and Yurick,D.B. 1984. Reproduction in the porpoises (Phocoenidae): implications for management. Rep. Int. Whaling Comm. Spec. IssueNo.6. pp. 135-148.
Helle, E. 1979. Growth and size of the ringed seal Phoca (Pusa) his.pida Schreber in the Bothnian Bay, Baltic. Z. Saeugetierkd. 44:208-220.
Harkonen, T., and Heide-Jorgensen, M.P. 1990. Comparative lifehistories of East Atlantic and other harbour seal populations.Ophelia, 32: 211-235.
Hayama S. 1985. Developmental change of the Kuril seal. M.S. thesis, Obihiro University of Agriculture and Veterinary Medicine,Obihiro, Hokkaido.
Hazard, K. 1988. Beluga whale (Delphinapterus leucas). InSelected marine mammals of Alaska: species accounts withresearch and management recommendations. Edited by lW.Lentfer. Marine Mammal Commission, Washington, D.C. pp.195-235.
Horwood, lW 1987. The sei whale: population biology, ecologyand management. Croom Helm, London, New York, and Sydney.
Innes, S., Stewart, RE.A, and Lavigne, D.M. 1981. Growth in northwest Atlantic harp seals Phoca groenlandica. 1 Zool. (19651984),194: 11-24.
Jefferson, T.A, Leatherwood, S., and Webber, M.A. 1993. FAO species identification guide. Marine mammals of the world. UnitedNations Environment Programme, Food and Agriculture Organization of the United Nations, Rome.
Kasuya, T. 1976. Reconsideration of life history parameters of thespotted and striped dolphins based on cemental layers. Sci. Rep.Whales Res. Inst. (Tokyo), 28: 73-106.
Kasuya, T., and Brownell, R.L., Jr. 1979. Age detennination, reproduction, and growth of the Franciscanadolphin; POfltopOftdblainvillei. Sci. Rep. Whales Res. Inst. (Tokyo), 31: 45-67.
Kasuya, T., and Matsui, S. 1984. Age detennination and growth ofthe short-finned pilot whale off the Pacific coast of Japan. Sci.Rep. Whales Res. Inst. (Tokyo), 35: 57-91.
Kasuya, T., Miyazaki, N., and Dawbin, WH. 1974. Growth andreproduction of Stenella attenuata in the Pacific coast of Japan.Sci. Rep. Whales Res. Inst. (Tokyo), 26: 157-226.
Klinowska, M. 1991. Dolphins, porpoises and whales of the world.In The IUCN Red Data Book. International Union for Conservation of Nature and Natural Resources, Gland, Switzerland, andCambridge, UK
Lander, R.H. 1981. A life table and biomass estimate for Alaskan furseals. Fish. Res. (Amst.), 1: 55-70.
Laws, R.M. 1953. The elephant seal (Mirounga leonina Linn.). I.Growth and age. Falkl. lsI. Depend. Surv. Sci. Rep. No.8.
Lockyer, C. 1976. Body weights of some species of large whales. 1Cons. Cons. Int. Explor. Mer, 36: 259-273.
Lockyer, C. 1981a. Growth and energy budgets of large baleenwhales from the southern hemisphere. FAO Fish. Ser. 5 No.3. pp.379--487.
Lockyer, C. 1981b. Estimates of growth and energy budget for thespenn whale, Physeter catodon. FAO Fish. Ser. 5 No.3. pp. 489504.
McLaren, I.A. 1993. Growth in pinnipeds. BioI. Rev. Camb. Philos.Soc. 68: 1-79.
Mansfield, A.W 1958. The breeding behaviour and reproductivecycle of the Weddell seal (Leptonychotes weddelli Lesson). Falkl.lsI. Depend. Surv. Sci. Rep. No. 18.
Mansfield, AW 1977. Growth and longevity of the grey seal Halichoerus grypus in eastern Canada. International Council for the
© 1998 NRC Canada

894
Exploration of the Sea, Marine Mammals Committee, e.M. 1977/N:6.
Markussen, N.H., Bjorge, A., and Oritsland, N.A. 1989. Growth inharbour seals (Phoca vitulina) on the Norwegian coast. 1 Zool.(Lond.), 219: 433-440.
Merriam, WR 1902. Twelfth census of the United States, taken inthe year 1900. Census reports. Vol. 2. Population. Part 2. Preparedunder the supervision of William e. Hunt, Chief Statistician forPopulation, Department of the Interior, United States CensusOffice, Washington, D.C.
Milinkovitch, M.C., Meyer, A., and Powell, lR. 1994. Phylogeny ofall major groups of cetaceans based on DNA sequences fromthree mitochondrial genes. Mol. BioI. Evol. 11: 939-948.
Milinkovitch, M.e., Orti, G., and Meyer, A. 1993. Revised phylogeny of whales suggested by mitochondrial ribosomal DNAsequences. Nature (Lond.), 361: 346-348.
Milinkovitch, M.C., Orti, G., and Meyer, A. 1995. Revised phylogeny ofwhales revisited but not revised. Mol. BioI. Evol. 12: 518520.
Miyazaki, N. 1984. Further analyses of reproduction in the stripeddolphin, Stenella coeruleoalba, off the Pacific coast of Japan.Rep. Int. Whaling Comm. Spec. Issue No.6. pp. 343-353.
Miyazaki, N., Fujise, Y., and Fujiyama, T. 1981. Body and organweight of striped and spotted dolphins off the Pacific coast ofJapan. Sci. Rep. Whales Res. Inst. (Tokyo), 33: 27-67.
Naito, Y., and Nishiwaki, 1972. The growth of two species of theharbour seal in adjacent waters of Hokkaido. Sci. Rep. WhalesRes. Inst. (Tokyo), 24: 127-144.
Novachek, M. 1 1992. Mammalian phylogeny: shaking the tree.Nature (Lond.), 356: 121-125.
Novachek, M.l 1993. Genes tell a new whale tale. Nature (Lond.),361: 298-299.
Ohsumi, S. 1979. Interspecies relationships among some biologicalparameters in cetaceans and estimation of the natural mortalitycoefficient of the southern hemisphere minke whale. Rep. Int.Whaling Comm. No. 29. pp. 397-406.
Pauly, D. 1980. On the interrelationships between natural mortality,growth parameters and mean environmental temperature in 175fish stocks. 1 Cons. Cons. Int. Explor. Mer, 39: 175-192.
Payne, M.R. 1979. Growth in the Antarctic fur seal Arctocephalusgazella. 1 ZooI. (Lond.), 187: 1-20.
Perrin, WP., Coe, J.M., and Zweifel, J.R. 1976. Growth and reproduction of the spotted porpoise, Stenella attenuata, in the offshoreeastern tropical pacific. Fish. Bull. 74: 229-269.
Perrin, WP., and Henderson, lR 1984. Growth and reproductiverates in two populations of spinner dolphins, Stenella longirostris,with different histories of exploitation. Rep. Int. Whaling Comm.Spec. Issue No.6. pp. 417-430.
Peters, RH. 1983. The ecological implications of body size. Cambridge University Press, Cambridge.
Pitcher, K.W 1977. Population productivity and food habits of harbor seals in the Prince William Copper River Delta area. MarineMammal Commission, Washington, D.e. National TechnicalInfonnation Service, PB-266935.
Pitcher, K.W, and Calkins, D. 1983. Biology of the harbor seal
Appendix
Can. J. Zool. Vol. 76, 1998
(Phoca vitulina richardsi), in the Gulf of Alaska. In Environmental assessment of the Alaskan Continental Shelf, Final Report,Outer Continental Shelf Environmental Assessment Program,U.S. Department of Commerce, National Oceanic and Atmospheric Administration, Juneau, Alaska. Vol. 19. pp. 231-311.
Platt, N.E., Prime, J.H., and Witthames; S.R 1975. The age of thegrey seal at the Fame Islands: a study of growth, age-distributionand mortality of the breeding stock. Publ. Nat. Hist. Soc.Northumbria, 45: 99-106.
Read, A.l, Wells, RS., Hohn, A.A., and Scott, M.D. 1993. Patternsofgrowth in wild bottlenose dolphins, Tursiops truncatus. 1 Zool.(Lond.), 231: 107-123.
Reijnders, P., Brasseur, S., van der Toorn, J., van der Wolf, R., Boyd,I., Harwood, l, Lavigne, D., and Lowry, L. 1993. Seals, fur seals,sea lions, and walrus. Status survey and conservation action plan.mCN/SSC Specialist Group, International Union for the Conservation of Nature and Natural Resources, Gland, Switzerland.
Reiter, J, Pankin, K.l, and Le Boeuf, BJ. 1981. Female competitionand reproductive success in northern elephant seals. Anim. Behav.29: 670-687.
Ryg, M., Smith, T.G., and 0ritsland, N.A. 1990. Seasonal changes inbody mass and body composition of ringed seals (Phoca hispida)on Svalbard. Can. 1 Zool. 68: 470-475.
Sager, G., and Sammler, R 1986. Zum Langenwachstum der Bartrobbe (Erignathus barbatus, Erxleben 1777) nach Daten vonBenjaminsen (1973). Anat. Anz. 162: 367-372
Schmidt-Nielsen, K. 1984. Scaling: why is animal size so important?Cambridge University Press, Cambridge.
Sergeant, D.E. 1962. The biology of the pilot or pothead whaleGlobicephala melaena (Traill) in Newfoundland waters. Bull.Fish. Res. Board Can. No. 132. pp. 1-84.
Sergeant, D.E., and Brodie, P.P. 1969. Body size in white whales,Delphinapterus leucas. 1 Fish. Res. Board Can. No. 26. pp.2561-2580.
Siler, W 1979. A competing-risk model for animal mortality. Ecology, 60: 750-757.
Siooten, E. 1991. Age, growth, and reproduction in Hector's dolphins. Can. 1 Zool. 69: 1689-1700.
Smith, T.G. 1987. The ringed seal, Phoca hispida, of the westernCanadian Arctic. Can. Bull. Fish. Aquat. Sci. No. 216.
Smith, T., and Polacheck, T. 1981. Reexamination of the life tablefor nothern fur seals with implications about population regulatory mechanisms. In Dynamics of large mammal populations.Edited by"C.W Fowler and T.D. Smith. John Wiley and Sons,New York. pp. 99-120.
Stirling, I. 1971. Population aspects of Weddell Seal harvesting atMcMurdo Sound, Antarctica. Polar Rec. 15: 653-667.
Trites, A.W, and Bigg, M.A. 1996. Physical growth of northern furseals: migratory influences and seasonal fluctuations. 1 Zool.(Lond.), 238: 459-482.
Trites, A.W, Pauly, D., and Christensen, V. 1997. Competitionbetween fisheries and marine mammals for prey and primary production in the Pacific Ocean. 1 Northwest Atl. Fish. Sci. 22: 173187.
The following identifies all data sources and outlines the major assumptions that were made for each species considered.1. Blue whale: Growth curves were obtained from Lockyer (1981a). The longest reported female measured was 33.58 m
(Klinowska 1991). The maximum length of a male was assumed to be 5% less, at 31.90 m. The maximum age was estimated to be 100years for both sexes (Ohsumi 1979).
2. Fin whale: Mass growth curves were drawn from equations in Lockyer (1981a). Maximum lengths of27.00 m (females) and25.00 m (males) were taken from Klinowska (1991). The maximum age for males and females was assumed to be 98 years (Ohsumi1979).
© 1998 NRC Canada

Trites and Pauly
3. Sei whale: Growth curves were established by Lockyer (198Ia). Data presented in Horwood (1987) suggest maximum lengths of17.10 m (males) and 18.0 m (females). Lengths up to 19.50 m for females and 18.60 m for males have been reported but may not berepresentative of the population. The maximum age as detennined by Ohsumi (1979) was 69 years.
4. Humpback whale: Growth curves for body lengths were drawn by Brown and Lockyer (1984). Maximum lengths were 17.68 mfor males and 18.60 m for females, based on 1593 whales taken at Moss Landing and Trinidad (ClaRham et al. 1997). Masses werederived from the length-mass relation (LMR; all in centimetres and kilograms) calculated by Lockyer (1976). The maximum age wasset at 75 years, based on the analysis by Ohsumi (1979).
5. Minke whale: Estimates of mean body length were digitized from growth curves in Evans (1987) that originated from Brownand Lockyer (1984). Body masses were derived from the LMR calculated by Lockyer (1976). Maximum lengths were 9.80 m formales and 10.70 m for females (Klinowska 1991). The average maximum age estimated by Ohsumi (1979) for three stocks was 47years for both sexes.
6. Sperm whale: Body mass growth curves were derived by applying the LMR of Lockyer (1981 b) to length curves digitized fromEvans (1987). Maximum lengths were 18.00 and 12.00 m for males and females, respectively (Klinowska 1991), with a maximum ageof 69 years (Ohsumi 1979).
7. White whale: The LMR used was from Sergeant and Brodie (1969) and Brodie (1971), and was similar to that ofDoidge (1990).This was applied to the length growth curves taken from Braham (1984) to estimate body mass. Maximum ages noted by Bums andSeaman (1985) were 35+ years for females (99th percentile age = 32 years) and 38+ years for males (99th percentile age = 36 years)(cf. Hazard 1988). Maximum lengths were 4.60 m for males and 4.20 m for females (Doidge 1990).
8. Killer whale: Length-age data were digitized from growth curves presented in Christensen (1984). Masses were derived usingthe LMR calculated by Bigg and Wolman (1975). Ohsumi (1979) estimated a maximum age of 50 years. Maximum lengths reportedin Klinowska (1991) were 9.80 m for males and 8.50 m for females.
9. Long-finned pilot whale: Length-age data were digitized from Sergeant (1962). Masses were produced from the LMR in Blochet al. (1993). Maximum ages were 46 years for males (99th percentile age = 38 years) and 59 years for females (99th percentile age =45 years). The longest reported male was 7.62 m, while the largest female was 5.70 m long (Klinowska 1991).
10. Short-finned pilot whale: Body lengths by age were digitized from the growth curves drawn by Kasuya and Matsui (1984) andconverted to masss using the LMR derived by Kasuya and Matsui (1984). The longest recorded lengths were 6.10 m for males and5.50 m for females (Klinowska 1991). The maximum age estimated by Ohsumi (1979) was 45 years for both sexes.
II. Bottlenose dolphin: Age-mass equations calculated by Read et al. (1993) suggest a maximum age of47 years for males andfemales. Corresponding maximum lengths were 3.81 m for males and 3.67 m for females (Klinowska 1991).
12. Striped dolphin: Growth curves were digitized from Miyazaki et al. (1981) and Miyazaki (1984). The longest males andfemales reported by Miyazaki (1984) were 2.60 and 2.53 m, respectively. The oldest animals were 45 years of age (99th percentileage = 32 years) for males and 38 years (99th percentile age = 30 years) for females.
13. Spotted dolphin: Length curves were drawn by Kasuya et al. (1974), Kasyua (1976), and Perrin et al. (1976). Body masseswere estimated using the LMR from Bryden (1986). Maximum lengths were 2.23 m for males and 2.18 m for females (Perrin et al.1976; Kasuya 1976). Maximum ages from Kasyua (1976) were 45 years for males (99th percentile age = 42 years) and 39 years forfemales (99th percentile age = 35 years).
14. Spinner dolphin: Growth curves for body length were taken from Perrin and Henderson (1984). Body masses were calculatedusing the LMR for spotted dolphins reported by Bryden (1986). Maximum ages were 20 and 19 years for males and females, respectively (Perrin and Henderson 1984); corresponding 99th percentile ages were 18 years for males and 17 years for females. Maximumlengths were 1.97 m for males and 1.96 m for females.
15. Hector's dolphin: Growth curves describing body length were estimated for males (L = 125.359{ I - exp[-0.146 (t +0.05)]} 0.064) and females (L = 144.137{I - exp[-0.079 (t + 0.05)]} 0,095), using data tabulated in Siooten (1991). The LMR for bothsexes combined was M= 1.689 x 10⁻⁴ L2.53 . Maximum lengths were 1.38 m for males and 1.53 m for females (Klinowska 1991), withmaximum ages of 19 and 20 years for males and females, respectively (Slooten 1991).
16. Harbour porpoise: Mean body lengths byage were digitized from growth curves drawn by Gaskin et al. (1984). Body masseswere estimated using the LMR from Bryden (1986). The maximum reported age was 15 years (99th percentile age = 13 years) forboth sexes. Maximum lengths were 1.78 m for males and 1.89 m for females (Klinowska 1991).
17. Franciscana dolphin: A LMR was applied to length at age curves drawn by Kasuya and Brownell (1979) to construct the bodymass growth curve. The longest recorded lengths were 1.52 m for males and 1.71 m for females. Maximum ages were 16 and 13 yearsfor males and females, with corresponding 99th percentile ages of9 and 12 years, respectively (Kasuya and Brownell 1979).
18. Walrus: Masses were digitized from smoothed growth curves drawn by Fay (1982). Maximum ages ofmales and females were38 and 29 years, respectively (from data plotted in McLaren (1993) for animals sampled in Alaska and Russia). The 99th percentileages were 36 and 29 years, respectively. Maximum lengths were 3.56 m for males and 3.12 m for females (from McLaren 1993).
19. Bearded seal: Body mass growth curves were obtained from Table 6 of Bums and Frost (1983). Data plotted in McLaren (fromBenjaminsen 1973; Sager and Sammler 1986) suggest that females are about 5% longer than males. Thus, the maximum length ofmales was taken to be 2.50 m (Jefferson et al. 1993), while females were assumed to be 2.65 m long. Maximum ages were 31 years,with a 99th percentile age of 30 years for both sexes.
20. Weddell seal: Growth curves for body length were fit by Mclaren (1993) to data from Stirling (1971). Maximum lengths were2.62 m for males and 2.65 m for females. Body mass growth was derived using M= 2.023 x 10⁻⁴ L2.53 calculated from data tabulatedin Bryden et al. (1984). Maximum and 99th percentile ages for males and females were 13 and 14 years, respectively (from Mansfield1958).
895
© 1998 NRC Canada

896 Can. J. Zool. Vol. 76, 1998
21. Grey seal: The functional relationship M = 5.217 x 10⁻⁵ L2.86 was calculated from digitized mean lengths and masses plotted inPlatt et al. (1975). This was applied to the length growth curves fit by McLaren (1993) to data from Mansfield (1977) to obtain themass. Maximum recorded lengths were 2.35 m for females and 2.65 m for males. The oldest reported female. was 45 years (99thpercentile age = 39 years), while the oldest male was 30 years of age (99th percentile age = 27 years).
22. Harp seal: Body masses were calculated by Innes et al. (1981). Pups were assumed to weigh 10.5 kg. Males and females wereassumed to be of equal size and to have a maximum length of 1.92 m (McLaren 1993). The oldest reported animal was 29 'years ofage, with a 99th percentile age of 26 years (from Innes et al. 1981). .
23. Harbour seal: Body mass was estimated by applying the LMR calculated by Markussen et al. (1989; M = 4.04 X 10⁻⁵ L2.89
) tothe sex-specific length at age curves drawn by McLaren (1993) using data from Bishop (1967), Pitcher (1977), and Pitcher andCalkins (1983). Maximum lengths appear to be 1.80 m for females and 1.90 m for males (Fig. 41 in McLaren 1993; cf. Naito andNishiwaki 1972; Hayama 1985). Maximum ages were 31 and 36 years for males and females, with 99th percentile ages of 28 and31 years, respectively (Fig. 36 in McLaren 1993; cf. Harkonen and Heide-Jorgensen 1990).
24. Ringed seal: Length measurements were obtained from Smith (1987) and converted to mass using the LWR derived by Ryg etal. (1990). Jefferson et al. (1993) suggest that males and females have a maximum length of 1.65 m. However, six sets of growth dataplotted by McLaren (1993) suggest that males are about 5% longer than females. Thus, maximum lengths were assumed to be 1.65 mfor males and 1.58 m for females. The oldest animals aged were 37 years for females and 31 years for males (Helle 1979); 99thpercentile ages were 29 and 27 years, respectively.
25. Southern elephant seal: Mean body masses were obtained from Boyd et al. (1994). Maximum reported ages were 12 and 17years for males and females, respectively-(Boyd et al. 1994). Maximum curvilinear body lengths appear to be 3.20 m for females and5.20 m for males (Laws 1953). The maximum length of males may be as high as 5.50 m, based on data collected by Laws (1953) andplotted by McClaren (1993), but this value does not appear to be representative of the population, given its large departure from allother measurements. Maximum body lengths were converted from curvilinear to standard measures by reducing the curvilinearlengths by 5% (Le., 3.04 m for females and 4.90 m for males) as suggested by McClaren (1993).
26. Northern elephant seal: Length growth curves were obtained from Clinton (1994) for males and from Reiter (1981) andMcLaren (1993) for females. Maximum lengths, based on presented data, appear to be 2.82 m for females and 4.15 m for males,although general species summaries suggest that females could be as long as 3.00 or 3.60 m and males 4.50 or 5.00 m (Jefferson et al.1993; Reijnders et al. 1993). Body mass was estimated using the niean of the LMR calculated for males and females at the beginningand end of the breeding season (from Deutsch et al. 1994). The oldest known-aged males and females were 13 and 11 years, respectively. However, the 99th percentile age for females was assumed to be 17 years, based on the larger aged sample ofsouthern elephantseals.
27. Steller sea lion: McLaren (1993) constructed growth curves for changes in body length of animals measured in the Gulf ofAlaska by Calkins and Pitcher (1982) and Calkins and Goodwin (1988). Estimates ofbody mass were derived using M = 3.328 X
10-5 L2.92 for females and M = 4.350 X 10⁻⁵ L2
.87 for males <262 cm and M = 2.585 X 10⁻⁵ L2
.99 for larger males (calculated using
unpublished data from D. Calkins, Alaska Department ofFish and Game, Anchorage, Alaska, personal communication). Maximumrecorded ages were 18 and 25 years for males and females, with 99th percentile ages of 14 and 22 years, respectively. Maximumrecorded lengths recorded by D. Calkins (upublished data) were 3.30 m for males and 2.47 m for females (cf. Calkins et al. 1998).
28. Northern fur seal: Estimates of body mass were taken from Table I of Trites and Bigg (1996). Maximum recorded lengthswere 2.08 m for males and 1.47 m for females (Trites and Bigg 1996). The oldest reported animals were 17 (male) and 26 (female)years of age, with 99th percentile ages of 13 and 19 years, respectively.
29. Subantarctic fur seal: Body mass growth curves for males and females were constructed by Bester and Van Jaarsveld (1994).However, the parameter b = 2.03 in the Gompertz equation for female body mass was misprinted and was replaced with the correctvalue of 0.131 (M. Bester, personal communication). The oldest animals measured were 18 (males) and 23 (females) years of age.Maximum lengths were 1.81 and 1.43 m, respectively.
30. Antarctic fur seal: Body masses were digitized from smoothed growth curves drawn by Payne (1979). These data indicatemaximum and 99th percentile ages of 11 and 16 years for males and females, respectively. Maximum recorded body lengths were1.41 m for females and 1.98 m for males, as shown in McLaren (1993).
© 1998 NRC Canada
