estimating the impact of restructuring on electricity ......our approach construct a panel dataset...
TRANSCRIPT
Estimating the Impact of Restructuring on Electricity
Generation Efficiency: The Case of the Indian Thermal Power Sector
Maureen L. Cropper, Alexander Limonov, Kabir Malik and Anoop Singh
June 22, 2011
Questions addressed
How has restructuring of the state-owned electricity sector in India affected generation efficiency?
How has unbundling generation from transmission and distribution at state-owned thermal plants affected:
◦ Operating reliability (Plant availability and plant load factor)
◦ Thermal efficiency of plants (Coal usage per kWh)
Do effects depend on length of time since restructuring?
Context for the study
Currently 75% of electricity generated is from coal-fired power plants
In 1990: ◦ 63% of installed capacity owned by state electricity boards◦ 33% by the federal government; ◦ 4% by private companies (power sector nationalized in 1956)
State Electricity Boards were vertically integrated monopolies: controlled virtually all of the distribution and most of the transmission services
SEB revenues fell short of costs: partly due to transmission and distribution losses (30% of generation), but also due to subsidized pricing of electricity to agriculture, households
Generation at state-owned thermal plants inefficient by international standards and also relative to centrally owned plants:
1988-91: Mean thermal efficiency 25%; mean plant load factor 50% mean forced outage= 19%
Nature of power sector reforms
Generation opened up to Independent Power Producers – 1991
State Electricity Regulatory Commissions (SERCs) allowed (1998 Act) and required (Electricity Act of 2003)
SERCs to corporatize the SEBs, face them with hard budget constraints
SERCs to unbundle generation from transmission and distribution
SERCs to reform electricity tariffs
◦ Subsidies to households, agriculture to be eliminated◦ Generators to be compensated based on plant availability and
operating heat rate
Ultimate goal is privatization

Why study unbundling?
Unbundling/corporatization could increase operating reliability and thermal efficiency by:
◦ Reducing diseconomies of scope◦ Providing an incentive to cut costs and reduce operating heat rate (e.g.,
by importing or washing coal)◦ Providing an incentive to improve plant reliability by increasing plant
maintenance
Timing of Unbundling Was Staggered:
◦ 8 states unbundled between 1998 and 2002◦ 4 states unbundled between 2004 and 2008◦ 5 states unbundled after 2008
Using panel data on state power plants from 1994-2008, estimate difference in differences models to examine effects of unbundling on plant reliability and thermal efficiency
Our approach
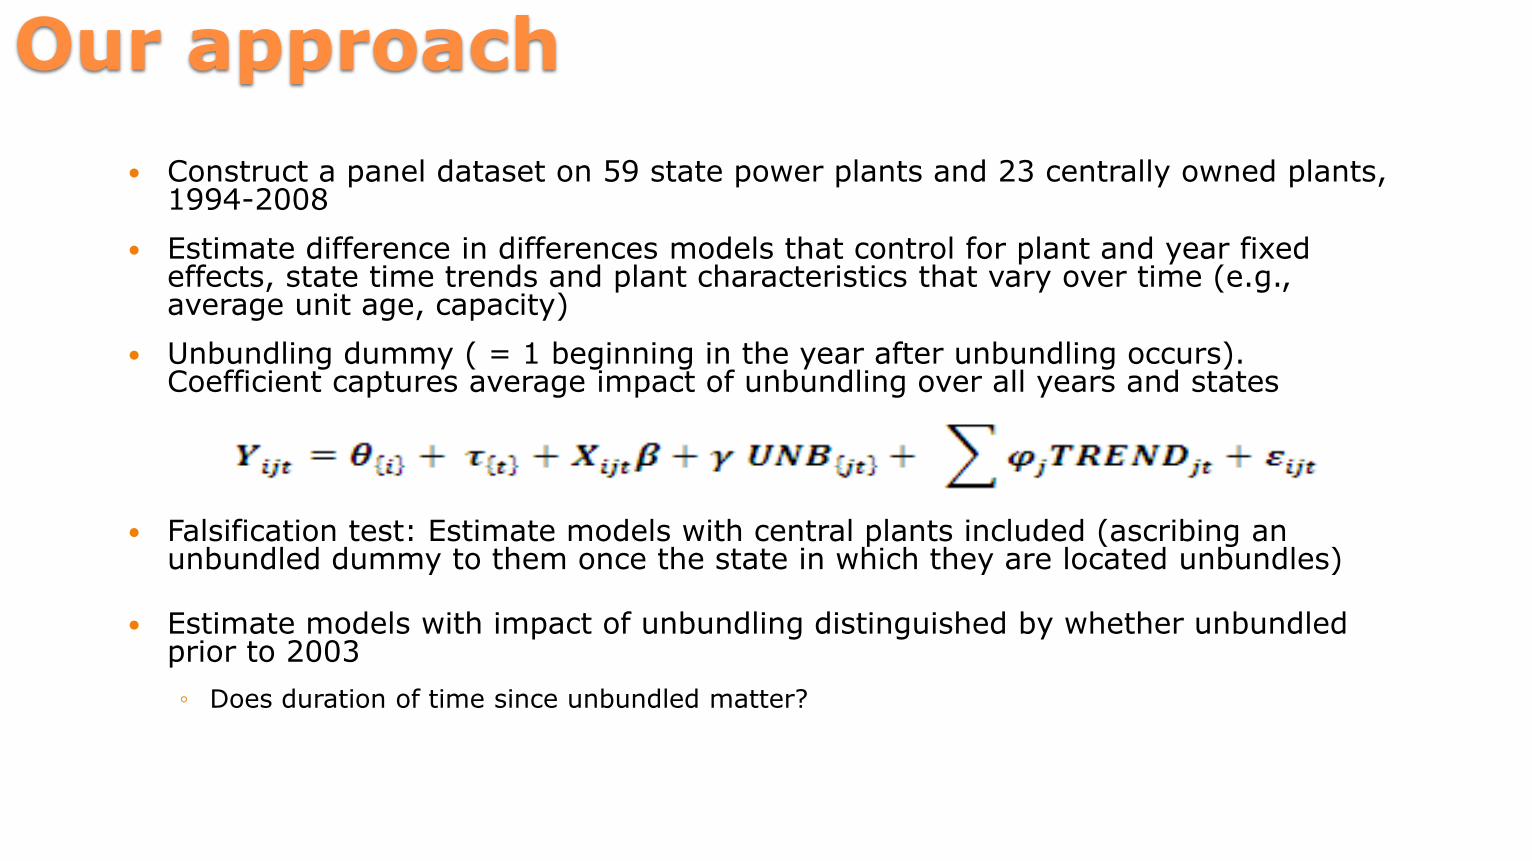
Construct a panel dataset on 59 state power plants and 23 centrally owned plants, 1994-2008
Estimate difference in differences models that control for plant and year fixed effects, state time trends and plant characteristics that vary over time (e.g., average unit age, capacity)
Unbundling dummy ( = 1 beginning in the year after unbundling occurs). Coefficient captures average impact of unbundling over all years and states
Falsification test: Estimate models with central plants included (ascribing an unbundled dummy to them once the state in which they are located unbundles)
Estimate models with impact of unbundling distinguished by whether unbundled prior to 2003
◦ Does duration of time since unbundled matter?

Timing of unbundling State Year Unbundled Per capita income
1999 (Rs.)Per capita generation 1997 (kWh)
Andhra Pradesh 1998 15,400 404
Haryana 1998 23,200 503
Orissa 1998 10,600 312
Karnataka 1999 17,500 349
Uttar Pradesh 1999 9,750 197
Rajasthan 2000 13,600 319
Delhi 2002 38,900 N/A
Madhya Pradesh 2002 12,400 398
Assam 2004 12,300 122
Maharashtra 2005 23,000 594
Gujarat 2006 18,900 723
West Bengal 2007 15,900 210
Tamil Nadu 2008 19,400 497
Punjab 2010 25,600 860
Bihar Not yet 5,790 152
Chhattisgarh Not yet 11,600 N/A
Jharkhand Not yet 11,500 N/A
Endogeneity of unbundling
Use of plant and year fixed effects and state time trends controls for
◦ Differences in average levels of performance among plants
◦ Linear trends across states
Concern that states that would have improved faster without unbundling were the ones who unbundled first. ◦ They would have deviated from their trends differently than
the states that didn’t unbundle.
Next slides show trends in plant availability, plant load factor and coal per kWh pre-reform for states that unbundled v. those that didn’t
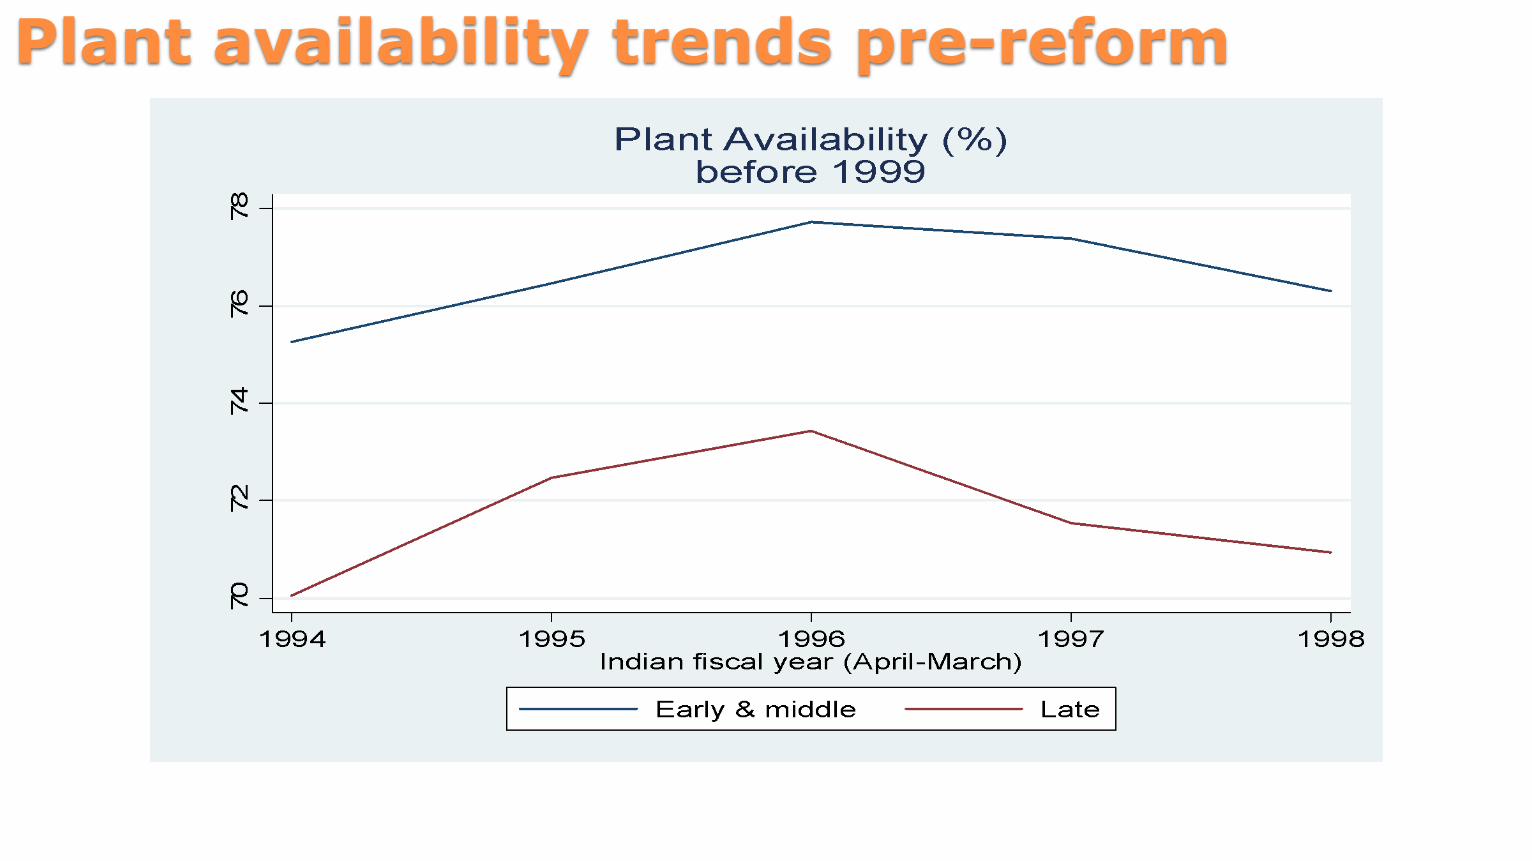
Plant availability trends pre-reform

Plant load factor trends pre-reform
5254
5658
6062
1994 1995 1996 1997 1998Indian fiscal year (April-March)
Early & middle Late
Plant Load Factor (%)before 1999

Trends in coal consumption pre-reform
.76
.77
.78
.79
.8.8
1
1994 1995 1996 1997 1998Indian fiscal year (April-March)
Early & middle Late
Coal consumption (kg/KwH)before 1999
Thermal Efficiency Models
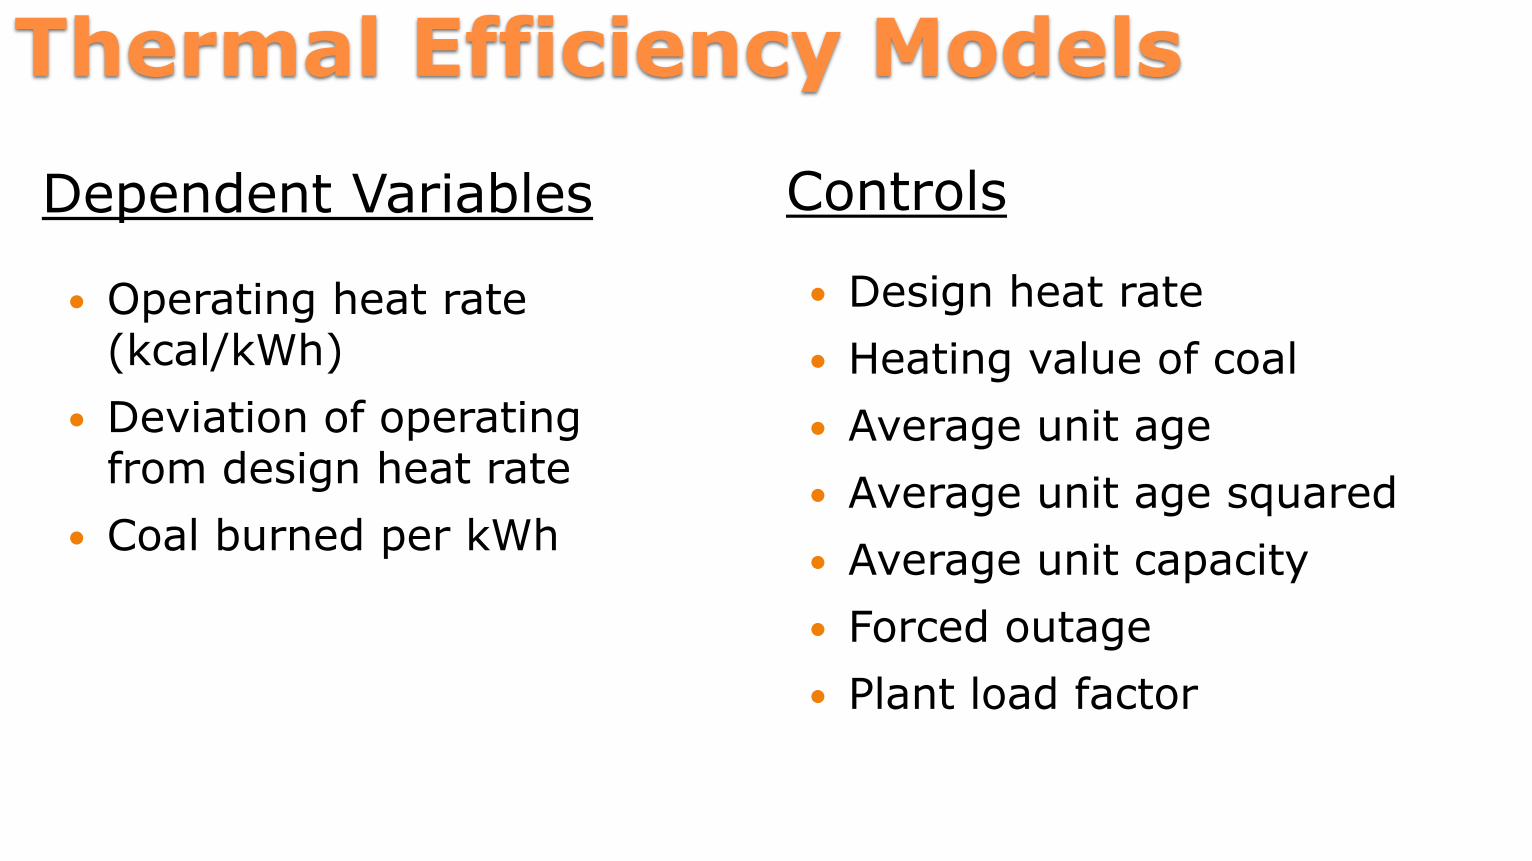
Dependent Variables
Operating heat rate (kcal/kWh)
Deviation of operating from design heat rate
Coal burned per kWh
Controls
Design heat rate
Heating value of coal
Average unit age
Average unit age squared
Average unit capacity
Forced outage
Plant load factor

Plant Reliability Models
Dependent Variables
Plant availability (%)
Plant load factor (%)
Forced outage (%)
Planned maintenance (%)
Controls
Average unit age
Average unit age squared
Average unit capacity
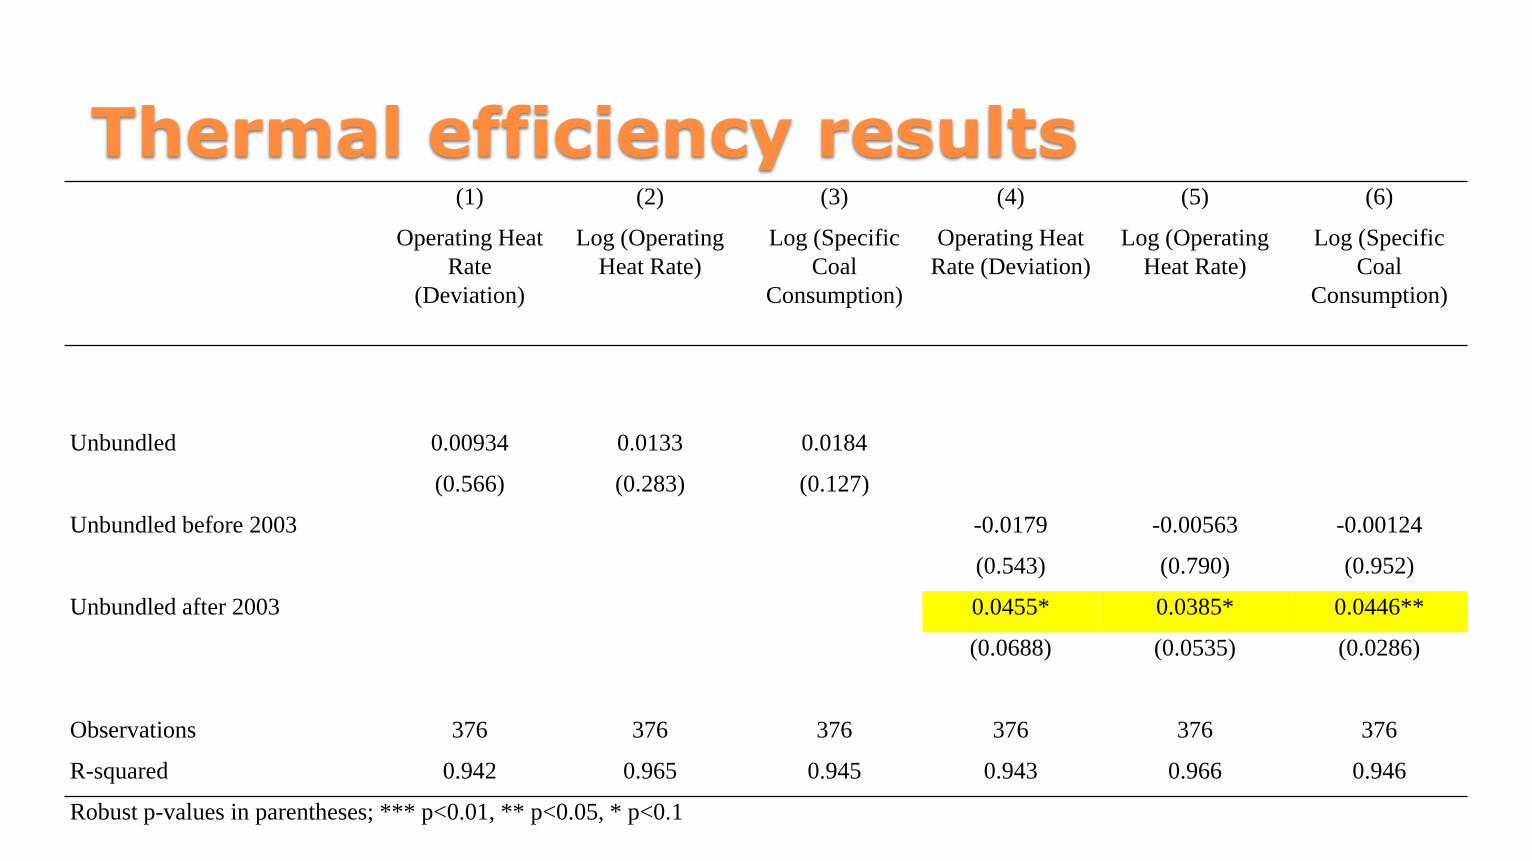
Thermal efficiency results(1) (2) (3) (4) (5) (6)
Operating Heat
Rate
(Deviation)
Log (Operating
Heat Rate)
Log (Specific
Coal
Consumption)
Operating Heat
Rate (Deviation)
Log (Operating
Heat Rate)
Log (Specific
Coal
Consumption)
Unbundled 0.00934 0.0133 0.0184
(0.566) (0.283) (0.127)
Unbundled before 2003 -0.0179 -0.00563 -0.00124
(0.543) (0.790) (0.952)
Unbundled after 2003 0.0455* 0.0385* 0.0446**
(0.0688) (0.0535) (0.0286)
Observations 376 376 376 376 376 376
R-squared 0.942 0.965 0.945 0.943 0.966 0.946
Robust p-values in parentheses; *** p<0.01, ** p<0.05, * p<0.1

Plant Reliability – State Plants Only
(1) (2) (3) (4) (5) (6) (7) (8)
Plant Availability Plant Load
Factor
Forced
Outage
Planned
Maintenance
Plant Availability Plant Load
Factor
Forced
Outage
Planned
Maintenance
Unbundled 2.765* 0.905 -1.483 -1.281
(0.0803) (0.643) (0.269) (0.218)
Unbundled 4.666** 3.287 -2.765 -1.902
before 2003 (0.0160) (0.153) (0.114) (0.362)
Unbundled 0.200 -2.311 0.246 -0.443
after 2003 (0.953) (0.502) (0.934) (0.866)
Observations 786 786 786 786 786 786 786 786
R-squared 0.801 0.877 0.656 0.518 0.802 0.878 0.657 0.519
Robust p-values in parentheses; *** p<0.01, ** p<0.05, * p<0.1

Plant Reliability with Central Plants
(1) (2) (3) (4) (5) (6) (7) (8)
Plant
Availability
Plant Load
Factor
Forced
Outage
Planned
Maintenance
Plant
Availability
Plant Load
Factor
Forced
Outage
Planned
Maintenance
Unbundled (State
plants)
2.957** -0.373 -1.234 -1.723*
(0.0493) (0.846) (0.317) (0.0612)
Unbundled
before 2003
3.691* 0.243 -1.991 -1.700
(0.0556) (0.920) (0.219) (0.256)
Unbundled after
2003
1.793 -1.350 -0.0314 -1.760
(0.551) (0.680) (0.991) (0.361)
Unbundled
(Center plants)
0.828 3.134 -3.763 2.936 1.234 3.476 -4.183* 2.949
(0.768) (0.365) (0.137) (0.162) (0.646) (0.295) (0.0952) (0.187)
Observations 1,085 1,085 1,085 1,085 1,085 1,085 1,085 1,085
R-squared 0.792 0.870 0.677 0.491 0.792 0.870 0.677 0.491
Robust p-values in parentheses; *** p<0.01, ** p<0.05, * p<0.1
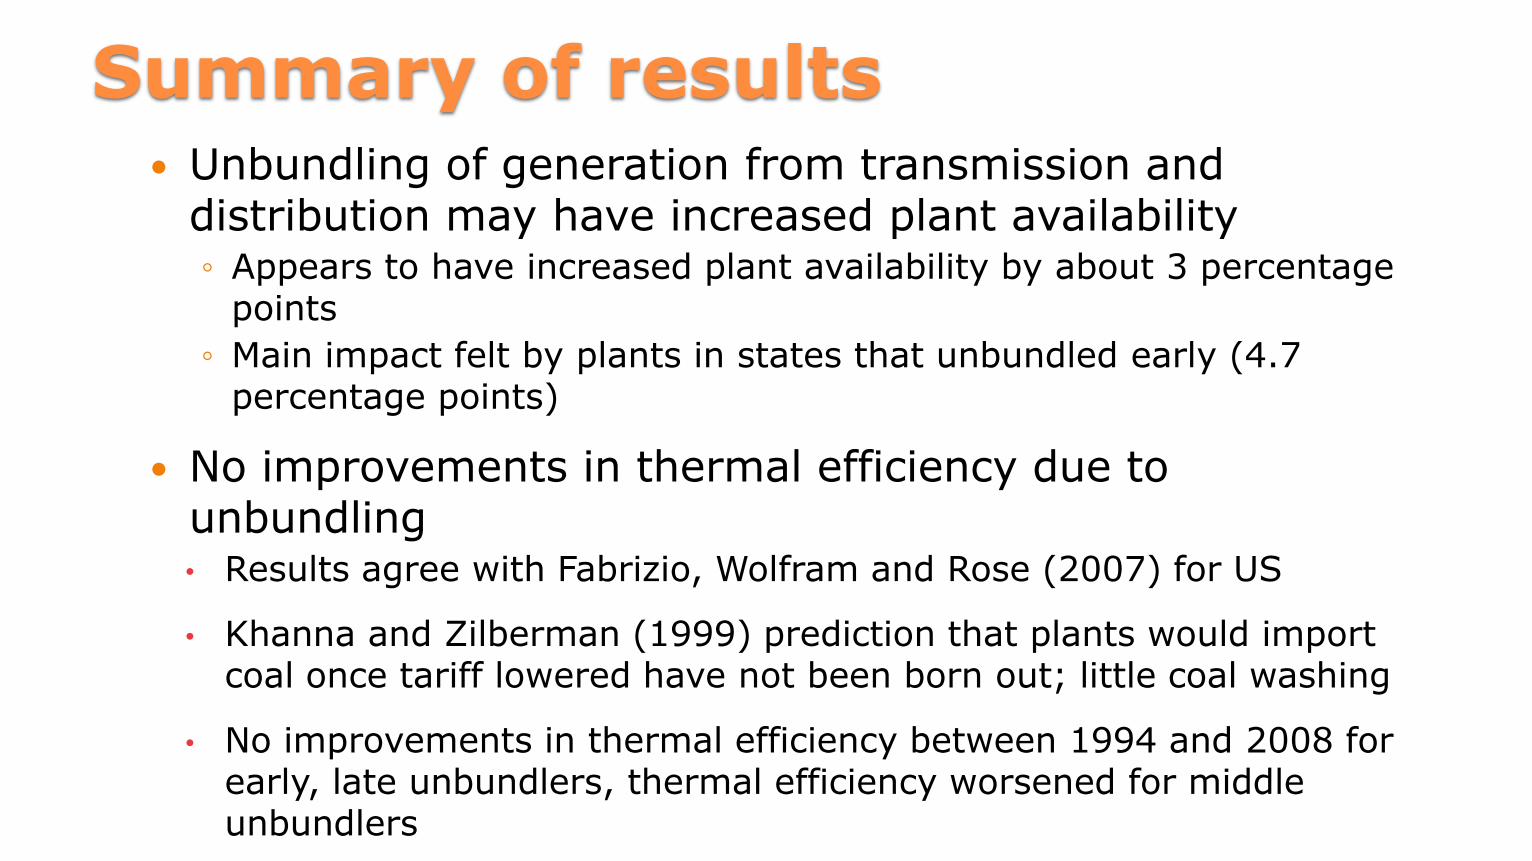
Summary of results Unbundling of generation from transmission and
distribution may have increased plant availability ◦ Appears to have increased plant availability by about 3 percentage
points
◦ Main impact felt by plants in states that unbundled early (4.7 percentage points)
No improvements in thermal efficiency due to unbundling• Results agree with Fabrizio, Wolfram and Rose (2007) for US
• Khanna and Zilberman (1999) prediction that plants would import coal once tariff lowered have not been born out; little coal washing
• No improvements in thermal efficiency between 1994 and 2008 for early, late unbundlers, thermal efficiency worsened for middle unbundlers