estimation of emigration, return migration, and transit ... · estimation of emigration, return...
TRANSCRIPT
Estimation of emigration, return migration, and transitmigration between all pairs of countriesJonathan J. Azosea,b,1 and Adrian E. Rafterya,c,1
aDepartment of Statistics, University of Washington, Seattle, WA 98195; bComputing and Analytics, Pacific Northwest National Laboratory, Seattle, WA98109; and cDepartment of Sociology, University of Washington, Seattle, WA 98195
Contributed by Adrian E. Raftery, October 31, 2018 (sent for review December 23, 2017; reviewed by Guy J. Abel and Jakub Bijak)
We propose a method for estimating migration flows between allpairs of countries that allows for decomposition of migration intoemigration, return, and transit components. Current state-of-the-art estimates of bilateral migration flows rely on the assumptionthat the number of global migrants is as small as possible. We relaxthis assumption, producing complete estimates of all between-country migration flows with genuine estimates of total globalmigration. We find that the total number of individuals migrat-ing internationally has oscillated between 1.13 and 1.29% of theglobal population per 5-year period since 1990. Return migrationand transit migration are big parts of total migration; roughly oneof four migration events is a return to an individual’s country ofbirth. In the most recent time period, we estimate particularly largereturn migration flows from the United States to Central and SouthAmerica and from the Persian Gulf to south Asia.
bilateral migration flows | international migration |pseudo-Bayes estimation
In many developed countries, volatility in population is nowlargely driven by international migration rather than fertility or
mortality (1). However, migration remains difficult to estimate(2, 3). This difficulty is especially pronounced in the context ofreturn migration, the estimation of which may be hindered byunauthorized migration and poor administrative data collectionin the developing world (4, 5). Nevertheless, some attempts havebeen made to produce and/or aggregate high-quality migrationflow estimates for limited groups of countries. The Organiza-tion for Economic Co-Operation and Development (OECD) hascompiled estimates of annual migration flows to and from 34 ofthe current 35 OECD member states in their statistical database(6). (The missing country is Latvia, which joined in July 2016after the data were published.) Another set of flow estimateswas produced by the Integrated Modelling of European Migra-tion (IMEM) project (7). These consist of estimated total flowsbetween all pairs of 31 European countries and were producedusing population register data on arrivals and departures whereavailable combined with expert-influenced estimates of under-counting of migration flows. These two sets of estimates largelycover flows where either the origin or the destination country iseconomically developed. There is little reliable data available on“south–south” flows for which both the origin and the destina-tion country are members of the global south. We address thisshortfall with a method for estimating global bilateral migrationflows, which in contrast to the current state-of-the-art method(8), does not rely on an assumption that migration counts will beas small as possible.
Although net migration is enough to describe populationchange due to migration, effective migration policy requiresknowledge of the underlying flows.∗ Typically, migration policyaims to limit or facilitate in-migration (e.g., through entry visas)or to some extent, to encourage or discourage out-migration(e.g., through nonrenewal of existing visas). Moreover, in con-temporary democratic societies, the available regulations arelimited in that restrictions on out-migration are generally notallowed. Thus, appropriate planning of migration policy requires
accurate data on in- and out-migration flows, which are currentlyinadequate in much of the developing world.
ResultsRecent methodological advances led to the first complete globalestimates of bilateral migration flows in 2013 (8) constructed onthe basis of observed changes in migrant stocks, which are easyto measure relative to directly counting flows. However, the sta-tistical model underlying these state-of-the-art estimates relieson a strong assumption that the number of global migrants is assmall as possible while maintaining consistency with changes inpopulation by place of birth. As such, the only migration flowestimates currently available on a global scale are best viewedas a lower bound on global migration. [For brevity, we willrefer to these existing global flow estimates as “minimum migra-tion” (MM) estimates in contrast to our estimates, which wecall “pseudo-Bayes” (PB) estimates.] By relaxing the assumptionon total migration, we produce estimates of true flows betweenall pairs of countries. This is in contrast to the MM estimates,which although they provide a lower bound on global migra-tion, were never attempting to estimate true flows. In so doing,we also alleviate the MM method’s propensity to underestimatereturn migration, resulting in estimates of in- and outflows thatare more plausible at the finest level of granularity (i.e., flowsindexed by all of origin, destination, and place of birth) andmay, therefore, be of more use in forecasting quantities like the
Significance
Despite the importance of international migration, estimatesof between-country migration flows are still imprecise. Reli-able record keeping of migration events is typically availableonly in the developed world, and the best existing methodsto produce global migration flow estimates are burdened bystrong assumptions. We produce estimates of migration flowsbetween all pairs of countries at 5-year intervals, revealingpatterns obscured by previous estimation methods. In partic-ular, our estimates reveal large bidirectional movements in allglobal regions, with roughly one-quarter of migration eventsconsisting of returns to an individual’s country of birth.
Author contributions: J.J.A. and A.E.R. designed research, performed research, analyzeddata, and wrote the paper.y
Reviewers: G.J.A., Shanghai University; and J.B., University of Southampton.y
The authors declare no conflict of interest.y
This open access article is distributed under Creative Commons Attribution-NonCommercial-NoDerivatives License 4.0 (CC BY-NC-ND).y1 To whom correspondence may be addressed. Email: [email protected] or [email protected]
This article contains supporting information online at www.pnas.org/lookup/suppl/doi:10.1073/pnas.1722334116/-/DCSupplemental.y
Published online December 24, 2018.
*Net migration into a country in a given period is the number of in-migrants from allorigin locations minus the number of out-migrants to all destinations in the period.Migration flows refer to the number of people who reside in country i at the start of atime period and country j at the end of a time period. (Our analysis uses 5-y time periodsunless otherwise noted.) Migrant stocks here refer to the number of people living inone country at a given time who were born in another specified country.
116–122 | PNAS | January 2, 2019 | vol. 116 | no. 1 www.pnas.org/cgi/doi/10.1073/pnas.1722334116
Dow
nloa
ded
by g
uest
on
Mar
ch 1
8, 2
020

SOCI
AL
SCIE
NCE
SST
ATI
STIC
S
number of Mexican-born individuals returning from the UnitedStates to Mexico.
Our method improves over the existing MM estimates byestimating the extent of cross-flows—that is, simultaneous move-ment along both directions of a migration corridor. Cross-flowsare precluded in the MM estimates by the MM constraint. Forexample, in the MM estimates, there can be a nonzero flow ofMexican-born individuals from Mexico to the United States orfrom the United States to Mexico in each time period but nevernonzero flows in both directions simultaneously. In reality, weexpect to observe substantial churn as migrant populations aresimultaneously depleted by departures and replenished by newarrivals, although this process is not visible as a change in migrantstocks. The key innovation in our method is to quantify the extentof churn in global migrant populations and incorporate it intoflow estimates in a way that retains consistency with observedchanges in migrant stocks. Inference about the extent of churnis based on the limited collection of OECD and IMEM flowestimates (6, 9, 10). Our estimates combine empirical informa-tion about cross-flows with the demographic balancing equationbased on migrant stocks (11), births and deaths (12), and the MMmethodology (8) to produce flow estimates covering 5-y intervalsfrom 1990–1995 to 2010–2015.
Definitional consistency is a ubiquitous problem in estima-tion of international migration. For the purposes of this paper,we define a 5-y migration flow from country i to country j asthe number of individuals who resided in country i at the startof the 5-y time period and in country j at the end of the timeperiod, regardless of any other moves made in the interim. Thistransition-based definition of migration undercounts the totalnumber of moves during the 5-y time period and also posesproblems for translation between 1- and 5-y transitions (13–15). Compounding the problem, the criteria for who should becounted as part of the migrant population are also not straight-forward, as countries’ official statistics offices make differentchoices about the requisite duration of stay required to constitutea migration (9). All results in this paper rely on the 2015 revisionof the migrant stock estimates published by the United Nations(11), which discusses in the associated documentation the chal-lenges of differing definitions in national data sources and theirefforts at harmonization. We use their stock estimates withoutadditional adjustment but note that definitional inconsistenciesmay propagate through to errors in migration flow estimates.
Total Global Migration Flows. A key finding in our results isthat the total number of migration events in each time periodmay be substantially larger than previously believed. The MMmethod reports a lower bound on total migration flow between34 and 46 million migration events globally for each time periodfrom 1990–1995 to 2010–2015. In contrast, our method producesestimates of between 67 and 87 million—at least 75% higher
than the MM estimates in all periods and as much as 132%higher in 2010–2015 (Fig. 1, Left). As a proportion of the globalpopulation, we estimate that between 1.13 and 1.29% of theworld’s population migrated in each 5-y time period. While thenumber of migrants has risen since 1990–1995, there is no evi-dence that the proportion of the world’s population migratinghas grown.
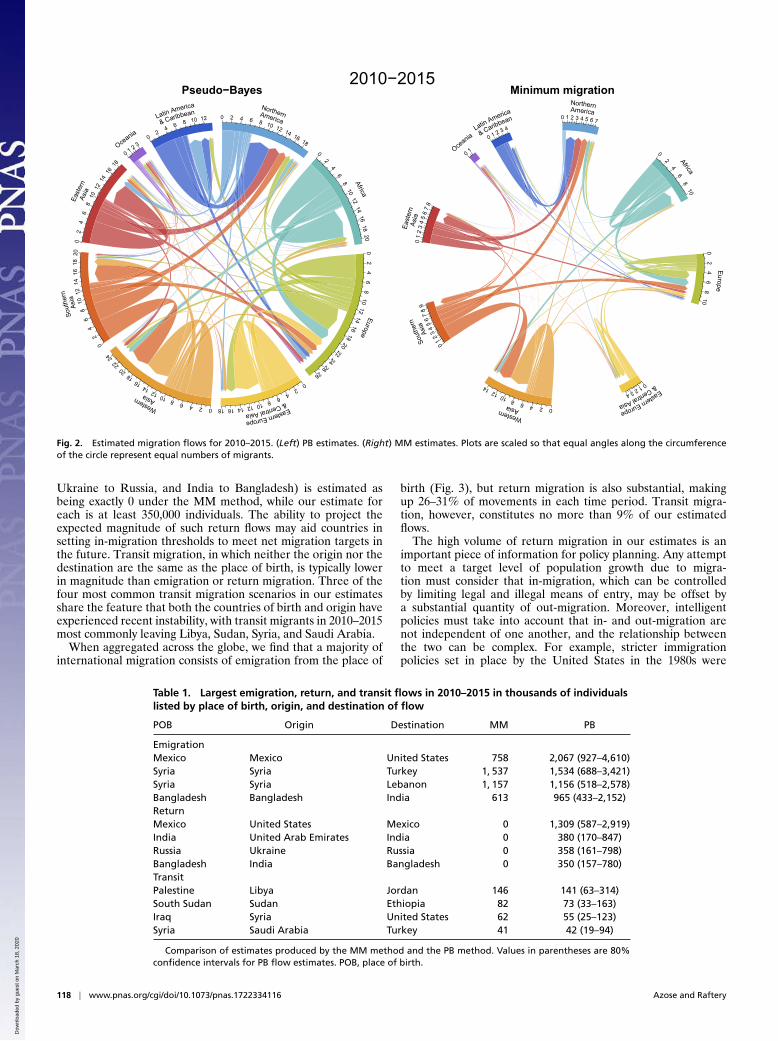
Fig. 2 displays the PB estimates of migration flows for 2010–2015 alongside the MM estimates on a circular migration plot.This style of plot condenses large flow matrices into a formthat makes it easy to distinguish the relative magnitudes offlows (16, 17). International migrant flows are depicted witharrows pointing from the region of origin to the region of des-tination. Colors distinguish the region of origin. Tick marksalong the circumference give the size of the flow in millions ofmigrants.
Although the PB estimates are higher than the MM esti-mates in total, the two sets of estimates are broadly similar incomposition. For example, both sets of estimates contain largewithin-region flows in Africa and western Asia, because theseflows are necessary to account for observed changes in migrantstocks. Time trends across the 1990–2015 period are similar aswell; both sets of estimates contain large flows from southernto western Asia from 2005 onward and from Latin America tonorthern America, which peak during the 1990s. (Plots for allfive quinquennial periods are available in SI Appendix.)
However, despite similar overall patterns, we estimate pro-nounced cross-flows, especially in countries with large migrantstocks from one or several origins (e.g., Latin Americans inthe United States or Turkish-born individuals in Germany).For example, in 2010–2015, the MM method estimates aflow of 2.2 million individuals from Latin America and theCaribbean to northern America but only 190,000 in the oppo-site direction. Our method increases both of these estimates,with 4.8 million from Latin America and the Caribbean tonorthern America and 2.8 million in the reverse direction.The net impact of Latin America/northern America migrationin the two sets of estimates is nearly identical; 2.0 millionindividuals are gained by northern America. The higher esti-mated outflows from northern America in our method areoffset by higher inflows so that the net effect of migration isunchanged.
Emigration, Return, and Transit Flows. Among fully disaggregatedflows broken down by place of birth (Table 1), some of the largestflows in 2010–2015 are emigrations from individuals’ countryof birth in the form of either continued movement along well-established migration corridors (Mexico to the United Statesand Bangladesh to India) or refugee out-migration (from Syriato its neighbors). Notably, each of the four largest return flows(the United States to Mexico, United Arab Emirates to India,
Global Flow (millions) Rate (per thousand)
1995 2000 2005 2010 1995 2000 2005 2010
5
7
9
11
13
40
50
60
70
80
Time
Glo
bal M
igra
tion
Estimator
Minimum migration
Pseudo-Bayes
Fig. 1. (Left) Estimated global migration counts in millions of migrants. (Right) Estimated global migration rate per thousand individuals. Both plotscompare MM estimates (red) with PB estimates (blue) and include dashed ordinary least-squares regression lines over the five time periods of study.
Azose and Raftery PNAS | January 2, 2019 | vol. 116 | no. 1 | 117
Dow
nloa
ded
by g
uest
on
Mar
ch 1
8, 2
020
NorthernAmerica0 2 4 6 8 10 12 14 16 18
Africa
0
24681012
1416
1820
Europe0
24
6810
1214
1618202224
2628
EasternEurope
&CentralAsia
024
681012141618Western Asia
024681012
14161820
2224
Southern
Asia
024
6810
1214
1618
20Eastern
Asia
02
46
810
12141618
Oceania
0 12 3
LatinAmeri
ca
& Caribbea
n
02
4 6 8 10 12
Pseudo−BayesNorthernAmerica
0 1 2 3 4 5 6 7
Africa
0
246810
Europe0
24
6810
EasternEurope
&CentralAsia
01234
Western Asia 024681012
14
Southern
Asia
0123456789
Eastern
Asia
012345678
Oceania
0 1
Latin A
merica
& Caribbean
0 12 3
4
Minimum migration2010−2015
Fig. 2. Estimated migration flows for 2010–2015. (Left) PB estimates. (Right) MM estimates. Plots are scaled so that equal angles along the circumferenceof the circle represent equal numbers of migrants.
Ukraine to Russia, and India to Bangladesh) is estimated asbeing exactly 0 under the MM method, while our estimate foreach is at least 350,000 individuals. The ability to project theexpected magnitude of such return flows may aid countries insetting in-migration thresholds to meet net migration targets inthe future. Transit migration, in which neither the origin nor thedestination are the same as the place of birth, is typically lowerin magnitude than emigration or return migration. Three of thefour most common transit migration scenarios in our estimatesshare the feature that both the countries of birth and origin haveexperienced recent instability, with transit migrants in 2010–2015most commonly leaving Libya, Sudan, Syria, and Saudi Arabia.
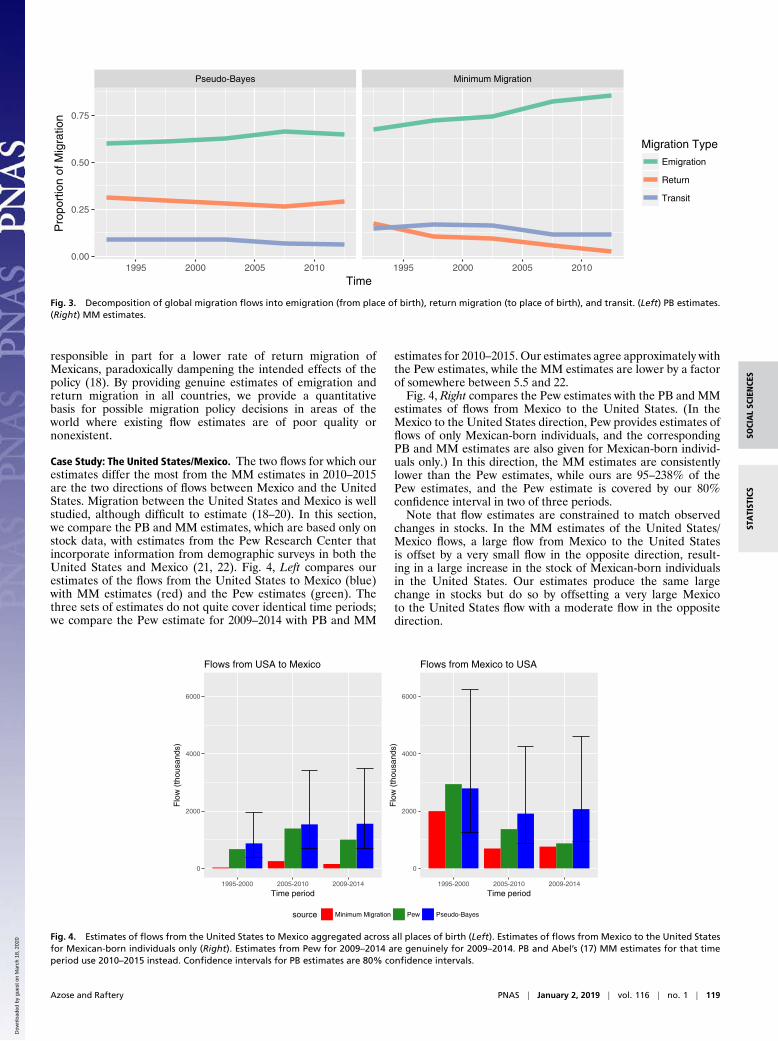
When aggregated across the globe, we find that a majority ofinternational migration consists of emigration from the place of
birth (Fig. 3), but return migration is also substantial, makingup 26–31% of movements in each time period. Transit migra-tion, however, constitutes no more than 9% of our estimatedflows.
The high volume of return migration in our estimates is animportant piece of information for policy planning. Any attemptto meet a target level of population growth due to migra-tion must consider that in-migration, which can be controlledby limiting legal and illegal means of entry, may be offset bya substantial quantity of out-migration. Moreover, intelligentpolicies must take into account that in- and out-migration arenot independent of one another, and the relationship betweenthe two can be complex. For example, stricter immigrationpolicies set in place by the United States in the 1980s were
Table 1. Largest emigration, return, and transit flows in 2010–2015 in thousands of individualslisted by place of birth, origin, and destination of flow
POB Origin Destination MM PB
EmigrationMexico Mexico United States 758 2,067 (927–4,610)Syria Syria Turkey 1, 537 1,534 (688–3,421)Syria Syria Lebanon 1, 157 1,156 (518–2,578)Bangladesh Bangladesh India 613 965 (433–2,152)ReturnMexico United States Mexico 0 1,309 (587–2,919)India United Arab Emirates India 0 380 (170–847)Russia Ukraine Russia 0 358 (161–798)Bangladesh India Bangladesh 0 350 (157–780)TransitPalestine Libya Jordan 146 141 (63–314)South Sudan Sudan Ethiopia 82 73 (33–163)Iraq Syria United States 62 55 (25–123)Syria Saudi Arabia Turkey 41 42 (19–94)
Comparison of estimates produced by the MM method and the PB method. Values in parentheses are 80%confidence intervals for PB flow estimates. POB, place of birth.
118 | www.pnas.org/cgi/doi/10.1073/pnas.1722334116 Azose and Raftery
Dow
nloa
ded
by g
uest
on
Mar
ch 1
8, 2
020
SOCI
AL
SCIE
NCE
SST
ATI
STIC
S
Pseudo-Bayes Minimum Migration
1995 2000 2005 2010 1995 2000 2005 20100.00
0.25
0.50
0.75
Time
Pro
port
ion
of M
igra
tion
Migration Type
Emigration
Return
Transit
Fig. 3. Decomposition of global migration flows into emigration (from place of birth), return migration (to place of birth), and transit. (Left) PB estimates.(Right) MM estimates.
responsible in part for a lower rate of return migration ofMexicans, paradoxically dampening the intended effects of thepolicy (18). By providing genuine estimates of emigration andreturn migration in all countries, we provide a quantitativebasis for possible migration policy decisions in areas of theworld where existing flow estimates are of poor quality ornonexistent.
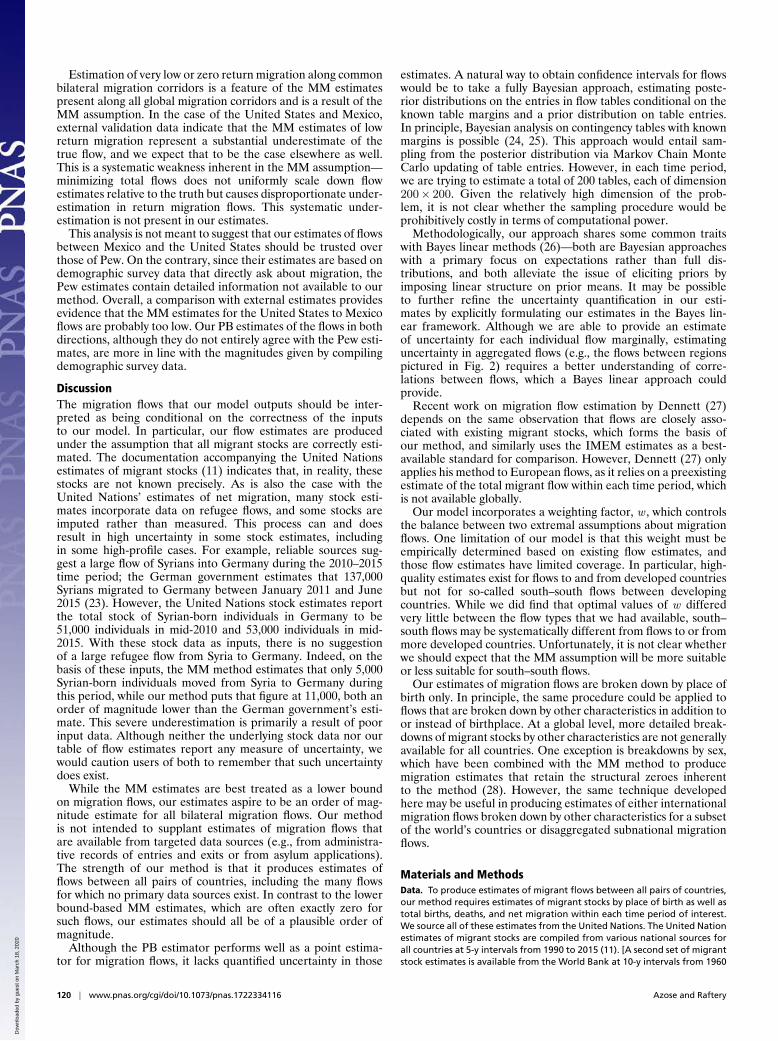
Case Study: The United States/Mexico. The two flows for which ourestimates differ the most from the MM estimates in 2010–2015are the two directions of flows between Mexico and the UnitedStates. Migration between the United States and Mexico is wellstudied, although difficult to estimate (18–20). In this section,we compare the PB and MM estimates, which are based only onstock data, with estimates from the Pew Research Center thatincorporate information from demographic surveys in both theUnited States and Mexico (21, 22). Fig. 4, Left compares ourestimates of the flows from the United States to Mexico (blue)with MM estimates (red) and the Pew estimates (green). Thethree sets of estimates do not quite cover identical time periods;we compare the Pew estimate for 2009–2014 with PB and MM
estimates for 2010–2015. Our estimates agree approximately withthe Pew estimates, while the MM estimates are lower by a factorof somewhere between 5.5 and 22.
Fig. 4, Right compares the Pew estimates with the PB and MMestimates of flows from Mexico to the United States. (In theMexico to the United States direction, Pew provides estimates offlows of only Mexican-born individuals, and the correspondingPB and MM estimates are also given for Mexican-born individ-uals only.) In this direction, the MM estimates are consistentlylower than the Pew estimates, while ours are 95–238% of thePew estimates, and the Pew estimate is covered by our 80%confidence interval in two of three periods.
Note that flow estimates are constrained to match observedchanges in stocks. In the MM estimates of the United States/Mexico flows, a large flow from Mexico to the United Statesis offset by a very small flow in the opposite direction, result-ing in a large increase in the stock of Mexican-born individualsin the United States. Our estimates produce the same largechange in stocks but do so by offsetting a very large Mexicoto the United States flow with a moderate flow in the oppositedirection.
0
2000
4000
6000
1995-2000 2005-2010 2009-2014
Time period
Flo
w (
thou
sand
s)
Flows from USA to Mexico
0
2000
4000
6000
1995-2000 2005-2010 2009-2014
Time period
Flo
w (
thou
sand
s)
Flows from Mexico to USA
source Minimum Migration Pew Pseudo-Bayes
Fig. 4. Estimates of flows from the United States to Mexico aggregated across all places of birth (Left). Estimates of flows from Mexico to the United Statesfor Mexican-born individuals only (Right). Estimates from Pew for 2009–2014 are genuinely for 2009–2014. PB and Abel’s (17) MM estimates for that timeperiod use 2010–2015 instead. Confidence intervals for PB estimates are 80% confidence intervals.
Azose and Raftery PNAS | January 2, 2019 | vol. 116 | no. 1 | 119
Dow
nloa
ded
by g
uest
on
Mar
ch 1
8, 2
020
Estimation of very low or zero return migration along commonbilateral migration corridors is a feature of the MM estimatespresent along all global migration corridors and is a result of theMM assumption. In the case of the United States and Mexico,external validation data indicate that the MM estimates of lowreturn migration represent a substantial underestimate of thetrue flow, and we expect that to be the case elsewhere as well.This is a systematic weakness inherent in the MM assumption—minimizing total flows does not uniformly scale down flowestimates relative to the truth but causes disproportionate under-estimation in return migration flows. This systematic under-estimation is not present in our estimates.
This analysis is not meant to suggest that our estimates of flowsbetween Mexico and the United States should be trusted overthose of Pew. On the contrary, since their estimates are based ondemographic survey data that directly ask about migration, thePew estimates contain detailed information not available to ourmethod. Overall, a comparison with external estimates providesevidence that the MM estimates for the United States to Mexicoflows are probably too low. Our PB estimates of the flows in bothdirections, although they do not entirely agree with the Pew esti-mates, are more in line with the magnitudes given by compilingdemographic survey data.
DiscussionThe migration flows that our model outputs should be inter-preted as being conditional on the correctness of the inputsto our model. In particular, our flow estimates are producedunder the assumption that all migrant stocks are correctly esti-mated. The documentation accompanying the United Nationsestimates of migrant stocks (11) indicates that, in reality, thesestocks are not known precisely. As is also the case with theUnited Nations’ estimates of net migration, many stock esti-mates incorporate data on refugee flows, and some stocks areimputed rather than measured. This process can and doesresult in high uncertainty in some stock estimates, includingin some high-profile cases. For example, reliable sources sug-gest a large flow of Syrians into Germany during the 2010–2015time period; the German government estimates that 137,000Syrians migrated to Germany between January 2011 and June2015 (23). However, the United Nations stock estimates reportthe total stock of Syrian-born individuals in Germany to be51,000 individuals in mid-2010 and 53,000 individuals in mid-2015. With these stock data as inputs, there is no suggestionof a large refugee flow from Syria to Germany. Indeed, on thebasis of these inputs, the MM method estimates that only 5,000Syrian-born individuals moved from Syria to Germany duringthis period, while our method puts that figure at 11,000, both anorder of magnitude lower than the German government’s esti-mate. This severe underestimation is primarily a result of poorinput data. Although neither the underlying stock data nor ourtable of flow estimates report any measure of uncertainty, wewould caution users of both to remember that such uncertaintydoes exist.
While the MM estimates are best treated as a lower boundon migration flows, our estimates aspire to be an order of mag-nitude estimate for all bilateral migration flows. Our methodis not intended to supplant estimates of migration flows thatare available from targeted data sources (e.g., from administra-tive records of entries and exits or from asylum applications).The strength of our method is that it produces estimates offlows between all pairs of countries, including the many flowsfor which no primary data sources exist. In contrast to the lowerbound-based MM estimates, which are often exactly zero forsuch flows, our estimates should all be of a plausible order ofmagnitude.
Although the PB estimator performs well as a point estima-tor for migration flows, it lacks quantified uncertainty in those
estimates. A natural way to obtain confidence intervals for flowswould be to take a fully Bayesian approach, estimating poste-rior distributions on the entries in flow tables conditional on theknown table margins and a prior distribution on table entries.In principle, Bayesian analysis on contingency tables with knownmargins is possible (24, 25). This approach would entail sam-pling from the posterior distribution via Markov Chain MonteCarlo updating of table entries. However, in each time period,we are trying to estimate a total of 200 tables, each of dimension200× 200. Given the relatively high dimension of the prob-lem, it is not clear whether the sampling procedure would beprohibitively costly in terms of computational power.
Methodologically, our approach shares some common traitswith Bayes linear methods (26)—both are Bayesian approacheswith a primary focus on expectations rather than full dis-tributions, and both alleviate the issue of eliciting priors byimposing linear structure on prior means. It may be possibleto further refine the uncertainty quantification in our esti-mates by explicitly formulating our estimates in the Bayes lin-ear framework. Although we are able to provide an estimateof uncertainty for each individual flow marginally, estimatinguncertainty in aggregated flows (e.g., the flows between regionspictured in Fig. 2) requires a better understanding of corre-lations between flows, which a Bayes linear approach couldprovide.
Recent work on migration flow estimation by Dennett (27)depends on the same observation that flows are closely asso-ciated with existing migrant stocks, which forms the basis ofour method, and similarly uses the IMEM estimates as a best-available standard for comparison. However, Dennett (27) onlyapplies his method to European flows, as it relies on a preexistingestimate of the total migrant flow within each time period, whichis not available globally.
Our model incorporates a weighting factor, w , which controlsthe balance between two extremal assumptions about migrationflows. One limitation of our model is that this weight must beempirically determined based on existing flow estimates, andthose flow estimates have limited coverage. In particular, high-quality estimates exist for flows to and from developed countriesbut not for so-called south–south flows between developingcountries. While we did find that optimal values of w differedvery little between the flow types that we had available, south–south flows may be systematically different from flows to or frommore developed countries. Unfortunately, it is not clear whetherwe should expect that the MM assumption will be more suitableor less suitable for south–south flows.
Our estimates of migration flows are broken down by place ofbirth only. In principle, the same procedure could be applied toflows that are broken down by other characteristics in addition toor instead of birthplace. At a global level, more detailed break-downs of migrant stocks by other characteristics are not generallyavailable for all countries. One exception is breakdowns by sex,which have been combined with the MM method to producemigration estimates that retain the structural zeroes inherentto the method (28). However, the same technique developedhere may be useful in producing estimates of either internationalmigration flows broken down by other characteristics for a subsetof the world’s countries or disaggregated subnational migrationflows.
Materials and MethodsData. To produce estimates of migrant flows between all pairs of countries,our method requires estimates of migrant stocks by place of birth as well astotal births, deaths, and net migration within each time period of interest.We source all of these estimates from the United Nations. The United Nationestimates of migrant stocks are compiled from various national sources forall countries at 5-y intervals from 1990 to 2015 (11). [A second set of migrantstock estimates is available from the World Bank at 10-y intervals from 1960
120 | www.pnas.org/cgi/doi/10.1073/pnas.1722334116 Azose and Raftery
Dow
nloa
ded
by g
uest
on
Mar
ch 1
8, 2
020
SOCI
AL
SCIE
NCE
SST
ATI
STIC
S
to 2000 (29), but we use the United Nations data for our analysis, becausethey are more recent and fine grained in time.] The United Nations esti-mates of births, deaths, and population for all countries are given in theWorld Population Prospects (12).
Our method is tuned to minimize error against flow estimates for a sub-set of countries in which reasonable quality estimates of migration flowsexist. These external data serve as a “bronze standard” (somewhat inferiorto “gold standard” data but still of sufficient quality for validation.) Thesewe draw from two sources. The first source is the flow estimates producedby the IMEM project (7). These consist of estimated total flows between31 pairs of European countries and cover the years from 2002 to 2008 onan annual basis. The second source is the OECD, which compiles estimatesof annual migration flows to and from 34 of the current 35 OECD mem-ber states. Although these are subject to the undercounting issues, whichthe IMEM flows adjust for, they are nonetheless valuable in that they pro-vide a more detailed picture of flows to and from the developed world andhave fairly low levels of data missingness. At least two other fairly extensivesets of migration flow estimates are available. The United Nations pub-lishes annual migration flow estimates covering several decades (30) as doesthe Determinants of International Migration project (31). In both cases, wehave chosen not to use these data, because the level of completeness variesgreatly between counties as well as over time, and this data missingness is apotential source of bias.
Our choice of datasets was motivated by selecting only data for whichmissingness could plausibly be treated as completely random. In practice,this may be exchanging one kind of bias for another, as we have no way ofdetermining whether the bias introduced by nonrandom missingness wouldbe outweighed by other systematic errors in the estimates that we selected.With better integration and harmonization of the multiple data sources,there may be room to improve our estimates.
Producing PB Estimates. At the finest level of granularity, the quantities ofinterest are the unknown flow tables Mkt defined by
Mkt : =
m11kt m12kt · · · m1Ckt
m21kt m22kt · · · m2Ckt
......
. . ....
mC1kt mC2kt · · · mCCkt
, [1]
where the entry mijkt is a flow from country i to country j of individualswith place of birth k during time period t. Note that only the off-diagonalelements of Mkt represent genuine migration flows. The diagonal ele-ments miikt represent individuals who resided in country i both at thebeginning and at the end of the time period—that is, stayers rather thanmovers.
A key observation is that, in the absence of births and deaths, the rowand column sums of Mkt are known. Each row sum,
∑j mijkt , gives the total
population of individuals with place of birth k residing in country i at time t.That is, the row sums are migrant stocks at time t, which we will denote bynikt . Likewise, the column sums,
∑i mijkt , give the population of individuals
with place of birth k residing in country j at time t + 5—that is, the stocksnjkt+5.
In our results, we adopt the treatment of births and deaths introducedin ref. 17 without modification. Under this method, births in country iare assumed to increase the value of niit+5—that is, the stock of indi-viduals born in country i and residing in country i at the end of thetime period of interest. Deaths in country i are assumed to occur pro-portionally to the place of birth composition in country i and decreasethe relevant stocks. A more refined apportionment of deaths by place ofbirth might also take into account the age structure and/or age-specificmortality rates of migrant populations, but this additional information isonly rarely available. Additional adjustments to the stocks are made toensure that the changes in stocks agree with the known net migrationcounts while maintaining approximate agreement with the assumed birthsand deaths.
The MM method amounts to fitting a separate Poisson log-linear modelto each table, Mkt . The model assumes that table elements mijkt areindependently drawn from Poisson distributions so that
mijkt ∼ Poisson(yijkt). [2]
Furthermore, the Poisson means are assumed to follow a quasiindepen-dence structure:
yijkt =αiktβjktδijktoijkt , [3]
where oijkt is a prespecified offset term and the δijkt terms are constrainedso that δijkt = 1 unless i = j. This condition on the δijkt terms says that thePoisson means for the diagonal elements of each table are unconstrained,while the off-diagonal elements follow an independence structure. Concep-tually, this constraint can be viewed as a statement that moving is differentfrom staying.
Sufficient statistics for inference on the Poisson model parameters aregiven by the known row margins (i.e., stocks at time t), the known col-umn margins (i.e., stocks at time t + 5), and the unknown diagonal entries{miikt for i = 1, . . . , C}. After the diagonal values are fixed, the maximumlikelihood estimates for the parameter vectors α, β, and δ can be foundvia iterated proportional fitting (32, 33). One implementation of the iter-ated proportional fitting procedure can be found in the migest R package(34).
Our migration flow estimates are a PB estimator MPBkt for Mkt , which has
the same row and column totals as the MM estimator MAkt but lacks the prob-
lematic structural zeroes. The PB estimator is produced using the followingprocedure.
i) Using data on stocks, births, and deaths, find the MM estimate MAkt
for each flow matrix Mkt . These estimates should include adjustmentsof stocks for births, deaths, and agreement with country-specific netmigration totals.
ii) Compute the row and column totals of MAkt to extract adjusted stock
estimates n∗ikt and n∗
jkt+5.
iii) Construct a second set of estimates MIkt with independence structure.
Elements of MIkt are given by
mIijkt =
n∗iktn
∗jkt+5∑
i n∗ikt
. [4]
Note that this is the matrix of maximum likelihood estimates froma Poisson model on migration flows, where mijkt
ind∼ Poisson(αiktβjkt) isconditional on the given row and column totals with no additionalassumptions made about the diagonal.
iv) Construct the PB estimator MPBkt as a convex combination of MA
kt and MIkt :
MPBkt (w) = w · MA
kt + (1−w) · MIkt [5]
for some value w ∈ [0, 1].
For any choice of w ∈ [0, 1], the estimator MPBkt (w) is a valid PB estima-
tor of the unknown table entries. (SI Appendix has mathematical details.)One way to think of the PB estimator is as smoothing MA
kt toward a matrixwith smaller diagonal and fewer zero entries. This form of smoothingis a common approach to estimation of cell probabilities in contingencytables with many observed zeroes (35). By construction, the PB estimates ofmigration flows maintain consistency with the observed changes in stockswhile also allowing for large cross-flows concentrated in locations withlarge existing migrant populations. We find that the optimal smoothingparameter retains the property that the number of nonmovers is large,reflecting the generally low propensity for and high barriers to internationalmigration.
We note several advantageous properties of this estimator. First, row andcolumn sums of each table will be identical to those of the MM estimator,MA
kt , by construction. Second, this estimator lacks the structural zeroes ofMA
kt . Before rounding to integer values, estimated flows will be nonzerowhenever countries i and j both have nonzero populations of individualswith place of birth k. The final estimate may round down to zero but onlywhen those populations are small, in which case migration flows are indeedlikely to be small. Third, for values of w close to one, the diagonal entries ofMPB
kt (w) will be nearly maximized but not exactly maximized. This allows usto retain the property that the number of nonmovers is large. (All resultspresented here are based on a fitted value of w = 0.870.) Finally, afterMA
kt is computed, finding the PB estimator requires very little additionalcomputation.
Additional details about offset terms, selection of an optimal value of w,and derivation of confidence intervals are provided in SI Appendix.
ACKNOWLEDGMENTS. We thank Charles Hirschman for discussions. Thiswork was supported by NIH Grants R01 HD54511 and R01 HD70936 andthe Center for Advanced Study in the Behavioral Sciences at StanfordUniversity.
Azose and Raftery PNAS | January 2, 2019 | vol. 116 | no. 1 | 121
Dow
nloa
ded
by g
uest
on
Mar
ch 1
8, 2
020
1. Azose JJ, Sevcıkova H, Raftery AE (2016) Probabilistic population projections withmigration uncertainty. Proc Natl Acad Sci USA 113:6460–6465.
2. Bilsborrow RE (1997) International Migration Statistics: Guidelines for Improving DataCollection Systems (International Labour Organization, Geneva).
3. Ratha D, Shaw W (2007) South-South Migration and Remittances (World BankPublications, Washington, DC).
4. Massey DS, Capoferro C (2006) Measuring undocumented migration. Int Migr Rev38:1075–1102.
5. Zlotnik H (1987) Measuring international migration: Theory and practice. Int MigrRev 21:v–xii.
6. Organization for Economic Co-Operation and Development (2015) OECD Interna-tional Migration Database (Organization for Economic Co-Operation and Develop-ment, Paris).
7. Raymer J, Wisniowski A, Forster JJ, Smith PW, Bijak J (2013) Integrated modeling ofEuropean migration. J Am Stat Assoc 108:801–819.
8. Abel GJ (2013) Estimating global migration flow tables using place of birth data.Demographic Res 28:505–546.
9. De Beer J, Raymer J, Van der Erf R, Van Wissen L (2010) Overcoming the problems ofinconsistent international migration data: A new method applied to flows in Europe.Eur J Popul 26:459–481.
10. Raymer J, de Beer J, van der Erf R (2011) Putting the pieces of the puzzle together:Age and sex-specific estimates of migration amongst countries in the EU/EFTA, 2002–2007. Eur J Popul 27:185–215.
11. United Nations (2015) International Migrant Stock: The 2015 Revision (UnitedNations, New York).
12. United Nations (2015) World Population Prospects: The 2015 Revision (UnitedNations, New York).
13. Kitsul P, Philipov D (1981) The one year/five year migration problem. Advances inMultiregional Demography, ed Rogers A (International Institute for Applied SystemsAnalysis, Laxenburg, Austria), pp 1–34.
14. Newbold KB (2005) Spatial scale, return and onward migration, and the Long-Boertlein index of repeat migration. Pap Reg Sci 84:281–290.
15. Rees PH (1977) The measurement of migration, from census data and other sources.Environ Plann A 9:247–272.
16. Gu Z, Gu L, Eils R, Schlesner M, Brors B (2014) circlize implements and enhances circularvisualization in R. Bioinformatics 30:2811–2812.
17. Abel GJ, Sander N (2014) Quantifying global international migration flows. Science343:1520–1522.
18. Durand J, Massey DS, Parrado EA (1999) The new era of Mexican migration to theUnited States. J Am Hist 86:518–536.
19. Hanson GH (2006) Illegal migration from Mexico to the United States. J Econ Lit44:869–924.
20. Massey DS, Espinosa KE (1997) What’s driving Mexico-US migration? A theoretical,empirical, and policy analysis. Am J Sociol 102:939–999.
21. Gonzalez-Barrera A (2015) More Mexicans leaving than coming to the US (PewResearch Center, Washington, DC), Technical Report.
22. Passel J, Cohn D, Gonzalez-Barrera A (2012) Net migration from Mexico falls to zero—and perhaps less (Pew Research Center, Washington, DC), Technical Report.
23. Deutscher Bundestag (2015) Deutscher Bundestag Drucksache 18/5799 Aufnahme vonsyrischen Fluchtlingen zum Stand Mitte 2015. Available at dip21.bundestag.de/dip21/btd/18/057/1805799.pdf. Accessed December 9, 2018.
24. Dobra A, Tebaldi C, West M (2006) Data augmentation in multi-way contingencytables with fixed marginal totals. J Stat Plan Inference 136:355–372.
25. Forster JJ (2010) Bayesian inference for Poisson and multinomial log-linear models.Stat Methodol 7:210–224.
26. Goldstein M, Wooff D (2007) Bayes Linear Statistics: Theory and Methods (John Wiley& Sons, Chichester, UK), Vol 716.
27. Dennett A (2016) Estimating an annual time series of global migration flows—Analternative methodology for using migrant stock data. Global Dynamics: Approachesfrom Complexity Science, ed Wilson AG (Wiley Online Library, Chichester, UK), pp125–142.
28. Abel GJ (2018) Estimates of global bilateral migration flows by gender between 1960and 2015. Int Migr Rev 52:809–852.
29. Ozden C, Parsons CR, Schiff M, Walmsley TL (2011) Where on earth is everybody? Theevolution of global bilateral migration 1960–2000. World Bank Econ Rev 25:12–56.
30. United Nations (2015) International Migration Flows to and from Selected Countries:The 2015 Revision (United Nations, New York).
31. Vezzoli S, Villares-Varela M, De Haas H (2014) Uncovering international migrationflow data: Insights from the DEMIG databases (International Migration Institute, Uni-versity of Oxford, Oxford). Available at https://eprints.soton.ac.uk/401081/. AccessedDecember 9, 2018.
32. Bishop YM, Fienberg SE, Holland PW (1975) Discrete Multivariate Analysis: Theoryand Practice (MIT Press, New York).
33. Willekens F (1999) Modeling approaches to the indirect estimation of migrationflows: From entropy to EM. Math Popul Stud 7:239–278.
34. Abel GJ (2013) migest: Useful R Code for the Estimation of Migration. The CRANProject. Available at https://cran.r-project.org/package=migest. Accessed December12, 2014.
35. Fienberg SE, Holland PW (1973) Simultaneous estimation of multinomial cellprobabilities. J Am Stat Assoc 68:683–691.
122 | www.pnas.org/cgi/doi/10.1073/pnas.1722334116 Azose and Raftery
Dow
nloa
ded
by g
uest
on
Mar
ch 1
8, 2
020