estimation of energy wood potential in europe
TRANSCRIPT

Working Papers of the Finnish Forest Research Institute 6http://www.metla.fi/julkaisut/workingpapers/2004/mwp006.htmISBN 951-40-1939-3ISSN 1795-150X
www.metla.fi
Estimation of Energy Wood Potentialin Europe
Timo Karjalainen, Antti Asikainen, Jan Ilavsky, Raffaella Zamboni,Kaisa-Elina Hotari and Dominik Röser
Working Papers of the Finnish Forest Research Institute 6http://www.metla.fi/julkaisut/workingpapers/2004/mwp006.htm
2
Working Papers of the Finnish Forest Research Institute publishes preliminaryresearch results and conference proceedings.
The papers published in the series are not peer-reviewed.
The papers are published in pdf format on the Internet only.
http://www.metla.fi/julkaisut/workingpapers/ISSN 1795-150X
OfficeUnioninkatu 40 AFI-00170 Helsinkitel. 010 2111fax 010 211 2101e-mail [email protected]
PublisherFinnish Forest Research InstituteUnioninkatu 40 AFI-00170 Helsinkitel. 010 2111fax 010 211 2101e-mail [email protected]://www.metla.fi
Working Papers of the Finnish Forest Research Institute 6http://www.metla.fi/julkaisut/workingpapers/2004/mwp006.htm
3
Authors
Karjalainen, Timo, Asikainen, Antti, Ilavsky, Jan, Zamboni, Raffaella, Hotari, Kaisa-Elina & Röser,DominikTitle
Estimation of energy wood potential in Europe
Year
2004Pages
43ISBN
951-40-1939-3ISSN
1795-150X
Unit / Research programme / Projects
Finnish Forest Research Institute, Joensuu Research Centre / 90098 Estimation of energy wood potentialin Europe
Accepted by
Jari Parviainen, Director, 7 October 2004
Abstract
The aim of this study was to estimate energy wood potential in Europe, in particular in 25 Europeancountries that are members of the European Union from the beginning of May 2004. Estimation of theenergy wood potential has been divided into estimation of roundwood balance, and estimation of fellingresidues. Study has been limited to forests available for wood supply. Roundwood balance illustratesunutilized increment that could be used for industrial purposes, for energy production or left in theforests as it is the difference between net annual increment and felling. Felling residues that are usuallyleft in the forest are becoming increasingly important source for wood energy.
Forest resources in Europe have been increasing during the last 50 years. Roundwood balance basedon the difference between net annual increment and fellings is approximately 186 million m3 per year or32% of the net annual increment. The roundwood balance has been clearly positive for a long time, andthus increasing amount of wood has accumulated in the forests, resulting in denser forest and older ageclass structures. Roundwood balance can be regarded as a kind of surplus or reserve that is left in theforests currently. Competition of the wood resources is increasing and obviously fulfilment of thedemands for industrial use, energy production and protection would require compromises. Use ofroundwood directly for energy purposes would depend of the prices of roundwood, especially that forwood-based panels, pulp and paper as well as for energy production.
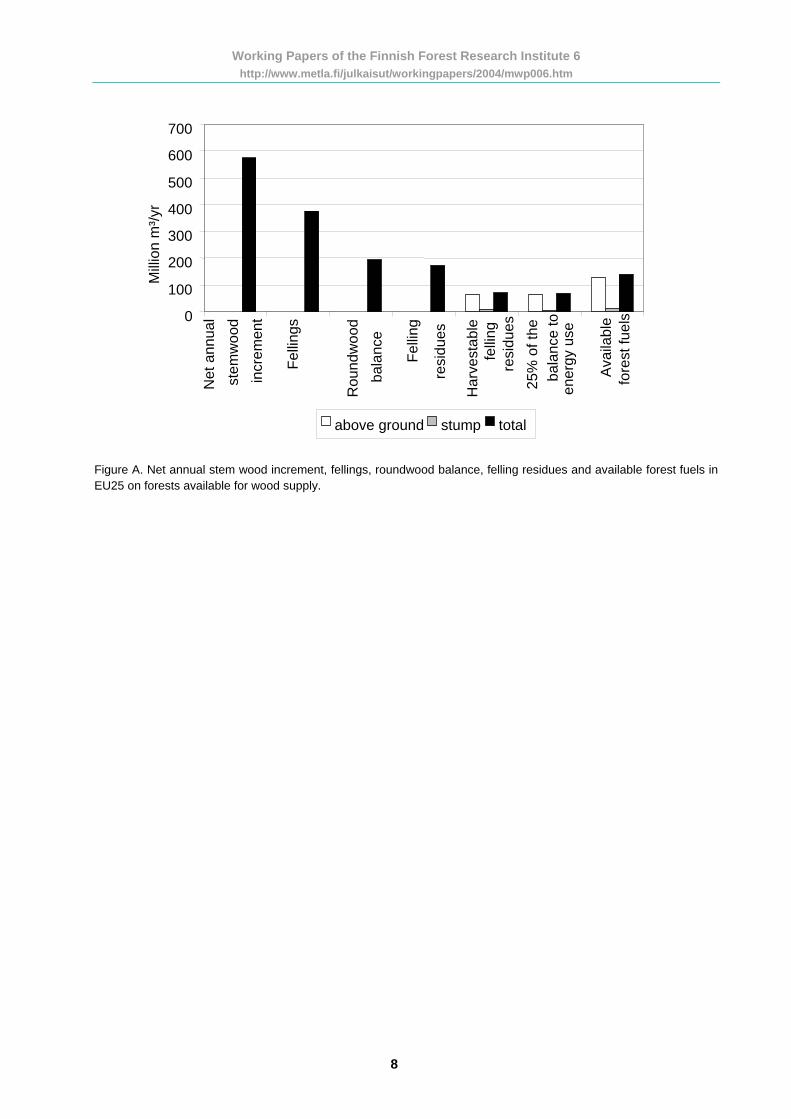
The potential sources of forest fuels are felling residues and stumps from current fellings and theroundwood balance, consisting of the stem wood balance, its crown mass and stump wood. It wasestimated that felling residues total 173 mill. m3 annually. Annually harvestable residues wereestimated to be 63 mill. m3. In addition, about 9 mill. m3 stump wood (out of 78 mill. m3 totalpotential) could be used for energy production. When 25 % of the roundwood balance is directed toenergy use, 64 mill. m3 of above ground biomass and about 4 mill. m3 of stump wood could be usedfor energy annually. Thus the available forest fuel totals about 140 mill. m3 per year, i.e. about 56 mill.owen dry tons of wood, which corresponds to about 280 TWh of energy or 24 Mtoe. This would beabout 24% of the current use of renewables in EU25. For comparison, available forest fuels equal toabout 37% of the current annual fellings.Keywords
felling residues, forest fuels, roundwood balance, wood energy
Available at
http://www.metla.fi/julkaisut/workingpapers/2004/mwp006.htmReplaces
Is replaced by
Contact information
Timo Karjalainen, Finnish Forest Research Institute, Joensuu Research Centre, Yliopistokatu 7 (P.O.Box 68), FI-80101 Joensuu, Finland. E-mail [email protected]
Other information
Working Papers of the Finnish Forest Research Institute 6 http://www.metla.fi/julkaisut/workingpapers/2004/mwp006.htm
Contents
Preface ......................................................................................................................................................... 6
Executive Summary ................................................................................................................................... 7
1 Introduction.......................................................................................................................................... 9
1.1 Renewables and wood energy in the European Union energy policy............................................. 9
1.2 Aim of the study ........................................................................................................................... 11
1.3 Countries and country grouping ................................................................................................... 12
2 Methods............................................................................................................................................... 14
2.1 Background data ........................................................................................................................... 14
2.2 Definitions and methodology........................................................................................................ 14
2.2.1 Volume of standing trees .................................................................................................... 13
3 Results on roundwood balance ......................................................................................................... 17
3.1 Standing volume, dead trees, and growing stock.......................................................................... 17
3.2 Net annual increment, fellings, and roundwood balance .............................................................. 18
3.2.1 Net annual increment, fellings, and roundwood balance in Nordics .................................. 20
3.2.2 Net annual increment, fellings, and roundwood balance in Baltics....................... 20
3.2.3 Net annual increment, fellings, and roundwood balance in C-E Europe............... 20
3.2.4 Net annual increment, fellings, and roundwood balance in C-W Europe.............. 21
3.2.5 Net annual increment, fellings, and roundwood balance in N-W Europe ............. 22
3.2.6 Net annual increment, fellings, and roundwood balance in Iberia......................... 22
3.2.7 Net annual increment, fellings, and roundwood balance in S & S-E Europe ........ 23
3.3 Roundwood production ................................................................................................................ 23
4 Estimation of felling residues ................................................................................................................ 27
4.1 Definition of forest fuel components and estimation of the total potential....................................... 27
4.2 Estimation of technically harvestable forest fuel potential ............................................................... 29
4

Working Papers of the Finnish Forest Research Institute 6 http://www.metla.fi/julkaisut/workingpapers/2004/mwp006.htm
5 Estimation of the costs for felling residue chips .................................................................................. 34
6 Concluding remarks............................................................................................................................... 37
References .................................................................................................................................................. 38
5

Working Papers of the Finnish Forest Research Institute 6 http://www.metla.fi/julkaisut/workingpapers/2004/mwp006.htm
Preface Several EU Directives have been adopted to promote the increasing use of renewable energy sources in different sectors. Bioenergy is presumed to play a crucial role in the expansion of the renewable energy share. The EU goals for bioenergy use are so ambitious that the availability and the price of biomass resources will be limiting factors for the growth in the future. All the main biomass sources will be needed: forest resources, agricultural biomass and biodegradable urban wastes. The goals might have an impact on the raw material markets of the forest-product industries, as the energy sector is becoming a growing player in these markets. A BioFuture project was initiated in Finland by VTT to evaluate the implications of increasing bioenergy use in Europe. The aims of the project were to assess the impacts of various EU policies and directives as well as new business concepts on future utilisation of biomass in Europe and to identify the new technologies that will be beneficial in attaining a balanced and cost-efficient utilisation of forest biomass resources in the Europe of the future. Reliable, up-to-date and accurate information on the forest biomass resources that could be used for energy production purposes is essential to the assessments of the BioFuture project. The energy wood potential in Europe (EU25) was estimated by the Finnish Forest Research Institute (Metla). The work was divided into two tasks, namely estimation of roundwood balance and estimation of felling residues. The study was limited to the forests available for wood supply. Roundwood balance, which is the difference between the net annual increment and fellings, illustrates the unutilised increment that could be used for industrial purposes, energy production or left in forests. Felling residues that are usually left in forests are becoming increasingly important source for wood-based energy production. Professor Pentti Hakkila from VTT is acknowledged for valuable comments and advice on this topic. The BioFuture project was coordinated by VTT. The project was financed by the National Technology Agency of Finland (Tekes), by the Ministry of Trade and Industry, by the Finnish Forest Industries Federation, by VTT, and by the companies Fortum Oil and Gas, Foster Wheeler Energia, Metso, M-real, Vapo, and Wärtsilä. The work will also be reported to the EU Network of Excellence on Bioenergy. The cooperation with Metla, VTT, and other actors in the BioFuture project was very successful and fruitful. The cross-linking networking was essential for gaining the new data and for carrying out the assessments. Authors of this report would like to thank BioFuture coordination team and advisory group for their comments and support for the study. In particular professor Pentti Hakkila is acknowledged for his valuable comments. Juha Laitila and Kari Väätäinen from Metla are acknowledged of the layout and photographs of the front page of this report and Markus Nagel for the final editing. Timo Karjalainen, Antti Asikainen, Jan Ilavsky, Raffaella Zamboni, Kaisa-Elina Hotari & Domink Röser Finnish Forest Research Institute Kai Sipilä (BioFuture project coordinator) & Tuula Mäkinen (BioFuture project manager) VTT Processes
6
Working Papers of the Finnish Forest Research Institute 6 http://www.metla.fi/julkaisut/workingpapers/2004/mwp006.htm
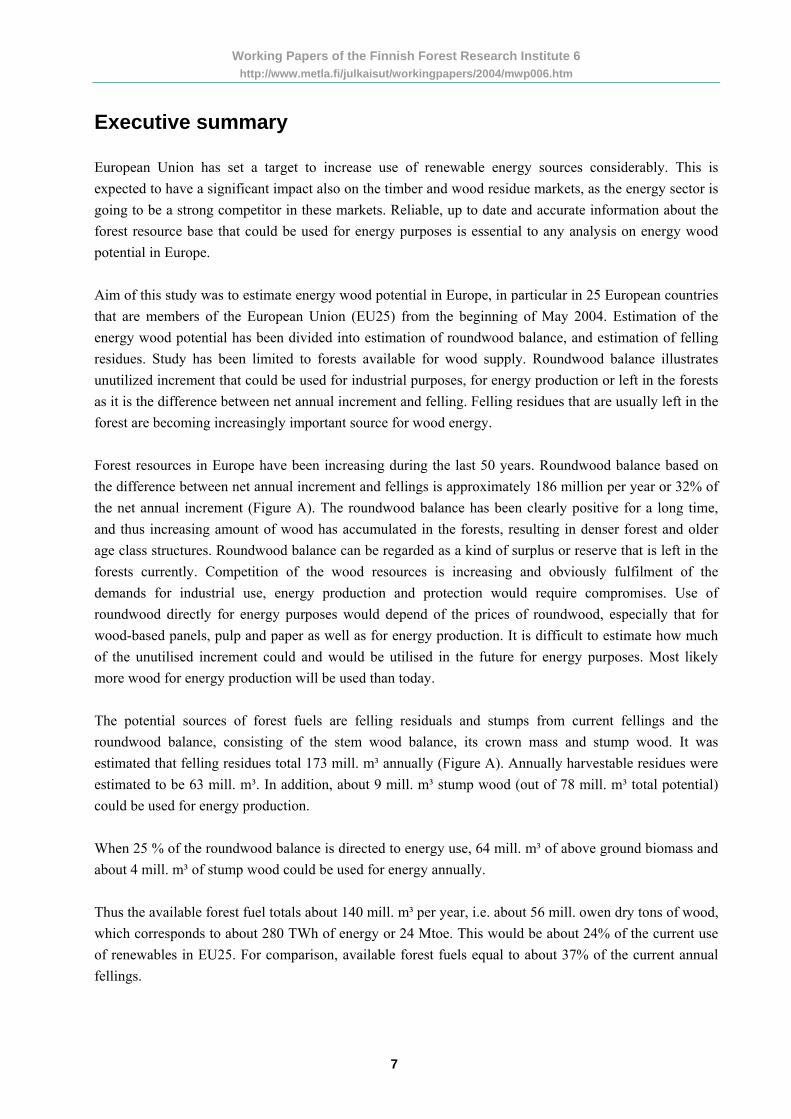
Executive summary European Union has set a target to increase use of renewable energy sources considerably. This is expected to have a significant impact also on the timber and wood residue markets, as the energy sector is going to be a strong competitor in these markets. Reliable, up to date and accurate information about the forest resource base that could be used for energy purposes is essential to any analysis on energy wood potential in Europe. Aim of this study was to estimate energy wood potential in Europe, in particular in 25 European countries that are members of the European Union (EU25) from the beginning of May 2004. Estimation of the energy wood potential has been divided into estimation of roundwood balance, and estimation of felling residues. Study has been limited to forests available for wood supply. Roundwood balance illustrates unutilized increment that could be used for industrial purposes, for energy production or left in the forests as it is the difference between net annual increment and felling. Felling residues that are usually left in the forest are becoming increasingly important source for wood energy. Forest resources in Europe have been increasing during the last 50 years. Roundwood balance based on the difference between net annual increment and fellings is approximately 186 million per year or 32% of the net annual increment (Figure A). The roundwood balance has been clearly positive for a long time, and thus increasing amount of wood has accumulated in the forests, resulting in denser forest and older age class structures. Roundwood balance can be regarded as a kind of surplus or reserve that is left in the forests currently. Competition of the wood resources is increasing and obviously fulfilment of the demands for industrial use, energy production and protection would require compromises. Use of roundwood directly for energy purposes would depend of the prices of roundwood, especially that for wood-based panels, pulp and paper as well as for energy production. It is difficult to estimate how much of the unutilised increment could and would be utilised in the future for energy purposes. Most likely more wood for energy production will be used than today. The potential sources of forest fuels are felling residuals and stumps from current fellings and the roundwood balance, consisting of the stem wood balance, its crown mass and stump wood. It was estimated that felling residues total 173 mill. m³ annually (Figure A). Annually harvestable residues were estimated to be 63 mill. m³. In addition, about 9 mill. m³ stump wood (out of 78 mill. m³ total potential) could be used for energy production. When 25 % of the roundwood balance is directed to energy use, 64 mill. m³ of above ground biomass and about 4 mill. m³ of stump wood could be used for energy annually. Thus the available forest fuel totals about 140 mill. m³ per year, i.e. about 56 mill. owen dry tons of wood, which corresponds to about 280 TWh of energy or 24 Mtoe. This would be about 24% of the current use of renewables in EU25. For comparison, available forest fuels equal to about 37% of the current annual fellings.
7
Working Papers of the Finnish Forest Research Institute 6 http://www.metla.fi/julkaisut/workingpapers/2004/mwp006.htm
700
600
500
400
Mill
ion
m³/y
r
300
200
100 0 Figure A. Net annual stem wood increment, fellings, roundwood balance, felling residues and available forest fuels in EU25 on forests available for wood supply.
Net
ann
ual
stem
woo
d in
crem
ent
Felli
ngs
Rou
ndw
ood
bala
nce
Felli
ng
resi
dues
Har
vest
able
fe
lling
re
sidu
es
25%
of t
he
bala
nce
to
Ava
ilabl
e fo
rest
fuel
s
ener
gy u
se
above ground stump total
8
Working Papers of the Finnish Forest Research Institute 6 http://www.metla.fi/julkaisut/workingpapers/2004/mwp006.htm
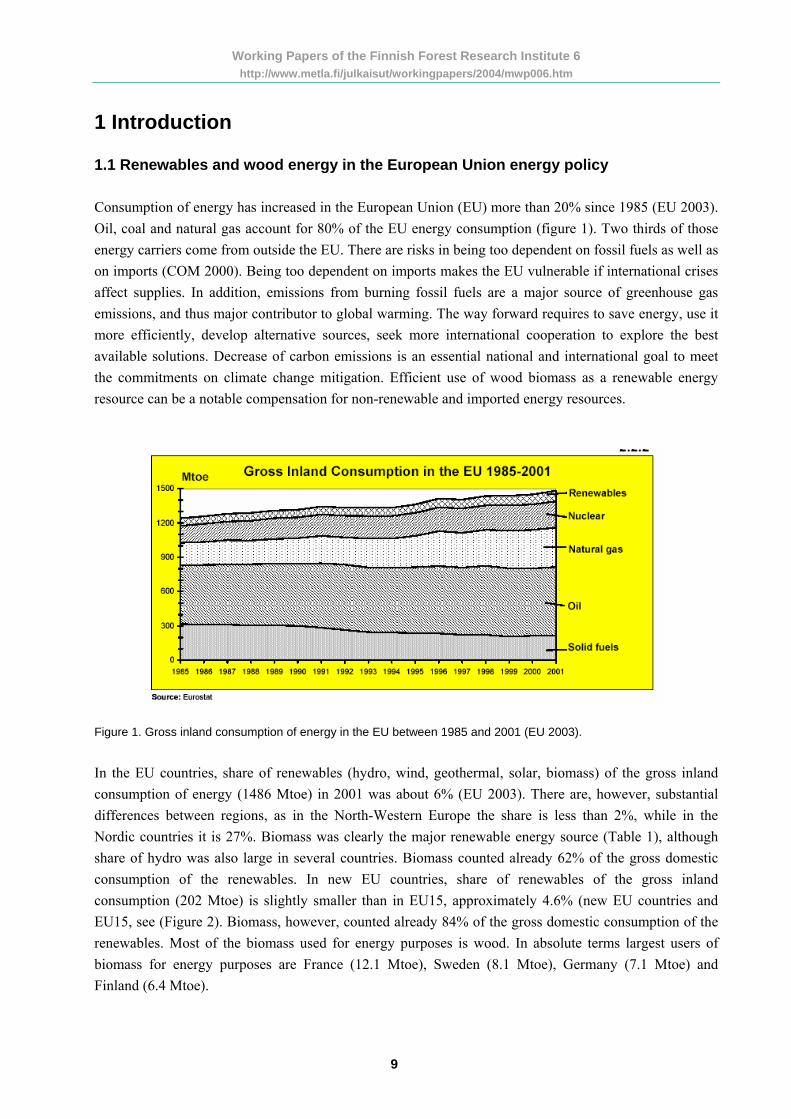
1 Introduction 1.1 Renewables and wood energy in the European Union energy policy Consumption of energy has increased in the European Union (EU) more than 20% since 1985 (EU 2003). Oil, coal and natural gas account for 80% of the EU energy consumption (figure 1). Two thirds of those energy carriers come from outside the EU. There are risks in being too dependent on fossil fuels as well as on imports (COM 2000). Being too dependent on imports makes the EU vulnerable if international crises affect supplies. In addition, emissions from burning fossil fuels are a major source of greenhouse gas emissions, and thus major contributor to global warming. The way forward requires to save energy, use it more efficiently, develop alternative sources, seek more international cooperation to explore the best available solutions. Decrease of carbon emissions is an essential national and international goal to meet the commitments on climate change mitigation. Efficient use of wood biomass as a renewable energy resource can be a notable compensation for non-renewable and imported energy resources.
Figure 1. Gross inland consumption of energy in the EU between 1985 and 2001 (EU 2003).
In the EU countries, share of renewables (hydro, wind, geothermal, solar, biomass) of the gross inland consumption of energy (1486 Mtoe) in 2001 was about 6% (EU 2003). There are, however, substantial differences between regions, as in the North-Western Europe the share is less than 2%, while in the Nordic countries it is 27%. Biomass was clearly the major renewable energy source (Table 1), although share of hydro was also large in several countries. Biomass counted already 62% of the gross domestic consumption of the renewables. In new EU countries, share of renewables of the gross inland consumption (202 Mtoe) is slightly smaller than in EU15, approximately 4.6% (new EU countries and EU15, see (Figure 2). Biomass, however, counted already 84% of the gross domestic consumption of the renewables. Most of the biomass used for energy purposes is wood. In absolute terms largest users of biomass for energy purposes are France (12.1 Mtoe), Sweden (8.1 Mtoe), Germany (7.1 Mtoe) and Finland (6.4 Mtoe).
9

Working Papers of the Finnish Forest Research Institute 6 http://www.metla.fi/julkaisut/workingpapers/2004/mwp006.htm
Table 1. Gross inland consumption of energy, including all fuels, separately for renewables (Mtoe), and share of biomass of the renewables in 2001 (EU 2003). Note that total in this table includes also new EU countries (202.2 Mtoe).
Gross inland consumption Country group Country
All fuels Renewables Biomass % of renewables
Finland 33.2 7.6 84 Sweden 51.6 15.0 54 Nordics
Total 84.8 22.6 Estonia 5.0 0.5 100 Latvia 4.3 1.5 84 Lithuania 8.2 0.7 96
Baltics
Total 17.5 2.7 Austria 30.3 6.7 45 Czech Republic 41.0 0.7 74 Hungary 25.1 0.4 95 Poland 90.2 4.1 95 Slovakia 18.5 0.7 41
Central-Eastern Europe
Total 205.1 12.6 France 262.3 18.6 65 Germany 348.8 9.9 72 Luxembourg 3.8 0.1 -
Central-Western Europe
Total 614.9 28.6 Belgium 55.6 0.8 88 Denmark 19.9 2.2 82 Ireland 14.4 0.3 67 The Netherlands 77.6 1.6 94 United Kingdom 232.5 2.7 85
North-Western Europe
Total 400.0 7.6 Portugal 24.2 3.4 62 Spain 126.3 8.3 50 Iberia
Total 150.5 11.7 Cyprus 2.4 0.04 3 Greece 28.9 1.3 77 Italy 176.6 13.5 46 Malta 0.9 - - Slovenia 6.6 0.7 55
South & South-Eastern Europe
Total 215.4 15.5
Total 1688.2 101.3
Need to develop and increase the use of renewable energy has been emphasised in the European Union. The Communication from the Commission entitled “Energy for the future: renewable sources of energy - White Paper for a Community strategy and action plan” (COM 1997) recommends an indicative target of 12% of energy from renewable sources in gross internal consumption in the Community by 2010. The White Paper also outlines the goals for modern bioenergy in Europe, to increase the contribution of bioenergy from 45 Mtoe in 1995 to 135 Mtoe in 2010. This requires firm decisions and wide co-operation
10
Working Papers of the Finnish Forest Research Institute 6 http://www.metla.fi/julkaisut/workingpapers/2004/mwp006.htm
on local, regional and national level. The Communication from the Commission on the implementation of the Community strategy and action plan for renewable energy sources (1998-2000) notes the progress which has been made, but stresses that further efforts are needed at the Community and national level to attain these objectives, in particular new legislation on renewable energy sources and their promotion (COM 2001). Measures related to energy efficiency and renewable energy sources are important elements of the action needed to comply with the provisions of the Kyoto Protocol, as provided for in the European Climate Change Programme (ECCP). Biomass is getting increasingly important element of energy, environment and agriculture policy because of its security of supply. The biomass sector has increased nearly by 15% between 1995 and 1998 in EU15. Forest residues, wood industry residues and short rotation energy crops are the most important sources of solid biofuels. In 1990, approximately 143 million m³ of wood equivalent were used to produce energy in EU15 (including also Austria, Finland and Sweden), of which 101 million m³ were woodfuels (conventional fuelwood, industrial residues and recovered products) and 42 million m³ as wood derived fuels (black liquor) (FAO 1997). For comparison, fellings in 1990 were 275 million m³ (UN-ECE/FAO 1992) meaning that use of wood for energy purposes was as high as 37% or even 52% if wood derived fuels are included. Conventional use of fuelwood has decreased over the decades, while use of residues from the wood processing industries, recovered wood and demolition waste for energy purposes has increased. Felling residues have been usually left on the site, but during the last years, increasing amounts of felling residues have been collected and used for energy purposes, in particular in Sweden and Finland (Hakkila & Parikka 2002). In 1998, wood used in households represented 25.6 Mtoe and the wood used by industry was 8.7 Mtoe (COM 2001). Extent of wood biomass use as energy resource varies among European countries. Forest resources, technology, power plants, national laws and decisions, and many other issues affect on accelerating use and development of renewable energy sector. Implementation of the White Paper is expected to have a significant impact on the timber and wood residues markets, as the energy sector will become a new player on these markets (Dielen et al. 2000). Reliable information about the forest resource base that could be used for energy purposes is essential to any analysis on energy wood potential in Europe. 1.2 Aim of the study Aim of this study is to estimate energy wood potential in Europe, in particular in 25 European countries that are members of the European Union from the beginning of May 2004 (EU25). It has been divided into two assignments. The first assignment includes estimation of roundwood balance on forest available for wood supply, i.e. estimation of unutilised roundwood potential that could be used for energy purposes, but also for manufacturing conventional products in the forest based industries or not harvested as has been the case so far. Study has been limited to forests available for wood supply as those include forests where any legal, economic, or specific environmental restrictions do not have a significant impact on the supply of wood, and thus use of wood for energy purposes is not restricted either. This is a practical limitation, as forests with above mentioned restrictions are likely to have very small supply of wood, and therefore also very limited source of energy wood. Roundwood balance is calculated as a difference between net annual increment and fellings, and therefore a major indicator of the long term sustainability
11

Working Papers of the Finnish Forest Research Institute 6 http://www.metla.fi/julkaisut/workingpapers/2004/mwp006.htm
of wood supply, provided that both net annual increment and fellings refer to the same area and same time period. In addition to roundwood balance, information about roundwood and fuelwood production have been collected and presented. Information about fellings and roundwood production is utilised in the second assignment. The second assignment includes estimation of felling residues on forest available for wood supply, as felling residues are becoming increasingly important source of energy. Assignment is further divided into three parts of which the first concerns estimation of residue roundwood, crown mass, and stump and roots. The second part includes estimation of the potential that is technically possible to harvest. The third part concerns estimation of availability of forest fuels at given fuel prices around a fuel plant in selected countries. 1.3 Countries and country grouping Whole study has been limited to cover 25 European countries that are members of expanded European Union (EU) in spring 2004 (Figure 2), later called as EU25. Results and analysis are presented on country level and by country groups based on available statistics and reports reflecting the situation in late 1990´s – early 2000 (Table 2). Country grouping is the same as in some international statistics and analysis.
Figure 2. Member countries of the European Union (EU), known as EU15 have yellow background in this map, and 10 new member countries joining the EU in May 2004 are shown in blue. These 25 countries are analysed in this report. Three candidate countries joining the EU at a later stage are shown in purple. Source: http://europa.eu.int/abc/maps/print_index_en.htm
12

Working Papers of the Finnish Forest Research Institute 6 http://www.metla.fi/julkaisut/workingpapers/2004/mwp006.htm
Table 2. Countries of the expanding EU have been divided in 7 groups in this study. Grouping is similar to that in the UN-ECE/FAO Forest Resources Assessment (UN-ECE/FAO 2000).
Country group Country
Finland Nordics
Sweden
Estonia
Latvia Baltics
Lithuania
Austria
Czech Republic
Hungary
Poland
Central-Eastern Europe
Slovakia
France
Germany Central-Western Europe
Luxembourg
Belgium
Denmark
Ireland
The Netherlands
North-Western Europe
United Kingdom
Portugal Iberia
Spain
Cyprus
Greece
Italy
Malta
South & South-Eastern Europe
Slovenia
13

Working Papers of the Finnish Forest Research Institute 6 http://www.metla.fi/julkaisut/workingpapers/2004/mwp006.htm
2 Methods 2.1 Background data Regarding the first assignment, data for net annual increment (NAI), fellings, and balance between NAI and fellings are from the UN-ECE/FAO Forest Resources Assessment 2000 report, known as TBFRA-2000 (UN-ECE/FAO 2000). TBFRA-2000 is the latest in a series of surveys of the temperate and boreal industrialised countries carried out by the United Nations Economic Commission for Europe (UN-ECE). First report has been published in 1947 and the most recent in 1993. The original data collected at the national level have been adjusted to fit internationally agreed terms and definitions. As a result, data for a country published in the TBFRA-2000 report does not necessarily correspond to those published in national sources. This is normal and also inevitable result of adapting national data to improve comparability between countries. One chapter of the TBFRA-2000 report provides details of the reliability and comparability of the TBFRA-2000 results. Reference period of individual countries that are included in this report range from 1980 to 1997, only data for Cyprus is from 1980’s – early 1990’s, data for the other countries is from mid 1990’s. Estimation of roundwood and fuelwood production is based on the data from the Finnish Statistical Yearbooks 1999-2001 (Metla 1999, 2000, 2001, 2002). Results in the report are presented as annual values or percentages. Annual values reported in tables and figures are mean values from several years’ data whenever data from several years was available. In some cases, data was available only for one-year period, whereupon mean value was not possible to calculate. 2.2 Definitions and methodology Definitions and calculation concepts as used in this study are presented in Table 3. They have been approved internationally during the process of TBFRA 2000 elaboration. 2.2.1 Volume of standing trees Single trees volume is a basic input value for the calculation of the volume of growing stock, increment, fellings and removals and can be transformed into woody biomass. The national definitions of wood volume show differences (Table 4). The volume figures depend on three factors:
• how small trees are taken into account (minimum threshold value for the diameter at breast height, d.b.h.
• starting point of the stem volume included (ground or stump) • end point of the stem volume included (minimum top diameter)
14
Working Papers of the Finnish Forest Research Institute 6 http://www.metla.fi/julkaisut/workingpapers/2004/mwp006.htm
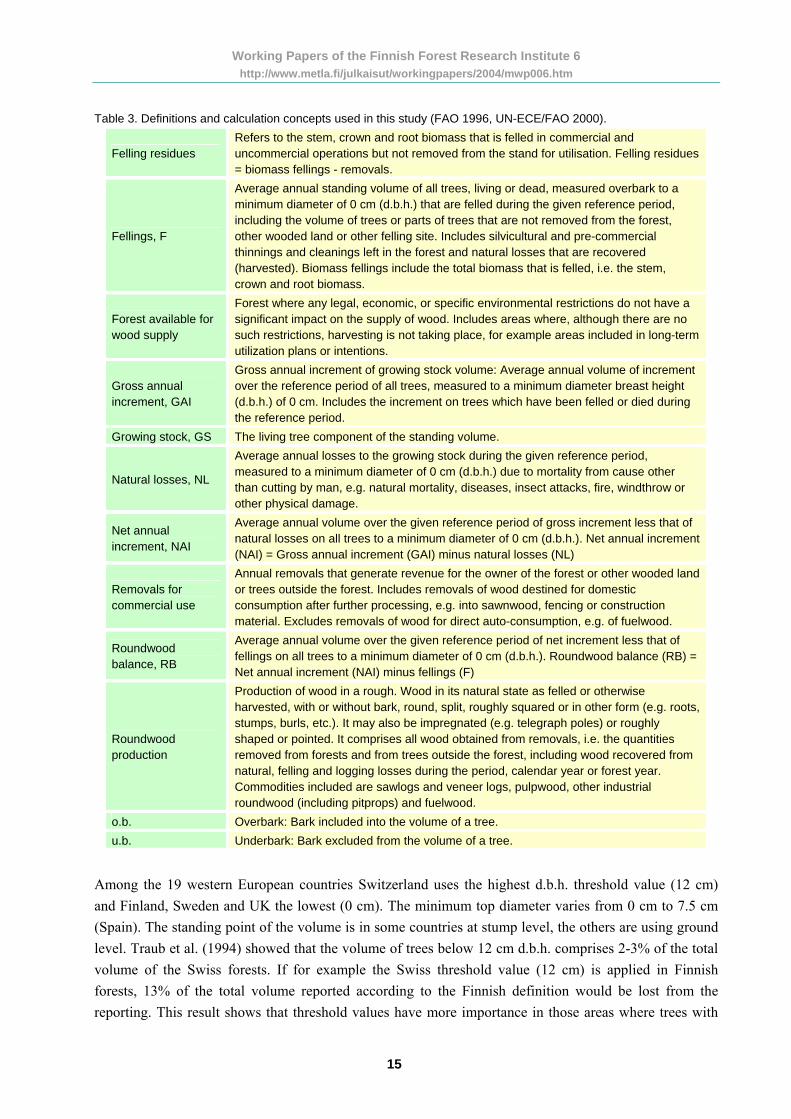
Table 3. Definitions and calculation concepts used in this study (FAO 1996, UN-ECE/FAO 2000).
Felling residues Refers to the stem, crown and root biomass that is felled in commercial and uncommercial operations but not removed from the stand for utilisation. Felling residues = biomass fellings - removals.
Fellings, F
Average annual standing volume of all trees, living or dead, measured overbark to a minimum diameter of 0 cm (d.b.h.) that are felled during the given reference period, including the volume of trees or parts of trees that are not removed from the forest, other wooded land or other felling site. Includes silvicultural and pre-commercial thinnings and cleanings left in the forest and natural losses that are recovered (harvested). Biomass fellings include the total biomass that is felled, i.e. the stem, crown and root biomass.
Forest available for wood supply
Forest where any legal, economic, or specific environmental restrictions do not have a significant impact on the supply of wood. Includes areas where, although there are no such restrictions, harvesting is not taking place, for example areas included in long-term utilization plans or intentions.
Gross annual increment, GAI
Gross annual increment of growing stock volume: Average annual volume of increment over the reference period of all trees, measured to a minimum diameter breast height (d.b.h.) of 0 cm. Includes the increment on trees which have been felled or died during the reference period.
Growing stock, GS The living tree component of the standing volume.
Natural losses, NL
Average annual losses to the growing stock during the given reference period, measured to a minimum diameter of 0 cm (d.b.h.) due to mortality from cause other than cutting by man, e.g. natural mortality, diseases, insect attacks, fire, windthrow or other physical damage.
Net annual increment, NAI
Average annual volume over the given reference period of gross increment less that of natural losses on all trees to a minimum diameter of 0 cm (d.b.h.). Net annual increment (NAI) = Gross annual increment (GAI) minus natural losses (NL)
Removals for commercial use
Annual removals that generate revenue for the owner of the forest or other wooded land or trees outside the forest. Includes removals of wood destined for domestic consumption after further processing, e.g. into sawnwood, fencing or construction material. Excludes removals of wood for direct auto-consumption, e.g. of fuelwood.
Roundwood balance, RB
Average annual volume over the given reference period of net increment less that of fellings on all trees to a minimum diameter of 0 cm (d.b.h.). Roundwood balance (RB) = Net annual increment (NAI) minus fellings (F)
Roundwood production
Production of wood in a rough. Wood in its natural state as felled or otherwise harvested, with or without bark, round, split, roughly squared or in other form (e.g. roots, stumps, burls, etc.). It may also be impregnated (e.g. telegraph poles) or roughly shaped or pointed. It comprises all wood obtained from removals, i.e. the quantities removed from forests and from trees outside the forest, including wood recovered from natural, felling and logging losses during the period, calendar year or forest year. Commodities included are sawlogs and veneer logs, pulpwood, other industrial roundwood (including pitprops) and fuelwood.
o.b. Overbark: Bark included into the volume of a tree. u.b. Underbark: Bark excluded from the volume of a tree.
Among the 19 western European countries Switzerland uses the highest d.b.h. threshold value (12 cm) and Finland, Sweden and UK the lowest (0 cm). The minimum top diameter varies from 0 cm to 7.5 cm (Spain). The standing point of the volume is in some countries at stump level, the others are using ground level. Traub et al. (1994) showed that the volume of trees below 12 cm d.b.h. comprises 2-3% of the total volume of the Swiss forests. If for example the Swiss threshold value (12 cm) is applied in Finnish forests, 13% of the total volume reported according to the Finnish definition would be lost from the reporting. This result shows that threshold values have more importance in those areas where trees with
15
Working Papers of the Finnish Forest Research Institute 6 http://www.metla.fi/julkaisut/workingpapers/2004/mwp006.htm
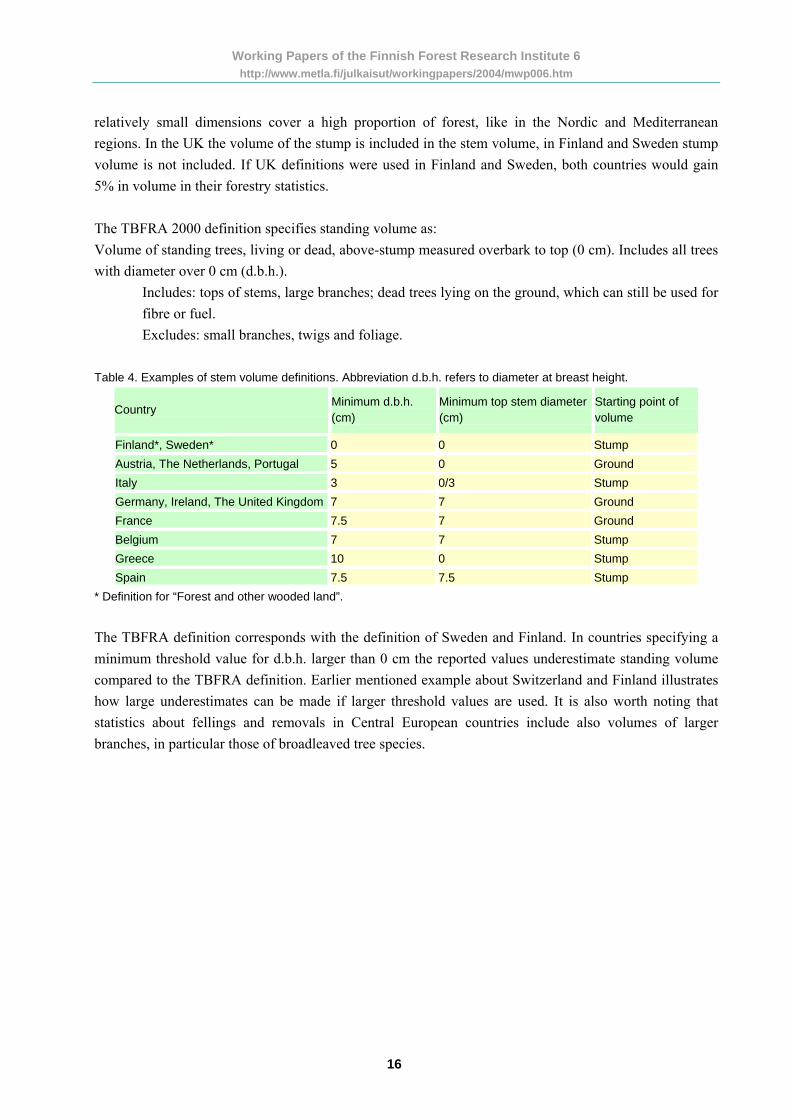
relatively small dimensions cover a high proportion of forest, like in the Nordic and Mediterranean regions. In the UK the volume of the stump is included in the stem volume, in Finland and Sweden stump volume is not included. If UK definitions were used in Finland and Sweden, both countries would gain 5% in volume in their forestry statistics. The TBFRA 2000 definition specifies standing volume as: Volume of standing trees, living or dead, above-stump measured overbark to top (0 cm). Includes all trees with diameter over 0 cm (d.b.h.).
Includes: tops of stems, large branches; dead trees lying on the ground, which can still be used for fibre or fuel. Excludes: small branches, twigs and foliage.
Table 4. Examples of stem volume definitions. Abbreviation d.b.h. refers to diameter at breast height.
Country Minimum d.b.h. (cm)
Minimum top stem diameter (cm)
Starting point of volume
Finland*, Sweden* 0 0 Stump Austria, The Netherlands, Portugal 5 0 Ground Italy 3 0/3 Stump Germany, Ireland, The United Kingdom 7 7 Ground France 7.5 7 Ground Belgium 7 7 Stump Greece 10 0 Stump Spain 7.5 7.5 Stump
* Definition for “Forest and other wooded land”.
The TBFRA definition corresponds with the definition of Sweden and Finland. In countries specifying a minimum threshold value for d.b.h. larger than 0 cm the reported values underestimate standing volume compared to the TBFRA definition. Earlier mentioned example about Switzerland and Finland illustrates how large underestimates can be made if larger threshold values are used. It is also worth noting that statistics about fellings and removals in Central European countries include also volumes of larger branches, in particular those of broadleaved tree species.
16
Working Papers of the Finnish Forest Research Institute 6 http://www.metla.fi/julkaisut/workingpapers/2004/mwp006.htm
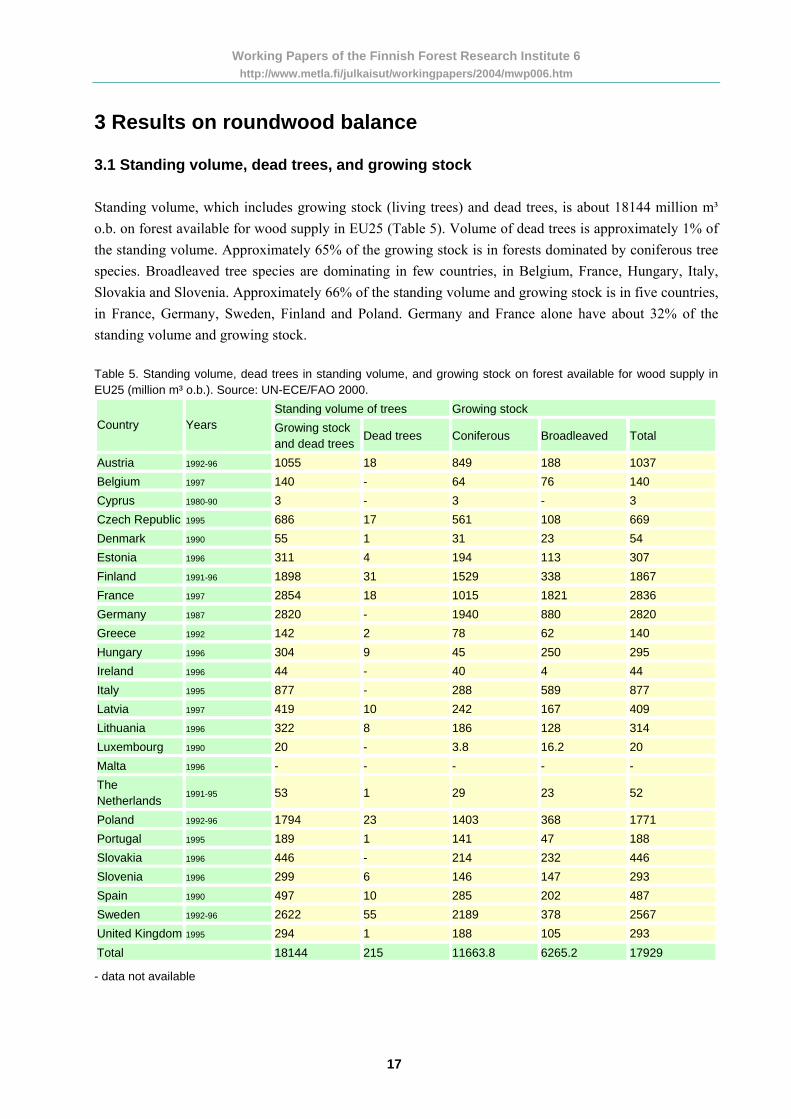
3 Results on roundwood balance 3.1 Standing volume, dead trees, and growing stock Standing volume, which includes growing stock (living trees) and dead trees, is about 18144 million m³ o.b. on forest available for wood supply in EU25 (Table 5). Volume of dead trees is approximately 1% of the standing volume. Approximately 65% of the growing stock is in forests dominated by coniferous tree species. Broadleaved tree species are dominating in few countries, in Belgium, France, Hungary, Italy, Slovakia and Slovenia. Approximately 66% of the standing volume and growing stock is in five countries, in France, Germany, Sweden, Finland and Poland. Germany and France alone have about 32% of the standing volume and growing stock. Table 5. Standing volume, dead trees in standing volume, and growing stock on forest available for wood supply in EU25 (million m³ o.b.). Source: UN-ECE/FAO 2000.
Standing volume of trees Growing stock Country Years Growing stock
and dead treesDead trees Coniferous Broadleaved Total
Austria 1992-96 1055 18 849 188 1037 Belgium 1997 140 - 64 76 140 Cyprus 1980-90 3 - 3 - 3 Czech Republic 1995 686 17 561 108 669 Denmark 1990 55 1 31 23 54 Estonia 1996 311 4 194 113 307 Finland 1991-96 1898 31 1529 338 1867 France 1997 2854 18 1015 1821 2836 Germany 1987 2820 - 1940 880 2820 Greece 1992 142 2 78 62 140 Hungary 1996 304 9 45 250 295 Ireland 1996 44 - 40 4 44 Italy 1995 877 - 288 589 877 Latvia 1997 419 10 242 167 409 Lithuania 1996 322 8 186 128 314 Luxembourg 1990 20 - 3.8 16.2 20 Malta 1996 - - - - - The Netherlands
1991-95 53 1 29 23 52
Poland 1992-96 1794 23 1403 368 1771 Portugal 1995 189 1 141 47 188 Slovakia 1996 446 - 214 232 446 Slovenia 1996 299 6 146 147 293 Spain 1990 497 10 285 202 487 Sweden 1992-96 2622 55 2189 378 2567 United Kingdom 1995 294 1 188 105 293 Total 18144 215 11663.8 6265.2 17929
- data not available
17
Working Papers of the Finnish Forest Research Institute 6 http://www.metla.fi/julkaisut/workingpapers/2004/mwp006.htm
Forest resources in Europe have been increasing during the last 50 years (Kuusela 1994, Gold 2003). Forest cover has increased steadily by about 8%, average growing stock by about 10%, and average net annual increment by as much as 25%. Development of forest resources depends on the shifts in the policy and market framework. Forest resources react with quite a high inertia to changes in the relationships between society and forestry. Development of average growing stock and increment depend mostly on the age class structure of forests. Age-class structure can be changed significantly by cuttings, afforestation of new forest stands, large-scale calamities, etc. Growing stock further depends on removals (thinnings and final fellings) and the growth in forest stands. Removals are mostly market driven, considering silvicultural constraints. Growth in stands depends on various exogenous factors, such as pollution or climate change. Increase of forest resources has been a result of changes in land-use history, afforestation of former agricultural land, fellings being less than increment, increased nitrogen deposition, temperatures and atmospheric carbon dioxide concentration (e.g. Spiecker et al. 1996). 3.2 Net annual increment, fellings, and roundwood balance Net annual increment (NAI) is calculated as difference between gross annual increment (GAI) and natural losses (NL). Gross annual increment includes total increase of stem volume during a year. It includes both trees that are part of the growing stock and trees that have died or have been removed during the year. Natural losses include the volume of trees that dies naturally during a year and is not included in fellings. Net annual increment is available for various uses, for instance as raw material for industries, and raw material and energy source in households. NAI in EU25 is approximately 576 million m³ per year measured over bark on forest available for wood supply (Table 6). Fellings are approximately 390 million m³ per year, i.e. 68% of the NAI. About 67% of the NAI are in coniferous species dominated forests, while 71% of the fellings are in those forests. Based on the difference between NAI and fellings, i.e. roundwood balance, approximately 186 million m³ per year or 32% of the NAI is left in the forests. Table 6. NAI, fellings and roundwood balance in EU25 on forests available for wood supply (million m³ /yr o.b.).
NAI Fellings Roundwood balance
Coniferous species dominated forests
384.9 277.1 107.8
Broadleaved species dominated forests
190.7 112.2 78.5
Total 575.6 389.3 186.3
As the roundwood balance has been clearly positive for a long time, increasing amount of wood has been accumulating in the forests, resulting in denser forest structure and older age class structure. Roundwood balance can be regarded as a kind of surplus or reserve that could be used as raw material in forest industries, or for energy purposes, or left in the forests as is the case currently. Increased use for industrial purposes would require additional demand and markets for wood-based products. Demand for energy is increasing, in particular that of renewable energy and thus wood energy as stated in the EU White Paper
18

Working Papers of the Finnish Forest Research Institute 6 http://www.metla.fi/julkaisut/workingpapers/2004/mwp006.htm
(COM 1997). Also demand for nature protection is increasing. This means that competition of the wood resources is increasing and obviously fulfilment of these demands would require compromises. Nevertheless, increased industrial use of wood will cause that part of the wood would end up in energy sector, share depending of the use of wood in the industries (sawmills, chemical and mechanical pulp, different paper grades etc.). In 1990, approximately 16% of the fellings were used for energy production as industrial residues and recovered products. In addition, black liquor used for energy production in the forest-based industries equalled 15% of the fellings. If similar shares would apply, more than 30% of the increased fellings would end up in energy purposes. Use of roundwood directly for energy purposes would depend on the prices of roundwood, especially that for wood-based panels, pulp and paper as well as for energy production. It is difficult to say how much of the unutilised increment (roundwood balance) could and would be utilised in the future, but most likely more than today. Estimation is further complicated by the fact that some of the forest owners are not interested to sell wood without any particular reason. NAI varies quite a lot among country groups (Figure 3). Most of the NAI in the EU25 region occurs in Nordics, Central-Eastern and Central-Western Europe, altogether 78%. Other four groups, Baltics, North-Western Europe, Iberia, and South & South Western Europe, comprises 22% of the NAI. Most of the fellings are also in those three country groups: Nordics, Central-Eastern, and Central-Western Europe, altogether 79%. In other four country groups, Baltics, North-Western Europe, Iberia, and South & South Eastern Europe, fellings cover 21% of total EU25 fellings. Although NAI is largest in the Central-Western Europe, fellings are largest in the Nordics, approximately 120 million m³ per year. Roundwood balance is largest in the Central-Western Europe, over 73 million m³, which is approximately 40% of the NAI. In relative terms, roundwood balance is smallest in the Nordics, approximately 24%, and largest in Iberia (46%) and South & South-Eastern Europe (49%). Altogether 39% of the roundwood balance, 72.5 million m³ is in Germany and France.
020406080
100120140160180200
Nordics Baltics C-E-Europe
C-WEurope
N-WEurope
Iberia S & S-EEurope
Mill
ion
m³/y
r o.b
.
NAIFellingsRoundwood balance
Figure 3. NAI, fellings and roundwood balance on forest available for wood supply in EU25 by country groups.
NAI, fellings and roundwood balance are presented by countries in Appendix 1 in the following Chapters 3.2.1-3.2.7, NAI, fellings and roundwood balance are presented by country groups.
19

Working Papers of the Finnish Forest Research Institute 6 http://www.metla.fi/julkaisut/workingpapers/2004/mwp006.htm
3.2.1 Net annual increment, fellings, and roundwood balance in Nordics NAI on forest available for wood supply is 72.5 million m³ per year in Finland and 85.4 million m³ per year in Sweden (Figure 4) Fellings in the reference period were 54.3 million m³ per year in Finland and 66.1 million m³ per year in Sweden, and thus roundwood balance 18.1 and 19.3 million m³ per year, which is 25 and 23% of the NAI.
0102030405060708090
Finland Sweden
Mill
ion
m³/y
r o.b
.
NAI
Fellings
Roundwoodbalance
Figure 4. NAI, fellings, and roundwood balance on forest available for wood supply in Finland (1991-96) and Sweden (1992-96). 3.2.2 Net annual increment, fellings, and roundwood balance in Baltics NAI on forest available for wood supply is 8.6 million m³ in Estonia, 11.1 million m³ in Latvia, and 8.5 million m³ per year in Lithuania (Figure 5). Fellings were 12.2, 6.6 and 5.2 million m³ per year, respectively. In Estonia, roundwood balance was -3.6 million m³ per year, i.e. fellings already exceeded NAI. In Latvia and Lithuania, roundwood balance was 4.5 and 3.3 million m³ per year respectively.
-6
-4
-2
0
2
4
6
8
10
12
14
Estonia Latvia Lithuania
Mill
ion
m³/y
r o.b
.
NAIFellingsRoundwood balance
Figure 5. NAI, fellings, and roundwood balance on forest available for wood supply in Estonia (2000-2001), Latvia (1996), and Lithuania (1992-96).
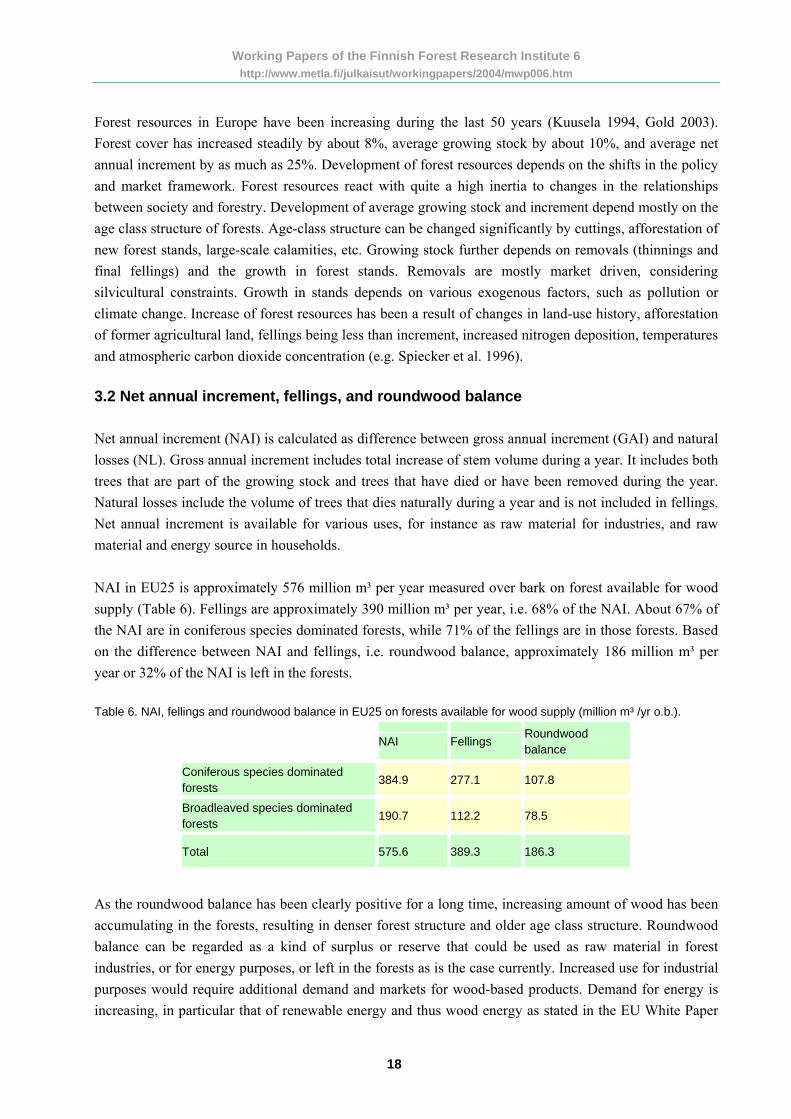
3.2.3 Net annual increment, fellings, and roundwood balance in C-E Europe In Central-Eastern Europe are Austria, Czech Republic, Hungary, Poland, and Slovakia. Highest NAI on forest available for wood supply among the five countries is in Poland, 39.4 million m³ per year and
20
Working Papers of the Finnish Forest Research Institute 6 http://www.metla.fi/julkaisut/workingpapers/2004/mwp006.htm
lowest in Hungary, 9.9 million m³ per year (Figure 6). NAI is 27.3 million m³ in Austria, 20.4 million m³ in Czech Republic, and 12.3 million m³ in Slovakia. Roundwood balance was in Poland 8.9 million m³, in Austria 7.8 million m³, in Slovakia 5.2 million m³, in Czech Republic 4.2 million m³, and in Hungary 4 million m³ per year. Roundwood balance in relative terms varies between the countries more than in the Nordics or in the Baltics, from 20 and 23% in Czech Republic and Poland, to 29% in Austria and to 41 and 42% in Hungary and Slovakia.
0
5
10
15
20
25
30
35
40
45
Austria CzechRepublic
Hungary Poland Slovakia
Mill
ion
m³/y
r o.b
.
NAI
Fellings
Roundwoodbalance
Figure 6. NAI, fellings, and roundwood balance on forest available for wood supply in Austria (1992-96), Czech Republic (1995), Hungary (1996), Poland (1992-96), and Slovakia (1996).
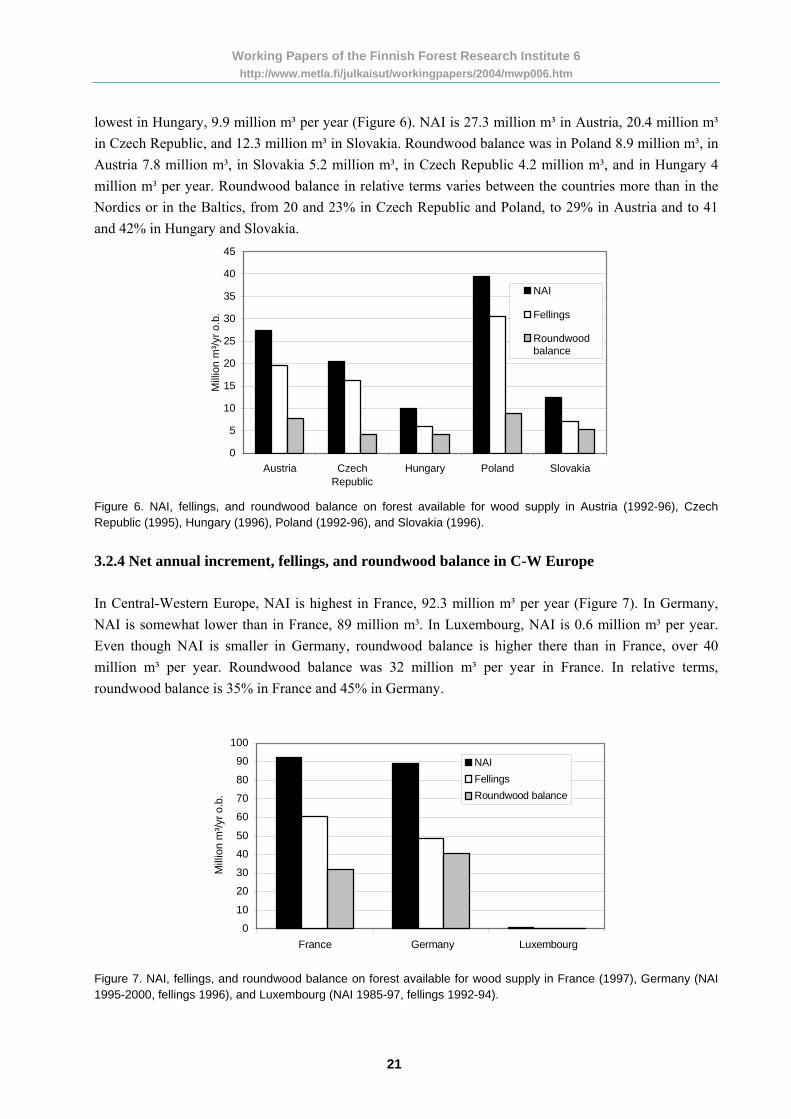
3.2.4 Net annual increment, fellings, and roundwood balance in C-W Europe In Central-Western Europe, NAI is highest in France, 92.3 million m³ per year (Figure 7). In Germany, NAI is somewhat lower than in France, 89 million m³. In Luxembourg, NAI is 0.6 million m³ per year. Even though NAI is smaller in Germany, roundwood balance is higher there than in France, over 40 million m³ per year. Roundwood balance was 32 million m³ per year in France. In relative terms, roundwood balance is 35% in France and 45% in Germany.
0
10
20
30
40
50
60
70
80
90
100
France Germany Luxembourg
Mill
ion
m³/y
r o.b
.
NAIFellingsRoundwood balance
Figure 7. NAI, fellings, and roundwood balance on forest available for wood supply in France (1997), Germany (NAI 1995-2000, fellings 1996), and Luxembourg (NAI 1985-97, fellings 1992-94).
21

Working Papers of the Finnish Forest Research Institute 6 http://www.metla.fi/julkaisut/workingpapers/2004/mwp006.htm
3.2.5 Net annual increment, fellings, and roundwood balance in N-W Europe In North-Western Europe, NAI is highest in the United Kingdom, 14.6 million m³ per year (Figure 8). In other four countries NAI is much smaller: in Belgium 5.1 million m³, in Denmark 3.2 million m³, in Ireland 3.5 million m³, and in the Netherlands 2.2 million m³ per year. Roundwood balance was in UK 5.1 million m³, in Ireland and Denmark approximately 1 million m³, and in Belgium and the Netherlands approximately 0.7 million m³ per year. Roundwood balance in relative terms is between 31 and 35% in other countries, except in Belgium, where it is 14% of the NAI.
Figure 8. NAI, fellings, and roundwood balance on forest available for wood supply in Belgium (NAI 1982-97, fellings 1986-95), Denmark (NAI 1990, fellings 1996), Ireland (1996), the Netherlands (1991-95), and the United Kingdom (1995).
0
2
4
6
8
10
12
14
16
Belgium Denmark Ireland theNetherlands
UnitedKingdom
Mill
ion
m³/y
r o.b
.
NAI
Fellings
Roundwoodbalance
3.2.6 Net annual increment, fellings, and roundwood balance in Iberia In Portugal, NAI on forests available for wood supply is 12.9 million m³ per year and in Spain 28.6 million m³ per year (Figure 9). In Portugal, fellings are relatively close to NAI, 11.2 million m³, and the roundwood balance is 13%. In Spain roundwood balance is 17.6 million m³ and 61% of the NAI.
0
5
10
15
20
25
30
35
Portugal Spain
Mill
ion
m³/y
r o.b
.
NAI
Fellings
Roundwoodbalance
Figure 9. NAI, fellings, and roundwood balance on forest available for wood supply in Portugal (1995) and Spain (NAI 1990, fellings 1994).
22
Working Papers of the Finnish Forest Research Institute 6 http://www.metla.fi/julkaisut/workingpapers/2004/mwp006.htm
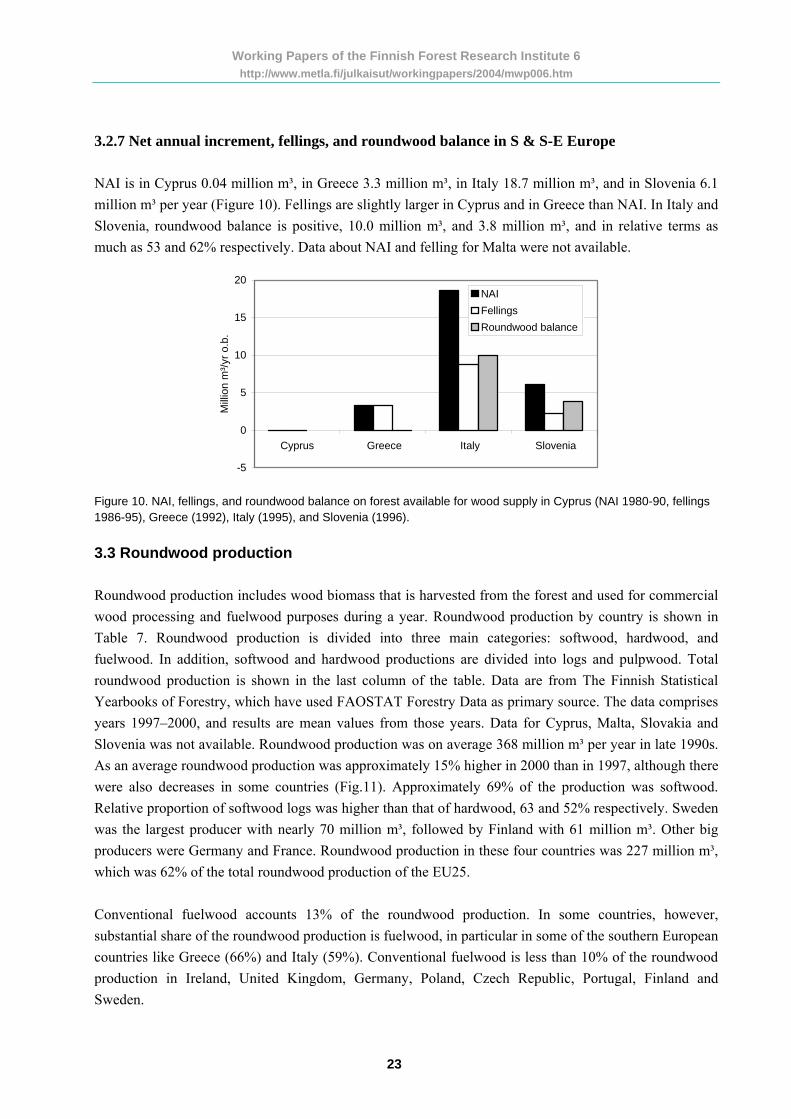
3.2.7 Net annual increment, fellings, and roundwood balance in S & S-E Europe NAI is in Cyprus 0.04 million m³, in Greece 3.3 million m³, in Italy 18.7 million m³, and in Slovenia 6.1 million m³ per year (Figure 10). Fellings are slightly larger in Cyprus and in Greece than NAI. In Italy and Slovenia, roundwood balance is positive, 10.0 million m³, and 3.8 million m³, and in relative terms as much as 53 and 62% respectively. Data about NAI and felling for Malta were not available.
-5
0
5
10
15
20
Cyprus Greece Italy Slovenia
Mill
ion
m³/y
r o.b
.
NAIFellingsRoundwood balance
Figure 10. NAI, fellings, and roundwood balance on forest available for wood supply in Cyprus (NAI 1980-90, fellings 1986-95), Greece (1992), Italy (1995), and Slovenia (1996). 3.3 Roundwood production Roundwood production includes wood biomass that is harvested from the forest and used for commercial wood processing and fuelwood purposes during a year. Roundwood production by country is shown in Table 7. Roundwood production is divided into three main categories: softwood, hardwood, and fuelwood. In addition, softwood and hardwood productions are divided into logs and pulpwood. Total roundwood production is shown in the last column of the table. Data are from The Finnish Statistical Yearbooks of Forestry, which have used FAOSTAT Forestry Data as primary source. The data comprises years 1997–2000, and results are mean values from those years. Data for Cyprus, Malta, Slovakia and Slovenia was not available. Roundwood production was on average 368 million m³ per year in late 1990s. As an average roundwood production was approximately 15% higher in 2000 than in 1997, although there were also decreases in some countries (Fig.11). Approximately 69% of the production was softwood. Relative proportion of softwood logs was higher than that of hardwood, 63 and 52% respectively. Sweden was the largest producer with nearly 70 million m³, followed by Finland with 61 million m³. Other big producers were Germany and France. Roundwood production in these four countries was 227 million m³, which was 62% of the total roundwood production of the EU25. Conventional fuelwood accounts 13% of the roundwood production. In some countries, however, substantial share of the roundwood production is fuelwood, in particular in some of the southern European countries like Greece (66%) and Italy (59%). Conventional fuelwood is less than 10% of the roundwood production in Ireland, United Kingdom, Germany, Poland, Czech Republic, Portugal, Finland and Sweden.
23

Working Papers of the Finnish Forest Research Institute 6 http://www.metla.fi/julkaisut/workingpapers/2004/mwp006.htm
Table 7. Industrial roundwood production in EU25 1997–2000 (million m³/yr o.b.), mean value for years 1997-2000
(bark rate 15%). Source: Finnish Statistical Yearbook of Forestry 1999, 2000, 2001 and 2002.
Softwood Hardwood Country
Logs Pulpwood Other* Total Logs Pulpwood Other* Total Fuel wood
Total
Austria 8.9 2.7 0.1 11.7 0.5 0.4 0.1 1.0 3.61 16.3 Belgium-Luxembourg
2.1 1.1 0.1 3.3 0.9 0.3 0.0 1.2 0.63 5.1
Cyprus - - - - - - - - - - Czech Republic 5.8 4.0 0.3 10.2 0.6 0.6 0.0 1.2 0.62 12.0 Denmark 0.8 0.5 0.4 1.7 0.3 0.1 0.1 0.4 0.57 2.7 Estonia 2.2 1.9 0.3 4.4 0.4 1.5 0.1 2.0 1.45 7.9 Finland 27.7 22.1 0.1 49.9 1.4 5.2 0.0 6.7 4.70 61.3 France 17.8 6.7 0.2 24.7 9.6 5.7 0.3 15.7 7.33 47.8 Germany 26.7 7.9 1.5 36.2 4.9 3.5 1.0 9.3 3.03 48.5 Greece 0.4 0.1 0.0 0.5 0.3 0.0 0.0 0.3 1.53 2.3 Hungary - - - - - - - - 2.32 5.8 Ireland 1.6 1.1 0.0 2.7 0.0 0.0 0.0 0.0 0.08 2.8 Italy 0.8 0.1 0.3 1.3 1.8 0.7 0.9 3.4 6.63 11.3 Latvia 5.0 1.7 0.5 7.2 1.9 1.3 0.4 3.6 2.85 13.6 Lithuania 1.8 0.7 0.0 2.5 1.2 0.8 0.0 2.0 1.41 5.9 Malta - - - - - - - - - - The Netherlands 0.5 0.2 0.1 0.8 0.2 0.1 0.0 0.3 0.17 1.2 Poland 7.2 5.3 1.5 14.0 1.7 2.6 0.3 4.6 1.31 19.9 Portugal 3.9 1.2 0.2 5.3 0.3 4.6 0.0 4.9 0.69 10.9 Slovakia - - - - - - - - 0.19 5.2 Slovenia - - - - - - - - - - Spain 4.7 3.5 0.4 8.6 1.8 3.5 0.5 5.7 3.39 17.7 Sweden 36.9 22.5 0.5 59.9 0.5 3.5 0.1 4.1 5.58 69.5 United Kingdom 4.4 2.9 0.4 7.7 0.2 0.3 0.1 0.6 0.28 8.6
Total 159.2 86.2 6.9 252.6 28.5 34.7 3.9 67 48.4 368.0
*Other roundwood includes poles, pitprops, posts, etc. - data not available
Results presented in Table 7 differ from those presented earlier in Chapters 3.2.1-3.2.7 and in Appendix 1 for fellings first of all because data is not from the same periods and it is from different sources Results presented in Table 7 are more recent. Differences are also due to fact that fellings also include felled trees that are not removed from the forests, but are left on site (see Table 3 for definitions). Nevertheless, average roundwood production in late 1990s was much higher in some countries than fellings in mid 1990s, indicating that fellings have increased in those countries. In Latvia roundwood production was 13.6 million m³, which is much higher than fellings in the early 1990’s and already exceeded the NAI. It seems also that fellings in Lithuania have increased substantially since early 1990s, when fellings were 3.2 million m³, as roundwood production was 5.9 million m³ in late 1990s. In Finland roundwood production was also much higher than fellings earlier, 61.3 million m³, but still far below the NAI. Fellings have increased also in Germany and Sweden. In Belgium roundwood production is very close to NAI. Also in some of the southern European countries fellings had increased, in Italy and in particular in
24
Working Papers of the Finnish Forest Research Institute 6 http://www.metla.fi/julkaisut/workingpapers/2004/mwp006.htm
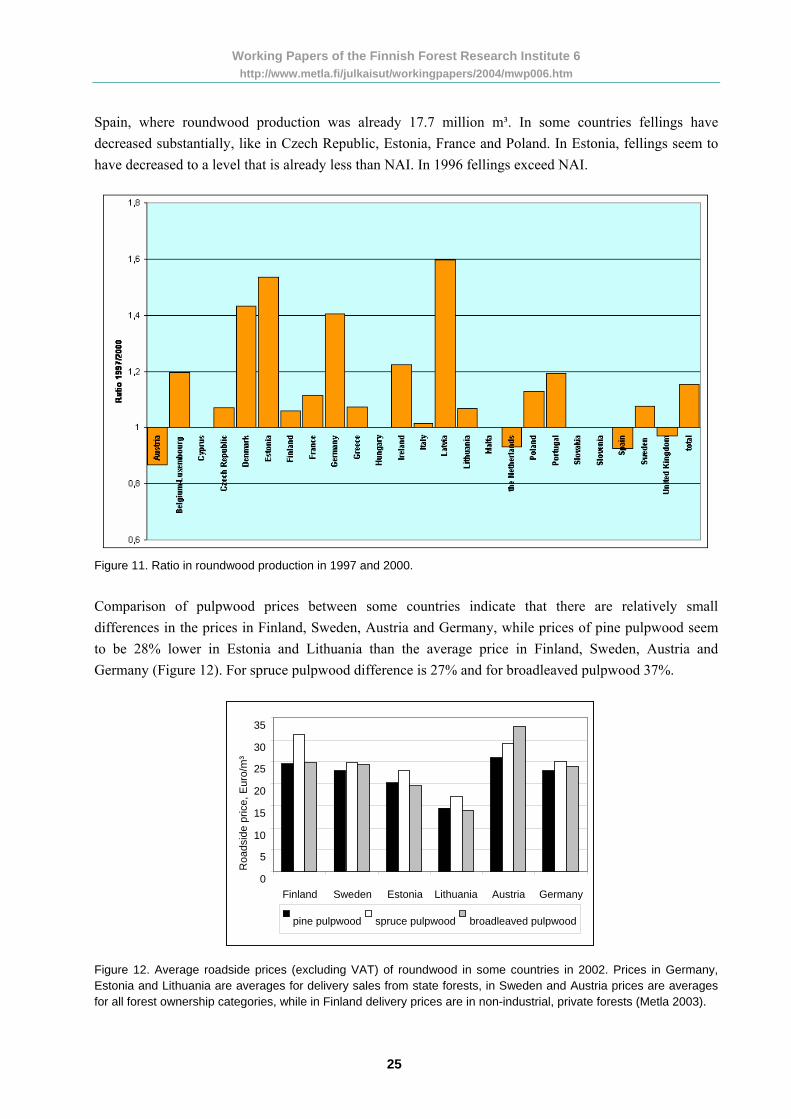
Spain, where roundwood production was already 17.7 million m³. In some countries fellings have decreased substantially, like in Czech Republic, Estonia, France and Poland. In Estonia, fellings seem to have decreased to a level that is already less than NAI. In 1996 fellings exceed NAI.
Figure 11. Ratio in roundwood production in 1997 and 2000.
Comparison of pulpwood prices between some countries indicate that there are relatively small differences in the prices in Finland, Sweden, Austria and Germany, while prices of pine pulpwood seem to be 28% lower in Estonia and Lithuania than the average price in Finland, Sweden, Austria and Germany (Figure 12). For spruce pulpwood difference is 27% and for broadleaved pulpwood 37%.
35 30
Roa
dsid
e pr
ice,
Eur
o/m
³
25 20 15 10
5 0
Finland Germany Sweden Estonia Lithuania Austria
pine pulpwood spruce pulpwood broadleaved pulpwood Figure 12. Average roadside prices (excluding VAT) of roundwood in some countries in 2002. Prices in Germany, Estonia and Lithuania are averages for delivery sales from state forests, in Sweden and Austria prices are averages for all forest ownership categories, while in Finland delivery prices are in non-industrial, private forests (Metla 2003).
25

Working Papers of the Finnish Forest Research Institute 6 http://www.metla.fi/julkaisut/workingpapers/2004/mwp006.htm
As mentioned earlier, ratio between fellings and increment has been approximately 70%, varying between countries and regions. Details have been provided in Chapters 3.2.1–3.2.7. European Timber Trends Study (ETTS V) provides outlook for the supply and demand of roundwood and forest products until 2020 (UN-ECE/FAO 2004). According to ETTS V, harvests from European forests are expected to rise slowly, approximately 0.7% per year (Figure 13). Largest changes are expected in the Baltic countries and South-East Europe. Starting point in the ETTS V has been situation in 1990, which is earlier than in the current study. Assumption in ETTS V has been that NAI will increase 10% between 1990 and 2020. We could assume that NAI would be approximately 5% higher than in this report (late 1990’s), i.e. to increase from 576 million m³ to 605 million m³. If we also assume fellings to increase as in ETTS V, i.e. that approximately 77% of the NAI would be harvested in 2020, it would mean 466 million m³ fellings per year by 2020 or approximately 20% more than in late 1990’s. Figure 13. Ratio between fellings and increment (ETTS V).
26

Working Papers of the Finnish Forest Research Institute 6 http://www.metla.fi/julkaisut/workingpapers/2004/mwp006.htm
4 Estimation of felling residues 4.1 Definition of forest fuel components and estimation of the total potential Forest fuel potential is calculated based on data presented in Chapter 3. The potential consists of three main components:
• Felling residues from the fellings of roundwood (branches, needles, top stem wood, off cuts of stem)
• Roundwood balance (NAI - Fellings) • Stumps and coarse roots of trees (defined separately for the Roundwood balance and Fellings),
later in this report called as stump wood To estimate the shares of biomass components (stem & bark, branches, needles, top stem wood and stump wood) tree species were grouped into three species groups: Spruce group (includes Picea sp., Larix sp., Abies sp.) Pine group (Pinus sp.) and broadleaved (Beech, Oak, Birch and other broadleaved) (Table 8). Proportion of each species group of the growing stock was primarily based on statistics on volumes. If this estimate was not available, proportions of forest area dominated by certain species group were used to define the proportions of species groups. Table 8. Proportions of biomass components used in the volume estimation. (Above ground biomasses are based on equations presented by Marklund (1988) and volumes of root estimates are based on Eggers (2001) study. Stem wood loss means that share of the stem wood that does not meet the quality requirements of industrial roundwood and is thus not used for industrial purposes.
Stem + stembark
Stem wood loss
Branches Needles Tops Total Stump wood estimation (rest of Europe)
Stump wood estimation (Nordic and Baltic countries)
Spruce group
55% 8% 24% 11% 2% 100% 19.1% 21.9%
Pine group
67.7% 8% 17.7% 4.7% 2% 100% 19.3% 19.8%
Broadleaved group
78.2% 8% 12.1% / 1.7% 100% 14.7% 22.4%
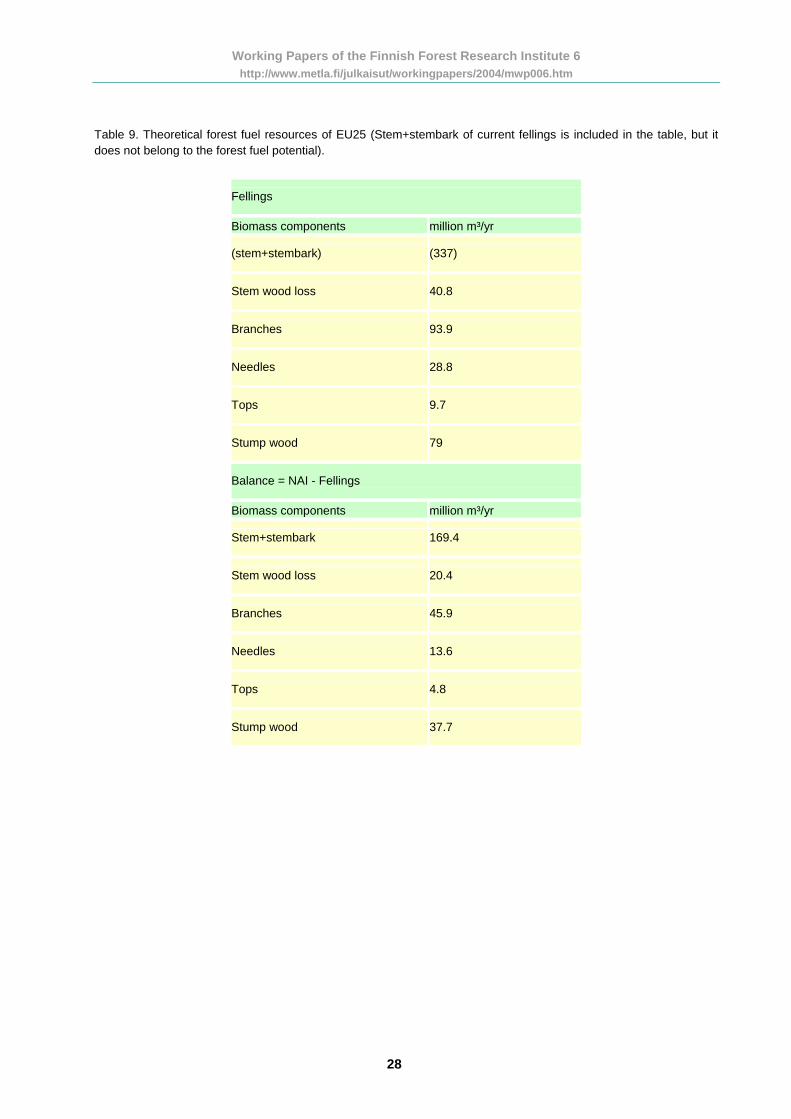
Based on these estimates, the theoretical total potential of the biomass for energy was calculated (Table 9). Theoretical forest fuel resources were estimated to be 543 million m³ per year, which is 160% larger than current fellings. Above ground felling residues were 173 million m³ and above ground balance 254 million m³. Below ground parts of felling residues and balance were together 116 million m³. The largest biomass reserves can be found in Finland, Sweden, Germany and France, but also Poland and Spain have substantial volumes available for energy production. Germany’s large forest fuel potential results from the fact that the NAI is considerably higher than the current level of fellings. Total volumes of different biomass components in the EU25 are presented in Figure 14.
27
Working Papers of the Finnish Forest Research Institute 6 http://www.metla.fi/julkaisut/workingpapers/2004/mwp006.htm
Table 9. Theoretical forest fuel resources of EU25 (Stem+stembark of current fellings is included in the table, but it does not belong to the forest fuel potential).
Fellings
Biomass components million m³/yr
(stem+stembark) (337)
Stem wood loss 40.8
Branches 93.9
Needles 28.8
Tops 9.7
Stump wood 79
Balance = NAI - Fellings
Biomass components million m³/yr
Stem+stembark 169.4
Stem wood loss 20.4
Branches 45.9
Needles 13.6
Tops 4.8
Stump wood 37.7
28

Working Papers of the Finnish Forest Research Institute 6 http://www.metla.fi/julkaisut/workingpapers/2004/mwp006.htm
Fi
nlan
d
Germ
any
Swed
en
Lith
uani
a
Czec
h Re
publ
ic
Pola
nd
Fran
ce
Belg
ium
Irela
nd
Unite
d Ki
ngdo
m
Spai
n
Slov
enia
Latv
ia
Aust
ria Hung
ary
Slov
akia
Portu
gal
Italy
Denm
ark
The
Neth
erla
nds
Esto
nia
0
10
20
30
40
50
60
70
80
3
r
n m
/y
illi
om
e, M
Vo
lu
30
20
10
Balance (stump w ood)
Balance (tops)
Balance (needles)
Blance (branches)
Balance (stem w ood loss)
Balance (stem)
Felling residues (stump w ood)
Felling residues (tops)
Felling residues (needles)
Felling residues (branches)
Felling residues (stem w ood loss)
Figure 14. Theoretical forest fuel potential in EU 25 countries (numeric values are presented in Appendix 2).
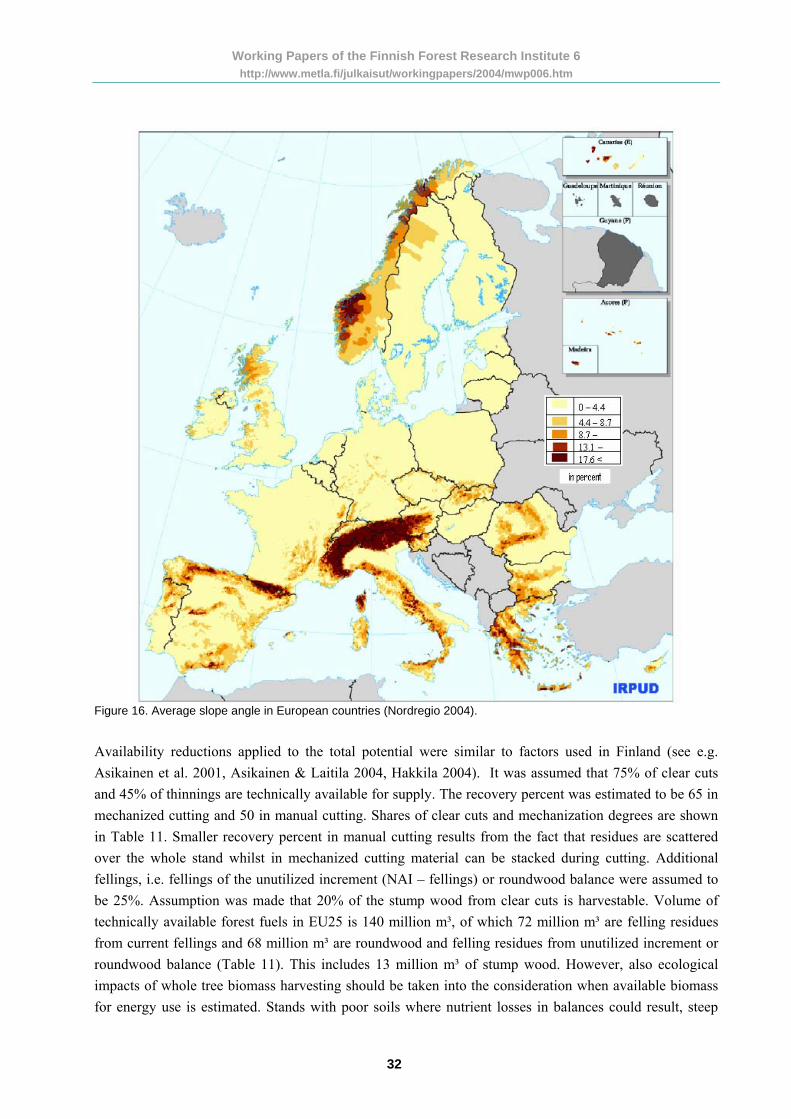
4.2 Estimation of technically harvestable forest fuel potential The impact of mountains on the availability of harvestable forest fuels can be assumed to be considerable in countries such as Austria, Greece and Italy (Table 10, Figure 16). Nevertheless, the impact of mountainous areas on the availability is difficult to estimate. Although Austria has 73% of mountains, the share of forest land available for wood supply is 87% and in rather flat countries such as Poland it is 93% and in the Netherlands 93% (Table 10). Also, annual harvest in terms of m³/ha of forest land is much higher in Austria than in France, the Netherlands and Poland. As a result, share of mountains was not used to reduce the potential of residues in the calculations. However, it is evident, that mountains have an impact on the cost of harvesting.
29

Working Papers of the Finnish Forest Research Institute 6 http://www.metla.fi/julkaisut/workingpapers/2004/mwp006.htm
Table 10. National area covered by mountain municipalities (Nordregio 2004).
Country Country area (1000 km2)
Mountain area (1000 km2)
% of total country area
Forest available for wood supply, % of total forest area
Austria 83.9 61.5 73.4 87.3 Belgium 30.6 1.3 4.2 98.9 Denmark 43.6 98.9 Finland * 326.8 166.1 50.8 94.5 France 637.9 142.1 22.3 95.5 Germany 356.8 52.6 14.7 94.4 Greece 132.2 103.0 77.9 92.1 Ireland 70.1 7.4 10.6 98.1 Italy 300.6 180.8 60.1 61.0 Luxembourg 2.6 0.1 4.4 100 The Netherlands 41.2 92.6 Portugal 92.4 36.1 39.1 56.1 Spain 505.2 281.6 55.7 77.6 Sweden ** 450.0 227.7 50.6 77.9 UK 245.5 62.6 25.5 85.4 Cyprus 9.2 4.4 47.6 36.8 Czech Rep. 78.8 25.4 32.3 97.3 Estonia 45.2 95.8 Hungary 92.5 4.4 4.7 94.0 Lithuania 65.0 85.2 Latvia 64.6 83.7 Malta 0.2 0 Poland 311.4 16.2 5.2 92.8 Slovakia 49.0 30.4 62.0 84.6 Slovenia 20.3 15.8 78.0 94.2 Total 4055.6 1419.5 35.0
*Based on climatic conditions (Figure 15) **Largely based on climatic conditions (Figure 15)
30

Working Papers of the Finnish Forest Research Institute 6 http://www.metla.fi/julkaisut/workingpapers/2004/mwp006.htm
igure 15. Mountain areas in Europe defined as mountainous based on topographic criteria (green areas) and imatic criteria (blue areas). (Nordregio 2004).
Fcl
31
Working Papers of the Finnish Forest Research Institute 6 http://www.metla.fi/julkaisut/workingpapers/2004/mwp006.htm
Figure 16. Average slope angle in European countries (Nordregio 2004).
Availability reductions applied to the total potential were similar to factors used in Finland (see e.g. Asikainen et al. 2001, Asikainen & Laitila 2004, Hakkila 2004). It was assumed that 75% of clear cuts and 45% of thinnings are technically available for supply. The recovery percent was estimated to be 65 in mechanized cutting and 50 in manual cutting. Shares of clear cuts and mechanization degrees are shown in Table 11. Smaller recovery percent in manual cutting results from the fact that residues are scattered over the whole stand whilst in mechanized cutting material can be stacked during cutting. Additional fellings, i.e. fellings of the unutilized increment (NAI – fellings) or roundwood balance were assumed to be 25%. Assumption was made that 20% of the stump wood from clear cuts is harvestable. Volume of technically available forest fuels in EU25 is 140 million m³, of which 72 million m³ are felling residues from current fellings and 68 million m³ are roundwood and felling residues from unutilized increment or roundwood balance (Table 11). This includes 13 million m³ of stump wood. However, also ecological impacts of whole tree biomass harvesting should be taken into the consideration when available biomass for energy use is estimated. Stands with poor soils where nutrient losses in balances could result, steep
32

Working Papers of the Finnish Forest Research Institute 6 http://www.metla.fi/julkaisut/workingpapers/2004/mwp006.htm
slopes endangered by erosion and avalanches, and other sensitive sites should be excluded from such alculations. These possible ecological impacts were beyond this study but could be studied separately in ore detail.
able 11. Volumes of available felling residues in EU25 (available residues of balance include also the stem wood).
he largest volumes of available felling residues (excluding stump wood) are in Sweden (15 million m³), inland (11.4 million m³), France (8.6 million m³) and Germany (6 million m³). When stem wood from dditional fellings of untilized increment and felling residues from them are added, available felling sidues are in these countries about 20 million m³, in Sweden nearly 25 million m³ (Figure 17).
Figu
pote
cm T
Share of timber Share of Total felling Available residues Available residues Felling residuesfrom clearcuts mechanization in residues of felling of balance volume of stump w ood
% cutting % (mill. m³ /yr) (mill. m³ /yr) (mill. m³ /yr) available (mill. m³ /yr)
Austria 18 % 30 % 10,1 2,9 2,7 0,2
Belgium 70 % 80 % 2,6 1,1 0,3 0,1
Cyprus
Czech Republic 83 % 10 % 8,9 3,2 1,5 0,5
Denmark 70 % 50 % 1,2 0,4 0,4 0,0
Estonia 73 % 55 % 1,6 0,6 0,0 0,1
Finland 79 % 97 % 26,7 11,4 6,3 1,8
France 76 % 40 % 22,6 8,6 10,2 1,6
Germany 5 % 35 % 23,4 6,0 13,9 0,1
Greece 6 % 0 %
Hungary 72 % 15 % 2,0 0,7 1,2 0,1
Ireland 82 % 95 % 1,3 0,6 0,4 0,1
Italy 20 % 2 % 2,9 0,7 3,1 0,1
Latvia 76 % 5 % 2,9 1,0 1,5 0,2
Lithuania 50 % 0 % 2,2 0,7 1,1 0,1
Luxembourg
Malta
The Netherlands 80 % 25 % 0,6 0,2 0,3 0,0
Poland 44 % 2,0% 12,5 3,6 2,9 0,6
Portugal 70 % 30 % 3,6 1,3 0,5 0,3
Slovakia 40,2% 0,7% 3,0 0,9 1,7 0,1
Slovenia 0 % 0,7% 1,1 0,3 1,3 0,0
Spain 70 % 30 % 4,4 1,6 5,7 0,3
Sw eden 70 % 98 % 35,2 15,0 6,9 2,2
United Kingdom 80 % 90 % 4,4 1,8 1,7 0,2
Country
Total 173,2 62,6 63,5 9,0
TFare
0
5
10
15
20
25
Sweden France Finland Germany Spain Poland Austria Italy UnitedKingdom
Vol
ume,
milli
on m
³/yr
30
Stumps of balance Balance Felling residues Stump wood of felling
Czechepublic
re 17. Volumes of available felling residues and stump/root biomass in top 10 EU countries having highest available
ntial.
33

Working Papers of the Finnish Forest Research Institute 6 http://www.metla.fi/julkaisut/workingpapers/2004/mwp006.htm
5 E
economical availability of felling residues was carried out for selected countries, Finland, rance, the Netherlands and Poland. The radius of the procurement district around the plant in a country is
n e surroundings of the plant. The annual harvestable amount varies considerably in different parts of urope. This has impact on the long distance transportation cost in particular. In addition, site conditions nd mix of harvestable fuel can vary considerably also within the country. For instance, in the outhwestern part of France substantial softwood plantations are prevailing whereas in central and orthern part of France hardwoods are dominating. This study presents country averages and regional ifferences are only discussed.
he availability of felling residues was based on the total potential of the residues. Restrictions for the otential as described in Chapter 4.2 were applied. Share of timber coming from clearcuts was in the etherlands 24%, in Poland 43.6%, in France 75.9% and in Finland 70%.
vailability of chips from felling residues in each country was expressed in terms of an annual vailability of fuel (solid volume (m³) of green biomass), around consumption point (e.g. power and istrict heating, DH, plant) at given marginal cost of fuel delivered at the plant.
ourly cost structures of a forwarder and a chipper differ considerably between eastern and western urope primarily due to differences in the labour, fuel and capital costs (Figure 18 and 19). Also, rganization and machinery employed in the supply chain could be different. In this study, a fairly
A truck ith a trailer having the maximum weigh of 40 tones is used for long distance transportation except in
lculated with the
e 18. Hourly costs of a forwarder (NL is the Netherlands). (E15-h = gross effective hour; includes delays shorter n)
stimation of the costs for felling residue chips Estimation ofFdefined by the annual use of forest fuels at the plant and the annual harvestable amount of forest fuels ithEasnd TpN Aad HEocommon supply chain is used in all three countries to make the results comparable. The material is extracted from the forest to the forest road side using a medium sized forwarder. Forwarding productivity was assumed to be 10 m³/E15-h. Chipping takes place at the roadside landing by a truck mounted chipper that chips directly into a truck’s container. Productivity of the chipper was set to 28 m³/€15-h.wFinland, where maximum weigh was 60 tones. Trucking cost for chips (€/m³) was cafollowing simplified formulas:
0
10
20
40
50
60
70
80
90
profit
labour
use and service of the
chin30 e ma
capital
Cos
t, €/
E15
-h
Figurthan 15 mi
Finland Poland NL&France
34

Working Papers of the Finnish Forest Research Institute 6 http://www.metla.fi/julkaisut/workingpapers/2004/mwp006.htm
• Finland (based on Asikainen et al. 2001): 2.7 € + 0.045 €/km * transport distance (km)
procurement area was determined as transport distance along the road etwork. The winding coe instance, if the transport istance was 130 km the area from which material was collected was 130km/1.3=100 km. The quantity of hips that could be harvested from that radius was simply determined by multiplying the area by the ensity of material (m³/km²/yr).
hen availability and harvesting cost figures are summarized, cumulative availability of felling sidues and their costs deliv d the plant can be estimated (Fi marginal price 20 €/ m³ 0 €/MWh) a plant is able to get about 370 000 m³ (0.74 Twh in Finland and 470 000 m³ (0.94 Wh) in Poland, but none in France and in the Netherlands. If th inal cost is raised to 30 €/ m³ (15 /MWh), the available amount of fuel at a plant located in France would be close to 180 000 m³ (0.36 Wh) and in the Netherlands about 6 m³ (0.12 TW le 12).
• France & Netherlands (van Belle et al. 2002): 3 € + 0.09 €/km * transport distance (km) • Poland (modified from Asikainen et al. 1999): 2 € + 0.05 €/km * transport distance (km)
Figure 19. Hourly costs of a chipper (NL is the Netherlands). (E15-h = gross effective hour; includes delays shorter than 15 min)
The winding coefficient was assumed to be 1.3 in all countries, since none of them has significant effects of mountains. Probably Poland has the lowest winding coefficient, but on the other hand, its forest road network is not as developed as in the three other countries. The annual availability by given fuel cost at plant was obtained in the following manner. Roadside cost for chips was calculated for average conditions in each country. The average cost of chips at the roadside was first determined based on the productivity and hourly costs of forwarding and chipping. The road transport cost was then added by increasing the radius gradually in 10 km intervals. Management cost of operations was estimated to be 1.5 €/ m³ in Finland, 1 €/ m³ in Poland and 2 €/ m³ in France and in the Netherlands. The radius of the n fficient was used to reduce the effective area. For dcd W the re ere at gure 20). By the
) fuel (1T e marg€T 0 000 h) (Tab
0
20
40
60
80
Finland Poland NL&France
100
120
140
160
180
200 C
ost,
€/E1
5-h
profit
labour
use and service of the machinecapital
35

Working Papers of the Finnish Forest Research Institute 6 http://www.metla.fi/julkaisut/workingpapers/2004/mwp006.htm
Figure 20. Cumulative sidues at given osts (cost of fuel delivered at plant) in Finland, rance, Poland and the Netherlands and examples of respective radius of procurement area defined as the distance ong the road network.
an Belle et al. (2002) estimated that about 70 000 m³ of forest chips would be available at the
ed as chips at plant) and availability of felling sidues from procurement areas with the radius (defined as the distance along the road network) of 100 and 200 km.
availability of felling re marginal cFal
Belgium vIn
cost of 15-22 €/MWh (30-44 €/ m³) depending on the supply chain. If the stumpage price and risks were not included (as in this study), the cost was 11-17 €/MWh (22-34 €/ m³). Table 12. Availability of felling residue chips at given prices (deliverre
Country
Avail. residues at 10€/MWh
(20€/ m³), mill. m³
Avail. residues at 15€/MWh
(30€/ m³), mill. m³
Avail. residues from radius of
100 km, mill. m³
Avail. residues from radius of
200 km, mill. m³
Finland 0.37 not calc. 0.58 2.40 France 0 0.18 0.27 1.13 NL 0 0.06 0.10 0.42 Poland 0.47 not calc. 0.21 0.86
0 200000 400000 600000 800000
1000000 1200000 1400000 1600000 1800000 2000000 2200000 2400000
10 11 12 13 16 17 18 19 20 21 22 23 24 25 26 27 28 29 30 31 32 33 34 35 36 37 38 39 40 41 Marginal cost of chips, €/m³
Ann
ual a
vaila
bilit
y of
m³/y
r
2600000
fuel 2800000 ,
14 15
Finland
France
NL
Poland
200 km
200 km
200 km
100 km 200 km
0 km 100 km
100
10
km
36

Working Papers of the Finnish Forest Research Institute 6 http://www.metla.fi/julkaisut/workingpapers/2004/mwp006.htm
6 Concluding remarks
utili n Methods and definitions used to provide such data may vary between countries. The net annual increment does not change rapidly over years whereas annual fellings can vary considerably. For instance, in the new EU member countries such as the Baltic countries, annual fellings have increased rapidly e . This means, that part of the roundwood balance (unutilized increment) has utilization and thus has generated already felling residues. Thus these changes do not effect radically on the total avail of forest fuels. Fellings have bee ut 68% of the net annual increment. Currently more th 6 he fellings are used for energy production, including use of industrial residues and recovered pro Unu increment, i.e. roundwood balance in EU25 is about 186 million m³. Nearly 40% of this is in Germany and France alone. Information about logging methods and based on varying sources ranging from statistical surveys to expert guesses. In the most countries the share of mechanisation in cutting was
study, however, results are not very sensitive to estimation of
ind, that the results are
change as much (see Figure 20 Nationwide estimates give only a general overview to the situation. Within th n forest resources and infrastructure can be very l s suggest t more detailed studies should be carried out first in the countries, w re resources also the in ucture and technology of energy production c allow substantial and rapid shift f ossil to ren le fuels.
The estimation of the forest fuel potential was based on available statistics about forest resources and their zation i
in th
an 1
EU25.
1990’s moved to
ability n abo% of tducts. tilized
mechanisation of harvesting is
based on expert opinion, because no statistical data was available. It was also noted, that operations run by industry are often heavily mechanised but small private forest owners use still manual cutting methods
.g. in Portugal and Spain). In this (emechanisation, because it only effects by 10 %-units in recovery rate of residues. The costs and availability of forest chips vary largely between the countries due to differences in the
rest resources, annual harvest and cost structure of machines. It must be kept in mfosensitive to changes in cost levels especially in Finland, where change in cost of chips at plant by 1 € changes the availability by 200 000 – 400 000 m³, whereas in other countries the availability does not
).
e countries variation iarge. Thi s tha
he and frastrould rom f ewab
37
Working Papers of the Finnish Forest Research Institute 6 http://www.metla.fi/julkaisut/workingpapers/2004/mwp006.htm
References
entation of the Community Strategy and Action Plan on 9 final. Brussels, 16.02.2001. 42 p.
stonian Ministry of Environment, Center of Forest Protection and Silviculture 2003. Forest Management and Protection
series n.29. FAO, Rome 377 p.
olume LVI (2003), No. 3. Draft for Timber Committee 2004. United Nations. FAO. Economic Commission for Europe.
Forests in Slovakia 2002. Forest Research Institute, Zvolen, 2002, 16 p. Forestry Commission 2003. National Inventory of Woodland and Trees Great Britain. Forestry Commission, Edinburgh. Gold, S. 2003. The development of European forest resources, 1950 to 2000. A study implemented in the framework of the
European Forest Sector Outlook Study (EFSOS). United Nations, Geneva, Timber and Forest Discussion Papers. 111p. Hakkila, P. & Parikka, M. 2002. Fuel resources from the forest. Richardson, J. et al. (eds.) 2002- Bioenergy from
sustainable forestry: guiding principles and practice. Kluwer Academic Publishers, The Netherlands. Pp. 19-48.
Cannell, M.G.R. 1980. World forest biomass and primary production data. COM 1997. Energy for the future: renewable sources of energy. White Paper for a Community Strategy and Action Plan.
Communication from the Commission. COM (97)599 final (26/11/1997). 55 p. COM 2000. Green Paper. Towards a European strategy for the security of energy supply (presented by the Commission).
Commission of the European Communities. COM (2000) 769 final. Brussels, 29.11.2000. COM 2001. Communication from the Commission to the Council, the European Parliament, the Economic and social
committee and the Committee of the regions on the implemRenewable Energy Sources (1998 – 2000). COM (2001) 6
Dielen, L.J.M.; Guegan, S.; Lacour, P.-A.; Mäki, P.K.; Rytkönen, A.; Stolp, J.A.N. 2000. EU Energy Policy Impacts On
the Forest-Based Industries. Modeling analysis of the influence of the EC White Paper on renewable energy sources on the wood supply to the European forest-based industries. Summary. Nangis, Wageningen May 2000.
Eggers T. 2001. The impact of manufacturing and utilization of wood products on the European carbon budget. European
Forest Institute, Joensuu Finland; Institute of Forest Resource Management, Göttingen Germany. E
in Estonia. Estonian Ministry of Environment, Center of Forest Protection and Silviculture. EU 2003. Energy & transport in figures. European Union, Directorate-General for Energy and Transport, European
Commission. 198 p.
AO 1996. Forest products 1989-1994. FAO ForestryF FAO 1997. Wood energy today for tomorrow (WETT). Regional studies. The role of wood energy in Europe and OECD.
Forestry Department, FAO, Rome, Italy. Working Paper FOPW/97/1. 87 p. Forest Products Annual Market Analysis 2002–2004 Executive Summary. Timber Bulletin – V
38
Working Papers of the Finnish Forest Research Institute 6 http://www.metla.fi/julkaisut/workingpapers/2004/mwp006.htm
Karjalainen T., Zimmer B., Berg S., Welling J., Schwaiger H., Finér L., Cortijo P. 2001. Energy, Carbon and Other e Life Cycle Assessment of Forestry and Forest Products. Achievements of the Working Group 1 E9. EFI, Joensuu.
search Report 1. Cambridge University Press.
ETLA 2000. Finnish Statistical Yearbook of Forestry 2000. Finnish Forest Research Institute. Jyväskylä.
ME
ETLA 2002. Finnish Statistical Yearbook of Forestry 2002. Finnish Forest Research Institute. Jyväskylä.
ME ala.
ary. Ministry of Agriculture and Rural Development, Forestry Department, Budapest.
akian Republic 2003 (Green report). Ministry of Agriculture of the Slovakian Republic, Bratislava.
Min the State on Forests and Forestry in the Czech Republic 2002. Ministry of Agriculture of the Czech Republic, Forestry Section, Prague.
Min try 2002. Ministry of Agriculture of the Czech Republic, Forestry Section, Prague – 31 December 2002.
inistry of Environment, State Forest Survey Service 2003. Lithuanian Statistical Yearbook of Forestry 2003. Ministry of
szlányi, J. 1986. Analýza produkcie biomasy a jej energetického ekvivalentu stromovej vrstvy v piatich lesných
piecker, H.; Mielikäinen, K; Köhl, M. and Skovsgaard, J. 1996. (eds.) Growth trends in European forests.
Studies from 12 countries. European Forests Institute. Research Report 5, Springer Verlag.
Material Flows in thof the COST Action
Kuusela, K. 1994. Forest Resources in Europe. European Forest Institute. Re Lesy České Republiky 2000. Forests of the Czech Republic – Forests for the Third Millennium. Lesy České Republiky,
Hradec Králové. Marklund, L.G. 1988. Biomass functions for pine, spruce and birch in Sweden. Swedish University of Agricultural
Sciences, Department of Forest Survey, Report no 45. 73 p. METLA 1999. Finnish Statistical Yearbook of Forestry 1999. Finnish Forest Research Institute. Jyväskylä.
M
TLA 2001. Finnish Statistical Yearbook of Forestry 2001. Finnish Forest Research Institute. Jyväskylä.
M
TLA 2003. Finnish Statistical Yearbook of Forestry 2003. Finnish Forest Research Institute. Vamm Ministry of Agriculture and Fisheries 2000. Indicators for the sustainable management of French forests. Ministry of
Agriculture and Fisheries, Paris. Ministry of Agriculture and Rural Development, Forestry Department 2002. Forestry resources, forestry and wood
management in Hung Ministry of Agriculture of the Slovakian Republic 2003. Report on Forestry in the Slov
istry of Agriculture of the Czech Republic, Forestry Section 2002. Report on
istry of Agriculture of the Czech Republic, Forestry Section 2002. Information on Czech Fores
M
Environment, State Forest Survey Service, Kaunas. National Forest Holding 2002. The State Forests – Annual report 2002. National Forest Holding, Warsaw.
Oekosystémoch. Biologické Práce XXXII – Veda, Vydavatel’stvo Slovenskej Akadémie Vied, Bratislava.
S
39
Working Papers of the Finnish Forest Research Institute 6 http://www.metla.fi/julkaisut/workingpapers/2004/mwp006.htm
State Stock Company 2001. Latvijas Valsts Meži. State Stock Company.
te Stock Company 2002. Latvijas Valsts Sta Meži. State Stock Company.
Assessment. Vol. 1. General Forest Resource Information, 348 p., UN, New York.
UN Forest Resources of Europe, CIS, North America, Australia, Japan and New Zealand. (Industrialized temperate/boreal countries) UN-ECE/FAO Contribution to the Global Forest Resources Assessment 2000. Main
N-ECE/FAO 2004. European Timber Trends and Prospects: Into the 21st Century. United Nations Economic
orld Wide Web References
uropean Union 2004. Map of European Union. http://europa.eu.int/abc/maps/print_index_en.htm.
http://arch.rivm.nl/environmentaldata/B_resources/B5._Timber/index.html. Accessed on March 24th 2004.
Sta .statbank.dk/statbank5a/default.asp?w=1024. Accessed on March 24th 2004.
n
Accessed on March 24th 2004.
n March 24th 2004.
Glo ssed on March 24th 2004.
Fin arch 25th 2004.
UN-ECE/FAO 1992. The Forest Resources of the Temperate Zones. The UN-ECE/FAO 1990 Forest Resources
-ECE/FAO 2000.
Report. United Nations. New York and Geneva. 445 p.
UCommission for Europe. Geneva Timber and Forest Study Papers, ECE/TIM/SP11. 103 p.
W EAccessed on March 24th 2004. National Institute of Public Health and the Environment 2004.
tistik Danmarks 2004. http://www
International Tropical Timber Information System 2004. http://www.ittis.org/profiles/profile_eu_ne.htm. Accessed o
March 24th 2004. Austrian Federal Office and Research Centre for Forests (BWF) 2004.
http://bfw.ac.at/i7/Oewi.oefi9296?geo=0&isopen=5&display_page=64. Bundeswaldinventur 2004. http:/www.bundeswaldinventur.de/Grafik2.gif. Accessed on March 24th 2004. Istituto Sperimentale per l’Assestamento Forestale e per l’Alpicoltura 2004.
http://www.isafa.it/scientifica/inventari/inventari%20engl/IFNI_85-1.htm. Accessed on March 24th 2004. Natural Resources Management and Economics Modelling Group 2004.
http://floresta.isa.utl.pt/gegref/ARTIGOS/analysis_of_the_markets.htm. Accessed on March 24th 2004. Comunidad Autónoma de la Región de Murcia 2004.
http://www.carm.es/econet/sicrem/p1/index.htm?indice=indice2.htm?pagina=pagina21.htm. Accessed o
bal Fire Monitoring Center (GFMC) 2004. http://www.fire.uni-freiburg.de/iffn/country/lv/lv_2.htm. Acce
nish Forest Research Institute 2004. http://www.metla.fi/iufro/iufro95abs/d4pap2.htm. Accessed on M
40

Working Papers of the Finnish Forest Research Institute 6 http://www.metla.fi/julkaisut/workingpapers/2004/mwp006.htm
The national statistical institute of Luxembourg 2004. http://www.statec.lu/html_en/portrait_economique_du_luxembourg/english/chap4/graf/area.gif. Accessed on March 25th
wedish University of Agricultural Sciences 2004. http://www-umea.slu.se/. Accessed on March 25th 2004.
Glo 5th
rch 25th
2004. National Board of Forestry 2004. http://www.svo.se/fakta/stat/ssi/engelska/. Accessed on March 25th 2004.
S
bal Fire Monitoring Center 2004. http://www.fire.uni-freiburg.de/iffn/country/cy/cy_1.htm. Accessed on March 22004.
Global Fire Monitoring Center 2004. http://www.fire.uni-freiburg.de/iffn/country/gr/gr_14.htm. Accessed on Ma
2004.
41

Working Papers of the Finnish Forest Research Institute 6 http://www.metla.fi/julkaisut/workingpapers/2004/mwp006.htm
Years NAI
Fellings Balance between NAI and Fellings
Country Coni- Broad
leaved Total Years
Coni- Broad leaved
Total Coni- Broad
Years ferous ferous ferous leaved
Total
Austria 1992-96 21.93 5.41 27.34 1992-96 16.13 3.39 19.52 5.79 2.02 7.82 Belgium 1982-97 3.36 1.78 5.14 1986-95 3.15 1.25 4.40 0.21 0.53 0.74 Cyprus 1980-90 0.04 - 0.04 1986-95 0.05 - 0.05 -0.05 0.04 -0.01 Czech Republic
1995 17.08 3.27 20.36
1995 14.81 1.39 16.20 2.27 1.88 4.16
Denmark 1990 2.20 1.00 3.20 1996 1.468 0.73 2.19 0.73 0.27 1.01 Estonia 1996 4.40 4.20 8.60 1996 8.30 3.90 12.20 -3.90 0.30 -3.60 Finland 1991-96 56.65 15.82 72.47 1991-96 43.50 10.80 54.30 13.15 5.02 18.17 France 1997 39.54 52.76 92.30 1996 31.18 28.99 60.17 8.36 23.77 32.13 Germany 1995-00 63.52 25.48 89.00 1996 37.18 11.41 48.58 26.34 14.07 40.41 Greece 1990 1.57 1.75 3.32 1990 0.95 2.42 3.38 0.62 -0.68 -0.06 Hungary 1996 1.57 8.36 9.93 1996 0.78 5.10 5.88 0.79 3.25 4.05 Ireland 1996 3.40 0.05 3.45 1996 2.30 0.04 2.33 1.11 0.02 1.12 Italy 1995 6.11 12.60 18.71 1995 1.82 6.92 8.75 4.29 5.68 9.97 Latvia 1996 6.42 4.63 11.05 1996 3.61 2.96 6.57 2.81 1.67 4.48 Lithuania 1992-96 5.27 3.24 8.50 1992-96 3.41 1.83 5.24 1.86 1.41 3.26 Luxembourg 2000 0.13 0.54 0.66 2000 0.18 0.19 0.36 -0.05 0.35 0.30 Malta 1996 - - - 1996 - - - - - - The Netherlands
1991-95 1.13 1.08 2.21
1991-950.95 0.49 1.44 0.18 0.59 0.77
Poland 1992-96 33.07 6.37 39.44 1992-96 23.24 7.30 30.53 9.83 -0.93 8.90 Portugal 1995 7.89 5.01 12.90 1995 6.20 5 11.20 1.69 0.01 1.70 Slovakia 1996 5.84 6.50 12.34 1996 4.20 2.90 7.10 1.64 3.60 5.24 Slovenia 1996 2.90 3.23 6.132 1996 1.50 0.8 2.30 1.40 2.43 3.83 Spain 1990 16.69 11.90 28.59 1994 6.58 4.45 11.03 10.11 7.45 17.56 Sweden 1992-96 71.51 13.92 85.43 1992-96 57.28 8.84 66.12 14.24 5.08 19.32 United Kingdom
1995 12.74 1.85 14.59
1995 8.30 1.20 9.50 4.44 0.65 5.09
Total 384.95 190.74 575.68 277.05 112.29 389.34 107.85 78.50 186.35Appendix 1. NAI, fellings, and roundwood balance in EU25 countries (million m³/yr o.b.).
42
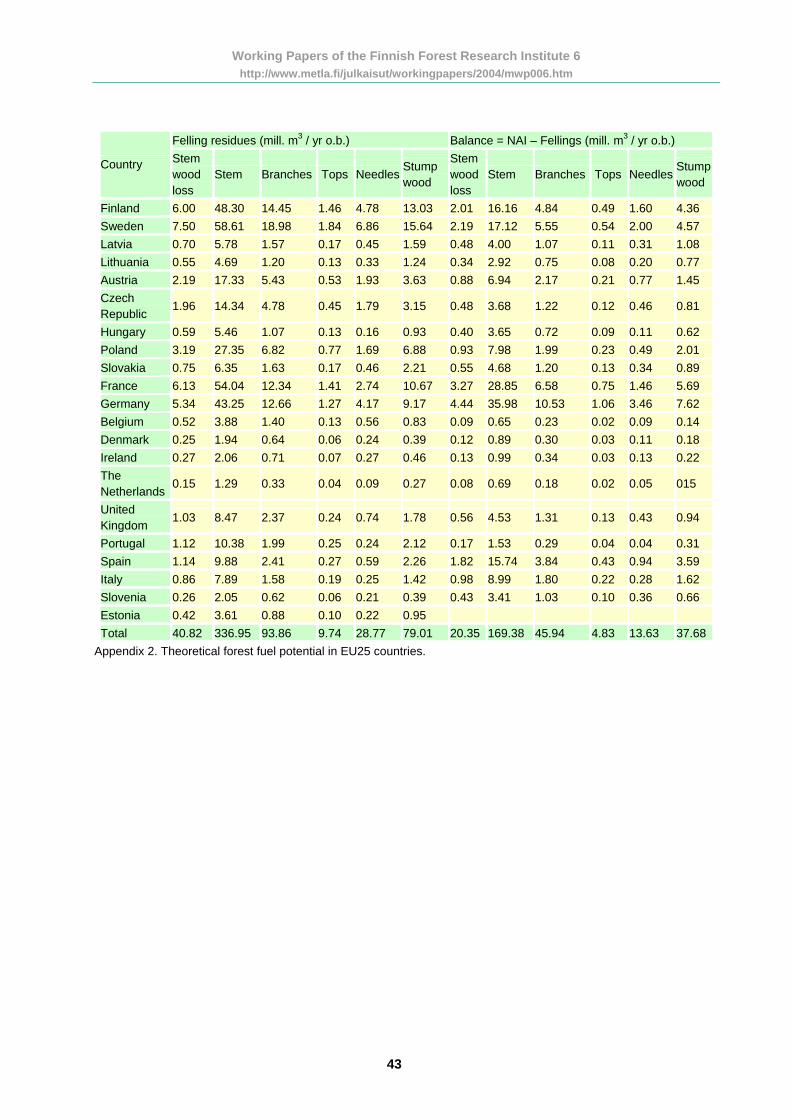
Working Papers of the Finnish Forest Research Institute 6 http://www.metla.fi/julkaisut/workingpapers/2004/mwp006.htm
F sidues (mill. m3 / yr o.b.) Balance = NAI – Fellings (mill. m3 / yr o.b.) elling re
C SStem Branches Tops Needles
Stump Stem wood loss
Stem Branches Tops NeedlesStump
tem ountry wood
wood wood loss
F 6.00 48.30 14.45 1.46 4.78 13.03 2.01 16.16 4.84 0.49 1.60 4.3inland 6 S 7.50 58.61 18. 1.84 6.86 15.64 2.19 17.12 5.55 0.54 2.00 4.5weden 98 7 L 0.70 5.78 1.5 0.17 0.45 1.59 0.48 4.00 1.07 0.11 0.31 1.08atvia 7 Lithuania 0.55 4.69 1.20 0.13 0.33 1.24 0.34 2.92 0.75 0.08 0.20 0.77 A 2 17.33 5.43 0.53 1.93 3.63 0.88 6.94 2.17 0.21 0.77 1.4ustria .19 5 C
1 14 4.7 0.45 1.79 3.15 0.48 3.68 1.22 0.12 0.46 0.8zech
.96 .34 8 Republic
1
H 0.59 5.46 1.07 0.13 0.16 0.93 0.40 3.65 0.72 0.09 0.11 0.62ungary Pola 3.19 27.35 0.77 1.69 6.88 0.93 7.98 1.99 0.23 0.49 2.01 nd 6.82 S 0.75 6.35 1.63 0.17 0.46 2.21 0.55 4.68 1.20 0.13 0.34 0.89lovakia F 6.13 54.04 12.34 1.41 2.74 10.67 3.27 28.85 6.58 0.75 1.46 5.69rance G 5 43 12. 1.27 4.17 9.17 4.44 35.98 10.53 1.06 3.46 7.62ermany .34 .25 66 B 0 3.8 1.4 0.13 0.56 0.83 0.09 0.65 0.23 0.02 0.09 0.1elgium .52 8 0 4 D 0 1.9 0.6 0.06 0.24 0.39 0.12 0.89 0.30 0.03 0.11 0.1enmark .25 4 4 8 Ir 0 2.0 0.7 0.07 0.27 0.46 0.13 0.99 0.34 0.03 0.13 0.2eland .27 6 1 2 T
0.15 1.2 0.3 0.04 0.09 0.27 0.08 0.69 0.18 0.02 0.05 01he
9 3 N etherlands
5
United K ingdom
1.03 8.4 2.3 0.24 0.74 1.78 0.56 4.53 1.31 0.13 0.43 0.97 7 4
Portugal 1.12 10.38 1.99 0.25 0.24 2.12 0.17 1.53 0.29 0.04 0.04 0.31 Spain 1.14 9.88 2.4 0.27 0.59 2.26 1.82 15.74 3.84 0.43 0.94 3.51 9 It 0.86 7.89 1.58 0.19 0.25 1.42 0.98 8.99 1.80 0.22 0.28 1.6aly 2 S 0.26 2.0 0.6 0.06 0.21 0.39 0.43 3.41 1.03 0.10 0.36 0.6lovenia 5 2 6 E 0.42 3.6 0.8 0.10 0.22 0.95 stonia 1 8 T 40.82 33 93. 9.74 28.77 79.01 20.35 169.38 45.94 4.83 13.63 37otal 6.95 86 .68
Ap Theoretical f el l in ountries
pendix 2. orest fu potentia EU25 c .
43