estimation of fat-free cocoa solids in chocolate and · pdf fileestimation of fat-free cocoa...
TRANSCRIPT

Journal of the Association of Public Analysts (Online) 2012 40 01-12
A Richards et al
-1-
Estimation of Fat-Free Cocoa Solids in Chocolate and Cocoa Products – Global Survey of Typical Concentrations of Theobromine and Caffeine
Determined by HPLC
Alan Richards(1)(2)
and Brian Wailes(2)
1 Head of Scientific Services, Public Analyst Scientific Services Ltd, Wolverhampton WV6
8TQ.
2 Formerly at Durham Scientific Services, St Johns Road, Meadowfield, Co. Durham.
Summary
A method for the measurement of the alkaloids theobromine and caffeine in cocoa and chocolate products is
described. The method was subjected to a ring trial test with 5 laboratories from across Europe. The method
involved minimal sample preparation and analysis of the alkaloids was by HPLC-DAD. The method was used to
determine the dry fat free cocoa solids in 191 cocoa liquor samples from around the world. The mean content of
theobromine and caffeine in the dry fat free cocoa liquor samples analysed by this method were 24,572 mg/kg
and 3,165 mg/kg respectively. Full details of the project can be obtained from the UK Defra website, project
code FA 0202 “Measurement of theobromine content in cocoa for determining cocoa solids content in chocolate
and chocolate products”.
Keywords
Theobromine, caffeine, cocoa, chocolate, HPLC.
Introduction Cocoa and chocolate products comprise a multi-million pound industry in the UK and throughout Europe. More
chocolate is consumed in Europe than any other continent. The amount of cocoa present in chocolate products is
generally regarded as a guide to quality and its accurate quantification has been attempted for over 100 years.
The labelling and composition of chocolate products are controlled by the Cocoa and Chocolate Products
(England) Regulations 20031 which implement the EC Directive 2000/36/EC
2. Identical provisions for labelling
and composition are included in parallel regulations across the devolved areas of the U.K. The regulations
specify a range of reserved descriptions for chocolate products which have minimum requirements for, inter
alia, levels of cocoa solids to be present. The alkaloids theobromine and caffeine are naturally present in cocoa.
Hence the dry fat free cocoa content of food has been estimated in manufacturers’ and enforcement
laboratories3 for many years by determination of these alkaloids and application of a conversion factor derived
from analysis of genuine cocoa samples.
Over time, the methods used have changed and been improved. Direct measurement of alkaloid, theobromine
and/or caffeine content enables the determination of total non-fat cocoa solids. In the past 50 years or so little
systematic work has been done to establish whether the level of alkaloids has changed as a result of botanical
and agricultural changes, different methods of production or environmental factors although it is recognised that
changes in production methods and climate over the last 50 years has probably resulted in significant changes in
the alkaloid levels in cocoa. To investigate what changes of significance had taken place a project was
commissioned by the UK Food Standards Agency (FSA project Q01122)4 and the main findings reported here.
In essence, an updated conversion factor was calculated from 191 samples of cocoa liquor samples analysed as
part of that project using the trialled method described later.
Journal of the Association of Public Analysts (Online) 2012 40 01-12
A Richards et al
-2-
All of the in-house quality control checks carried out during the lifetime of the project were satisfactory.
Definitions Chocolate – The product obtained from cocoa products and sugars which contains not less than 35 per cent total
dry cocoa solids, including not less than 18 per cent cocoa butter and not less than 14 per cent of dry non-fat
cocoa solids
Cocoa Beans – The seeds of the cacao tree (theobroma cacao) fermented and dried
Cocoa Liquor (or Mass) – Cocoa nib reduced to a paste by a mechanical process without losing any of its
natural fat content
Cocoa Nib – That part of the cocoa bean remaining after raw cocoa beans have been roasted, cracked and
winnowed
Cocoa Powder or Cocoa – The product obtained by converting into powder cocoa beans which have been
cleaned, shelled and roasted, and which contains not less than 20 per cent cocoa butter, calculated according to
the weight of the dry matter, and not more than 9 per cent water
Milk Chocolate – The product obtained from cocoa products, sugars and milk or milk products which contain:
not less than 20 per cent total dry cocoa solids
not less than 20 per cent dry milk solids obtained by partly or wholly dehydrating whole milk, semi-
skimmed or skimmed milk, cream, or from partly or wholly dehydrated cream, butter or milk fat
not less than 2.5 per cent dry non-fat cocoa solids
not less than 5 per cent milk fat
not less than 25 per cent total fat (cocoa butter and milk fat)
Method Development and Ring Trial The first objective was to optimise the liquid chromatographic (LC) method (Appendix 1) for determining
theobromine and caffeine in cocoa and chocolate products including drinking chocolate, milk chocolate, plain
chocolate, and chocolate. The method consists of a simple and rapid procedure for extraction of alkaloids and
analysis by HPLC with diode array detection.
Six samples of cocoa liquor were analysed for theobromine and caffeine, or total alkaloids by 5 different
laboratories. All participants were asked to analyse each sample in duplicate and record the identity of the
analytes reported and the concentrations, as mg/kg. The results are summarised in Appendix 2.
Survey of Theobromine and Caffeine Concentrations The optimised method was then applied to the determination of the theobromine and caffeine concentrations,
over a two year period, of 191 samples of cocoa liquor, prepared from beans grown around the world. The
extended time period of sampling and analysis was to take account of seasonal variations in growing conditions
and possible natural changes in alkaloid levels. From the data obtained it is possible to calculate a conversion
factor from the average theobromine and caffeine levels in cocoa, and compare them with previously established
factors.
The results showed that the levels of theobromine present were generally lower than those found in prior survey
work. This could be due to a combination of factors such as changes in the cocoa varieties being grown, e.g.
Journal of the Association of Public Analysts (Online) 2012 40 01-12
A Richards et al
-3-
increasing use of hybrid varieties of cocoa that are hardy and high yielding, as well as changes in climate and
cultivation methods.
Whilst in the past analysts were probably measuring total alkaloids accurately the types of samples under test
were not described clearly i.e. samples were often described as “cocoa” or “cocoa powder”. This means that the
alkaloid contents being reported could not be correlated with the current data. The current results indicate that
the conversion factor, calculated from theobromine content in the 191 samples of cocoa liquor tested, is higher
than the factor currently used by enforcement laboratories to calculate dry fat free cocoa solids.
The mean theobromine content of the cocoa liquor samples tested was 27,737 mg/kg leading to a conversion
factor of 40.7. The conversion factor multiplied by the percentage of theobromine in the sample gives an
indication of dry fat free cocoa solids in the food in question. The standard deviation of the results from 191
samples was 3,470 mg/kg and the range was 19803 – 39,168 mg/kg. This wide variation indicates that
considerable caution must be taken when reporting on cocoa content of foods when the composition of the
cocoa liquor used in their preparation is unknown. Enforcement organisations will generally take the statistical
variation of the results into account when reporting on composition obtained from analysis of a sample.
Indication of adverse results on samples usually leads to further investigation of further samples and/or the
source of raw materials used.
A comparison of the cocoa solids content calculated using the new factor of 40.7 and the current factor of 35.9
was carried out. It was found that the current factor gave lower results for cocoa solids than with the newly-
calculated factor. The new factor also gave results closer to the expected amount than the current conversion
factor i.e. the calculation of cocoa levels in the controlled samples of manufactured chocolate were generally in
better agreement with predictions using the new factor than with the current factor. Where total alkaloids are
measured instead of theobromine alone a factor of 36.1 is proposed.
The manufacture of chocolate takes place by blending ingredients including cocoa liquor, sugar and flavourings.
In some cases cocoa powder is added as well as additional cocoa fat, milk solids or vegetable fats. To validate
the results of the cocoa liquor samples and determine the fitness for purpose of the new calculated factors tests
were carried out to measure the levels of alkaloids and fat in twenty samples of both the cocoa liquor and the
finished chocolate made from the liquors. The results from the liquor were used to calculate the amount of dry
fat free cocoa present in the chocolate. These results were compared with the amounts declared to be present. In
general there was good agreement between the calculated amounts of cocoa liquor present and the actual
declared amounts.
All of the in-house quality control checks carried out during the lifetime of the project were satisfactory
Moisture in samples of cocoa liquor, as measured using Karl Fischer analysis, was found to be variable and so
corrections to alkaloid levels were made to take account of this. The fat content of the same cocoa liquor
samples was also measured and the alkaloid levels calculated on the dry fat-free part of the samples.
Full details of the method optimisation, ring trial, sample acquisition and analytical data obtained are given in
the FSA report.3
Calculation The amount of fat free dry cocoa in chocolate products may be calculated from the theobromine content as
follows:
Fat free dry cocoa (g/100g) = theobromine (g/100g) x 40.7
Where total alkaloids are measured the dry fat free cocoa content may be calculated from:
Fat free dry cocoa (g/100g) = total alkaloids (g/100g) x 36.1
Journal of the Association of Public Analysts (Online) 2012 40 01-12
A Richards et al
-4-
The major producers of cocoa are currently the countries of Africa. The sampling plan was biased towards
cocoa samples obtained from this source. The alkaloid content of cocoa liquors were found to vary in different
continents so that where the country of origin of the sample is known, then alternative, location-specific, factors
may be more appropriate.
Acknowledgements
ADM for provision of authentic samples of cocoa liquor and participation in the ring trial.
Alan Turner, consultant to the chocolate industry, for providing historical information.
Barry Callebaut for provision of authentic samples of cocoa liquor, chocolate and participation in the
ring trial.
Cargil for provision of authentic samples of cocoa liquor and participation in the ring trial.
CIRAD for advice on interpretation of results particularly in relation to genotypes.
Cocoa Research Association Ltd for advice on technical details.
Food Standards Agency (FSA) for the funding of this project, in particular Tanya Gurung.
Department of Food and Rural Affairs (Defra) for permission to publish this work.
Michael Walker for his support and constructive comments on several versions of this paper.
The author would also like to thank the reviewers for their comments which were welcome in publishing this
paper.
References
1 The Cocoa and Chocolate Products (England) Regulations 2003, SI 1659/2003
http://www.legislation.gov.uk/uksi/2003/1659/contents/made
2 Directive 2000/36/EC of the European Parliament and of the Council of 23 June
2000 relating to cocoa and chocolate products intended for human consumption
http://eur-
lex.europa.eu/LexUriServ/LexUriServ.do?uri=OJ:L:2000:197:0019:0025:EN:PDF
3 Validated Enforcement Method VEMS 0358 – Determination of additives and
flavourings in food by HPLC, APA Publication for internal use
4 FSA project Q01122 Measurement of theobromine content in cocoa for determining
cocoa solids content in chocolate and chocolate products. This project is published
on the UK Defra Website, Project code: FA0202

Journal of the Association of Public Analysts (Online) 2012 40 01-12
A Richards et al
-5-
Appendix 1
Measurement of the Alkaloids Theobromine and Caffeine in Cocoa and Chocolate Products
1. Scope of Method
1.1. The alkaloids are extracted from cocoa and chocolate products with dilute acid. After
clarification and filtration, the alkaloids in the solution are determined by HPLC. A range of
permitted additives permitted in cocoa and chocolate products, which may interfere with the
analysis of theobromine and caffeine, are also extracted including saccharin, benzoic acid,
aspartame, acesulfame K, sorbic acid, vanillin, ethyl vanillin and 3 parabens. The
chromatography has been optimised to separate each of these compounds.
2. Health and Safety
2.1. EYE PROTECTION SHOULD NORMALLY BE WORN AT ALL TIMES.
2.2. METHANOL IS HIGHLY FLAMMABLE AND TOXIC BY INHALATION OR IF
SWALLOWED. KEEP CONTAINER TIGHTLY CLOSED. AVOID CONTACT WITH
SKIN. KEEP AWAY FROM SOURCES OF IGNITION. USE ONLY IN A DESIGNATED
FLAME FREE AREA.
2.3. ACETONITRILE IS HIGHLY FLAMMABLE AND TOXIC BY INHALATION, IN
CONTACT WITH SKIN AND IF SWALLOWED. KEEP AWAY FROM SOURCES OF
IGNITION. TAKE OFF IMMEDIATELY ANY CONTAMINATED CLOTHING. IF YOU
FEEL UNWELL, SEEK MEDICAL ADVICE. USE ONLY IN A DESIGNATED FLAME
FREE AREA.
2.4. CAFFEINE IS TOXIC IF SWALLOWED. AVOID CONTACT WITH SKIN AND EYES.
IF YOU FEEL UNWELL, SEEK MEDICAL ADVICE.
3. Reagents
Analytical Reagent grade reagents are suitable unless otherwise stated.
Water should be deionised, distilled or of similar quality.
3.1. Glacial Acetic Acid
3.2. Mobile Phase A – Acetonitrile, HPLC grade. Degas and filter through a 0.45 µm membrane
filter (4.3)
3.3. Caffeine
3.4. Hydrochloric acid, 11mol/L
3.5. Methanol, HPLC grade
3.6. Potassium Hexacyanoferrate(II) Trihydrate

Journal of the Association of Public Analysts (Online) 2012 40 01-12
A Richards et al
-6-
3.7. Sodium Dihydrogen Orthophosphate
3.8. Sodium Hydroxide
3.9. Theobromine
3.10. Zinc acetate dihydrate
3.11. Sodium hydroxide – 0.1mol/L – Weigh 4.0g of sodium hydroxide (3.8) and dissolve in water,
allow to cool, dilute to 1 litre
3.12. Mobile phase B – phosphate buffer – Accurately weigh 3.12g of sodium dihydrogen
orthophosphate (3.7) and make up to 1 litre with water in a volumetric flask. Adjust to pH 5.0
with 0.1mol/L sodium hydroxide. Filter through a 0.45 µm filter (4.3)
3.13. Hydrochloric acid – 0.5mol/L – Add 44.5mL of hydrochloric acid (3.4) to water and dilute to
1 litre in a volumetric flask
3.14. Stock standard caffeine 1000mg/L – Weigh 0.5g, accurate to 0.001g of caffeine (3.3).
Transfer quantitatively into a 500mL volumetric flask with water. Dissolve in water, dilute to
volume with water and mix by inversion 6 times.
3.15. Stock standard theobromine 500mg/L – Weigh 0.25g, accurate to 0.001g, of theobromine (3.9)
into a 400mL beaker, dissolve in boiling water, cool and transfer quantitatively into a 500mL
volumetric flask with water and mix by inversion 6 times.
3.16. Working standard solutions – Using pipettes measure 1.0, 2.5, 5.0 and 10.0mL of caffeine
stock standard and 2, 5, 10 and 20mL of theobromine stock standard into 100mL volumetric
flasks, dilute to volume with water and mix by inversion 6 times. This gives working standard
solutions of concentrations 10, 25, 50 and 100mg/L of each alkaloid. Working standard
solutions should be prepared fresh on the day of use.
3.17. Stock standard control solutions
STANDARD MATERIAL USED TO PREPARE STANDARD CONTROL SOLUTIONS
MUST BE FROM A DIFFERENT COMMERCIAL SOURCE TO THOSE USED TO
PREPARE STANDARD CALIBRATION SOLUTIONS.
3.17.1. Caffeine 10,000mg/L – Weigh 0.5g, accurate to 0.001g of caffeine. Transfer
quantitatively to a 50mL volumetric flask with 20mL of methanol and dissolve.
Dilute to volume with water and mix by inversion 6 times.
3.17.2. Theobromine 10,000mg/L – Weigh 0.5g, accurate to 0.001g of theobromine.
Transfer quantitatively to a 50mL volumetric flask with 20mL of methanol and
dissolve. Dilute to volume with water and mix by inversion 6 times. The shelf life
of these solutions is 3 months when stored at 5°C.
3.18. Working standard control solution – Using a pipette, measure 2.5mL of each stock standard
control solution into a 250mL volumetric flask, dilute to volume with water and mix by
inversion 6 times. This gives a mixed, working standard control solution containing 100mg/L
of each alkaloid. The working standard control solution should be prepared fresh on the day of
use.
Journal of the Association of Public Analysts (Online) 2012 40 01-12
A Richards et al
-7-
3.19. Clearing reagents 1 and 2
3.19.1. Dissolve 21.9g, accurate to 0.1g, zinc acetate dihydrate (3.10) in water containing
3g of acetic acid (3.1) and make up to 100mL with water.
3.19.2. Dissolve 10.6g, accurate to 0.1g, potassium hexacyanoferrate(II) trihydrate (3.6) in
water and make up to 100mL with water.
4. Apparatus
Normal laboratory glassware and apparatus
4.1. Analytical balance of appropriate accuracy as specified
4.2. 0.45µm disposable syringe filters or 0.45µm sample membrane filter kit (Millipore or
equivalent)
4.3. Solvent filter system with 0.45µm membrane filters
4.4. Ultrasonic bath
4.5. High Performance Liquid Chromatography (HPLC) system ideally with Diode Array Detector
and integrating device which allows the measurement of peak heights and/or areas
4.6. Glass microfibre filters, at least 1.6 µm (Whatman GFA or equivalent)
4.7. HPLC Chromatographic column – Merck Lichrocart Purospher RP-18e, 5µm, 250 x 4mm,
fitted with a Purospher RP-18e, 5µm 4 x 4mm guard column. Equivalent columns may be used
provided they give satisfactory resolutions
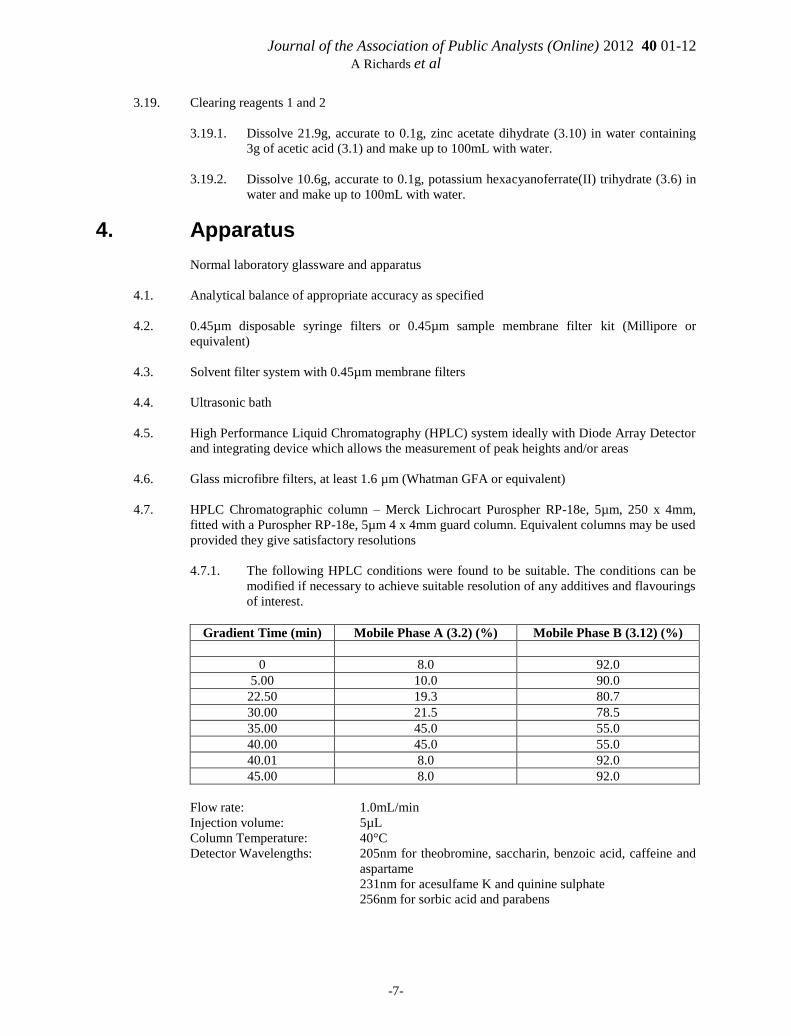
4.7.1. The following HPLC conditions were found to be suitable. The conditions can be
modified if necessary to achieve suitable resolution of any additives and flavourings
of interest.
Gradient Time (min) Mobile Phase A (3.2) (%) Mobile Phase B (3.12) (%)
0 8.0 92.0
5.00 10.0 90.0
22.50 19.3 80.7
30.00 21.5 78.5
35.00 45.0 55.0
40.00 45.0 55.0
40.01 8.0 92.0
45.00 8.0 92.0
Flow rate: 1.0mL/min
Injection volume: 5µL
Column Temperature: 40°C
Detector Wavelengths: 205nm for theobromine, saccharin, benzoic acid, caffeine and
aspartame
231nm for acesulfame K and quinine sulphate
256nm for sorbic acid and parabens

Journal of the Association of Public Analysts (Online) 2012 40 01-12
A Richards et al
-8-
To help maintain column efficiency, flush it with a mixture of water and acetonitrile (about
50:50) for about 30 minutes prior to instrument shutdown. Column performance will be
maintained through use of a guard column.
5. Procedure
5.1. Chocolate and chocolate products grate, melt or blend if necessary.
5.1.1. Weigh about 1g, accurate to 0.001g, of dark chocolate, 2-3g of milk chocolate or 3g
of cake into a 100mL beaker.
5.1.2. Add 25mL of water and 2mL of 0.5mol/L hydrochloric acid (3.13) and mix by
inversion 6 times.
5.1.3. Bring to the boil on a hotplate and then transfer the beaker to a boiling water bath
for 15 minutes.
5.1.4. Transfer the solution to a 50mL volumetric flask and allow to cool.
5.1.5. Add 1mL of each clearing reagent (3.19), make to volume with water and mix by
inversion 6 times.
5.1.6. Allow the solution to stand for about 30 minutes and then filter through a filter
paper (4.6), rejecting the first 5mL and then through a syringe filter (4.3) for HPLC
analysis. The filtration rate depends upon the amount of precipitated solids present.
Solutions are stable for at least 24 hours.
5.2. Chromatography
Set up the HPLC system (4.5) according to the manufacturer’s instructions. The instrument
must be fitted with a suitable column (4.7). The operating conditions must be adjusted so as to
achieve sufficient separation of the additives of interest to enable identification. Typical
chromatographic separations are shown in Appendix 3.
5.3. Inject a suitable volume e.g. 5µL of the test solution and run the chromatographic separation.
5.4. Determine the peak areas (by electronic integration) at the appropriate wavelengths (see 4.7.1).
If a diode array detector is not available then separate runs at each wavelength may be
required.
5.5. Preparation of calibration curve.
5.5.1. Successively analyse each working standard solution (3.16) according to steps 5.3-
5.4.
5.5.2. Plot a calibration curve of analyte concentration against peak area for each analyte
of interest.
5.5.3. When fresh stock standards are prepared a new calibration curve must be prepared
also.

Journal of the Association of Public Analysts (Online) 2012 40 01-12
A Richards et al
-9-
5.6. Calibration check.
5.6.1. Provided that the calibration curve is linear and the HPLC conditions remain
ostensibly unaltered, a single working standard solution of each analyte may be
used to check the calibration curve.
5.6.2. Analyse working standard 50mg/L according to steps 5.3 – 5.4. Carry out a
duplicate injection of the working standard solution.
5.6.3. The calibration check standard is deemed satisfactory if the mean concentration is
within ±5% of the expected value (i.e. 50mg/L) when extrapolated from the stored
calibration graph.
5.6.4. If the calibration check standard meets the requirements then the stored calibration
graph may be used to calculate the analyte concentration. Otherwise a fresh stock
standard must be prepared.
6. Calculation
6.1. If a calibration curve is used, determine the concentration (C) of each analyte in the test
solution directly from the calibration graph.
6.2. If a diode array detector is available, the identity of sample peaks can be confirmed if
necessary.
6.3. The concentration of each analyte in the sample, expressed in mg/L or mg/kg, may be
calculated according to the following formula:
Analyte in the sample (mg/L or mg/kg) =
where C = concentration in mg/L of the analyte component from the graph
V = final volume, in mL of test solution
m = mass (or volume), in g (or mL) of test portion taken for analysis
7. Performance Characteristics
7.1. Limit of Detection
Liquids (direct) Solid Foods*
Theobromine 0.5 mg/L 25 mg/Kg
Caffeine 0.5 mg/L 10 mg/Kg
*Assuming 1g diluted to 50mL for theobromine
7.2. Bias
Recovery (Mean) Recovery Standard Deviation
Foods Drinks Foods Drinks
Theobromine 99.2% 2.8%
Caffeine 104.3% 3.3%
Theobromine spiked at a level of 50mg/L in chocolate

Journal of the Association of Public Analysts (Online) 2012 40 01-12
A Richards et al
-10-
7.3. Precision
Absolute Difference
Foods
Standard Deviation
Drinks
Theobromine
31.6 mg/Kg
(10 samples in the range 823 to
3117 mg/Kg)
Caffeine
1.2 mg/L
(14 samples in the range 12 to
91 mg/L)
Journal of the Association of Public Analysts (Online) 2012 40 01-12
A Richards et al
-11-
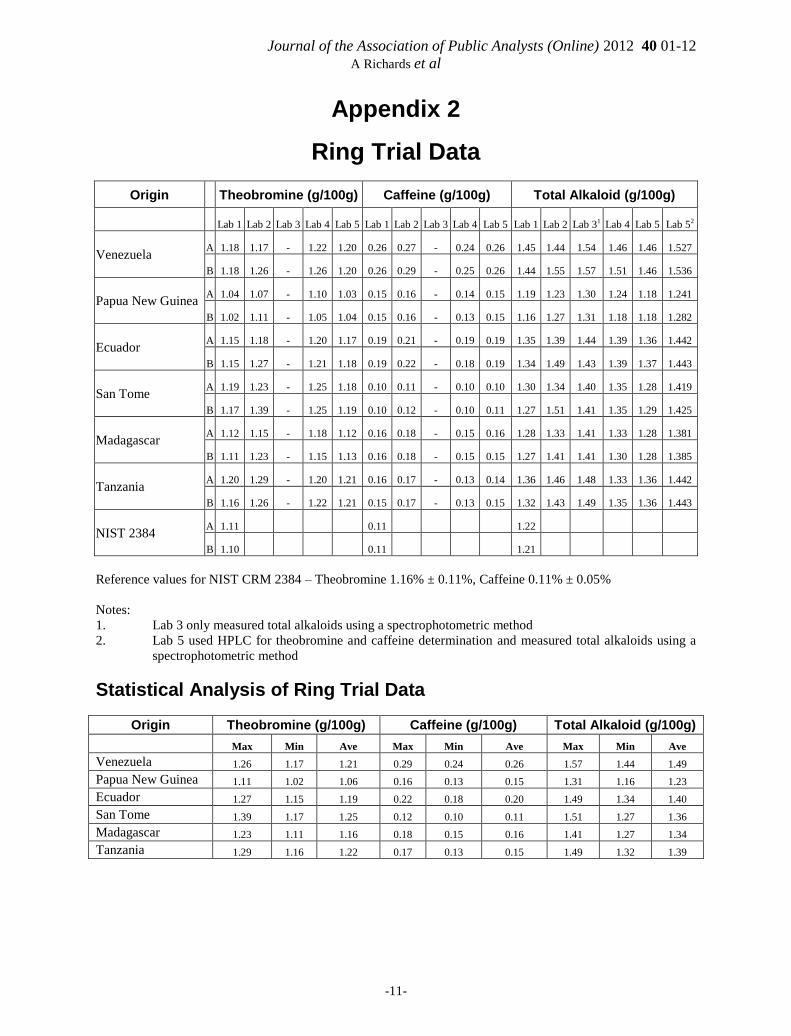
Appendix 2
Ring Trial Data
Origin Theobromine (g/100g) Caffeine (g/100g) Total Alkaloid (g/100g)
Lab 1 Lab 2 Lab 3 Lab 4 Lab 5 Lab 1 Lab 2 Lab 3 Lab 4 Lab 5 Lab 1 Lab 2 Lab 31 Lab 4 Lab 5 Lab 52
Venezuela A 1.18 1.17 - 1.22 1.20 0.26 0.27 - 0.24 0.26 1.45 1.44 1.54 1.46 1.46 1.527
B 1.18 1.26 - 1.26 1.20 0.26 0.29 - 0.25 0.26 1.44 1.55 1.57 1.51 1.46 1.536
Papua New Guinea A 1.04 1.07 - 1.10 1.03 0.15 0.16 - 0.14 0.15 1.19 1.23 1.30 1.24 1.18 1.241
B 1.02 1.11 - 1.05 1.04 0.15 0.16 - 0.13 0.15 1.16 1.27 1.31 1.18 1.18 1.282
Ecuador A 1.15 1.18 - 1.20 1.17 0.19 0.21 - 0.19 0.19 1.35 1.39 1.44 1.39 1.36 1.442
B 1.15 1.27 - 1.21 1.18 0.19 0.22 - 0.18 0.19 1.34 1.49 1.43 1.39 1.37 1.443
San Tome A 1.19 1.23 - 1.25 1.18 0.10 0.11 - 0.10 0.10 1.30 1.34 1.40 1.35 1.28 1.419
B 1.17 1.39 - 1.25 1.19 0.10 0.12 - 0.10 0.11 1.27 1.51 1.41 1.35 1.29 1.425
Madagascar A 1.12 1.15 - 1.18 1.12 0.16 0.18 - 0.15 0.16 1.28 1.33 1.41 1.33 1.28 1.381
B 1.11 1.23 - 1.15 1.13 0.16 0.18 - 0.15 0.15 1.27 1.41 1.41 1.30 1.28 1.385
Tanzania A 1.20 1.29 - 1.20 1.21 0.16 0.17 - 0.13 0.14 1.36 1.46 1.48 1.33 1.36 1.442
B 1.16 1.26 - 1.22 1.21 0.15 0.17 - 0.13 0.15 1.32 1.43 1.49 1.35 1.36 1.443
NIST 2384 A 1.11 0.11 1.22
B 1.10 0.11 1.21
Reference values for NIST CRM 2384 – Theobromine 1.16% ± 0.11%, Caffeine 0.11% ± 0.05%
Notes:
1. Lab 3 only measured total alkaloids using a spectrophotometric method
2. Lab 5 used HPLC for theobromine and caffeine determination and measured total alkaloids using a
spectrophotometric method
Statistical Analysis of Ring Trial Data
Origin Theobromine (g/100g) Caffeine (g/100g) Total Alkaloid (g/100g)
Max Min Ave Max Min Ave Max Min Ave
Venezuela 1.26 1.17 1.21 0.29 0.24 0.26 1.57 1.44 1.49
Papua New Guinea 1.11 1.02 1.06 0.16 0.13 0.15 1.31 1.16 1.23
Ecuador 1.27 1.15 1.19 0.22 0.18 0.20 1.49 1.34 1.40
San Tome 1.39 1.17 1.25 0.12 0.10 0.11 1.51 1.27 1.36
Madagascar 1.23 1.11 1.16 0.18 0.15 0.16 1.41 1.27 1.34
Tanzania 1.29 1.16 1.22 0.17 0.13 0.15 1.49 1.32 1.39

Journal of the Association of Public Analysts (Online) 2012 40 01-12
A Richards et al
-12-
Appendix 3
Typical Separation of Alkaloids and Food Additives using HPLC-DAD
min5 10 15 20 25 30 35 40
mAU
0
100
200
300
400
DAD1 A, Sig=205,12 Ref=450,100 (L:\2\DATA\0358\BW081103.D)
T
he
ob
ro
min
e
S
ac
ch
arin
T
he
op
hy
llin
e
B
en
zo
ic
A
cid
C
affe
in
e
A
sp
arta
me
M
eth
yl P
ara
be
n
E
th
yl P
ara
rb
en
P
ro
py
l P
ara
be
n
DAD1 B, Sig=231,12 Ref=450,100 (L:\2\DATA\0358\BW081103.D)
A
ce
su
lfa
me
K
V
an
illin
E
th
yl V
an
illin
Q
uin
in
e S
ulp
ha
te
DAD1 C, Sig=256,20 Ref=450,100 (L:\2\DATA\0358\BW081103.D)
S
orb
ic
A
cid