ethyl-3-methylimidazolium chloride fengjiao chen,...
TRANSCRIPT

Pressure-induced structural transitions of a room temperature ionic liquid—1-ethyl-3-methylimidazolium chlorideFengjiao Chen, Tingting You, Ye Yuan, Cuiying Pei, Xiangting Ren, Yanwei Huang, Zhenhai Yu, Xiaodong Li,Haiyan Zheng, Yuexiao Pan, Ke Yang, and Lin Wang
Citation: The Journal of Chemical Physics 146, 094502 (2017); doi: 10.1063/1.4977044View online: http://dx.doi.org/10.1063/1.4977044View Table of Contents: http://aip.scitation.org/toc/jcp/146/9Published by the American Institute of Physics

THE JOURNAL OF CHEMICAL PHYSICS 146, 094502 (2017)
Pressure-induced structural transitions of a room temperatureionic liquid—1-ethyl-3-methylimidazolium chloride
Fengjiao Chen,1 Tingting You,2 Ye Yuan,1 Cuiying Pei,1 Xiangting Ren,1 Yanwei Huang,1Zhenhai Yu,1 Xiaodong Li,3 Haiyan Zheng,4 Yuexiao Pan,5 Ke Yang,6 and Lin Wang1,a)1Center for High Pressure Science and Technology Advanced Research, Shanghai 201203, China2School of Chemistry and Environment, Beihang University, Beijing 100191, China3Institute of High Energy Physics, Chinese Academy of Sciences, Beijing 100049, China4Center for High Pressure Science and Technology Advanced Research, Beijing 100094, China5College of Chemistry and Materials Engineering, Wenzhou University, Wenzhou 325035, China6Shanghai Synchrotron Radiation Facility, Shanghai Institute of Applied Physics, Chinese Academy of Sciences,Shanghai 201800, China
(Received 19 November 2016; accepted 7 February 2017; published online 1 March 2017)
In this paper, structural evaluations of a room temperature ionic liquid, 1-ethyl-3-methylimidazoliumchloride ([EMIM]Cl), were systematically investigated at high pressures. Our Raman spectra, infraredspectra, and synchrotron X-ray diffraction investigations show that crystalline [EMIM]Cl experiencedstructural instabilities at high pressures and underwent at least four successive structural transitions ataround 5.8, 9.3, 15.8, and 19.1 GPa, respectively. Notably, the abrupt emergence of photoluminescencefrom the sample at around 19.3 GPa, originated from the pressure-induced polymerization of the[EMIM]+ cations, as confirmed by the mass spectrometry experiments. Our results also indicate thathigh pressure significantly affected the conformational equilibrium of the [EMIM]+ cations. Thestructural transitions are influenced by the ion stacking modes determined by the hydrogen bonds andpossibly by some chemical reactions in addition to the cation conformational isomers. Published byAIP Publishing. [http://dx.doi.org/10.1063/1.4977044]
I. INTRODUCTION
Room temperature ionic liquids (RTILs) are a class ofthe most significant materials consisting of complex organiccations and relatively simple anions. The two key propertiesof the RTILs are their relatively low melting points (aroundroom temperature) and negligibly small vapor pressures.1–4
These melting salts are admired for serving as electrolytesin high energy density batteries,5,6 solvents for studying ioniccomplexes,7–9 and catalytic solvents for organic reactions.10–12
Consequently, the potential applications of these melts haveprompted intensive research on the nature of their ionic inter-actions. Different RTILs originate from different kinds of ioniccomposition and their total number could reach up to 1018, ifall the possible combinations of ions are taken into account.However, only a few have been synthesized, reported, and usedin the literature.
Investigations on pressure- and temperature-inducedstructural transitions have been a rich source for understand-ing the physical and structural properties of condensed sys-tems. Pressure, is one of the most important thermodynamicparameters, directly changing interatomic distances and henceeffectively influencing the interactions between atoms andmaterial structures. Therefore, pressure (especially high pres-sure) provides a way to synthesize novel materials and explorenew applications for ordinary materials. For instance, therehave been many reports on the high-pressure properties of
a)Author to whom correspondence should be addressed. Electronic mail:[email protected]
the imidazolium-based RTILs.13–16 Chang et al.17 concen-trated on the rotational isomers of the [BMIM]+ cations coex-isting in different conditions. Su et al.18 showed that themain characteristic peaks of [BMIM][BF4] moved to a higherwavenumber with increasing pressure. Their data showed fourdiscontinuities in the Raman shifts as a function of pressure.They concluded that [BMIM][BF4] underwent four successivestructural transitions at high pressures and believed that thesetransitions might be associated with conformational changesin the butyl-chain. Yoshimura et al.19 reported that the envi-ronment around the alkyl-chain (C6 and C7–C8) rather thanthe imidazolium-ring of [EMIM][BF4] was largely perturbedrather than that around the imidazolium-ring in the super-pressed state, from the perspective of the conformational iso-merism of the [EMIM]+ cations. Li et al.20 claimed to observecrystal polymorphism and two crystalline phases (I and II)coexisting at high pressures up to 1.4 GPa; however, onlyphase II was obtained by recrystallization at around 2 GPa.Moreover, Dymek et al.21 determined the crystal structureof pure [EMIM]Cl with an Enraf-Nonius CAD4 (ComputerAutomated Diffractometer-4-circle of the single crystal struc-ture analysis) diffractometer and also gave evidence of thepresence of hydrogen bonding (C–H· · ·Cl�) present at thethree-ring C–H bonds.
In this paper, a molten salt6,22–24 precursor, [EMIM]Clwas systematically investigated. Dymek et al.21 indicatedthat the crystal structure of [EMIM]Cl is orthorhombicwith the corresponding space group P212121 (a = 10.087 Å,b = 11.179 Å, c = 28.733 Å, V = 3240.0 Å3, and Z = 16). Theasymmetric unit contains four MEI+· · ·Cl� ion pairs. The
0021-9606/2017/146(9)/094502/10/$30.00 146, 094502-1 Published by AIP Publishing.

094502-2 Chen et al. J. Chem. Phys. 146, 094502 (2017)
MEI+ ions cluster in four distinct layers perpendicular to thec axis and the Cl� ions are also layered. They found that itscrystal structure and a number of its functional groups changedsignificantly at high pressures, which gave us a characteris-tic example of how to extend the applications of RTILs atextreme conditions. In our experiments, we first crystallized[EMIM]Cl and then investigated its structural transition behav-iors up to 43.6 GPa. The crystalline sample presented structuralinstabilities at high pressures and underwent at least four suc-cessive structural transitions at around 5.8, 9.3, 15.8, and19.1 GPa, respectively. These structural transitions originatedfrom the ion stacking modes25 and the cation structural iso-mers, or possibly chemical reactions. Although the ionic bondsplay an important role, it is the hydrogen bonds that signifi-cantly determine the stacking modes of crystalline [EMIM]Cl.Therefore, we discuss hydrogen bonds and cation conforma-tional isomers during the structural transitions of [EMIM]Cl.We also report [EMIM]Cl photoluminescence, which origi-nates from [EMIM]+ cation polymerization induced by highpressure and confirmed by mass spectrometry experiments ondecompressed samples.
II. EXPERIMENTS
Pure [EMIM]Cl has a melting point of 360 K and thesample we used is commercially available with a purity of98% (Aladdin). The Raman and photoluminescence emis-sion spectra were recorded in a back-scattering geometry witha visible laser excitation of 532 nm (Renishaw inVia) withpower less than 50 mW. The high-pressure synchrotron X-raydiffraction (XRD) experiments were performed at the 4W2station of the Beijing Synchrotron Radiation Facility. Theinfrared absorption measurements were carried out with Hype-rion 2000, giving a resolution of 2 cm�1. The high-pressureexperiments on [EMIM]Cl were carried out in a diamond anvilcell (DAC) with 300 µm diamond culets. The sample wasloaded in a 130 µm diameter hole drilled in the T301 stain-less steel gasket, which was pre-indented to a thickness of45 µm. A ruby ball was loaded with the sample to perform thein situ pressure measurements via the R1 ruby fluorescenceband shift,26 and it would not influence our high-pressureexperiments, as the ruby ball did not react with the sample.All high-pressure experiments were performed without anypressure-transmitting medium, as the sample was soft enoughfor an acceptable pressure gradient inside the sample cham-ber. All sample preparation was completed in a glove box filledwith argon. For our XRD experiments, the DAC-loaded sam-ple was crystallized by treating it at 423 K for 12 h in a furnacebefore cooling it down to room temperature for 2 h. The XRDpatterns were collected in an angle-resolved geometry on acharge-coupled device detector with a focused monochromaticbeam at a wavelength of λ = 0.6199 Å. The sample-to-detectordistance and the image plate inclination angles were preciselycalibrated using the CeO2 standard. The two-dimensionaldiffraction images were analyzed with ESRF Fit2D27 soft-ware, yielding the intensity versus 2θ diffraction patterns.We also compared the pristine sample (condition A) and theDAC-loaded sample after heat treatment (condition B) in ourexperiments.
The pressure-induced polymerization of [EMIM]Cl wasmonitored by HPLC-MS; High performance liquid chro-matography (HPLC) from Acquity H Class and the massspectrometry (MS) measurements were from the Waters cor-poration with a single quadrupole mass detector.
III. RESULTS AND DISCUSSIONS
We used Raman spectroscopy to explore the bondingstructures and structural transitions of [EMIM]Cl, provid-ing information about its local structures.28 Geometry opti-mization calculations were performed at B3LYP/6-31++G**level with the Gaussian 09 version. The Raman models wereidentified with VEDA4 potential energy distribution analy-sis. The inset in Fig. 1 displays the optimized structure ofthe [EMIM]+/Cl� ionic pair. The Raman spectrum obtainedunder ambient conditions in the range of 100-3300 cm�1 isshown in Fig. 1, and the corresponding positions and assign-ments of the bands are listed in Table I. In Fig. 1, the Ramanspectrum of [EMIM][BF4]29 was also measured to justify theexistence of the hydrogen bonds in [EMIM]Cl. The absorptionbands in the Raman spectra are assigned in Table I, providingstructural information about the [EMIM]+/Cl� ionic pair andidentifying the assignments of the [EMIM]Cl vibration fre-quencies. We then compared our assignments listed in Table Iwith those in the literature.29–31 The bands at low frequencies(100-250 cm�1) are primarily assigned to the ion interactionvibrations and the dihedral angle torsion vibrations are partlylocated in this region but mainly in the range of 250-1000 cm�1.The vibration frequencies of the angle bend of H–C–H and thebond stretch of C–C and C–N are situated in the range of1000-1600 cm�1. The marked eleven Raman bands of[EMIM]Cl in Fig. 1 are assigned to the C–H stretching bandsof the methyl and ethyl side chains of the two conformers ofthe [EMIM]+ cations (2800-3050 cm�1) and the imidazolium-ring of the [EMIM]+ cations (2329 and 3050-3200 cm�1), asshown in Table I. The vibration frequencies of the C–H stretch-ing region are relatively lower, broader, and sharper than thoseof [BMIM][BF4] in the same region, which is also displayed inFig. 1.
FIG. 1. The Raman spectra of pristine [EMIM]Cl and [EMIM][BF4] witha visible laser excitation of 532 nm and a spectrometer of 2400 lines/mmgrating, giving a resolution of 1 cm�1. The inset is the optimized structuresof the nonplanar conformers of the [EMIM]+/Cl� ionic pair.

094502-3 Chen et al. J. Chem. Phys. 146, 094502 (2017)
TABLE I. The vibrational assignments (cm�1) of [EMIM]Cl bands by the algorithm of B3LYP/6-311+G**. Abbreviations: ani, anion; asym, asymmetric; Cal,calculated; cat, cation; Exp, experimental; Fre, frequency; I, intensity; ip, in-plane; M, medium; op, out-of-plane; S, strong; str, stretching; sym, symmetric; tors:torsion; W, weak.
Exp Fre Cal Fre I Assignment Exp Fre Cal Fre I Assignment
107.3 131.7 S Cat-an bend 1308.7 1323.5 W Ring ip asym str, CC str, (N)CH2
and (N)CH3CN str151.8 151.2 M Cat-an tors 1333.8 1353.0 S Ring ip sym str, CN str, (N)CH2
and (N)CH3CN str244.38 242.5 W CH3(N) bend 1380.7 1397.9 M Ring ip asym str, CC str, (N)CH2
and (N)CH3CN str291.4 304.9 W CH3(N) bend, CH2(N) bend 1415.1 1424.2 S Ring ip sym str, CC str, (N)CH2
and (N)CH3CN str387.8 373.7 W CH3NC bend, NCCH3 bend 1437 1436.8 M (N)CH3HCH sym bend, (N)CH3CN str434 444.3 W CH3NC bend, CH2NC bend 1445.58 1463.7 M Ethyl HCH bend596.3 595.6 M Ring ip sym bend 1481.5 1493.1 M Ethyl HCH asym bend627.3 631.0 W Ring ip sym bend, ring op asym bend 1563 1585.3 M Ring CC str650.7 647.0 W Ring ip asym bend 2329 2585.8 W Ring HCCH asym str698.3 716.3 M Ring ip asym bend, CH2(N), CH3(N)CN str 2840.8 3031.5 W Methyl HCH asym str804.2 809.8 W Ring op sym bend, CC bend 2884.8 3033.5 M Ethyl CH3HCH asym str899.3 847.7 W Ring ip sym bend, CC str 2942.7 3057.8 S Ethyl HCH sym str958.5 966.4 M Ring ip asym bend, CC str 2961.8 3039.3 S Ethyl CH3HCH asym str
1022.3 1023.4 S Ring ip sym str, CN str 2979.5 3109.3 S Ethyl HCH asym str1033.3 1031.4 M Ring ip asym str 2996.3 3116.7 S Ethyl CH3HCH sym str1089.6 1105.6 M Ring ip asym str 3052.8 3118.2 M Methyl HCH sym str1104.5 1107.6 M Ring ip asym str, cat-an str 3062.3 3130.8 M Methyl HCH sym str1124.4 1121.82 M Ring ip asym str, CC str, (N)CH2 3128.4 3270.76 W Ring HCCH asym str
and (N)CH3CN str1170 1161.32 W Ring ip asymstr, CC str, (N)CH2 3145.5 3289.33 W Ring HCCH sym str
and (N)CH3CN str1257.3 1278.01 W Ring ip asym str, CC str, (N)CH2
and (N)CH3CN str
Moreover, a weak band at 2329 cm�1 was observed.The assignments indicate that this band belonged to theC1–H5 stretching and corresponded to the same vibration bandat 3124 cm�1, which was also observed in [EMIM][BF4].[EMIM]Cl is amorphous with cations and anions combinedwith ionic bonds and hydrogen bonds that are mainly fromthe C1–H5· · ·Cl� interaction. In contrast, our sample crys-tallized well after heat treatment and the [EMIM]+ cationsinteracted with the Cl� ions through hydrogen bonds at the C1,C2, and C3 positions.21 The Cl� anions between the stacked[EMIM]+ cations in the crystalline sample were supportedby the hydrogen bonding in the crystal structure under ambi-ent conditions. Each Cl� ion interacted with three MEI+ ionsand each MEI+ ion was associated with its three nearest Cl�
ions. Therefore, hydrogen bonding evidently plays an impor-tant role in the crystal structure and structural transitions of[EMIM]Cl.
In Fig. 2, we found some notable differences by compar-ing the Raman spectra at 0.1 MPa and 1.6 GPa, before andafter heat treatment. For instance, the band around 394 cm�1
at 1.6 GPa before heat treatment was weaker and broader thanat 0.1 MPa, and almost disappeared at 1.6 GPa after heat treat-ment. Moreover, a new band at 458 cm�1 (next to the one at440 cm�1) appeared and became stronger at 1.6 GPa withoutheat treatment. This new band became even stronger after heattreatment. However, the primary band at around 435 cm�1
vanished. These changes were directly related to the
planar (P) and non-planar (Np) equilibrium of the [EMIM]Clethyl-chain. The Np conformer was dominant under ambi-ent conditions, even when pressure reaches 1.6 GPa beforeheat treatment, but the heat-treated sample almost completelybecame a P conformer, as preferred by the crystal struc-ture. This phenomenon confirms the crystallization of thesample after heat treatment, which can also be observed inour XRD patterns discussed later. New hydrogen bondinghas an influence on some Raman vibration of the [EMIM]+
cations by the red-shifts32 in the following bands: (a) the
FIG. 2. Comparison of [EMIM]Cl Raman spectra at a 1 cm�1 resolution,with a 532 nm laser used for irradiation and a spectrometer of 2400 lines/mmgrating: (a) under ambient conditions; (b) at 1.6 GPa before heat treatment;and (c) at 1.6 GPa after heat treatment.

094502-4 Chen et al. J. Chem. Phys. 146, 094502 (2017)
ring out-of-plane asymmetric bend and the ring in-plane sym-metric bend vibrational bands have a weak red-shift from629 cm�1 to 628 cm�1 and from 652 cm�1 to 651 cm�1
before and after heat treatment at 1.6 GPa, respectively; (b)the CH3(N)HCH symmetric bend vibrational band has an obvi-ous red-shift from 1418 cm�1 to 1411 cm�1 before and afterheat treatment at 1.6 GPa; and (c) the HCH symmetric bendvibrational band has an obvious red-shift from 1488 cm�1
to 1476 cm�1 before and after heat treatment at 1.6 GPa.Moreover, as the decomposition temperature of [EMIM]Clexceeded 523 K, the heat treatment did not destroy the sample.From all this analysis, it is reasonable to conclude that heat
treatment effectively helps the crystallization of the com-pressed sample.
Figures 3(a)–3(d) show the Raman spectra during com-pression and decompression under condition A. Almost allthe bands blue-shifted at high pressures. The Raman spec-tra show that no vibration band was detected when pressureexceeded 19.3 GPa, and all vibration bands remained unde-tected when the sample was decompressed. In Fig. 3(a), theintensities of the bands from 100 to 250 cm�1 decreased andno band was observed when pressure reached 12.8 GPa. Thenumber of the bands increased at 2.8 GPa, signaling a greatchange in the interactions between the cations and anions. The
FIG. 3. The in situ Raman spectra ofpristine [EMIM]Cl as a function of pres-sure at a 1 cm�1 resolution, with a532 nm laser used for irradiation anda spectrometer of 2400 lines/mm grat-ing, from: (a) 100 to 700 cm�1; (b) 700to 1300 cm�1; (c) 1350 to 1700 cm�1
and 2320 to 2340 cm�1; (d) 2800 to3300 cm�1; (e) the Raman spectralchanges of [EMIM]Cl in the region from340 to 500 cm�1; (f) the pressure depen-dence of the bands from 375 to 475 cm�1
of [EMIM]Cl; and (g) the intensity frac-tions of the planar and nonplanar con-formers of [EMIM]Cl as a function ofpressure.

094502-5 Chen et al. J. Chem. Phys. 146, 094502 (2017)
FIG. 4. The in situ infrared spectra of pristine [EMIM]Cl without heat treat-ment at different pressures for various bands from 600 to 1800 cm�1 at a 2 cm�1
resolution.
changes in the range of 350-525 cm�1 at high pressures can beexplained by the P-Np equilibrium of the [EMIM]Cl ethyl-chain. The bands at 627 and 651 cm�1 red-shift and theirintensities increase until pressure reaches 5.8 GPa becauseof new hydrogen bonds. In Figs. 3(c) and 3(d), the bandchanged from 1400 to 1500 cm�1 and from 2800 to 3200 cm�1
demonstrating that the environment around the alkyl-chain (C6and C7–C8) rather than the imidazolium-ring of the [EMIM]+
cations was largely perturbed in the superpressed state.19 TheC1–H5 stretching vibrational band at 2329 cm�1 under ambi-ent conditions was very weak at high pressure because it wasnear the second diffraction band of the diamond, as shown inFig. 3(c). However, as shown in Fig. 4, the infrared absorptionspectra of [EMIM]Cl revealed that the intramolecular vibra-tion bands still existed even when pressure surpassed 20.4GPa. Therefore, the lack of observed vibration bands doesnot signify the loss of the skeleton structure of the cationsbut is instead due to the abrupt emergence of strong photo-luminescence. We found that the intensity of the photolumi-nescence was roughly two orders of magnitude stronger thanthe Raman signal. When the photoluminescence emerged, itsintensity continuously increased even during decompression.Therefore, the Raman bands were not observed when pressureexceeded 19.3 GPa during decompression. Interestingly, a newband emerged at 1685 cm�1 at 20.4 GPa in the infrared spec-trum, as shown in Fig. 4. This band is located in the H–C–Hbend region, indicating the formation of new H–C–H bondsat this pressure. Therefore, some polymerization that inducesthe photoluminescence may occur at this pressure.
As mentioned, our crystallographic studies indicate thatthe ethyl side chain of the [EMIM]+ cations exists in twoconformations: the P and Np conformers in a solid state.The conformational equilibrium is influenced by many closelycorrelated environmental aspects, such as temperature, pres-sure, and solvency.31,33 As a result, the structural transitionsof [EMIM]Cl at high pressures are associated with confor-mational changes in the ethyl-chain.34 The rotation of theethyl group about the C–N (ring) bond provides two possi-ble conformations.19,30 The band at 388 cm�1 (assigned to theCNCH3 bend of the methyl-chain and the NCCH3 bend ofthe ethyl-chain) and the band at 434 cm�1 (assigned to the
CNCH3 bend of methyl-chain and the CNCH2 bend) reflectthe relative amount of the P-Np conformers. The represen-tative Raman spectral changes as a function of pressure areshown in Fig. 3(e). The positions of the bands of these twoconformers are separated, as shown in Fig. 3(f). To illus-trate the detailed conformational changes in the [EMIM]+
cations, we show the intensity fractions (f ) of the conformersas a function of pressure in Fig. 3(g). The observed Ramanband intensity (I) is proportional to the Raman cross sec-tion (σ) and the concentration of the conformer (c), I ∝ σc.Assuming that the ratio of the Raman scattering cross sectionsbetween the conformers for the same vibration mode is inde-pendent of pressure,35–39 the f value of each conformer is givenby
fP =IP
IP + INp, fNp =
INp
IP + INp,
where IP and INp are the relative Raman intensities of theP and Np conformers of the [EMIM]+ cations, respectively.Yoshimura et al.19 demonstrated that the CNCC angle ofthe [EMIM]+ cations prefers the Np conformer at 0.1 MPaand the population of the P conformer increased withpressure and finally became the major conformer above 5GPa, as experimentally confirmed. The P conformers of the[EMIM]+ cations contribute to the crystallization of the sam-ple. This conclusion is consistent with RTIL properties wheretheir structural transition behaviors relate to conformationalchanges.6,19–34
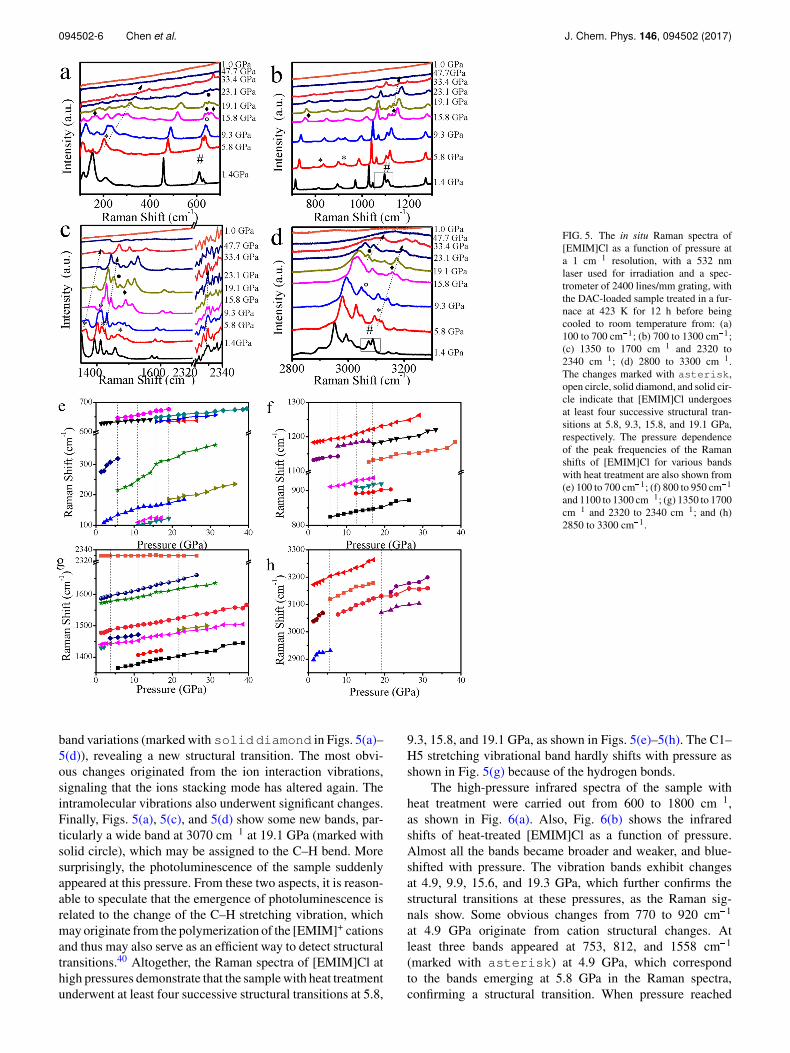
The structural transitions from the Raman spectra of[EMIM]Cl as a function of pressure in condition B are shownin Figs. 5(a)–5(d). The bands did not totally disappear untilpressure reached 47.7 GPa (the highest pressure in our heat-treated sample Raman experiments), which is obviously differ-ent from the sample without heat treatment. The bands at 100�250 cm�1 were detected until pressure increased to 19.3 GPa,indicating that [EMIM]Cl remained crystalline even at thishigh pressure. However, the intramolecular bonds are cova-lent and can only be broken by higher pressures. Furthermore,as the hydrogen bonds in the crystal structure enhanced therigidity of the [EMIM]+ cations, the sample was more resis-tant to pressure and the intramolecular vibration bands werestill observed even at 47.7 GPa. The relative intensities of thebands of the three regions in Figs. 5(a), 5(b), and 5(d) (markedwith pound) alter as pressure increases. From Figs. 5(a)–5(d), we observe that at least seven new bands emerged at 163,824, 912, 1366, 1426, 1480, and 3109 cm�1 at 5.8 GPa (markedwith asterisk) and enhanced with pressure, showing astructural transition. Interestingly, the new bands simultane-ously emerged at the vibration regions of the ion interaction,molecular skeleton, and C–H stretching, respectively. There-fore, the structure of the [EMIM]+ cations slightly changedand the stacking mode of ions also transformed at 5.8 GPa.As pressure reached 9.3 GPa, the Raman spectrum (with thechanges marked with an open circle in Figs. 5(a), 5(c), and5(d)) demonstrates that a structural transition also occurred.This transition likely originated from the rotation of theC–H stretching of the methyl- and ethyl-chains. Furthermore,when pressure reached 15.8 GPa, there were some obvious
094502-6 Chen et al. J. Chem. Phys. 146, 094502 (2017)
FIG. 5. The in situ Raman spectra of[EMIM]Cl as a function of pressure ata 1 cm�1 resolution, with a 532 nmlaser used for irradiation and a spec-trometer of 2400 lines/mm grating, withthe DAC-loaded sample treated in a fur-nace at 423 K for 12 h before beingcooled to room temperature from: (a)100 to 700 cm�1; (b) 700 to 1300 cm�1;(c) 1350 to 1700 cm�1 and 2320 to2340 cm�1; (d) 2800 to 3300 cm�1.The changes marked with asterisk,open circle, solid diamond, and solid cir-cle indicate that [EMIM]Cl undergoesat least four successive structural tran-sitions at 5.8, 9.3, 15.8, and 19.1 GPa,respectively. The pressure dependenceof the peak frequencies of the Ramanshifts of [EMIM]Cl for various bandswith heat treatment are also shown from(e) 100 to 700 cm�1; (f) 800 to 950 cm�1
and 1100 to 1300 cm�1; (g) 1350 to 1700cm�1 and 2320 to 2340 cm�1; and (h)2850 to 3300 cm�1.
band variations (marked with soliddiamond in Figs. 5(a)–5(d)), revealing a new structural transition. The most obvi-ous changes originated from the ion interaction vibrations,signaling that the ions stacking mode has altered again. Theintramolecular vibrations also underwent significant changes.Finally, Figs. 5(a), 5(c), and 5(d) show some new bands, par-ticularly a wide band at 3070 cm�1 at 19.1 GPa (marked withsolid circle), which may be assigned to the C–H bend. Moresurprisingly, the photoluminescence of the sample suddenlyappeared at this pressure. From these two aspects, it is reason-able to speculate that the emergence of photoluminescence isrelated to the change of the C–H stretching vibration, whichmay originate from the polymerization of the [EMIM]+ cationsand thus may also serve as an efficient way to detect structuraltransitions.40 Altogether, the Raman spectra of [EMIM]Cl athigh pressures demonstrate that the sample with heat treatmentunderwent at least four successive structural transitions at 5.8,
9.3, 15.8, and 19.1 GPa, as shown in Figs. 5(e)–5(h). The C1–H5 stretching vibrational band hardly shifts with pressure asshown in Fig. 5(g) because of the hydrogen bonds.
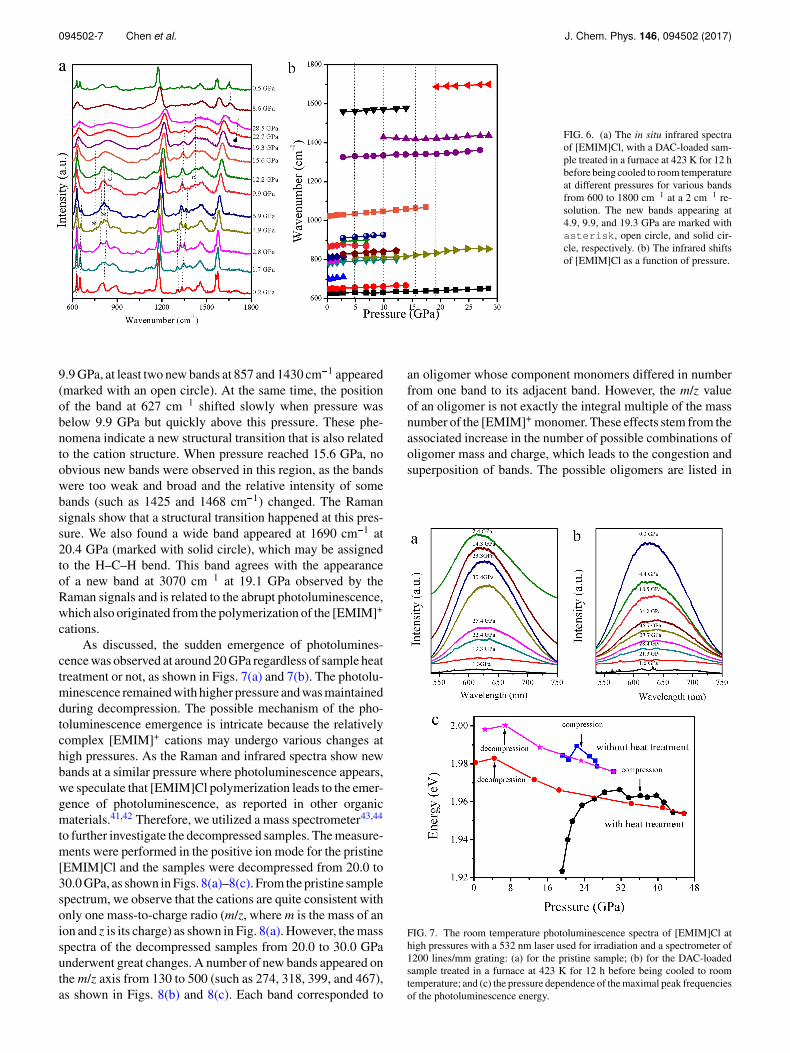
The high-pressure infrared spectra of the sample withheat treatment were carried out from 600 to 1800 cm�1,as shown in Fig. 6(a). Also, Fig. 6(b) shows the infraredshifts of heat-treated [EMIM]Cl as a function of pressure.Almost all the bands became broader and weaker, and blue-shifted with pressure. The vibration bands exhibit changesat 4.9, 9.9, 15.6, and 19.3 GPa, which further confirms thestructural transitions at these pressures, as the Raman sig-nals show. Some obvious changes from 770 to 920 cm�1
at 4.9 GPa originate from cation structural changes. Atleast three bands appeared at 753, 812, and 1558 cm�1
(marked with asterisk) at 4.9 GPa, which correspondto the bands emerging at 5.8 GPa in the Raman spectra,confirming a structural transition. When pressure reached
094502-7 Chen et al. J. Chem. Phys. 146, 094502 (2017)
FIG. 6. (a) The in situ infrared spectraof [EMIM]Cl, with a DAC-loaded sam-ple treated in a furnace at 423 K for 12 hbefore being cooled to room temperatureat different pressures for various bandsfrom 600 to 1800 cm�1 at a 2 cm�1 re-solution. The new bands appearing at4.9, 9.9, and 19.3 GPa are marked withasterisk, open circle, and solid cir-cle, respectively. (b) The infrared shiftsof [EMIM]Cl as a function of pressure.
9.9 GPa, at least two new bands at 857 and 1430 cm�1 appeared(marked with an open circle). At the same time, the positionof the band at 627 cm�1 shifted slowly when pressure wasbelow 9.9 GPa but quickly above this pressure. These phe-nomena indicate a new structural transition that is also relatedto the cation structure. When pressure reached 15.6 GPa, noobvious new bands were observed in this region, as the bandswere too weak and broad and the relative intensity of somebands (such as 1425 and 1468 cm�1) changed. The Ramansignals show that a structural transition happened at this pres-sure. We also found a wide band appeared at 1690 cm�1 at20.4 GPa (marked with solid circle), which may be assignedto the H–C–H bend. This band agrees with the appearanceof a new band at 3070 cm�1 at 19.1 GPa observed by theRaman signals and is related to the abrupt photoluminescence,which also originated from the polymerization of the [EMIM]+
cations.As discussed, the sudden emergence of photolumines-
cence was observed at around 20 GPa regardless of sample heattreatment or not, as shown in Figs. 7(a) and 7(b). The photolu-minescence remained with higher pressure and was maintainedduring decompression. The possible mechanism of the pho-toluminescence emergence is intricate because the relativelycomplex [EMIM]+ cations may undergo various changes athigh pressures. As the Raman and infrared spectra show newbands at a similar pressure where photoluminescence appears,we speculate that [EMIM]Cl polymerization leads to the emer-gence of photoluminescence, as reported in other organicmaterials.41,42 Therefore, we utilized a mass spectrometer43,44
to further investigate the decompressed samples. The measure-ments were performed in the positive ion mode for the pristine[EMIM]Cl and the samples were decompressed from 20.0 to30.0 GPa, as shown in Figs. 8(a)–8(c). From the pristine samplespectrum, we observe that the cations are quite consistent withonly one mass-to-charge radio (m/z, where m is the mass of anion and z is its charge) as shown in Fig. 8(a). However, the massspectra of the decompressed samples from 20.0 to 30.0 GPaunderwent great changes. A number of new bands appeared onthe m/z axis from 130 to 500 (such as 274, 318, 399, and 467),as shown in Figs. 8(b) and 8(c). Each band corresponded to
an oligomer whose component monomers differed in numberfrom one band to its adjacent band. However, the m/z valueof an oligomer is not exactly the integral multiple of the massnumber of the [EMIM]+ monomer. These effects stem from theassociated increase in the number of possible combinations ofoligomer mass and charge, which leads to the congestion andsuperposition of bands. The possible oligomers are listed in
FIG. 7. The room temperature photoluminescence spectra of [EMIM]Cl athigh pressures with a 532 nm laser used for irradiation and a spectrometer of1200 lines/mm grating: (a) for the pristine sample; (b) for the DAC-loadedsample treated in a furnace at 423 K for 12 h before being cooled to roomtemperature; and (c) the pressure dependence of the maximal peak frequenciesof the photoluminescence energy.

094502-8 Chen et al. J. Chem. Phys. 146, 094502 (2017)
FIG. 8. The mass spectra of [EMIM]Clfor the sample: (a) under ambient condi-tions; (b) compressed to 20.0 GPa andthen relieved to atmospheric pressure;and (c) compressed to 30.0 GPa and thenrelieved to atmospheric pressure.
Figs. 8(b) and 8(c). For example, an important band atm/z 274 may be assigned to (C6H11N2)2(CH5)Cl+, show-ing that the dimerization of the [EMIM]+ cations occursand the reaction products are attached by some fragmentions. Another important band at m/z 467 may be assignedto (C6H11N2)3(C4NH2)Cl2+, indicating that three [EMIM]+
cations polymerize into an oligomer. Therefore, we can con-fidently conclude that high pressures over 20 GPa inducethe polymerization of the [EMIM]+ cations and consequentlylead to photoluminescence. Moreover, the photoluminescenceremains when pressure is relieved to atmospheric conditions,maintaining polymerization.
Comparing the emission maxima of the samples withand without heat treatment in Fig. 7(c), we notice that thephotoluminescence wavelength of the sample with heat treat-ment is longer than the sample without. The most reason-able interpretation is that the crystal structure helps chain
polymerization: the longer the chain, the lower the maxi-mal emission energy.45,46 From Fig. 7(c), we see that themaximal emission energy of the sample with heat treatmentmonotonically increases until pressure reaches 31.7 GPa, andthen slowly decreases until pressure is 45.7 GPa (the highestpressure in our photoluminescence experiments), but mono-tonically increases again during decompression to 0.3 GPa.For the sample without heat treatment, we observe that theemission maximum oscillates with pressure but continuouslyincreases during decompression (see Fig. 7(c)).
Finally, we used the XRD patterns to study the structuraltransitions of [EMIM]Cl at high pressures. From Figs. 9(a) and9(b), we again observe at least four successive structural tran-sitions. Crystalline [EMIM]Cl under ambient conditions hasorthorhombic symmetry (space group P212121, a = 10.087 Å,b = 11.179 Å, c = 28.733 Å, and V = 3240.0 Å3),18 but ourdata show that crystalline [EMIM]Cl in condition B has
FIG. 9. (a) The selected angle dis-persive synchrotron XRD patterns of[EMIM]Cl obtained under compressionup to 43.6 GPa and decompressionto 0.4 GPa for the crystalline sample,treated in a furnace at 423 K for 12 hbefore being cooled to room tempera-ture. (b) The pressure dependence of thepeak frequencies of the XRD patterns for[EMIM]Cl.

094502-9 Chen et al. J. Chem. Phys. 146, 094502 (2017)
orthorhombic symmetry (a = 11.244 Å, b = 10.121 Å,c = 9.345 Å, and V = 1063.5 Å3). The crystal structure formedin condition B differs from that obtained under ambient condi-tions. The structural isomers of the [EMIM]+ cations changedrastically into the P conformers, which may constitution-ally influence the stacking mode of [EMIM]Cl in conditionB. When pressure reached 5.3 GPa, crystalline [EMIM]Cltransformed to orthorhombic symmetry (a = 12.665 Å,b = 12.665 Å, c = 6.903 Å, and V = 2119.5 Å3). As discussed,the structure of the [EMIM]+ cations and the ion stackingmodes altered at this pressure. At 9.3 GPa, the structure trans-formed to an orthorhombic phase (a = 25.602 Å, b = 12.235 Å,c = 6.237 Å, and V = 1953.6 Å3). The Raman data show thatthe structure of the [EMIM]+ cations distinctly changed atthis pressure, which induced a structural transition. At 15.0GPa, the structure transformed to a new orthorhombic phase(a = 21.287 Å, b = 14.730 Å, c = 6.194 Å, and V = 1942.1 Å3).At 20.3 GPa, the structure transformed to another neworthorhombic phase (a = 23.633 Å, b = 9.920 Å, c = 6.115 Å,and V = 1443.6 Å3). From both the Raman and infrared spectra,we conclude that pressure-induced polymerization occurs atthis pressure. Figure 9(b) shows the pressure dependence of ourin situ synchrotron XRD patterns of [EMIM]Cl, which againverifies the four successive structural transitions at 5.8, 9.3,15.8, and 19.1 GPa, respectively. The results from our XRDpatterns are consistent with those from the Raman spectra.Considering the limitations of the XRD patterns for solvingthe space groups and lattice parameters of organic materials,further experiments to determine the detailed crystal structuresof the RTILs at high pressures are still necessary and we willfocus on these important issues in future papers.
IV. CONCLUSIONS
In summary, high pressure significantly affects the struc-tures of the RTILs. In our work, the amorphous [EMIM]Clwas first crystallized by heat-treating the compressed sample.This new and simple method also changed the P-Np equilib-rium of the CNCC angle of the ethyl-chain in [EMIM]Cl. Thecrystalline [EMIM]Cl presented structural instabilities at highpressures up to 47.7 GPa. At least four successive structuraltransitions were observed around 5.8, 9.3, 15.8, and 19.1 GPain the Raman spectra and were confirmed by the correspondinginfrared spectra and the XRD patterns. These structural tran-sitions originated from the ion stacking modes and the cationstructural isomers, or possibly by chemical reactions. Further-more, the abrupt emergence of photoluminescence at 19.3 GPaoriginated from the pressure-induced polymerization of the[EMIM]+ cations, as verified by all our Raman, infrared, andmass spectrometry experiments. Pressure-induced polymer-ization is a “green” chemical process as the reactions can beperformed in the absence of any solvent or catalyst, lesseningthe environmental impact.
ACKNOWLEDGMENTS
We are very grateful to Nan Li for fruitful discussions andalso thank Lulu Geng for her support during the experiments.This work is supported by the fund of the National Natural
Science Foundation of China, Chinese Academy of SciencesFund (Grant No. U1332104) and Science Challenging Pro-gram (Grant No. JCKY2016212A501). The high-pressureXRD experiments were carried out at beam line 4W2 ofthe Beijing Synchrotron Radiation Facility, which is sup-ported by the Chinese Academy of Sciences (Grant Nos.KJCX2-SW-N03 and KJCX2-SW-N20).
1R. D. Rogers, “Chemistry: Ionic liquids—Solvents of the future?,” Science302, 792 (2003).
2K. R. Seddon, “Ionic liquids for clean technology,” J. Chem. Technol.Biotechnol. 68, 351 (1997).
3C. L. Hussey, “Room temperature haloaluminate ionic liquids. Novel sol-vents for transition metal solution chemistry,” Pure Appl. Chem. 60, 1763(1988).
4T. L. Greaves and C. J. Drummond, “Protic ionic liquids: Properties andapplications,” Chem. Rev. 108, 206 (2008).
5M. Galinski, A. Lewandowski, and I. Stepniak, “Ionic liquids as elec-trolytes,” Electrochim. Acta 51, 5567 (2006).
6G. F. Reynolds and C. J. Dymek, “Primary and secondary room temperaturemolten salt electrochemical cells,” J. Power Sources 15, 109 (1985).
7Y. Marcus, “The fluidity of room temperature ionic liquids,” Fluid PhaseEquilib. 363, 66 (2014).
8C. F. Poole, “Chromatographic and spectroscopic methods for the determi-nation of solvent properties of room temperature ionic liquids,” J. Chro-matogr. A 1037, 49 (2004).
9H.-C. Chang, J.-C. Jiang, W.-C. Tsai, G.-C. Chen, and S. H. Lin, “Hydrogenbond stabilization in 1, 3-dimethylimidazolium methyl sulfate and 1-butyl-3-methylimidazolium hexafluorophosphate probed by high pressure: Therole of charge-enhanced C–H· · ·O interactions in the room-temperatureionic liquid,” J. Phys. Chem. B 110, 3302 (2006).
10J. P. Hallett and T. Welton, “Room-temperature ionic liquids: Solvents forsynthesis and catalysis. 2,” Chem. Rev. 111, 3508 (2011).
11P. Wasserscheid and W. Keim, “Ionic liquids—New ‘solutions’ for transitionmetal catalysis,” Angew. Chem. 39, 3772 (2000).
12J. A. Boon, J. A. Levisky, J. L. Pflug, and J. S. Wilkes, “Friedel-Craftsreactions in ambient-temperature molten salts,” J. Org. Chem. 51, 480(1986).
13O. Russina, F. Lo Celso, and A. Triolo, “Pressure-responsive mesoscopicstructures in room temperature ionic liquids,” Phys. Chem. Chem. Phys. 17,29496 (2015).
14Y. Yoshimura, M. Shigemi, M. Takaku, M. Yamamura, T. Takekiyo, H. Abe,N. Hamaya, D. Wakabayashi, K. Nishida, N. Funamori, T. Sato, andT. Kikegawa, “Stability of the liquid state of imidazolium-based ionic liq-uids under high pressure at room temperature,” J. Phys. Chem. B 119, 8146(2015).
15Y. Zhao, X. Liu, X. Lu, S. Zhang, J. Wang, H. Wang, G. Gurau, R.D. Rogers, L. Su, and H. Li, “The behavior of ionic liquids under highpressure: A molecular dynamics simulation,” J. Phys. Chem. B 116, 10876(2012).
16S. Sharma, A. Gupta, and H. K. Kashyap, “How the structure of pyrroli-dinium ionic liquids is susceptible to high pressure,” J. Phys. Chem. B 120,3206 (2016).
17H.-C. Chang, C.-Y. Chang, J.-C. Su, W.-C. Chu, J.-C. Jiang, and S. H. Lin,“Conformations of 1-butyl-3-methylimidazolium chloride probed by highpressure Raman spectroscopy,” Int. J. Mol. Sci. 7, 417 (2006).
18L. Su, X. Zhu, Z. Wang, X. Cheng, Y. Wang, C. Yuan, Z. Chen, C. Ma, F. Li,Q. Zhou, and Q. Cui, “In situ observation of multiple phase transitions inlow-melting ionic liquid [BMIM][BF4] under high pressure up to 30 GPa,”J. Phys. Chem. B 116, 2216 (2012).
19Y. Yoshimura, H. Abe, T. Takekiyo, M. Shigemi, N. Hamaya, R. Wada,and M. Kato, “Superpressing of a room temperature ionic liquid, 1-ethyl-3-methylimidazolium tetrafluoroborate,” J. Phys. Chem. B 117, 12296(2013).
20H. Li, L. Su, X. Zhu, X. Cheng, K. Yang, and G. Yang, “In situ crystallizationof ionic liquid [Emim][PF6] from methanol solution under high pressure,”J. Phys. Chem. B 118, 8684 (2014).
21C. J. Dymek, D. A. Grossie, A. V. Fratini, and W. Wade Adams, “Evidencefor the presence of hydrogen-bonded ion-ion interactions in the molten saltprecursor, 1-methyl-3-ethylimidazolium chloride,” J. Mol. Struct. 213, 25(1989).

094502-10 Chen et al. J. Chem. Phys. 146, 094502 (2017)
22M.-C. Lin, M. Gong, B. Lu, Y. Wu, D.-Y. Wang, M. Guan, M. Angell,C. Chen, J. Yang, B.-J. Hwang, and H. Dai, “An ultrafast rechargeablealuminium-ion battery,” Nature 520, 324 (2015).
23S. Wang, Z. Yu, J. Tu, J. Wang, D. Tian, Y. Liu, and S. Jiao, “Anovel aluminum-ion battery: Al/AlCl3-[EMIm]Cl/Ni3S2@graphene,” AdvEnergy Mater. 6, 100137 (2016).
24M. Zhang, V. Kamavarum, and R. G. Reddy, “New electrolytes for aluminumproduction: Ionic liquids,” JOM 55, 54 (2003).
25S. Sharma, A. Gupta, D. Dhabal, and H. K. Kashyapa, “Pressure-dependentmorphology of trihexyl(tetradecyl)phosphonium ionic liquids: A moleculardynamics study,” J. Chem. Phys. 145, 134506 (2016).
26H. K. Mao, P. M. Bell, J. W. Shaner, and D. J. Steinberg, “Specific volumemeasurements of Cu, Mo, Pd, and Ag and calibration of the ruby R1 flu-orescence pressure gauge from 0.06 to 1 Mbar,” J. Appl. Phys. 49, 3276(1978).
27A. P. Hammersley, S. O. Svensson, M. Hanfland, A. N. Fitch, and D.Hausermann, “Two-dimensional detector software: From real detector toidealised image or two-theta scan,” High Pressure Res. 14, 235 (1996).
28Y. Yoshimura, T. Takekiyo, Y. Imai, and H. Abe, “Pressure-inducedspectral changes of room-temperature ionic liquid, N,N-diethyl-N-methyl-N-(2-methoxyethyl)ammonium bis(trifluoromethylsulfonyl)imide,[DEME][TFSI],” J. Phys. Chem. C 116, 2097 (2012).
29N. E. Heimer, R. E. Del Sesto, Z. Meng, J. S. Wilkes, and W. R. Carper,“Vibrational spectra of imidazolium tetrafluoroborate ionic liquids,” J. Mol.Liq. 124, 84 (2006).
30S. Takahashi, L. A. Curtiss, D. Gosztola, N. Koura, and M.-L. Saboungi,“Molecular orbital calculations and Raman measurements for 1-ethyl-3-methylimidazolium chloroaluminates,” Inorg. Chem. 34, 2990 (1995).
31Y. Umebayashi, J.-C. Jiang, Y.-L. Shan, K.-H. Lin, K. Fujii, S. Seki,S.-I. Ishiguro, S. H. Lin, and H.-C. Chang, “Structural change of ionic associ-ation in ionic liquid/water mixtures: A high-pressure infrared spectroscopicstudy,” J. Chem. Phys. 130, 124503 (2009).
32L. F. Scatena, M. G. Brown, and G. L. Richmond, “Water at hydrophobicsurfaces: Weak hydrogen bonding and strong orientation effects,” Science292, 908 (2001).
33Y. Taniguchi, “Effect of pressure on rotational isomers in solution: Infraredand Raman spectroscopy,” J. Mol. Struct. 126, 241 (1985).
34G. Kaupp, J. Schmeyers, and U. D. Hangen, “Anisotropic molecular move-ments in organic crystals by mechanical stress,” J. Phys. Org. Chem. 15,307 (2002).
35J. R. Nestor and E. R. Lippincott, “The effect of the internal field on Ramanscattering cross sections,” J. Raman Spectrosc. 1, 305 (1973).
36M. Kato and Y. Taniguchi, “High pressure study on molecular conforma-tional equilibria of n-pentane,” J. Chem. Phys. 94, 4440 (1991).
37M. Kato and Y. Taniguchi, “Raman study on the conformational equilib-rium of 1, 3-dichloropropane in the liquid phase. Pressure, temperature, andsolvent effects,” J. Phys. Chem. 98, 2688 (1994).
38H. Isogai, M. Kato, and Y. Taniguchi, “Effects of pressure and sol-vents on the infrared absorption intensities of C–I stretching modes ofmethyl and ethyl iodides in solutions,” Spectrochim. Acta, Part A 69, 327(2008).
39L. Colombo, K. Furic, and D. Kirin, “Dynamics of organic molecularcrystals,” J. Mol. Struct. 46, 495 (1978).
40R. Holomb, A. Martinelli, I. Albinsson, J. C. Lassegues, P. Johansson, andP. Jacobsson, “Ionic liquid structure: The conformational isomerism in 1-butyl-3-methyl-imidazolium tetrafluoroborate ([bmim][BF4]),” J. RamanSpectrosc. 39, 793 (2008).
41S. A. Jenekhe and J. A. Osaheni, “Excimers and exciplexes of conjugatedpolymers,” Science 265, 765 (1994).
42J. A. Osaheni and S. A. Jenekhe, “Efficient blue luminescence of aconjugated polymer exciplex,” Macromolecules 27, 739 (1994).
43F. Badoud, E. Grata, L. Perrenoud, M. Saugy, S. Rudaz, and J.-L. Veuthey,“Fast analysis of doping agents in urine by ultra-high-pressure liquidchromatography–quadrupole time-of-flight mass spectrometry. II: Confir-matory analysis,” J. Chromatogr. A 1217, 4109 (2010).
44J. B. Fenn, M. Mann, C. K. Meng, S. F. Wong, and C. M. Whitehouse, “Elec-trospray ionization for mass spectrometry of large biomolecules,” Science246, 64 (1989).
45V. H. Houlding and V. M. Miskowski, “The effect of linear chain structureon the electronic structure of pt(II) diimine complexes,” Coord. Chem. Rev.111, 145 (1991).
46T. Nguyen, J. Wu, V. Doan, J. B. Schwartz, and H. S. Tolbert, “Con-trol of energy transfer in oriented conjugated polymer-mesoporous silicacomposites,” Science 288, 652 (2000).