Éts montreal 2015 - wordpress.com · École de technologie supérieure, 2015 the type of energy...
TRANSCRIPT

ÉTS MONTREAL
CONCRETE CANOEDESIGN PAPER2015
ÉTS MONTREAL
CONCRETE CANOEDESIGN PAPER2015
École de technologie supérieure, 2015i
TABLE OF CONTENTS
LIST OF FIGURESFigure 1: Samba’s Expense Allocation ........................................................................................................1Figure 2 : Man-hours Distribution ...............................................................................................................1Figure 3 : Hull Design Evolution .................................................................................................................3Figure 4 : Operating Principle of the Excel® Tool ......................................................................................4Figure 5 : Bending Moment of the Longitudinal Analysis ..........................................................................4Figure 6 : Positioning of the General Mix and Structural Mix ....................................................................4Figure 7 : Architecture of the ANN .............................................................................................................5Figure 8 : Results for the training and testing datasets for both targets (lab) and output (ANN) ................5Figure 9 : Carbon Footprint Range for Compressive Strengths ..................................................................6Figure 10 : Mix Selection Process ..............................................................................................................6Figure 11 : Mold Assembly .........................................................................................................................8Figure 12 : Colorimetry ..............................................................................................................................8Figure 13 : New Grid Placing Method ........................................................................................................8Figure 14 : New Grid Tying Method ...........................................................................................................8Figure 15 : Unrolling of Grid Followed by Second Layer of Concrete ......................................................9Figure 16 : New Thickness Verifying Gauge ...............................................................................................9Figure 17 : 3D Scanning of the Canoe .........................................................................................................9
LIST OF APPENDICESAppendix A - References ........................................................................................................................ A-1Appendix B - Mixture Proportions ..........................................................................................................B-1Appendix C - Bill of Materials ................................................................................................................C-1Appendix D - Example Structural Calculation ....................................................................................... D-1
LIST OF TABLESTable 1: Canoe Specifications ..................................................................................................................... iiTable 2: Concrete and Reinforcement Properties ....................................................................................... iiTable 3: Project’s Major Milestones ............................................................................................................1Table 4 : Samba’s Hull Characteristics ........................................................................................................3Table 5 : Critical Loading Cases .................................................................................................................4Table 6 : Evolution of the Characteristics of Mixtures ...............................................................................7
Executive Summary .................................................................................................................................... iiProject Management ....................................................................................................................................1Organization Chart .......................................................................................................................................2Hull Design and Structural Analysis ............................................................................................................3Development and Testing .............................................................................................................................5Construction .................................................................................................................................................8Project Schedule .........................................................................................................................................10Design Drawing .........................................................................................................................................11

École de technologie supérieure, 2015
The type of energy emulated during the Rio Carnival is simply electrifying as many people flood the streets of the city for a once in a lifetime experience. Visitors travel from far and wide to experience at first hand the samba dances and their colorful costumes, the pulsating music or just the crowd itself. During the competition, our canoe Samba will certainly need no introduction! The effort and the energy invested by the École de technologie supérieure (ÉTS) so that its canoe could see the light of day is relentless. Founded in 1974, the ÉTS is part of the Université du Québec network. Located in Montreal’s Griffintown, the École de technologie supérieure specializes itself in applied teaching in engineering and technology. Since its inception, it has been recognized to offer one of the top co-op engineering programs in Quebec because of their practical approach as well as methods taught to their 6 300 students which have been appealing to different companies on the market. As of today, 25 % of all engineering graduates from Quebec hail from the École de technologie supérieure. The ÉTS competes in the Upstate New York Concrete Canoe Conference (UNYCCC) and the Canadian National Concrete Canoe Competition (CNCCC). Its canoe team has competed for years in order to be relevant in terms of competition with other universities year after year. As a matter of fact, the team finished 1st at regional com-petitions over the last 8 years. If taken into consideration more recent results at the CNCCC, the ÉTS ranked in 2nd place with Grand Prix in 2012, 2nd place with Savannah in 2013 and 2nd place with Kanaloa in 2014. The characteristics of Samba, the ÉTS’s canoe ready for the 2015 competitions, are seen in Table 1 and Table 2. Many innovations were brought to the overall project for the 2014-2015 year; four major changes are highlighted. Starting off with the structural analysis, an analysis tool was perfected with Microsoft® Excel™ to obtain results of internal stresses in the canoe. This automated tool reduced the time needed to complete the analysis, thus finishing two weeks earlier than the previous year. Secondly, the analysis team thought of using two different concretes, each with specific properties, in order to obtain a lighter canoe while answering structural require-ments. Thirdly, after two years of development, the mix design team trained a neural network from a large data-base in order to model the compressive strength. Coupled with a genetic algorithm, this mathematical tool can generate an infinite amount of concrete mixtures for a given compressive strength. Effective at 84%, this tool permits a logical selection amongst a large amount of mixtures to optimize the CO2 emission or even the cost for example. Fourthly, a 3D scanner, sponsored for a year by Creaform®, was added to the quality control program. This new tool provided a virtual detailed version of the mold and concrete which will then be compared to the initial 3D models created in CATIA®. A colorimetry will then expose variations with the theoretical model and variations of hull thickness. Furthermore, an important step has been taken towards improving the canoe’s environmental footprint. A CO2 emission calculation was performed to determine the impact of the canoe’s construction cycle as well as its competition cycle. With the results, the ÉTS team contacted Compensation CO2 Québec™ to plant trees, thus counteracting the canoe’s environmental impact.
Table 1 : Canoe Specifications
Samba’s Specifications
Total weight Lenght Depth Thickness Concrete color Stain colors Reinforcements
45 kg 6 106 mm 380 mm 9,525 mm White and 3 shades of orange
Black, red, orange, yellow, blue, green Fiberglass grid and fiberglass rod
Table 2 : Concrete and Reinforcement Properties
Structural (S) and General (G) concrete mixtures properties
G S G S
Wet Unit Weight ASTM C138 682 kg/m3 700 kg/m3 14-day Comp. Strength ASTM C39 3,8 MPa 4,3 MPa
Dry Unit Weight ASTM C567 540 kg/m3 550 kg/m3 28-day Comp. Strength ASTM C39 4,1 MPa 4,6 MPa
Young Modulus ASTM C469 0,4 GPa 0,4 GPa 14-day Tensile ASTM C496 1,1 MPa 1,1 MPa
Yield 0,15 m3 0,05 m3 Air ASTM C138 11.9% 9.0%
Concrete reinforcement properties
Location Primary Composite mecanical properties G S
Hull Grid 14-day Grid Composite Flextural strenght (rupture) ASTM C78 3,8 MPa
Gunwales Rod 14-day Rod Composite Flextural strenght (rupture) ASTM C78 3,7 MPa -ii
EXECUTIVE SUMMARY
École de technologie supérieure, 2015
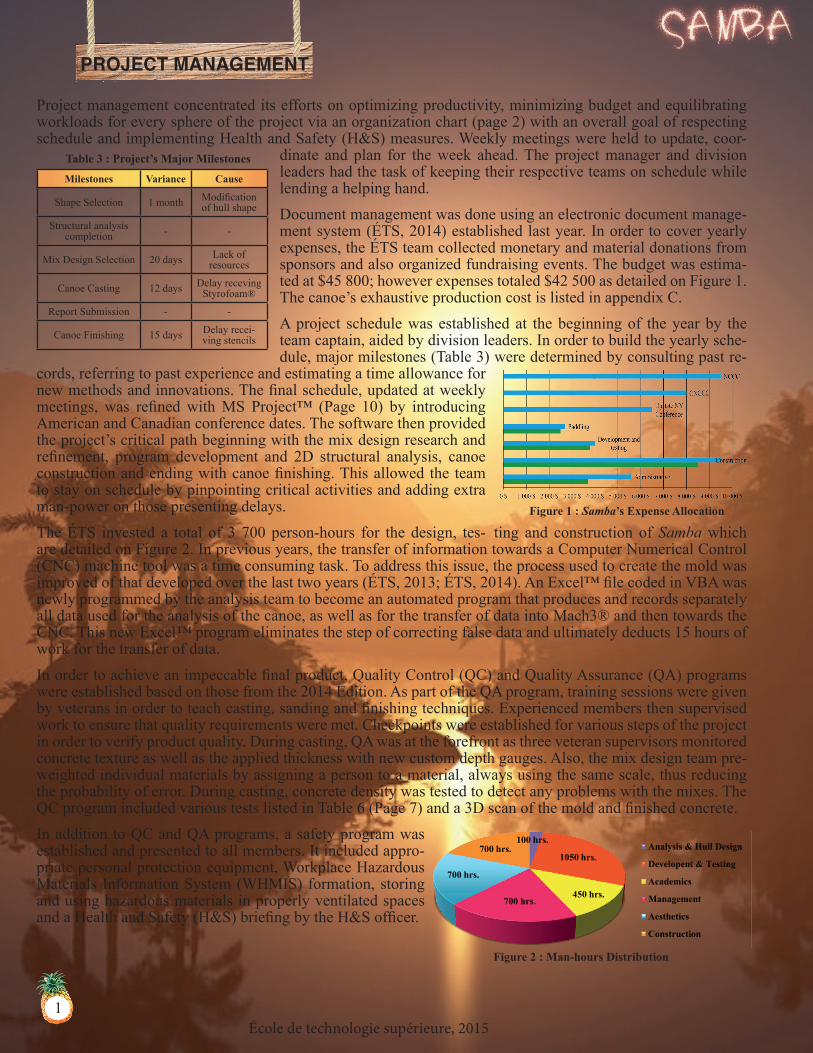
Project management concentrated its efforts on optimizing productivity, minimizing budget and equilibrating workloads for every sphere of the project via an organization chart (page 2) with an overall goal of respecting schedule and implementing Health and Safety (H&S) measures. Weekly meetings were held to update, coor-
dinate and plan for the week ahead. The project manager and division leaders had the task of keeping their respective teams on schedule while lending a helping hand. Document management was done using an electronic document manage-ment system (ÉTS, 2014) established last year. In order to cover yearly expenses, the ÉTS team collected monetary and material donations from sponsors and also organized fundraising events. The budget was estima-ted at $45 800; however expenses totaled $42 500 as detailed on Figure 1. The canoe’s exhaustive production cost is listed in appendix C. A project schedule was established at the beginning of the year by the team captain, aided by division leaders. In order to build the yearly sche-dule, major milestones (Table 3) were determined by consulting past re-
cords, referring to past experience and estimating a time allowance for new methods and innovations. The final schedule, updated at weekly meetings, was refined with MS Project™ (Page 10) by introducing American and Canadian conference dates. The software then provided the project’s critical path beginning with the mix design research and refinement, program development and 2D structural analysis, canoe construction and ending with canoe finishing. This allowed the team to stay on schedule by pinpointing critical activities and adding extra man-power on those presenting delays. The ÉTS invested a total of 3 700 person-hours for the design, tes- ting and construction of Samba which are detailed on Figure 2. In previous years, the transfer of information towards a Computer Numerical Control (CNC) machine tool was a time consuming task. To address this issue, the process used to create the mold was improved of that developed over the last two years (ÉTS, 2013; ÉTS, 2014). An Excel™ file coded in VBA was newly programmed by the analysis team to become an automated program that produces and records separately all data used for the analysis of the canoe, as well as for the transfer of data into Mach3® and then towards the CNC. This new Excel™ program eliminates the step of correcting false data and ultimately deducts 15 hours of work for the transfer of data. In order to achieve an impeccable final product, Quality Control (QC) and Quality Assurance (QA) programs were established based on those from the 2014 Edition. As part of the QA program, training sessions were given by veterans in order to teach casting, sanding and finishing techniques. Experienced members then supervised work to ensure that quality requirements were met. Checkpoints were established for various steps of the project in order to verify product quality. During casting, QA was at the forefront as three veteran supervisors monitored concrete texture as well as the applied thickness with new custom depth gauges. Also, the mix design team pre-weighted individual materials by assigning a person to a material, always using the same scale, thus reducing the probability of error. During casting, concrete density was tested to detect any problems with the mixes. The QC program included various tests listed in Table 6 (Page 7) and a 3D scan of the mold and finished concrete. In addition to QC and QA programs, a safety program was established and presented to all members. It included appro-priate personal protection equipment, Workplace Hazardous Materials Information System (WHMIS) formation, storing and using hazardous materials in properly ventilated spaces and a Health and Safety (H&S) briefing by the H&S officer.
Milestones Variance Cause
Shape Selection 1 month Modification of hull shape
Structural analysis completion - -
Mix Design Selection 20 days Lack of resources
Canoe Casting 12 days Delay receving Styrofoam®
Report Submission - -
Canoe Finishing 15 days Delay recei-ving stencils
PROJECT MANAGEMENT
1
Table 3 : Project’s Major Milestones
Figure 2 : Man-hours Distribution
Figure 1 : Samba’s Expense Allocation
100 hrs.
1050 hrs.
450 hrs.700 hrs.
700 hrs.
700 hrs. Analysis & Hull Design
Developent & Testing
Academics
Management
Aesthetics
Construction
École de technologie supérieure, 2015
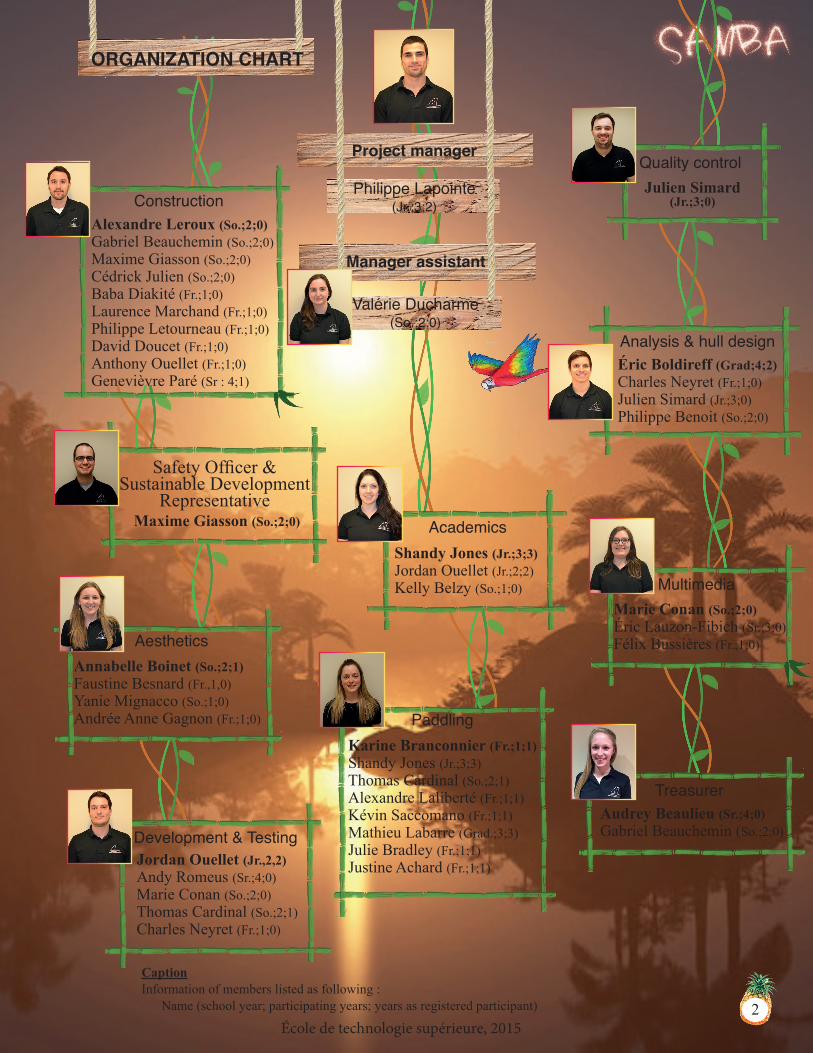
Alexandre Leroux (So.;2;0)Gabriel Beauchemin (So.;2;0)Maxime Giasson (So.;2;0)Cédrick Julien (So.;2;0)Baba Diakité (Fr.;1;0)Laurence Marchand (Fr.;1;0)Philippe Letourneau (Fr.;1;0)David Doucet (Fr.;1;0)Anthony Ouellet (Fr.;1;0)Genevièvre Paré (Sr : 4;1)
Construction
PaddlingKarine Branconnier (Fr.;1;1)Shandy Jones (Jr.;3;3)Thomas Cardinal (So.;2;1)Alexandre Laliberté (Fr.;1;1)Kévin Saccomano (Fr.;1;1)Mathieu Labarre (Grad.;3;3)Julie Bradley (Fr.;1;1)Justine Achard (Fr.;1;1)
AestheticsAnnabelle Boinet (So.;2;1)Faustine Besnard (Fr.,1,0)Yanie Mignacco (So.;1;0)Andrée Anne Gagnon (Fr.;1;0)
TreasurerAudrey Beaulieu (Sr.;4;0)Gabriel Beauchemin (So.;2;0)
Analysis & hull design
Quality control
Academics
Development & Testing
MultimediaMarie Conan (So.;2;0)Éric Lauzon-Fibich (Sr.;3;0)Félix Bussières (Fr.;1;0)
Maxime Giasson (So.;2;0)
Philippe Lapointe (Jr.;3;2)
Valérie Ducharme (So.;2;0)
2
Jordan Ouellet (Jr.,2,2)Andy Romeus (Sr.;4;0)Marie Conan (So.;2;0)Thomas Cardinal (So.;2;1)Charles Neyret (Fr.;1;0)
Shandy Jones (Jr.;3;3)Jordan Ouellet (Jr.;2;2)Kelly Belzy (So.;1;0)
Julien Simard (Jr.;3;0)
Éric Boldireff (Grad;4;2)Charles Neyret (Fr.;1;0)Julien Simard (Jr.;3;0)Philippe Benoit (So.;2;0)
CaptionInformation of members listed as following : Name (school year; participating years; years as registered participant)
Safety Officer & Sustainable Development
Representative
ORGANIZATION CHART
Project manager
Manager assistant

École de technologie supérieure, 2015
With the experience gained over the last three years, regarding the hull design the analysis team can now easily define the important parameters to modify in the Parameterized Management File (PMF) in order to alter the canoe’s behavior while being on water. During Grand Prix, it was the first year that the team had the freedom of choosing the hulls shape, since it was not imposed. The analysis team then decided to make a drastic change when it came to the shape of the hull, without necessarily having enough knowledge about the subject. The choice of the hull was based on a shallow arch style. The consequences on the canoe resulted in unstea-diness, difficult turns and a lack of space in the canoe preventing the paddlers from exploiting their full potential. Then, with Savannah, the basic idea was to give greater stability to the canoe as well as to allow paddlers to be more comfortable while racing. However, the hull shape obtained did not allow the ideal compromise between speed and maneuverability. Yet, the turns did become easier to manage but the canoe did not reach its full potential. Last year, with Kanaloa (ÉTS, 2014), minor changes were made to the Savannah canoe design in order to optimize the performance in terms of the canoe’s speed. The analysis team decided to reduce the size of the canoe to decrease overall weight since the team was confident in its design as well as the results it could obtain with this hull form. This year, with Samba, the shape selection of the hull is mainly based on the model of Kanaloa and certain changes were made as recommended by the paddlers, due to concerns regarding stability, speed at the turns and entry of water into the canoe during races. Thereafter, the comments made by paddlers were interpreted to make changes based on bench tests, which took place during Savannah in 2013, as well as changes regarding the knowledge that has been transmitted to the team over the years. As seen in Figure 3, changes were made on Kanaloa regarding the height of the hull and the curves of the bottom of the canoe. In order to address the partial lack of stability, the radius of the curves of the bottom of the canoe were flattened by 12,5%. This adjustment will increase the stability of the canoe during races and
exploit the full power of the paddlers, who will have more confidence when it comes to making sure that the canoe remains stable. The second change made to Kanaloa was an increase of 12,7 mm for the height of the gunwales. Last year during a 4 paddler race, a lower gunwale caused water to enter the canoe, thus forcing paddlers to decrease speed. With this modification, the water line will be lowered, therefore increasing the confidence of paddlers regarding the accumulation of water in the canoe when attempting risky tactics. Samba’s hull characteristics are detailed in Table 4. Next year’s goal in shape development is to incorporate the use of a naval de-sign software which will allow the team to bring the analysis of the canoe to a whole new level by producing several iterations of the basic shell and subjec-ting it to several numerical analysis models. This should allow the extraction of an optimal hull design for the team’s needs.An analysis tool was developed and perfected with Excel™ over a two year
period in order to obtain results that would take into consideration internal stresses present in Samba. The opera-ting principle of this tool is shown graphically in Figure 4. In previous editions, we considered that the concrete worked in tension and that there was no cracking. Following observations on the canoe post-competition, it was noticed that the concrete cracked despite the design. Samba’s design was then made so as to allow cracking with tension being taken up by the primary reinforcements. The calculations that are integrated in this tool, built with Excel™, are equations taken exclusively from the mechanics of materials (Appendix D) and analyze the hull in 80 cross sections. The calculations made were in function of the traditional conception of reinforced concrete, which allows the obtainment of a concrete desi-gned by its compressive strength instead of its tensile strength. By using this Excel™ tool that has been auto-mated, the analysis time has been greatly decreased by 80 hours compared to time invested for Kanaloa (ÉTS, 2014). The accuracy of the calculus was enhanced and now the risk of error in almost nil.
HULL DESIGN & STRUCTURAL ANALYSIS
Characteristics SambaType of shape Shallow Arch
Lenght 6 106 mm
Width 614 mm
Depth 380 mm
Thickness 9,525 mm
Gunwale Width 27 mm
Gunwale Thickness 30 mm
Bow Rocker 105 mm
Stern Rocker 165 mm
Chine Angle 6o (Soft Chine)
Asymmetric N/A
Figure 3 : Hull DesignEvolution
Table 4 : Samba’s Hull Characteristics
3

École de technologie supérieure, 2015
Taking into consideration the cracking of the concrete due to tension, the stresses covered transversally by the grid and lon-gitudinally by the reinforcement bar needed to be calculated by the analysis team. This conception al-lowed the use of a concrete 5,378 MPa less than that used for Kana-loa for a same thickness, which directly decreased the density of the concrete and thus the final weight of the canoe. Furthermore, this year’s analysis considered a hull thickness of 9,525 mm, which is the same thickness used for last year’s analysis. This value was conserved due to the team’s casting method for which a thinner hull could become problematic.The canoe was analyzed as a reversed beam with uneven loading due to Archimedes’ principle which varies depending on the ca-noe’s geometry and water line. The loading cases studied were the 2 paddler and 4 paddler races, and also the canoe’s display support. The use of saddles and kneepads by paddlers, in the canoe, ensure a good weight distribution, and so, no particular structural considerations were taken in to account. The transpor-tation case is considered negligible since the canoe is supported along its entire length. The critical case is found to be the 2 male paddler races on the longitudinal axis, and the 4 paddler races for the analysis of the transversal axis. Analysis results are com-piled in Table 5. Additionally, Figure 5 demonstrates the ben-ding moments obtained following the analysis on the longitudi-nal axis. The weights used for paddlers ranged from 77,12 kg to 97,55 kg, men and women included, and a weight of 43,12 kg for the canoe. The weighting factors for live loads are 1,0, since the weight of each pad-dler is verified prior to boar-ding the canoe. A dead load factor valued at 1,25 was ob-tained following a comparison between the estimated weight and the actual weight of the canoe from the last two years. A factor of 1,25 was used for the dynamic factor according to the research of F. Paradis and G. Gendron (2007). Also, a performance factor of 0,85 is applied to the concrete’s resistance and is determined in collaboration with the mix design team. A unilateral confidence interval of 97,5% was then calculated on 135 mixes distributed over 675 cylindrical specimens. Following the structural analysis, the analysis team determined that the use of two types of concrete would be beneficial to reduce the total weight of the concrete (Figure 6). A stronger structural concrete will be used on the bottom of the inner section of the canoe to withstand high compression due to transversal stresses (water thrust). A general concrete, slightly less resistant than the structural concrete, will be chosen for its lower density which would reduce the weight of the canoe. Using a heavier concrete in the bottom of the canoe will improve stability by lowering the center of mass.
4
Longitudinal Transversal
Loading Cases Compressive Stress Tension Stress Compressive Stress Tension Stress
Two-Male -1,95 MPa 0 MPa -0,33 MPa 0 MPa
Co-ed -1,92 MPa 0 MPa -4,15 MPa 0 MPa
Display Supports Negligible Negligible Negligible Negligible
Table 5 : Critical Loading Cases
Figure 6 : Positioning of the General Mix and Structural Mix
Fi-
Figure 4 : Operating Principle of the Excel™ Tool
General Mix (G)
Structural Mix (S)
402 points (X,Y)by section of themold used for the
CNC
● Inertia● Neutral axis● Area of concrete● Area submerged● Height of section● Width● Center of inertia
Calculation of Vand M for the 80
sections
● Free body diagram● Shear diagram● Bending moment diagram
● Calculation of internal stresses of shearing andbending moment
INPUTINPUTCALCULATION OF
EACH SECTIONPROPRIETY
CALCULATION OFEACH SECTION
PROPRIETY
CALCULATION OFEXTERNALSTRESSES
CALCULATION OFEXTERNALSTRESSES
OUTPUTOUTPUT

École de technologie supérieure, 2015
The previous editions of the ÉTS employed iterative methods to optimize the concrete, and it is now possible to count on a formulation aid support system to pre-formulate that pre-optimizes concrete mathematically. Nee-ding to equitably meet the needs of all project’s divisions, an iterative formulation method would have required too many resources to achieve optimal mixtures. So in order to acquire a formulation support system for the long term and to optimally meet the increasing demands of various spheres of the project, a mathematical tool was employed this year after more than two years of development. Trained by a large database, this tool has the ability to generate an infinite number of mixtures for which material proportions can theoretically meet mecha-nical, rheological, aesthetic and environmental characteristics sought.
The use of an artificial neural network (ANN) was chosen to model the concrete since this type of model has proven its worth before in predicting the compres-sive strength of various types of concrete (Alshihri et al., 2009; Sobhani et al., 2010 and Bilim et al., 2009.). In order to calibrate such a model, 135 mixtures were formulated and tested in laboratory over two years to cover all possible realistic material proportions. The architecture of the ANN is shown in Figure 7 where eight input parameters represent the masses of different materials and the output parameter represents the compressive strength at 14 days.
The aggregates modeled by the ANN are amongst two dimensions of Expanded Recycled Glass Bubbles (Pora-ver 0.25-0.5 mm™ and Poraver 0.5-1.0 mm™, Poraver®) because of their low density and low impact factor for CO2 emissions. Their 25% absorption ensures a constant hydration of the binging agents and a progressive coa-lescence of the polymers. The ANN also models Soda-Lime/Borosilicate Glass Microspheres (K1™, 3M®) that completes the granular skeleton while advantageously reducing density in favor of the compressive strength. The fine size of its spherical particles (<40 µm) tends to mechanically fluidize the mixture (Kosmatka et al., 2011) providing the desired maneuverability. For aesthetic reasons, White Type I Portland Cement (ASTM C 150) (Federal White®) and Grade 120 Granulated Blast Furnace Slag (GBFS) (ASTM C 989) (GranCem™, Holcim®) were selected because of their color and brilliance. The GBSF, in addition to being a pre-consumer recycled material, reduces the water demand and improves workability (Kosmatka et al., 2011). Its CO2 impact factor represents approximately 5% times that of ordinary cement (JSCE, 2005). Combined with white Port-land cement, GBFS improves strength and reduces the density of the mix due to its specific gravity of 2.89. The liquid portion of the mixture modeled by the ANN is provided by a Styrene-butadiene-rubber (SBR) Latex solution (ASTM C 1438) (Albitol® Concentrate™, Sika®) and an Acrylic Latex Solution (ASTM C 1438) (Latex R™, Sika®), contributing to advantageously reduce the modulus of elasticity. Latex solutions provide cohesion to the mix during the application on the mold. The combination of both latexes enables the selection of the right amount of water for a fixed rate of polymers. In order to adjust the workability of the mix without alte-ring mechanical performances, the High-Range Water-Reducer (ASTM C 494) (Glenium® 7700™, BASF®) is used to minimize the W/B ratio in favor of plasticity. These eight materials formed, at different dosages, the 135 mixtures that trained the ANN.
Just like the ANN models the compressive strength using material proportions, a Genetic Algorithm (GA) has the ability to generate an infinite number of mixtures whose proportions will provide a desired compressive strength. This tool, which can help the team formulate concrete, has seen its performance validated in laboratory and can be interpreted in Figure 8.
With the aid of a GA, it is possible to generate mixtures meeting the compressive strength expectations with an error margin of at most 16%.
5
DEVELOPMENT & TESTING
Figure 7 : Architecture of the ANN
Figure 8 : Results for the training and testing datasets for both targets (lab) and output (ANN)

École de technologie supérieure, 2015
This tool allows a great reduction of mixes and ensures an economy of re-sources, thus conferring a clear benefit in terms of environment, finances and human in the long-term. However, the challenge with this tool isn’t generating valid mixtures, but choosing from an infinite number of mix-tures the one that meets best the team’s needs. To do so, it is possible to pre-evaluate the performance of the infinity of generated mixes for a compressive strength given. The Figure 9 shows an example of all envi-ronmental possibilities for a given compressive strength. The mix selec-tion process used this year is presented in Figure 10. In order to maximize the canoes resistance in regard to its mass, two concretes were selected for the construction of the canoe as mentioned in the structural analysis section, a structural mix (S) and a general mix (G).
Initially, a meeting regrouping all division leaders and the pro-ject manager allowed to clearly identify all the needs concerning the concrete. A total of seven key parameters were formulated and weighted to take into account their level of importance. The para-meters, presented in Figure 10, will be used to assess the enormous quantities of mixtures generated for the general mix (3,654 MPa) and structural mix (4,895 MPa).
The theoretical evaluation of the generated mixes is possible thanks to the experience transmitted by the mix designers who have been observing and measuring the influence of proportions on physical, mechanical, rheological and aesthetic characteristics for several years. A mixture scoring system was developed using calculations based on the proportions of materials. For example, the workability of the concrete was evaluated by liquids quantity constraints, W/B ratio and additives. To evaluate the mechanical behavior, the team targeted polymer rates provided by the latex solutions that confer behavior enjoyed by paddlers. Thus, the score of the generated mixes were calculated and two baseline mixes were selected (G and S), due to their higher score.
Table 6 presents the anticipated properties of the two theoretical mixes (ANN Predicted baseline) as well as the results of the lab validation on ANN Predicted Baseline. The score of both mixes va-lidated in laboratory are lower than predicted due to their excessive fluidity which affects the concrete placement. Also, tests on a cut-away section revealed a network of shrinkage cracks of up to 0,254 mm wide. Furthermore, the aesthetics score will be improved once the mix design team is able to produce a colored concrete required for inlays.
Requiring only minor adjustments to improve the mixes’ score, changes were made without having to re-eva-luate another mix amongst those generated. Latex proportions were adjusted to minimize the amount of poly-mers and water in the mixture. New materials were added in order to counteract cracking and respond to the colored concrete requests for aesthetics. It was determined that at a maximum of 2 wt.% of the mixture, the Iron Oxyde Pigments (ASTM C 979) (Interstar® mortar pigments) provided sufficient coloring without signi-ficantly affecting the rheological or mechanical properties. The previous edition of the canoe exhibited a large cracking network (13,716 m of cracks < 0,3048 mm) due to concrete shrinkage. Shrinkage tests on the proble-matic concrete have determined that a ratio of 15% solid polymers/cementitious mass helped limit the shrinking during wet and dry curing on concrete slabs. A maximum dosage according to the data sheets of Multifilament and Fibrillated Polypropylene Fibers (ASTM C 1116) (Fibermesh 150™, Fibermesh 300™, Propex®) and a recommended dosage of Shrinkage-Reducing Agent (ASTM C 494) (MasterLife® SRA-20™, BASF®) help to control the problem of cracking concrete on a cut-away section after 28 days. 6
Figure 9 : Carbon Footprint Range for Compressive Strengths
Figure 10 : Mix Selection Process
GENERAL TEAMREQUIREMENTS
PROJECT DIVISIONSAnalysis & hull design teamConstruction teamAesthetic teamPaddling team
MIX DESIGN TEAMFormulation tool needed
7 DETERMINING PARAMETERSAND WEIGHTING FACTORS
1- Mecanical strenght (Essential)2- Weight of the canoe (35%)3- Finishing of the concrete (25%)4- Concrete workability (15%)5- Structural behaviour (10%)6- Environmental impact (10%)7- Cost of the concrete (5%)
ARTIFICIAL NEURALNETWORK (ANN)
Link material proportions tocompressive strenght
MIX SCORING ESTABLISHMENTBased on the knowlege and experience of the
concrete designers to estimate the concretebehaviour from material proportions.
BASELINE MIXBest overall score
LAB VALIDATION-14 day Comp. Strength-Unit weight-Oven-dry density-Elasticity modulus-Workability-Cracking susceptibility-Finishing quality
135 CONCRETE MIXESAll possible material proportions
GENETIC ALGORITHM (GA)Generate material proportions for aninfinite amount of concrete mixtures
for a given compressive strenght
GENERATED MIXESLarge amount of mixes with various
proportions for the compressivestrenght aimed.
FINAL MIX
MIX EVALUATIONBased on the same scoring systemused for the baseline evaluation.
Satisfying scoreUnsatisfying score
Major modif.needed
Minor modif.needed
Mix ajustements-Proportions-Materials

École de technologie supérieure, 20157
In addition, in order to counter the loss of fibers during casting, the mix design team conducted a residual fiber test. Using hydrocloric acid to dissolve the cementitious materials and a sieve to remove the dry aggregates, the fiber was isolated from the mix and dried. As a result, only 55% of the fiber added to the mix is effective. The fiber proportions have consequently been weighted to take account of these losses. Table 6 shows the evolution of the characteristics of the final mixtures following dosage changes and the addition of materials not considered by the ANN. The score of the final mixes greatly improved due to good malleability, as well as lower density, CO2 emissions and cost. In addition, a shrinkage test carried out on a cut-away section did not show signs of cracking for both mixtures after 28 days. The characteristics presented in Table 6 exclude two types of primary reinforcements employed in the canoe. The Fiberglass reinforcement is composed of a GlasGrid® 8511™ grid and two V-ROD 150™ Fiberglass rebars. The grid was selected because of its strength, its openings promoting the adhesion to concrete and its flexibility facilitating placing. The reinforcement bars are advantageous because of their flexibility and their grip provided by an abrasive firmly anchored in the resin. ASTM C78 inspired ben-ding tests on composites and their ultimate resistance values were obtained at total rupture of specimens in the compression zone. Also, in order to verify the exact strength of concrete placed on the canoe, a cube casted in the same way as the canoe was made by the casting team and then cored to obtain 5 test specimens (ASTM C 42). These test specimens have shown a 12% increase in compressive strength at 14 days versus ASTM C 39 for same curing. The oven-dry density of the cored cylinders is slightly higher than the ASTM cylinders, but not significantly.
In sum, the major innovation of the year was undoubtedly, after two years of development, the use of a reliable mathematical modeling tool. This formulating assistant has generated two pre-optimized baseline mixes, and only after a single series of minor adjustments, they were selected to constitute the canoe. However, despite the efforts put towards adjusting the mixes to counteract shrinking, a cracking network developed throughout the canoe after 28 days. Despite the conclusive shrinkage tests carried out on a cut-away section, drying shrinkage would have caused cracking by a restriction in length effect on the canoe (Grzybowski, 1990). The concrete, being formulated only in function of mechanical stresses in compression, it should be able to resist internal ten-sile forces developed by constrained shrinkage (Kovler, 1994). Rigorous monitoring of the crack network on the canoe will help better understand this active phenomenon and will especially help measure the influence of the stress of competition on the development of cracks.
A major environmental shift marks the development and testing of Samba. The use of mathematical modeling has allowed the obtainment of optimal mixtures after only one level of optimization in laboratory compared to twelve for Savannah. The objective of a Volatile Organic Compound (VOC) free concrete was achieved through careful selection of ecological additives in terms of volatile organic emissions. A CO2 emission calculation was also performed on all generated mixtures and environmental performance influenced the choice of the final mixes by 10%. The total carbon dioxide footprint of Samba’s concrete was quantified at 1,25 tons of CO2 which will be compensated by an innovative method presented in the following section of the report. Sustainable deve-
lopment values and respect of the environment are now an integral part of the concrete design, starting with the choice of materials up to the final selection of the mixtures.
G: General Concrete Mixture; S: Structural Concrete MixtureConcrete mixture
14d F’c (MPa)
Unit weight (pcf)
Oven-Dry density (pcf) E (ksi) kg CO2/m
3 of mixture
kg VOC/m3 of mixture
solid polymer / CM (%)
Workability (%)
$CAD/m3 of mixture
Mix score
Standard ASTM C 39
ASTM C 138
ASTM C 567
ASTM C 469 - - - - - -
AimedG: 3,2 MPa
S: 4,2 MPaMin. Min. Min. Min. 0 15 >80 Min. Max.
ANN predicted Baseline (G) 3,7 5330 0 19 - 7620 83
ANN predicted Baseline (S) 4,9 4830 0 18 - 7740 79
Lab Validation Baseline (G) 4,1 689 550 0,4 5330 0 19 75 7620 74
Lab Validation Baseline (S) 4,6 711 560 0,4 4830 0 18 70 7740 69
Final Mix (G) 3,8 682 540 0,4 5150 0 15 95 7320 90
Final Mix (S) 4,3 700 550 0,4 4610 0 15 90 7380 88
Kanaloa Mix 9,7 790 760 2,4 7680 0 30 90 10980 53
Table 6 : Evolution of the Characteristics of Mixtures

École de technologie supérieure, 20158
For 3 years, the use of a male mold, cut out more precisely with a CNC, has become the specialty of the ÉTS. In order to obtain a more efficient canoe every year, in terms of quality, the team had to push the limits in order to find new innovations that would bring them at the head of the competition.Once the hull shape chosen by the analysis team, the construction of the male mold can be initiated. The necessary data is transferred to the CNC and once the transfer is com-plete, the 160 sections of extruded polystyrene (Styrofoam®) which will form the mold can be cut. This material was chosen because it consists of a good compromise between speed and accuracy when cutting the mold. The Styrofoam® sheets used contain manu-facturing defects and would otherwise be thrown out by the manufacturer. Also, this material has been donated by sponsors, having a value of $4 250, which makes it inex-pensive and doesn’t negatively impact our budget. On a leveled table prepared before-hand, the mold is assembled section by section with screws as shown on Figure 11. In order to correct minor imperfections, the mold is sanded with 120 grits. Inlays are then carved into the mold using a rotating head tool and by following the template form.
By using a 3D Handy Scan™, a new device loaned by Crea-form® for a year, it is possible to perform a 3D scan of the mold in order to compare it to the intended theoretical mold. The pro-cess begins by informingly placing 1 000 targets on the mold. Subsequently, the scan of the canoe is performed to generate the
3D plan in real time. Thereafter, it is necessary to correct all defaults that appeared during the scan (i.e.: thic-kness duplications). The last step is to overlay the 3D Handy Scan™ model to the CATIA® model and to create a colorimetry based on differences with the theoretical model, as shown on Figure 12.In preparation for casting, a matt varnish is applied on the mold to facilitate unmolding, followed by the application of wax. The grid (GlasGrid®8511™) is pre-cut to the shape of the canoe and the reinforcement bars Fiberglass V-ROD®150 #2 are cut to the correct length and placed in the gunwales of the mold. The bars are held in place at mid-height of the gunwales with nylon wires placed at one foot intervals passing through the mold and attached to blocks of wood on each side of the casting table. Concrete materials were prepared in 5 L batches to ensure fresh concrete only when needed. Two mixing teams allow optimal amounts of concrete at the appropriate times, therefore decreasing the waste of non-fresh concrete. An hour before the official start of casting, pigmented concrete is mixed and placed in the inlays to ensure a good seal between the inlay’s concrete and the canoe’s first layer of concrete. SBR latex solution is applied to the exposed surface of the pig-mented concrete a few minutes before the beginning of casting.Once the canoe is ready and each team member has their personal safety equip-ment, casting can officially begin. An important innovation, this year, is the use of two types of concrete for the construction of the canoe. The first layer comprises a structural mix placed on the inner bottom section of the canoe where compressive strength is greater and a general mix located on the remaining areas. Both types of concrete are applied with a thickness of 5,309 mm, starting by the center of the canoe and continuing toward both ends. The grid is placed and unrolled at the same rate as the concrete is placed. A new method has been adopted for the grid installation. It is cut and tied together at each foot as shown in Figure 13. Afterwards, it is attached to the reinforcement bar and, with the help of a wire passing through the table, the grid can be tightened from underneath, in order to match as closely as possible the shape of the mold (Figure 14). The second layer of concrete, consisting of only the general mix, is casted following the advancement of the mesh with a thickness of 7,079 mm as seen on Figure 15. The tips of the canoe are casted by stacking triangular female molds precut by the CNC.
CONSTRUCTION
Figure 11 : Mold Assembly
Figure 13: New Grid Placing Method
Figure 14 : New Grid TyingMethod
Figure 12 : Colorimetry

École de technologie supérieure, 20159
Throughout casting, quality control is assured by three experienced members. They are equipped with an instrument, shown in Figure 16, which is used to verify the thickness of the placed concrete. Once the canoe casting is completed, a polyethylene membrane is placed on the canoe and rubbed in place by hand and then with a trowel, which provides a better finishing surface. In total, the casting of the canoe lasted 2 hrs. 15min; an ideal duration to limit cold joints between layers of concrete. The curing method chosen for the canoe was two days of dry curing under a polyethylene membrane, followed by 12 days of water curing without polythene taken place in a humid curing room. When the treatment is completed, the canoe is transported to a sanding room designed with proper ventilation in order to be-gin the finishing phase of the canoe. While the canoe is still on the Styrofoam® mold, sanding takes place starting with 36 grits sandpaper and afterwards 120 grits sandpaper. During sanding, gages are used to control the thickness of the canoe. The next phase is the water polishing, incrementing grits ranging from 400 to 3000. The high grits polishing is carried out to obtain a smooth finish, but also because it improves the adhesion of stencils and stains to the concrete. Stages of sanding and polishing, which required 110 hours of work in 2014, are now executed in as little as 30 hours. The reason for this dramatic improvement is due to the use of concrete with a lower resistance than previous years, as well as the smoothing of a polyethylene membrane on the fresh concrete, thereby eliminating cavities in the concrete. Before proceeding to the staining phase, a 3D scan (Figure 17) must be repeated on the exterior of the canoe so it can be compared to the theoretical model and then obtain a colorimetry based on the differences with the theoretical model. Moreover, the 3D scan of the finished exterior concrete will be superimposed on the 3D scan of the mold to deter-mine the thickness of the canoe at any point. This extra step requires two people to scan the canoe and analyze the data which can take up to 20 hours. The canoe can then be carefully unmolded by removing the Styrofoam® sections. The interior of the canoe can then be finished using the same methods described above.The last step of construction is the embellishment of the canoe, which means applying stencils by hand and 6 different stain colors with an airbrush and paintbrushes, and finishing with two layers of VOC free Guardmax® sealer.
In order to understand the scope of the canoe’s environmental foot-print, a research was conducted to reveal the impact of the canoe’s construction cycle as well as its competition cycle. Calculations demonstrated that production of materials for the concrete emits 1,25 tons of CO2, building materials used for the canoe construc-tion emit 2,84 tons of CO2 and, ultimately, the team’s traveling for all three competitions emits 15,64 tons of CO2. These quantities are increased by 10% which brings the total at 21,71 tons of CO2. To reduce the environmental impact, the ÉTS team has approached the Fond de Dévelopment Durable de l’Association Étudiante de l’ÉTS (FDDAÉÉTS) and Compensation CO2 Québec™ and 120 trees are to be planted in the Centre-du-Québec region. The FD-DAÉÉTS will finance this specific project and a compensation cer-tificate will be submitted to the ÉTS team by the planting company.
With all the innovations brought to the canoe’s construction, along with its flamboyant design, Samba is gua-ranteed to turn heads during this year’s competition!
Figure 16 : New Thickness Verifying Gauge
Figure 17 : 3D Scanning of the Canoe
Figure 15 : Unrolling of Grid Followed by Second Layer of Concrete

École de technologie supérieure, 2015
10
PROJECT SCHEDULEID Name Duration Planned Start Planned Finish Actual Start Actual Finish
1 Start-Up Meeting 1 day Tue 14-09-09 Tue 14-09-09 Tue 14-09-09 Tue 14-09-092 2015 Rules and Regulations (ASCE) Publication 1 day Wed 14-09-10 Wed 14-09-10 Wed 14-09-10 Wed 14-09-103 2015 Rules and Regulations (CSCE) Publication 1 day Sun 14-09-21 Sun 14-09-21 Sun 14-09-21 Sun 14-09-214 Fundraising 177 days Wed 14-09-10 Mon 15-03-16 Wed 14-09-10 Mon 15-03-165 Recruitment 30 days Wed 14-09-10 Thu 14-10-09 Wed 14-09-10 Thu 14-10-096 Hull design 85 days Sun 13-09-15 Sun 14-01-05 Fri 14-10-10 Mon 15-01-127 Research 45 days Fri 14-09-19 Sun 14-11-02 Fri 14-10-10 Sun 14-11-238 Optimization of Parameterized File (Catia) 40 days Mon 14-11-03 Fri 14-12-12 Mon 14-11-24 Mon 15-01-129 Final Shape Selection 0 days Fri 14-12-12 Fri 14-12-12 Mon 15-01-12 Mon 15-01-1210 Concrete Mix design 145 days Wed 14-01-29 Mon 15-01-26 Wed 14-09-10 Thu 15-02-1211 Research 112 days Fri 14-09-19 Wed 15-01-21 Sat 14-09-27 Tue 15-01-2712 Inventory and Materials Procurement 17 days Fri 14-09-19 Mon 14-10-13 Wed 14-09-10 Fri 14-09-2613 Preliminary Design and Testing 85 days Sat 14-10-04 Fri 15-01-02 Thu 14-09-25 Thu 14-12-1814 Artificial Neural Network 11 days Sat 15-01-03 Tue 15-01-13 Fri 14-12-19 Thu 15-01-0815 Validation of the ANN 10 days Sat 15-01-17 Thu 15-01-29 Fri 15-01-09 Sun 15-01-1816 Mix Design Refinement 14 days Sat 15-01-03 Fri 15-01-16 Wed 15-01-28 Tue 15-02-1017 Reinforcement Testing 13 days Sat 15-01-03 Thu 15-01-15 Wed 15-01-28 Mon 15-02-0918 Final Mix Selection 0 days Wed 15-01-21 Wed 15-01-21 Tue 15-02-10 Tue 15-02-1019 Pre-Weight of the Batches 2 days Thu 15-01-22 Mon 15-01-26 Wed 15-02-11 Thu 15-02-1220 Structural Analysis 131 days Fri 13-11-01 Tue 14-01-28 Mon 14-09-22 Tue 15-02-1021 Research and Program Development 50 days Mon 14-09-22 Mon 14-11-10 Mon 14-09-22 Mon 14-11-1022 2D Analysis 10 days Sat 15-01-03 Mon 15-01-12 Sat 15-01-03 Mon 15-01-1223 Completion of 2D Analysis 0 days Tue 15-02-10 Tue 15-02-10 Tue 15-02-10 Tue 15-02-1024 Construction 154 days Tue 13-10-15 Fri 14-04-04 Sun 14-10-19 Wed 15-04-0125 Safety Formation 1 day Sat 14-10-18 Sat 14-10-18 Sun 14-10-19 Sun 14-10-1926 Improve CNC Procedure 61 days Sun 14-10-19 Thu 14-12-18 Sun 14-10-19 Thu 14-12-1827 Transformation of Code for CNC 3 days Mon 14-12-15 Wed 14-12-17 Wed 15-02-11 Fri 15-02-1328 Canoe Construction Formation 3 days Tue 15-01-06 Tue 15-01-13 Fri 15-01-09 Sun 15-01-1129 Assembly of the Mold 6 days Mon 15-01-12 Sat 14-12-20 Sat 15-02-14 Thu 15-02-1930 Casting of the Canoe 1 day Sun 15-02-08 Sun 15-02-08 Fri 15-02-20 Fri 15-02-2031 Concrete Curing 14 days Mon 15-02-09 Sun 15-02-22 Sat 15-02-21 Fri 15-03-0632 Unmolding, Sanding and water polishing 26 days Mon 15-02-23 Fri 15-02-27 Sat 15-03-07 Wed 15-04-0133 Aesthetics 207 days Sun 14-09-21 Mon 15-03-30 Wed 14-09-10 Wed 15-04-1534 Theme Choice and Development 52 days Sun 14-09-21 Tue 14-11-04 Wed 14-09-10 Fri 14-10-3135 Product Display and Display Stand 144 days Wed 14-11-05 Sat 15-04-04 Sat 14-11-01 Sat 15-04-0436 Cutaway Section 35 days Sun 15-02-08 Fri 15-03-20 Fri 15-02-20 Thu 15-03-2637 Canoe Staining 4 days Sat 15-03-21 Thu 15-04-02 Thu 15-04-02 Sun 15-04-0538 Sealant Application and Water Polishing 10 days Fri 15-04-03 Sun 15-04-12 Mon 15-04-06 Wed 15-04-1539 Completion of the Canoe 0 days Mon 15-03-30 Mon 15-03-30 Wed 15-04-15 Wed 15-04-1540 Academics 96 days Sun 14-09-21 Thu 15-01-29 Sun 15-01-04 Fri 15-04-1041 Design Paper 82 days Mon 14-12-15 Sat 15-03-07 Sun 15-01-04 Fri 15-03-2742 Oral Presentation Script 6 days Sat 15-03-14 Tue 15-03-31 Sat 15-03-14 Thu 15-03-1943 Oral Presentation Video 35 days Thu 15-02-26 Sat 15-04-04 Thu 15-02-26 Wed 15-04-0144 Oral Presentation Practices 22 days Sun 15-03-22 Tue 15-04-14 Fri 15-03-20 Fri 15-04-1045 Engineer's Notebook 40 days Sun 15-02-01 Sun 15-03-22 Sat 15-02-07 Wed 15-03-1846 Mailing of Design Paper and Engineer's Notebook 0 days Wed 15-03-25 Wed 15-03-25 Fri 15-03-27 Fri 15-03-2747 Paddling 204 days Fri 14-09-19 Sat 15-05-02 Wed 14-09-10 Sun 15-04-1248 Outside Practices 63 days Mon 14-09-08 Thu 14-11-20 Wed 14-09-10 Tue 14-11-1149 Indoor Basin Training 126 days Fri 14-11-21 Thu 15-03-26 Wed 14-11-12 Sat 15-03-2850 Inside Gym Training 126 days Fri 14-11-21 Thu 15-03-26 Wed 14-11-12 Sat 15-03-2851 Final Paddler Selection 0 days Thu 15-03-26 Thu 15-03-26 Sat 15-03-28 Sat 15-03-2852 Outside Practices 10 days Sat 15-03-28 Sun 15-04-12 Fri 15-04-03 Sun 15-04-1253 Competitions 68 days NA NA Thu 15‐04‐16 Mon 15‐06‐2254 ASCE Competition WestPoint 3 days Thu 15-04-16 Sat 15-04-18 Thu 15-04-16 Sat 15-04-1855 CNCCC Competition Toronto 3 days Fri 15-05-08 Fri 15-04-10 Fri 15-05-08 Sun 15-05-1056 ASCE Competition WestPoint 3 days Sat 15‐06‐20 Mon 15‐06‐22 Sat 15‐06‐20 Mon 15‐06‐22
09‐0909‐10
01‐12
02‐10
02‐10
04‐15
03‐27
03‐28
04‐1805‐10
06‐22
31 07 14 21 28 05 12 19 26 02 09 16 23 30 07 14 21 28 04 11 18 25 01 08 15 22 01 08 15 22 29 05 12 19 26 03 10 17 24 31 07 14 21 28 0'14 Sep '14 Oct '14 Nov '14 Dec '15 Jan '15 Feb '15 Mar '15 Apr '15 May '15 Jun '15
Fractionnement critique
Critical Fractioning
Task
Milestone
Summary
Critical Task
Baseline
Critique


École de technologie supérieure, 2015
DESIGN DRAWING
11

École de technologie supérieure, 2015
APPENDIX A - REFERENCES
Alshiri, M.M., Azmy, A.M., El-Bisy, M.S., Neural networks for predicting compressive strength of structural light weight concrete, Construction and Building Materials, 23 (2009) 2214-2219.
Afridi, M.U.K et al (2003). “Development of polymer films by the coalescence of polymer particles in powde-red and aqueous polymer-modified mortars.” Cement and Concrete Research. 33, 1715-1721.
ASCE/NCCC (2013). “2014 American Society of Civil Engineers National Concrete Canoe Competi-tion: Rules and Regulations.” <http://www.asce.org/uploadedFiles/Concrete_Canoe/Rules_and_Regula-tions/2014%20ASCE%20NCCC%20Rules%20and%20Regulations.pdf> (Sept. 6, 2013).
ASCE (2014). “Quick Guide to Common Types of Referenced Material.” Quick Guide to Common Types of Referenced material, <http://www.asce.org/Audience/Authors,--Editors/Books/General-Book- Information/Quick-Guide-to-Common-Types-of-Referenced-Material/> (Mar. 1, 2014).
ASCE (2014). “Author-Date References» Author-Date References, <http://www.asce.org/Audience/Authors,--Editors/Books/General-Book-Information/Author-Date-References/> (Mar. 1 2014).
ASTM (2012). “Standard Practice for Making and Curing Concrete Test Specimens in the Field” C31-C31M-12 West Conshohocken, PA.
ASTM (2013). “Standard Specification for Concrete Aggregates.” C33/ C33M-13, West Conshohocken, PA.
ASTM (2014). “Standard Test Method for Compressive Strength of Cylindrical Concrete Specimens.” C39/ C39M-14a, West Conshohocken, PA.
ASTM (2013). “Standard Test Method for Obtaining and Testing Drilled Cores and Sawed Beams of Concrete” C42 / C42M-13 West Conshohocken, PA.
ASTM (2010). “Standard Test Method for Flexural Strength of Concrete (Using Simple Beam with Third-Point Loading).” C78/C78M-10e1, West Conshohocken, PA.
ASTM (2014). “Standard Terminology Relating to Concrete and Concrete Aggregates.” C125-14, West Conshohocken, PA.
ASTM (2014). “Standard Test Method for Density (Unit Weight), Yield, and Air Content (Gravimetric) of Concrete.” C138/C138M-14, West Conshohocken, PA.
ASTM (2012). “Standard Test Method for Slump of Hydraulic-Cement Concrete” C143/C143M – 12, West Conshohocken, PA.
ASTM (2012). “Standard Specification for Portland Cement.” C150/C150M-12, West Conshohocken, PA.
ASTM (2014). “Standard Practice for Making and Curing Concrete Test Specimens in the Laboratory.” C192/C192M-14, West Conshohocken, PA.
ASTM (2014). “Standard Test Method for Static Modulus of Elasticity and Poisson’s Ratio of Concrete in Compression.” C469/C469-14, West Conshohocken, PA.
ASTM (2013). “Standard Specification for Chemical Admixtures for Concrete.” C494/C494M-13, West Conshohocken, PA.
ASTM (2011). “Standard Test Method for Splitting Tensile Strength of Cylindrical Concrete Specimens.” C496/C496M-11, West Conshohocken, PA.
A1

École de technologie supérieure, 2015
ASTM (2014). “Standard Test Method for Determining Density of Structural Lightweight Concrete.” C567 / C567M-14, West Conshohocken, PA.
ASTM (2009). “Standard Test Method for Flexural Properties of Thin-Section Glass-Fiber-Reinforced Concrete (Using Simple Beam With Third-Point Loading)” C947 – 03, West Conshohocken, PA.
ASTM (2010). “Standard Specification for Pigments for Integrally Colored Concrete”, C979 / C979M-10, West Conshohocken, PA.
ASTM (2014). “Standard Specification for Slag Cement for Use in Concrete and Mortars.” C989/C989M-14, West Conshohocken, PA.
ASTM (2010). “Standard Specification for Fiber-Reinforced Concrete.” C1116/C1116M-10a, West Consho-hocken, PA.
ASTM (2013). “Standard Specification for Latex and Powder Polymer Modifiers for Hydraulic Cement Concrete and Mortar.” C1438-13, West Conshohocken, PA.
Baykasoglu A. et al. (2009). “Prediction and multi-objective optimization of high strength concrete parameters via soft computing approaches.” Expert Systems with Applications, 36, 6145-6155.
Bilim, C., Atiş, C.D., Tanyildizi, H., Karahan, O., Predicting the compressive strength of ground granulated blast furnace slag concrete using artificial neural network, Advances in Engineering Software, 40 (2009) 334-340.
Boukhatem B. et al (2011). “Application of new information technology on concrete: An overview.” Journal of civil engineering and management. 17,248-258.
Cement Association of Canada (CAC) (2005). “Concrete Design Handbook: Third Edition.” Ottawa, Canada.
De Lyra, P. (2013). <https://500px.com/photo/52282576/rio-by-priscila-de-lyra/> (Jan. 13 2014)ETS Concrete Canoe Team (2009). “Vintage Design Paper”, NCCC Design Paper, Montreal, QC.
ETS Concrete Canoe Team (2010). “Montferrand Design Paper”, NCCC Design Paper, Montreal, QC.
ETS Concrete Canoe Team (2011). “Turning Point Design Paper”, NCCC Design Paper, Montreal, QC.
ETS Concrete Canoe Team (2012). “Grand Prix Design Paper”, NCCC Design Paper, Montreal, QC.
ETS Concrete Canoe Team (2013). “Savannah Design Paper”, NCCC Design Paper, Montreal, QC.
ETS Concrete Canoe Team (2014). “Kanaloa Design Paper”, NCCC Design Paper, Montreal, QC.
Grishin, A. (2014). < https://500px.com/photo/69562267/tropical-island-at-sunset-by-alexander-grishin/> (Jan. 13 2014)Grzybowski, Miroslaw. and P. Shah, Surendra., Shrinkage Cracking of Fiber Reinforced Concrete, Materials Journal, 1990, 87, 138-148.
Japan Society of Civil Engineers. (2005). «Recommendation on Environmental Performance Verification for Concrete Structures (Draft).» Concrete Library 125.
John Winters (N.D) “The Shape of the Canoe” Part 1: Frictional Resistance <http://www.greenval.com/shape_part1.html> (Sept 22, 2013).
A2

École de technologie supérieure, 2015
Kalyanmoy, D. (2009). “Multi-Objective Optimization Using Evolutionary Algorithms.” Wiley, Chichester, U.K.
Kardon, J.B. (1997). “Polymer-modified concrete: Review.” Journal of Materials in civil Engineering. 9, 85-92.
Kosmatka, S.H., Kerkhoff, B., Hooton, D., McGrath, R.J., Dosage et Contrôle des Mélanges de Béton, EB101, 8th edition, Association Canadienne du Ciment, Ottawa, 2011.
KOVLER, K., Testing system for determining the mechanical behaviour of early age concrete under restrained and free uniaxial shrinkage, Materials and Structures, 1994, 27, 324-330.
Lim C.H. et al (2004). “Genetic algorithm in mix proportioning of high-performance concrete”. Cement and Concrete Research. 34,409-420.
National Research Council Canada (NRCC) (2010). “National Building Code of Canada.” Ottawa, Canada.
Ohama, Y. and Kari, S. (1982). “Effects of specimen size on strength and drying shrinkage of polymer-modi-fied concrete.” International Journal of Cement Composites and Lightweight Concrete. 4,209-233.
Ohama, Y. (1995). “Handbook of polymer-modified concrete and mortars.” Noyes Publication. Mill Road, Park ridge, NJ.
Oztas A. et al (2006). “Predicting the compressive strength and slump of high strength concrete using neural network.” Construction and building material, 20,769-775.
Paradis, F. and Gendron, G. (2007). “Structural modeling and testing of a concrete canoe.” Ocean Engineering, 34, 206-217.
Ramakrishnan, V. (1992). “Latex-modified Concretes and Mortars” National Cooperative Highway Research Program. Washington D.C.
Rawson, K.J. and Tupper, E. C. (1983). “Basic Ship Theory: Volume 1 Third Edition.” Wiley, New-York, NY.
Rawson, K.J. and Tupper, E. C. (1984). “Basic Ship Theory: Volume 2 Third Edition.” Wiley, New-York, NY.
Sobhani, J., Najimi, M., Pourkhorshidi, A.R., Parhizkar, T., Prediction of the compressive strength of no-slump concrete: A comparative study of regression, neural network and ANFIS models, Construction and Building Materials, 24 (2010) 709-718.
Yao, S. and Ge, Y. (2012). “Effect of Styrene Rubber Latex on Mortar and Concrete Properties.” Advanced Engineering Forum. 5,283-288.Grishin, A. (2013). < https://500px.com/photo/69562267/tropical-island-at-sunset-by-alexander-grishin/> (Jan. 13 2014).
A3
École de technologie supérieure, 2015
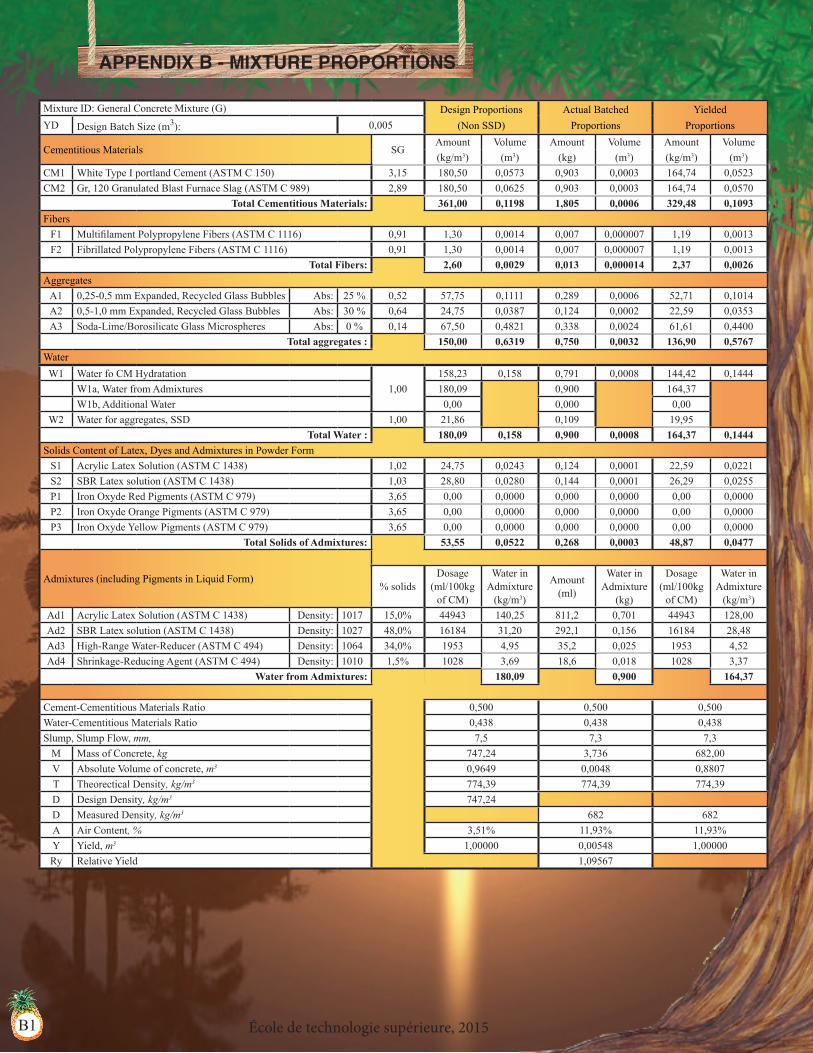
Mixture ID: General Concrete Mixture (G) Design Proportions (Non SSD)
Actual BatchedProportions
YieldedProportionsYD Design Batch Size (m3): 0,005
Cementitious Materials SGAmount Volume Amount Volume Amount Volume(kg/m3) (m3) (kg) (m3) (kg/m3) (m3)
CM1 White Type I portland Cement (ASTM C 150) 3,15 180,50 0,0573 0,903 0,0003 164,74 0,0523CM2 Gr, 120 Granulated Blast Furnace Slag (ASTM C 989) 2,89 180,50 0,0625 0,903 0,0003 164,74 0,0570
Total Cementitious Materials: 361,00 0,1198 1,805 0,0006 329,48 0,1093Fibers
F1 Multifilament Polypropylene Fibers (ASTM C 1116) 0,91 1,30 0,0014 0,007 0,000007 1,19 0,0013F2 Fibrillated Polypropylene Fibers (ASTM C 1116) 0,91 1,30 0,0014 0,007 0,000007 1,19 0,0013
Total Fibers: 2,60 0,0029 0,013 0,000014 2,37 0,0026Aggregates
A1 0,25-0,5 mm Expanded, Recycled Glass Bubbles Abs: 25 % 0,52 57,75 0,1111 0,289 0,0006 52,71 0,1014A2 0,5-1,0 mm Expanded, Recycled Glass Bubbles Abs: 30 % 0,64 24,75 0,0387 0,124 0,0002 22,59 0,0353A3 Soda-Lime/Borosilicate Glass Microspheres Abs: 0 % 0,14 67,50 0,4821 0,338 0,0024 61,61 0,4400
Total aggregates : 150,00 0,6319 0,750 0,0032 136,90 0,5767Water
APPENDIX B - MIXTURE PROPORTIONS
B1
W1 Water fo CM Hydratation1,00
158,23 0,158 0,791 0,0008 144,42 0,1444W1a, Water from Admixtures 180,09 0,900 164,37W1b, Additional Water 0,00 0,000 0,00
W2 Water for aggregates, SSD 1,00 21,86 0,109 19,95Total Water : 180,09 0,158 0,900 0,0008 164,37 0,1444
Solids Content of Latex, Dyes and Admixtures in Powder FormS1 Acrylic Latex Solution (ASTM C 1438) 1,02 24,75 0,0243 0,124 0,0001 22,59 0,0221S2 SBR Latex solution (ASTM C 1438) 1,03 28,80 0,0280 0,144 0,0001 26,29 0,0255P1 Iron Oxyde Red Pigments (ASTM C 979) 3,65 0,00 0,0000 0,000 0,0000 0,00 0,0000P2 Iron Oxyde Orange Pigments (ASTM C 979) 3,65 0,00 0,0000 0,000 0,0000 0,00 0,0000P3 Iron Oxyde Yellow Pigments (ASTM C 979) 3,65 0,00 0,0000 0,000 0,0000 0,00 0,0000
Total Solids of Admixtures: 53,55 0,0522 0,268 0,0003 48,87 0,0477
Admixtures (including Pigments in Liquid Form)% solids
Dosage (ml/100kg
of CM)
Water in Admixture
(kg/m3)
Amount (ml)
Water in Admixture
(kg)
Dosage (ml/100kg
of CM)
Water in Admixture
(kg/m3)Ad1 Acrylic Latex Solution (ASTM C 1438) Density: 1017 15,0% 44943 140,25 811,2 0,701 44943 128,00Ad2 SBR Latex solution (ASTM C 1438) Density: 1027 48,0% 16184 31,20 292,1 0,156 16184 28,48Ad3 High-Range Water-Reducer (ASTM C 494) Density: 1064 34,0% 1953 4,95 35,2 0,025 1953 4,52Ad4 Shrinkage-Reducing Agent (ASTM C 494) Density: 1010 1,5% 1028 3,69 18,6 0,018 1028 3,37
Water from Admixtures: 180,09 0,900 164,37
Cement-Cementitious Materials Ratio 0,500 0,500 0,500Water-Cementitious Materials Ratio 0,438 0,438 0,438Slump, Slump Flow, mm, 7,5 7,3 7,3
M Mass of Concrete, kg 747,24 3,736 682,00V Absolute Volume of concrete, m3 0,9649 0,0048 0,8807T Theorectical Density, kg/m3 774,39 774,39 774,39D Design Density, kg/m3 747,24D Measured Density, kg/m3 682 682A Air Content, % 3,51% 11,93% 11,93%Y Yield, m3 1,00000 0,00548 1,00000Ry Relative Yield 1,09567
École de technologie supérieure, 2015
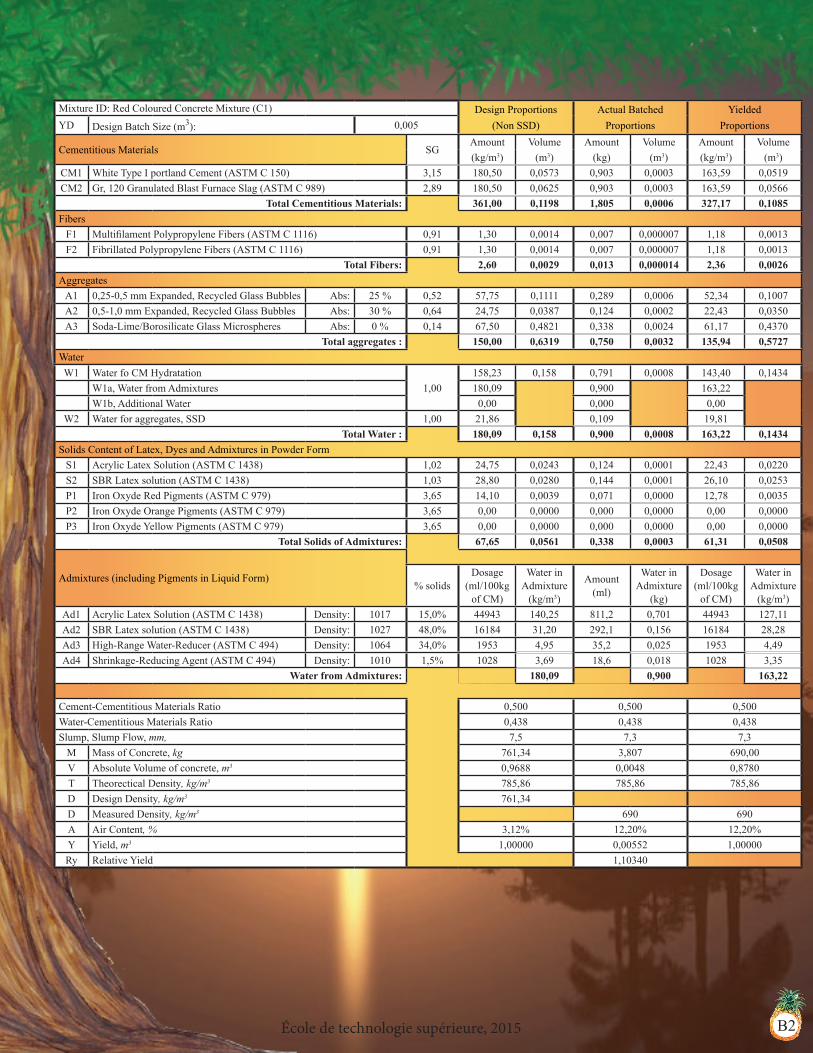
Mixture ID: Red Coloured Concrete Mixture (C1) Design Proportions (Non SSD)
Actual BatchedProportions
YieldedProportionsYD Design Batch Size (m3): 0,005
Cementitious Materials SGAmount Volume Amount Volume Amount Volume(kg/m3) (m3) (kg) (m3) (kg/m3) (m3)
CM1 White Type I portland Cement (ASTM C 150) 3,15 180,50 0,0573 0,903 0,0003 163,59 0,0519CM2 Gr, 120 Granulated Blast Furnace Slag (ASTM C 989) 2,89 180,50 0,0625 0,903 0,0003 163,59 0,0566
Total Cementitious Materials: 361,00 0,1198 1,805 0,0006 327,17 0,1085Fibers
F1 Multifilament Polypropylene Fibers (ASTM C 1116) 0,91 1,30 0,0014 0,007 0,000007 1,18 0,0013F2 Fibrillated Polypropylene Fibers (ASTM C 1116) 0,91 1,30 0,0014 0,007 0,000007 1,18 0,0013
Total Fibers: 2,60 0,0029 0,013 0,000014 2,36 0,0026Aggregates
A1 0,25-0,5 mm Expanded, Recycled Glass Bubbles Abs: 25 % 0,52 57,75 0,1111 0,289 0,0006 52,34 0,1007A2 0,5-1,0 mm Expanded, Recycled Glass Bubbles Abs: 30 % 0,64 24,75 0,0387 0,124 0,0002 22,43 0,0350A3 Soda-Lime/Borosilicate Glass Microspheres Abs: 0 % 0,14 67,50 0,4821 0,338 0,0024 61,17 0,4370
Total aggregates : 150,00 0,6319 0,750 0,0032 135,94 0,5727Water
B2
W1 Water fo CM Hydratation1,00
158,23 0,158 0,791 0,0008 143,40 0,1434W1a, Water from Admixtures 180,09 0,900 163,22W1b, Additional Water 0,00 0,000 0,00
W2 Water for aggregates, SSD 1,00 21,86 0,109 19,81Total Water : 180,09 0,158 0,900 0,0008 163,22 0,1434
Solids Content of Latex, Dyes and Admixtures in Powder FormS1 Acrylic Latex Solution (ASTM C 1438) 1,02 24,75 0,0243 0,124 0,0001 22,43 0,0220S2 SBR Latex solution (ASTM C 1438) 1,03 28,80 0,0280 0,144 0,0001 26,10 0,0253P1 Iron Oxyde Red Pigments (ASTM C 979) 3,65 14,10 0,0039 0,071 0,0000 12,78 0,0035P2 Iron Oxyde Orange Pigments (ASTM C 979) 3,65 0,00 0,0000 0,000 0,0000 0,00 0,0000P3 Iron Oxyde Yellow Pigments (ASTM C 979) 3,65 0,00 0,0000 0,000 0,0000 0,00 0,0000
Total Solids of Admixtures: 67,65 0,0561 0,338 0,0003 61,31 0,0508
Admixtures (including Pigments in Liquid Form)% solids
Dosage (ml/100kg
of CM)
Water in Admixture
(kg/m3)
Amount (ml)
Water in Admixture
(kg)
Dosage (ml/100kg
of CM)
Water in Admixture
(kg/m3)Ad1 Acrylic Latex Solution (ASTM C 1438) Density: 1017 15,0% 44943 140,25 811,2 0,701 44943 127,11Ad2 SBR Latex solution (ASTM C 1438) Density: 1027 48,0% 16184 31,20 292,1 0,156 16184 28,28Ad3 High-Range Water-Reducer (ASTM C 494) Density: 1064 34,0% 1953 4,95 35,2 0,025 1953 4,49Ad4 Shrinkage-Reducing Agent (ASTM C 494) Density: 1010 1,5% 1028 3,69 18,6 0,018 1028 3,35
Water from Admixtures: 180,09 0,900 163,22
Cement-Cementitious Materials Ratio 0,500 0,500 0,500Water-Cementitious Materials Ratio 0,438 0,438 0,438Slump, Slump Flow, mm, 7,5 7,3 7,3
M Mass of Concrete, kg 761,34 3,807 690,00V Absolute Volume of concrete, m3 0,9688 0,0048 0,8780T Theorectical Density, kg/m3 785,86 785,86 785,86D Design Density, kg/m3 761,34D Measured Density, kg/m3 690 690A Air Content, % 3,12% 12,20% 12,20%Y Yield, m3 1,00000 0,00552 1,00000Ry Relative Yield 1,10340

École de technologie supérieure, 2015
Mixture ID: Orange Coloured Concrete Mixture (C2) Design Proportions (Non SSD)
Actual BatchedProportions
YieldedProportionsYD Design Batch Size (m3): 0,005
Cementitious Materials SGAmount Volume Amount Volume Amount Volume(kg/m3) (m3) (kg) (m3) (kg/m3) (m3)
CM1 White Type I portland Cement (ASTM C 150) 3,15 180,50 0,0573 0,903 0,0003 162,91 0,0517CM2 Gr, 120 Granulated Blast Furnace Slag (ASTM C 989) 2,89 180,50 0,0625 0,903 0,0003 162,91 0,0564
Total Cementitious Materials: 361,00 0,1198 1,805 0,0006 325,82 0,1081FibersF1 Multifilament Polypropylene Fibers (ASTM C 1116) 0,91 1,30 0,0014 0,007 0,000007 1,17 0,0013F2 Fibrillated Polypropylene Fibers (ASTM C 1116) 0,91 1,30 0,0014 0,007 0,000007 1,17 0,0013
Total Fibers: 2,60 0,0029 0,013 0,000014 2,35 0,0026AggregatesA1 0,25-0,5 mm Expanded, Recycled Glass Bubbles Abs: 25,0% 0,52 57,75 0,1111 0,289 0,0006 52,12 0,1002A2 0,5-1,0 mm Expanded, Recycled Glass Bubbles Abs: 30,0% 0,64 24,75 0,0387 0,124 0,0002 22,34 0,0349A3 Soda-Lime/Borosilicate Glass Microspheres Abs: 0,0% 0,14 67,50 0,4821 0,338 0,0024 60,92 0,4352
Total aggregates : 150,00 0,6319 0,750 0,0032 135,38 0,5703Water
B3
W1 Water fo CM Hydratation1,00
158,23 0,158 0,791 0,0008 142,81 0,1428W1a, Water from Admixtures 180,09 0,900 162,55W1b, Additional Water 0,00 0,000 0,00
W2 Water for aggregates, SSD 1,00 21,86 0,109 19,73Total Water : 180,09 0,158 0,900 0,0008 162,55 0,1428
Solids Content of Latex, Dyes and Admixtures in Powder FormS1 Acrylic Latex Solution (ASTM C 1438) 1,02 24,75 0,0243 0,124 0,0001 22,34 0,0219S2 SBR Latex solution (ASTM C 1438) 1,03 28,80 0,0280 0,144 0,0001 25,99 0,0252P1 Iron Oxyde Red Pigments (ASTM C 979) 3,65 0,00 0,0000 0,000 0,0000 0,00 0,0000P2 Iron Oxyde Orange Pigments (ASTM C 979) 3,65 10,60 0,0029 0,053 0,0000 9,57 0,0026P3 Iron Oxyde Yellow Pigments (ASTM C 979) 3,65 0,00 0,0000 0,000 0,0000 0,00 0,0000
Total Solids of Admixtures: 64,15 0,0551 0,321 0,0003 57,90 0,0498
Admixtures (including Pigments in Liquid Form)% solids
Dosage (ml/100kg
of CM)
Water in Admixture
(kg/m3)
Amount (ml)
Water in Admixture
(kg)
Dosage (ml/100kg
of CM)
Water in Admixture
(kg/m3)Ad1 Acrylic Latex Solution (ASTM C 1438) Density: 1017 15,0% 44943 140,25 811,2 0,701 44943 126,58Ad2 SBR Latex solution (ASTM C 1438) Density: 1027 48,0% 16184 31,20 292,1 0,156 16184 28,16Ad3 High-Range Water-Reducer (ASTM C 494) Density: 1064 34,0% 1953 4,95 35,2 0,025 1953 4,47Ad4 Shrinkage-Reducing Agent (ASTM C 494) Density: 1010 1,5% 1028 3,69 18,6 0,018 1028 3,33
Water from Admixtures: 180,09 0,900 162,55
Cement-Cementitious Materials Ratio 0,500 0,500 0,500Water-Cementitious Materials Ratio 0,438 0,438 0,438Slump, Slump Flow, mm, 7,5 7,3 7,3M Mass of Concrete, kg 757,84 3,789 684,00V Absolute Volume of concrete, m3 0,9678 0,0048 0,8735T Theorectical Density, kg/m3 783,02 783,02 783,02D Design Density, kg/m3 757,84D Measured Density, kg/m3 684 684A Air Content, % 3,22% 12,65% 12,65%Y Yield, m3 1,00000 0,00554 1,00000Ry Relative Yield 1,10796

École de technologie supérieure, 2015
Mixture ID: Yellow Coloured Concrete Mixture (C3) Design Proportions (Non SSD)
Actual BatchedProportions
YieldedProportionsYD Design Batch Size (m3): 0,005
Cementitious Materials SGAmount Volume Amount Volume Amount Volume(kg/m3) (m3) (kg) (m3) (kg/m3) (m3)
CM1 White Type I Portland Cement (ASTM C 150) 3,15 180,50 0,0573 0,903 0,0003 163,41 0,0519CM2 Gr, 120 Granulated Blast Furnace Slag (ASTM C 989) 2,89 180,50 0,0625 0,903 0,0003 163,41 0,0565
Total Cementitious Materials: 361,00 0,1198 1,805 0,0006 326,82 0,1084Fibers
F1 Multifilament Polypropylene Fibers (ASTM C 1116) 0,91 1,30 0,0014 0,007 0,000007 1,18 0,0013F2 Fibrillated Polypropylene Fibers (ASTM C 1116) 0,91 1,30 0,0014 0,007 0,000007 1,18 0,0013
Total Fibers: 2,60 0,0029 0,013 0,000014 2,35 0,0026Aggregates
A1 0,25-0,5 mm Expanded, Recycled Glass Bubbles Abs: 25,0% 0,52 57,75 0,1111 0,289 0,0006 52,28 0,1005A2 0,5-1,0 mm Expanded, Recycled Glass Bubbles Abs: 30,0% 0,64 24,75 0,0387 0,124 0,0002 22,41 0,0350A3 Soda-Lime/Borosilicate Glass Microspheres Abs: 0,0% 0,14 67,50 0,4821 0,338 0,0024 61,11 0,4365
Total aggregates : 150,00 0,6319 0,750 0,0032 135,80 0,5720Water
B4
W1 Water fo CM Hydratation1,00
158,23 0,158 0,791 0,0008 143,25 0,1432W1a, Water from Admixtures 180,09 0,900 163,04W1b, Additional Water 0,00 0,000 0,00
W2 Water for aggregates, SSD 1,00 21,86 0,109 19,79Total Water : 180,09 0,158 0,900 0,0008 163,04 0,1432
Solids Content of Latex, Dyes and Admixtures in Powder FormS1 Acrylic Latex Solution (ASTM C 1438) 1,02 24,75 0,0243 0,124 0,0001 22,41 0,0220S2 SBR Latex solution (ASTM C 1438) 1,03 28,80 0,0280 0,144 0,0001 26,07 0,0253P1 Iron Oxyde Red Pigments (ASTM C 979) 3,65 0,00 0,0000 0,000 0,0000 0,00 0,0000P2 Iron Oxyde Orange Pigments (ASTM C 979) 3,65 3,50 0,0010 0,018 0,0000 3,17 0,0009P3 Iron Oxyde Yellow Pigments (ASTM C 979) 3,65 7,00 0,0019 0,035 0,0000 6,34 0,0017
Total Solids of Admixtures: 64,05 0,0551 0,320 0,0003 57,99 0,0499
Admixtures (including Pigments in Liquid Form)% solids
Dosage (ml/100kg
of CM)
Water in Admixture
(kg/m3)
Amount (ml)
Water in Admixture
(kg)
Dosage (ml/100kg
of CM)
Water in Admixture
(kg/m3)Ad1 Acrylic Latex Solution (ASTM C 1438) Density: 1017 15,0% 44943 140,25 811,2 0,701 44943 126,97Ad2 SBR Latex solution (ASTM C 1438) Density: 1027 48,0% 16184 31,20 292,1 0,156 16184 28,25Ad3 High-Range Water-Reducer (ASTM C 494) Density: 1064 34,0% 1953 4,95 35,2 0,025 1953 4,48Ad4 Shrinkage-Reducing Agent (ASTM C 494) Density: 1010 1,5% 1028 3,69 18,6 0,018 1028 3,34
Water from Admixtures: 180,09 0,900 163,04
Cement-Cementitious Materials Ratio 0,500 0,500 0,500Water-Cementitious Materials Ratio 0,438 0,438 0,438Slump, Slump Flow, mm, 7,5 7,3 7,3
M Mass of Concrete, kg 757,74 3,789 686,00V Absolute Volume of concrete, m3 0,9678 0,0048 0,8762T Theorectical Density, kg/m3 782,94 782,94 782,94D Design Density, kg/m3 757,74D Measured Density, kg/m3 686 686A Air Content, % 3,22% 12,38% 12,38%Y Yield, m3 1,00000 0,00552 1,00000Ry Relative Yield 1,10458

École de technologie supérieure, 2015
Mixture ID: Structural Concrete Mixture (S) Design Proportions (Non SSD)
Actual BatchedProportions
YieldedProportionsYD Design Batch Size (m3): 0,005
Cementitious Materials SGAmount Volume Amount Volume Amount Volume(kg/m3) (m3) (kg) (m3) (kg/m3) (m3)
CM1 White Type I Portland Cement (ASTM C 150) 3,15 130,75 0,0415 0,654 0,0002 129,82 0,0412CM2 Gr, 120 Granulated Blast Furnace Slag (ASTM C 989) 2,89 177,50 0,0614 0,888 0,0003 176,24 0,0610
Total Cementitious Materials: 308,25 0,1029 1,541 0,0005 306,07 0,1022Fibers
F1 Multifilament Polypropylene Fibers (ASTM C 1116) 0,91 1,30 0,0014 0,007 0,000007 1,29 0,0014F2 Fibrillated Polypropylene Fibers (ASTM C 1116) 0,91 1,30 0,0014 0,007 0,000007 1,29 0,0014
Total Fibers: 2,60 0,0029 0,013 0,000014 2,58 0,0028Aggregates
A1 0,25-0,5 mm Expanded, Recycled Glass Bubbles Abs: 25,0% 0,52 19,50 0,0375 0,098 0,0002 19,36 0,0372
A2 0,5-1,0 mm Expanded, Recycled Glass Bubbles Abs: 30,0% 0,64 78,50 0,1227 0,393 0,0006 77,94 0,1218A3 Soda-Lime/Borosilicate Glass Microspheres Abs: 0,0% 0,14 62,50 0,4464 0,313 0,0022 62,06 0,4433
Total aggregates : 160,50 0,6066 0,803 0,0030 159,36 0,6023Water
B5
W1 Water fo CM Hydratation1,00
159,92 0,160 0,800 0,0008 158,79 0,1588W1a, Water from Admixtures 188,34 0,942 187,01W1b, Additional Water 0,00 0,000 0,00
W2 Water for aggregates, SSD 1,00 28,43 0,142 28,22Total Water : 188,34 0,160 0,942 0,0008 187,01 0,1588
Solids Content of Latex, Dyes and Admixtures in Powder FormS1 Acrylic Latex Solution (ASTM C 1438) 1,02 28,50 0,0279 0,143 0,0001 28,30 0,0277S2 SBR Latex solution (ASTM C 1438) 1,03 16,80 0,0163 0,084 0,0001 16,68 0,0162P1 Iron Oxyde Red Pigments (ASTM C 979) 3,65 0,00 0,0000 0,000 0,0000 0,00 0,0000P2 Iron Oxyde Orange Pigments (ASTM C 979) 3,65 0,00 0,0000 0,000 0,0000 0,00 0,0000P3 Iron Oxyde Yellow Pigments (ASTM C 979) 3,65 0,00 0,0000 0,000 0,0000 0,00 0,0000
Total Solids of Admixtures: 45,30 0,0443 0,227 0,0002 44,98 0,0439
Admixtures (including Pigments in Liquid Form)% solids
Dosage (ml/100kg
of CM)
Water in Admixture
(kg/m3)
Amount (ml)
Water in Admixture
(kg)
Dosage (ml/100kg
of CM)
Water in Admixture
(kg/m3)Ad1 Acrylic Latex Solution (ASTM C 1438) Density: 1017 15,0% 60609 161,50 934,1 0,808 60609 160,36Ad2 SBR Latex solution (ASTM C 1438) Density: 1027 48,0% 11056 18,20 170,4 0,091 11056 18,07Ad3 High-Range Water-Reducer (ASTM C 494) Density: 1064 34,0% 2287 4,95 35,2 0,025 2287 4,91Ad4 Shrinkage-Reducing Agent (ASTM C 494) Density: 1010 1,5% 1205 3,69 18,6 0,018 1205 3,67
Water from Admixtures: 188,34 0,942 187,01
Cement-Cementitious Materials Ratio 0,424 0,424 0,424Water-Cementitious Materials Ratio 0,519 0,519 0,519Slump, Slump Flow, mm, 7,5 6,1 6,1
M Mass of Concrete, kg 704,99 3,525 700,00V Absolute Volume of concrete, m3 0,9165 0,0046 0,9100T Theorectical Density, kg/m3 769,19 769,19 769,19D Design Density, kg/m3 704,99D Measured Density, kg/m3 700 700A Air Content, % 8,35% 9,00% 9,00%Y Yield, m3 1,00000 0,00504 1,00000Ry Relative Yield 1,00713

École de technologie supérieure, 2015
APPENDIX C
BILL OF MATERIALS
Materials Quantity Unit Cost Total CostConcrete Materials
0.5-1.0 mm Expanded. Recycled Glass Bubbles 6,4 25,19 $/kg 162,00 $ 0.25-0.5 mm Expanded. Recycled Glass Bubbles 8,3 23,56 $/kg 196,00 $ Soda-Lime/Borosilicate Glass Microspheres 11,2 37,89 $/kg 425,00 $ White Type I Portland Cement (ASTM C 150) 29,1 1,41 $/kg 42,00 $ Gr. 120 Granulated Blast Furnace Slag (ASTM C 989) 31,8 0,66 $/kg 21,00 $ Acrylic Latex Solution (ASTM C 1438) 28,5 5,2 $/L 149,00 $ SBR Latex solution (ASTM C 1438) 9 12,2 $/L 110,00 $ High-Range Water-Reducer (ASTM C 494) 1,3 6,35 $/L 9,00 $ Shrinkage-Reducing Agent (ASTM C 494) 0,6 9,34 $/L 6,00 $ Iron Oxyde Red Pigments (ASTM C 979) 0,3 24,95 $/kg 8,00 $ Iron Oxyde Yellow Pigments (ASTM C 979) 0,2 22,95 $/kg 5,00 $ Iron Oxyde Orange Pigments (ASTM C 979) 0,3 22,95 $/kg 7,00 $
ReinforcementOpen Fiberglass Grid (Primary) 5,7 3,88 $/m² 22,00 $ Fiberglass rebar (Primary) 11,9 4,82 $/m 58,00 $ Multifilament Polypropylene Fibers (ASTM C 1116) (Secondary) 0,3 8,71 $/kg 3,00 $ Fibrillated Polypropylene Fibers (ASTM C 1116) (Secondary) 0,3 8,71 $/kg 3,00 $
FinishingStencils Lump Sum 300,00 $ 300,00 $ Non-Reactive Stains 1,7 40,00 $/L 68,00 $ No VOC Sealer 2,6 22,75 $/L 59,00 $
Form1½ Extruded polysyrene Male Mold. Complete Lump Sum 1 100 $ 1 100,00 $
Total Production Cost 2 753,00 $
C1

École de technologie supérieure, 2015
-80
-70
-60
-50
-40
-30
-20
-10
0
10
20
38,1
342,
964
7,7
952,
512
57,3
1562
,118
66,9
2171
,724
76,5
2781
,330
86,1
3390
,936
95,7
4000
,543
05,3
4610
,149
14,9
5219
,755
24,5
5829
,3
N mm
Free Body Diagram
Dead Load
Hydrostatic Pressure
- n : the section number- Vn : the shear force acting on the section- Vn-1 : the shear preceding the section = -90,05 N- Vm : the shear force of the section- Mn : the moment acting on the section- Mn-1: the moment preceding the section- VΠ : the resultant of the buoyancy on the calculated section
Hypothesis Value Unit SymbolWeighing of paddler 97,73 kg -
Position of front paddler (2 paddler race)
600 mm -
Position of rear paddler (2 paddler race)
5 496 mm -
Young Modulus of grid 73 GPa EG
Density of grid 2 rg
Width of a longitudinal strand 3,5 mm -
Height of a longitudinal strand 1 mm -
Distance between two longitudinal strands
25,4 mm -
Width of a transversal strand 7 mm -
Height of a transversal strand 1 mm -
Distance between two transversal strands
25,4 mm -
Thickness of three layers 9,525 mm e
Young Modulus of concrete 400 kPa EC
Density of wet concrete 0,69 rcw
Young Modulus of reinforcement bars
50 GPa ER
Diameter of reinforcement bars 6,35 mm FR
Density of reinforcement bars 1,85 PR
Weighting of dead loads 1,25 - -
Weighting of live loads 1,00 - -
Weighting for change from static to dynamic
1.25 - -
Performance factor on concrete 0,85 - gc
Density of water (4°C) 1 000 kg/m3 rw
Gravitational acceleration 9,81 m/s2 g
Hypothesis :
Shear force calculation :Vn = Vn-1 + Vm - VwVw = Aarea of wet section * Dx * rwVw = 0,09 m2 * 0,0762 m * 1000 kg/m3 * 9,81N/kgVw = 66,2 N
Vm = Aarea of section * rconcrete * DxVm = 0,012 m2 * 0,0762 m * 690kg/m3 * 9,81N/kgVm = 9,52 N
Vn-1 = -90,05 N
Vn = - 90,05 N + 9,52 N - 66,2 NVn = - 146,8 N
Critical section properties : X = 3 238,5 mm
Longitudinal calculation :
Dx=76,2 mm
372,
8 m
m
GMn-1 Mn
Vn-1
VΠ
Vm
Vn
Structural AnalysisBy :
Revise by :2-male Loading Condition
Structural Example SAMBAC. Neyret
P. LapointeÉ. Boldireff
D1
APPENDIX D - EXAMPLE STRUCTURAL CALULATION
1 195,46 1 195,46
-1500
-1000
-500
0
500
1000
1500
0 1000 2000 3000 4000 5000 6000 7000
N mm
Shear Diagram
-2000
-1500
-1000
-500
0
500
0 1000 2000 3000 4000 5000 6000 7000N.m mm
Bending Moment Diagram

École de technologie supérieure, 2015
Maximum bending moment calculation :Mn = Mn-1 + Vn-1 * Dx + (Vm - Vw)*(Dx/2)Mn = - 1 840,4 N*m+ 0,0762 m *(9,52 N - 66,2 N) *
(0,0762 m/2)Mn = -1831,3 N*m Calculation of the sc stress in concrete :I = 0,000268095291 m4
sc = - (Mw*yc/I) * 1/Fcsc = - 1,794 MPa
Longitudinal shearing calculation :t is the shear due to the shear forceb = 2*e = 19.05 mmQ : the first surface momentQ = 0.0003135 m3
t = (Vy * Q)/(Iz * b)*(1/Fc)t = 0,0106 MPa
Transversal calculation :
Hydrostatic pressure Pw calculation :h the water height : 0,1044 mrw = 1 000 kg/m3
Pw = rw * g * hPw = 1 024 kN/m2
Moment Mw generated by the hydrostatic pressure at the base of the canoe :Mw = Pw * Dx * (h/2) * 1/3Mw = 0,453 N*m
Calculation of the sc stress in concrete :I = 0,874073*10-9 m4
sc = - (Mw * yc / I) * (1/Fc)sc = -0,235 MPa
Transversal shearing calculation :t is the shear due to the shear forceb = 0.0254 mQ the first surface momentQ = 0.1886 *10-9 m3
t = (Vy * Q / (Iz * b)) * (1/Fc)t = 0.0167 MPa
Structural AnalysisBy :
Revise by :2-male Loading Condition
Structural Example SAMBAC. Neyret
P. LapointeÉ. Boldireff
D2
0
20
40
60
80
100
120
140
160
0 0,2 0,4 0,6 0,8 1 1,2 1,4 1,6
mm
N/m2
Hydrostatic Pressure
0
20
40
60
80
100
120
140
160
0 500 1000 1500 2000 2500 3000
mm
N
Force
0
20
40
60
80
100
120
140
160
0 0,02 0,04 0,06 0,08 0,1 0,12
mm
KN*m
Moment
k
k

École de technologie supérieure, 2015D3
Structural AnalysisBy :
Revise by :2-male Loading Condition
Structural Example SAMBAC. Neyret
P. LapointeÉ. Boldireff
Calculation of the sc stress in rod :I = 0.000268095291 m4
sc = - (Mw*yc/I) sc = - 115.13 MPa < 938 MPaOK
Anchor or adhesion force:Surface stress = sc*area of rod/surfaceSurface stress =-115.13*31.7mm/(π*d*length)Surface stress =-115.13/(π*6.35*3028.95)Surface stress =0.0604 MPa
Moment Mw generated by the hydrostatic pressure at the base of the canoe :Mw = Pw * Dx * (h/2) * 1/3Mw = 0.06454 N*m Calculation of the sc stress in grid :I = 0.874073*10-9 m4
sc = - (Mw * yc / I) sc = 24.495 MPa OK
Anchor or adhesion force:Surface stress = sc*area of rod/surfaceSurface stress = 24.495*7mm/(2 * (1mm + 7 mm)*120mm)Surface stress = 171.5 N/ (1920 mm2)Surface stress = 0,0893 MPa