eu-27 dairy and products semi-annual 2011
TRANSCRIPT

THIS REPORT CONTAINS ASSESSMENTS OF COMMODITY AND TRADE ISSUES MADE BY
USDA STAFF AND NOT NECESSARILY STATEMENTS OF OFFICIAL U.S. GOVERNMENT
POLICY
Date:
GAIN Report Number:
Approved By:
Prepared By:
Report Highlights:
In 2011, EU-27 milk production is expected to increase in response to growing demand on the domestic
and international markets. While raw milk prices continue to entice EU farmers, rising input costs are
forcing more efficient production practices with fewer animals. In 2011, the raw milk output increase
amount is expected to be consumed for cheese, Non Fat Dried Milk (NFDM) production, and butter
manufacturing. Higher market prices should mute calls for intervention in the butter and NFDM
markets by the European Commission. .
Piotr Rucinski and EU Dairy Analysts
Michael Henney
2011
Dairy and Products Semi-annual
EU-27
PL0111
5/13/2011
Required Report - public distribution
Executive Summary:
Production:
In 2010, EU farmers increased milk output by an estimated 1.2 percent in response to 15 percent growth
in the average farm-gate prices for raw milk. High prices for dairy products on the world market and
growing domestic consumption in the European Union (EU) are expected to further stimulate raw milk
production in 2011. High raw milk prices continued to the first quarter of 2011. The increase of 2010
milk production was highest in France, Germany, and Ireland, and was mostly achieved through rising
milk yields as EU dairy herd inventory numbers continued to decline. In Spain and Portugal, high feed
prices and milk imports have limited the profitability of milk production, and subsequently production
gains from price increases.
In 2011, increased raw milk output is expected to be used mostly for cheese production, Non Fat Dried
Milk (NFDM) production, and butter manufacturing. Cheese remains in high demand on both
international and domestic EU markets. In 2011, cheese is expected to generate higher profit margins
than butter, NFDM, and whole dry milk (WDM). WDM production in 2011 is expected to remain at the
2010 level due to expected lower demand for exports caused by increased competition from Oceania on
the world market.
Market Intervention:
The European Commission’s intervening in the butter and NFDM markets is unlikely due to high
market prices. Intervention stocks of butter, built in 2009, practically disappeared in 2010 through
internal food assistance programs and exports. By the end of 2010 stocks of butter, remaining in private
storage (PSA), returned to historical levels. Intervention stocks of NFDM are expected to drop in 2011
through internal food aid programs reflected in higher domestic consumption and exports. Exports of
NFDM in 2011 are expected to increase due to strong demand from Russia and China.
Trade:
Strong demand on the world market for cheese, NFDM, butter and WDM continued in the first two
months of 2011. The value of exports of such dairy products from the EU-27 during this period
amounted to $1,290 million, 20 percent higher than during the same period in 2010. In comparison,
total U.S. dairy exports in January and February of 2011 amounted to $675 million, which was 52
percent higher than the same period of 2010.
DISCLAIMER

The PS&D numbers in this report are not official USDA numbers. The numbers are the result of a group effort by
the individual FAS EU offices to consolidate PS&D’s from all EU27.
The authors of this report wish to recognize all colleagues that helped with this report, and especially thank those who
participated in the report meeting to discuss the numbers and the report content, as well as all who helped with the
editing. The collaboration of the following FAS colleagues in the EU member states has been critical for the
completion of this report:
Stefano Baldi from FAS Rome covering Italy Ornella Bettini from FAS Rome covering Greece Mila Boshnakova from FAS Sofia covering Bulgaria Monica Dobrescu from FAS Bucharest covering Romania Bob Flach from FAS the Hague covering the Benelux Marie-Cecile Henard from FAS Paris covering France Steve Knight from FAS London covering the United Kingdom and Ireland Roswitha Krautgartner from FAS Vienna covering Austria Sabine Lieberz from FAS Berlin covering Germany Diogo Machado from FAS Madrid covering Portugal and Spain Jana Mikulasova from FAS Prague covering the Czech Republic and Slovak Republic Ferenc Nemes from FAS Budapest covering Hungary and Slovenia Yvan Polet from FAS USEU covering European Commission data and policies Piotr Rucinski from FAS Warsaw covering Estonia, Latvia, Lithuania and Poland Asa Wideback from FAS Stockholm covering Finland, Denmark and Sweden
Related reports
EU27 Dairy and Products 2010
Annual Report 10/15/2010
Dairy and Products Annual_Warsaw_EU-27_10-12-2010
Italy – dairy Outlook 2010 9/24/2010 Dairy Outlook 2010_Rome_Italy_9-24-2010
Greece – Dairy 2010 9/21/2010 Greece Dairy 2010_Rome_Greece_9-21-2010
Dairy Sector Update, Sofia, Bulgaria 12/9/2010 Dairy Sector Update_Sofia_Bulgaria_12-2-2010
These reports can be accessed through our website http://www.fas.usda.gov/posthome/useu/ or through the FAS
website http://gain.fas.usda.gov/Pages/Default.aspx
Commodities:
Dairy, Milk, Fluid
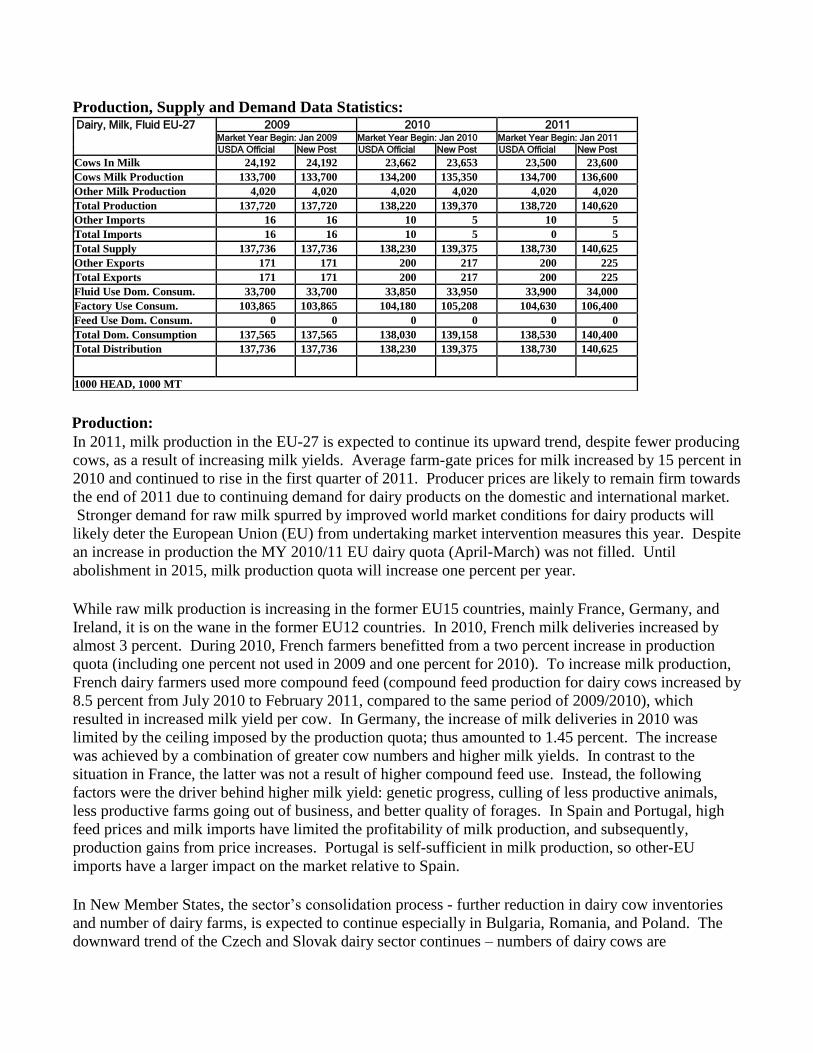
Production, Supply and Demand Data Statistics: Dairy, Milk, Fluid EU-27 2009 2010 2011
Market Year Begin: Jan 2009 Market Year Begin: Jan 2010 Market Year Begin: Jan 2011 USDA Official New Post USDA Official New Post USDA Official New Post
Cows In Milk 24,192 24,192 23,662 23,653 23,500 23,600 Cows Milk Production 133,700 133,700 134,200 135,350 134,700 136,600 Other Milk Production 4,020 4,020 4,020 4,020 4,020 4,020 Total Production 137,720 137,720 138,220 139,370 138,720 140,620 Other Imports 16 16 10 5 10 5 Total Imports 16 16 10 5 0 5 Total Supply 137,736 137,736 138,230 139,375 138,730 140,625 Other Exports 171 171 200 217 200 225 Total Exports 171 171 200 217 200 225 Fluid Use Dom. Consum. 33,700 33,700 33,850 33,950 33,900 34,000 Factory Use Consum. 103,865 103,865 104,180 105,208 104,630 106,400 Feed Use Dom. Consum. 0 0 0 0 0 0 Total Dom. Consumption 137,565 137,565 138,030 139,158 138,530 140,400 Total Distribution 137,736 137,736 138,230 139,375 138,730 140,625
1000 HEAD, 1000 MT
Production:
In 2011, milk production in the EU-27 is expected to continue its upward trend, despite fewer producing
cows, as a result of increasing milk yields. Average farm-gate prices for milk increased by 15 percent in
2010 and continued to rise in the first quarter of 2011. Producer prices are likely to remain firm towards
the end of 2011 due to continuing demand for dairy products on the domestic and international market.
Stronger demand for raw milk spurred by improved world market conditions for dairy products will
likely deter the European Union (EU) from undertaking market intervention measures this year. Despite
an increase in production the MY 2010/11 EU dairy quota (April-March) was not filled. Until
abolishment in 2015, milk production quota will increase one percent per year.
While raw milk production is increasing in the former EU15 countries, mainly France, Germany, and
Ireland, it is on the wane in the former EU12 countries. In 2010, French milk deliveries increased by
almost 3 percent. During 2010, French farmers benefitted from a two percent increase in production
quota (including one percent not used in 2009 and one percent for 2010). To increase milk production,
French dairy farmers used more compound feed (compound feed production for dairy cows increased by
8.5 percent from July 2010 to February 2011, compared to the same period of 2009/2010), which
resulted in increased milk yield per cow. In Germany, the increase of milk deliveries in 2010 was
limited by the ceiling imposed by the production quota; thus amounted to 1.45 percent. The increase
was achieved by a combination of greater cow numbers and higher milk yields. In contrast to the
situation in France, the latter was not a result of higher compound feed use. Instead, the following
factors were the driver behind higher milk yield: genetic progress, culling of less productive animals,
less productive farms going out of business, and better quality of forages. In Spain and Portugal, high
feed prices and milk imports have limited the profitability of milk production, and subsequently,
production gains from price increases. Portugal is self-sufficient in milk production, so other-EU
imports have a larger impact on the market relative to Spain.
In New Member States, the sector’s consolidation process - further reduction in dairy cow inventories
and number of dairy farms, is expected to continue especially in Bulgaria, Romania, and Poland. The
downward trend of the Czech and Slovak dairy sector continues – numbers of dairy cows are
decreasing as well as milk output. The same trend also can be seen in output of Czech dairy products,
which have difficulty competing on the EU market due to higher prices.
European farm-gate milk prices increased 1.7 percent in January and continued rising through most of
February. Towards the end of February the price stabilized as international commodity buyers started to
show reluctance to purchase at current price levels.
Consumption:
Fluid milk consumption in the EU-27 increased an estimated 0.7 percent in 2010 due to higher output of
raw milk and growing domestic demand in certain EU countries. Increased production of fresh cheeses,
yogurts and other fresh dairy products also contributed to the higher consumption of dairy products in
2010. In 2011, fluid milk use in the EU-27 is expected to increase further due to higher output of milk
and to continuing recovery of the economy. However, the increased output of raw milk in 2011 is
expected to be directed for factory use. MY 2010 has seen increased fluid milk consumption in the UK
- the sector has seen significant price promotions by retailers – and a further increase is forecast for MY
2011. However, consumer demand still remains depressed, especially for more expensive dairy
products in Bulgaria. Unlike other dairy products, demand for fluid milk production is growing in
Romania, supported by increasing consumer awareness regarding the risk of purchasing milk from
unknown sources (i.e., street vendors).
Trade:
Dutch milk trader Trigona Dairy Trade plans to start an online trading auction named “Dairy Auctions
Online” later this year. The platform will be Europe-wide and will trade butter, cheese, and milk
powder. Auctions will be for 22-tonne batches, starting from a minimum price. Major import markets
for the EU dairy products are Russia, China, and North Africa. However, Japan may become an
emerging market due to shortages caused by tsunami. In mid-April, 16 Polish dairy plants were
approved by the veterinary authorities of the Russian Federation for export of dairy products to Russia.

Commodities:
Production, Supply and Demand Data Statistics: Dairy, Cheese EU-27 2009 2010 2011
Market Year Begin: Jan 2009 Market Year Begin: Jan 2010 Market Year Begin: Jan 2011 USDA Official New Post USDA Official New Post USDA Official New Post
Beginning Stocks 0 0 0 0 0 0 Production 6,810 6,810 6,970 6,970 7,040 7,050 Other Imports 81 81 81 78 80 80 Total Imports 81 81 81 78 80 80 Total Supply 6,891 6,891 7,051 7,048 7,120 7,130 Other Exports 510 510 580 603 590 620 Total Exports 510 510 580 603 590 620 Human Dom. Consumption 6,381 6,381 6,471 6,445 6,530 6,510 Other Use, Losses 0 0 0 0 0 0 Total Dom. Consumption 6,381 6,381 6,471 6,445 6,530 6,510 Total Use 6,891 6,891 7,051 7,048 7,120 7,130 Ending Stocks 0 0 0 0 0 0 Total Distribution 6,891 6,891 7,051 7,048 7,120 7,130
1000 MT
Production:
In early 2010, margins for cheese production recovered to previous levels and boosted production
towards the end of the year. In 2011, cheese production in the EU-27 is expected to increase by 1.5
percent due to growing availability of raw milk, stronger export demand, and higher domestic
consumption. As more milk is being used for the production of cheese, the availability of raw milk for
powder production is tightening.
Germany, France, and Italy are European leaders of cheese production supplying over 55 percent of the
total output. In Germany and France cheese manufacturing in 2011 is expected to grow due to
increasing domestic consumption. The dairy sector in the Benelux countries believes that cheese, in
particular branded cheese, will be the main dairy product, which may be competitive on the world
market. Italian hard cheese production, driven by Parmigiano Reggiano and Grana Padano, performed
very well in 2010 showing an increase of 2.4 percent and 2.8 percent respectively. The production
increase was mainly due to recovering prices and to growing demand in main export markets, United
States, Germany, and UK. In 2010 UK production increased, although the number belies a shift
towards the more mature cheeses. A further rise in production is forecast for 2011. Cheese and butter
production is forecast to rise in the Republic of Ireland supported by increased domestic supplies of
fluid milk.
Consumption:
In 2011 domestic consumption of cheese in the EU-27 is expected to increase. After declining in 2009
consumption rebounded in 2010 due to improvement of the EU’s economy. In 2010 French cheese
consumption strengthened as retail prices fell (one percent lower than in 2009) and cheeses used in
processed foods increased. Domestic consumption of cheese in Italy stagnated in 2010 and will not
Dairy, Cheese

likely increase in 2011 due to rising prices. Intra-EU specialty cheese imports are also on the rise,
largely due to the increased popularity of blue vein cheeses in the UK.
Trade:
After an 18 percent increase in 2010, EU-27 exports of cheese are forecast to increase at a slower pace
in 2011. Despite continuing world demand, EU-27 cheese exports in 2011 will be limited by limited
supply on the EU market. Major export markets outside of the EU are the United States, Switzerland,
Japan, Russia, and Saudi Arabia. Export interest will also be influenced by the Euro/US$ exchange
rate. Cheese imports are forecast to remain within the import quota due to growing domestic supplies.
In 2010, increased cheese exports from Germany, the largest European exporter of cheese, was stronger
than previously expected. The increase was mostly due to a 70 percent increase in cheese exports to
Russia (mainly Gouda, Tilsit, and Edam). The increase in France's cheese exports in 2010 mainly
consisted in stronger shipments of processed cheese and low-priced cheese categories. German exports
of cheese are expected to continue at the same level in 2011, and French exports of cheese are
anticipated to remain strong.

Commodities:
Production, Supply and Demand Data Statistics: Dairy, Butter EU-27 2009 2010 2011
Market Year Begin: Jan 2009 Market Year Begin: Jan 2010 Market Year Begin: Jan 2011 USDA Official New Post USDA Official New Post USDA Official New Post
Beginning Stocks 53 53 103 103 53 2 Production 2,030 2,030 1,980 1,980 1,975 2,000 Other Imports 63 63 65 41 65 50 Total Imports 63 63 65 41 65 50 Total Supply 2,146 2,146 2,148 2,124 2,093 2,052 Other Exports 169 169 200 155 165 172 Total Exports 169 169 200 155 165 172 Domestic Consumption 1,874 1,874 1,895 1,967 1,880 1,880 Total Use 2,043 2,043 2,095 2,122 2,045 2,052 Ending Stocks 103 103 53 2 48 0 Total Distribution 2,146 2,146 2,148 2,124 2,093 2,052
1000 MT
Production:
In 2010, EU-27 butter production declined by two percent as the milk processing was directed into
manufacturing of cheese. In 2011, butter production is forecast to increase due to higher supplies of raw
milk, higher milk fat content in raw milk and continuing export demand. Germany, France, and The
Netherlands are the major producers of butter in the EU supplying 65 percent of the total production.
Consumption:
In 2011, EU-27 domestic consumption of butter is expected to decrease in comparison to 2010 when
governmental assistance programs for needy people using butter released from intervention stocks
resulted in higher local consumption. The European Commission approved these assistance programs
implemented by Member States (MS). Consumption patterns are expected to return to the longer-term
downward trend of reduced consumption driven by health-related concerns. However, in 2010, in
France, retail sales of low-priced butter as a cooking ingredient declined as consumers cooked less at
home, purchased more prepared meals, and ate out more as the economy moved towards recovery. On
the other hand, in Germany lower butter prices on the domestic market induced food processors to
substitute more butter for vegetable oils.
Trade:
Butter is in short supply on the world market. Currently demand in Asia is not serviced adequately by
suppliers from the EU-27, the United States, and Oceania. In 2011, EU exports of butter are expected to
increase, driven by high world butter prices. Imports are expected to remain within the existing 65,000
MT import quota.
Stocks:
Dairy, Butter

At the end of 2010, EU-27 butter stocks were almost totally used while Private Storage returned to its
historical level. By the end of 2010, intervention stocks built mostly in 2009 were consumed under EU
food assistance programs. As of April 19, 2011, the remaining intervention stocks amounted to 1,544
MT and had been already allocated for food assistance programs within the EU. As of mid-April 2011,
25,418 MT of butter was in storage under the PSA scheme (mainly in The Netherlands and France).
(Note: Butter can only be committed under the PSA program from March through August.)
Policy:
On April 20, 2011, butter's weighted average price stood at 382 Euros per 100 kilograms. The EU
intervention price is set at 221.75 Euros per 100 kilograms. If market prices remain constant in
2011, no EU butter intervention should occur this year.

Commodities:
Production, Supply and Demand Data Statistics: Dairy, Milk, Nonfat Dry EU-27 2009 2010 2011
Market Year Begin: Jan 2009 Market Year Begin: Jan 2010 Market Year Begin: Jan 2011 USDA Official New Post USDA Official New Post USDA Official New Post
Beginning Stocks 0 0 259 259 170 195 Production 1,080 1,080 980 980 970 1,010 Other Imports 6 6 5 4 5 5 Total Imports 6 6 5 4 5 5 Total Supply 1,086 1,086 1,244 1,243 1,145 1,210 Other Exports 231 231 350 378 330 400 Total Exports 231 231 350 378 330 400 Human Dom. Consumption 596 596 724 670 735 780 Other Use, Losses 0 0 0 0 0 0 Total Dom. Consumption 596 596 724 670 735 780 Total Use 827 827 1,074 1,048 1,065 1,180 Ending Stocks 259 259 170 195 80 30 Total Distribution 1,086 1,086 1,244 1,243 1,145 1,210
1000 MT
Production:
In 2011, the EU-27 Non-Fat Dry Milk (NFDM) production is expected to increase in response to higher
output of raw milk and growing export demand. Due to the high butter price, the margin from NFDM
production is still higher than for WDM production. France and Germany are leaders of the NFDM
production in Europe supplying over 55 percent of total output. In 2010, French NFDM production
increased by more than seven percent triggered by higher exports to both EU and non-EU countries. In
contrast and as was expected, Germany NFDM production decreased by 9 percent in 2010 as other
products (mainly cheese) provided better market opportunities and intervention for NDFM was no
longer permissible.
Consumption:
In 2011, EU-27 consumption of NFDM is expected to increase due to growing local demand from food
and feed industries emerging from the recent economic downturn. Consumption is also expected to
increase due to domestic use of intervention stocks within the assistance programs for needy people.
The EU Management Committee for Common Organization of Agricultural Markets approved national
programs of food assistance to needy people for 2011. NFDM allocated for this purpose amounts to
94,000 MT. Italy, Spain, Poland, and France are expected to be the primary beneficiaries of this aid.
Trade:
In 2011, EU-27 exports are projected to increase as a result of higher demand, mainly from Russia and
China. In the first two months of 2011 NFDM exports totaled 72,000 MT, an 11 percent increase in
comparison to the first two months of 2010. Exports are expected to continue at a higher level during
the first half of 2011 with further release of intervention stocks and continued demand from Asian and
South African markets.
Dairy, Milk, Nonfat Dry

In 2010, Benelux exports of NFDM increased, mainly to Algeria, Russia, and Nigeria. French exports
to non-EU destinations doubled to 65,000 MT, mainly due to higher shipments to Algeria, Russia,
Indonesia, the Philippines, Morocco, China, and Nigeria. German exports increased to 50,000 in 2010
from 29,000 MT in 2009, with the largest increases occurring to Russia, Indonesia, China, and Yemen.
Stocks:
The use of NFDM intervention stocks for feed programs combined with sales through tenders are
expected to reduce 2011 stocks by year’s end. However, world market prices will determine the EU
rate of release of intervention stocks in 2011. European exchange rates will play an important role for
the global market competitiveness of NFDM.
Policy:
On April 20, 2011, the weighted average price for NFDM amounted to 237 Euros per hundred
kilograms, well above the EU intervention price. If prices for NFDM remain at or near current levels in
2011, no EU intervention of NFDM should occur this year.

Commodities:
Production, Supply and Demand Data Statistics: Dairy, Dry Whole Milk Powder EU-27 2009 2010 2011
Market Year Begin: Jan 2009 Market Year Begin: Jan 2010 Market Year Begin: Jan 2011 USDA Official New Post USDA Official New Post USDA Official New Post
Beginning Stocks 0 0 0 0 0 0 Production 790 790 760 780 750 780 Other Imports 1 1 0 2 0 2 Total Imports 1 1 0 2 0 2 Total Supply 791 791 760 782 750 782 Other Exports 463 463 430 444 420 420 Total Exports 463 463 430 444 420 420 Human Dom. Consumption 328 328 330 338 330 362 Other Use, Losses 0 0 0 0 0 0 Total Dom. Consumption 328 328 330 338 330 362 Total Use 791 791 760 782 750 782 Ending Stocks 0 0 0 0 0 0 Total Distribution 791 791 760 782 750 782
1000 MT
Production:
In 2011, EU-27 whole milk powder (WMP) production is expected to remain at the 2010 level due to
competition from manufacturing of cheese. Both products compete for a higher supply of raw milk. In
2010, WMP production turned out to be higher than expected due to higher raw milk production and
stronger export demand.
Consumption:
In 2011, domestic consumption of WDM is expected to increase due to stronger demand within the food
industry.
Trade:
In 2011, flat production coupled with stiff competition from Oceania in the Asian markets is expected to
hamper EU-27 export prospects. WDM is, however, a branded product and produced on contract basis,
thus production in general varies less than NFDM. The leading export destinations for EU WMP are
Algeria, Nigeria, and Oman.
Policy:
Dairy package- COM/2010/728/FINAL
Following the report and recommendations of the High Level Group (HLG) on Milk, the Commission
tabled on December 13, 2010 a proposal, known as the “Dairy package.” This proposal will amend the
"Single CMO" Regulation (EC) No 1234/2007 and is governed by the co-decision procedure. This
proposal is the Commission’s response to the first three recommendations of the HLG (see also GAIN
E50044 [1] and E50038 [2] ):
enhanced contractual relations between milk producers and dairies,
Dairy, Dry Whole Milk Powder

producers' collective bargaining power, and
possible role of inter-branch organizations in the dairy sector.
The proposal provides the possibility for creating Dairy Producer organizations (PO), which will have
the right to engage in negotiations on milk delivery contracts with dairy processors on behalf of its
member farmers. Volume limitations for these PO’s are suggested not to exceed:
(i) 3.5 percent of total Union production, and
(ii) 33 percent of the total national production of any particular Member State covered by such
negotiations by that producer organization, and
(iii) 33 percent of the total combined national production of all the Member States covered by such
negotiations by that producer organization.
Member States would have the discretion to make such delivery contracts mandatory. The content of
the contracts could include volume and price stipulations and could be signed for periods for up to five
years. The proposal also suggests that contracts and deliveries must be reported to Member States
allowing better transparency in the dairy market.
Discussions in the European Parliament (EP), which has the same decision power under co-decision, are
ongoing on various aspects of the proposal. On February 24, 2011, the Agricultural Committee
accepted a Draft Report tabling 40 amendments to the Commission proposal. Amendments would limit
the volume of milk negotiated by any particular PO to 20 percent of production instead of the proposed
33 percent, except in those countries with “insignificant” production, where the market is already highly
consolidate, the limitation would be set at 75 percent.
The Dairy Package is meant to be a standalone package; however, with the CAP towards 2020 debate
already in full swing, it is hard to keep things separated.
Milk producer prices in France are already negotiated among the government, farmers, and dairies.
Since January 2011, these stakeholders agreed on limiting producer price fluctuation as follows: they
can freely fluctuate by less than 10 Euros per MT per month and less than 8 Euros per MT per year, but
for higher fluctuations, French producer prices will have to follow German milk prices trends.
In Spain, the government has approved Royal Decree (RD) 460/2011 that regulates the functioning of
the milk producer organizations and dairy sector inter-professional organizations, and states Spanish
decisions on the use of contracts in the dairy sector in accordance with the European norm that will
modify Regulation (EC) 1234/2007 for the dairy sector. The initial objectives of the Ministry of
Environment, Rural, and Marine Affairs (MARM) were:
- the raw milk supply contracts be mandatory after a 6 month period counting from the beginning of the
campaign that started April 1st
,
- the final date and price of the contracts could be negotiated by the Producers Organizations (PO),
- the Inter-Professional Organizations (IPO) could reach agreements and propose contracts.
However, the Spanish Competition Authority recommended that these issues be eliminated from the
text or be made conditional to the approval of EU legislation that establishes it.

Consequently, the approved Royal Decree has a clause that makes the three above mentioned
requirements conditional to what will be set by the future European Union regulation.
The Quality Package On December 10, 2010, the Commission proposed a "Quality Package" consisting of:
a proposal for a regulation on agricultural product quality policy (17672/10); and
a proposal amending marketing standards in "Single CMO" Regulation No1234/2007
(17677/10).
The Quality Package includes:
– a proposal for a Regulation of the European Parliament and of the Council on agricultural product
quality schemes;
– a proposal to modify Regulation (EC) No 1234/2007 (the single Common Market Organization)
concerning marketing standards for agricultural products;
– guidelines setting out best practices for the development and operation of certification schemes
relating to agricultural products and foodstuffs, and
– guidelines on the labeling of foodstuffs using Protected Designation of Origin (PDO) and Protected
Geographical Indications (PGI) as ingredients.
The Quality Package aims to improve the Union legislation in the field of quality, as well as in the
operation of national and private certification schemes, in order to make them simpler, more transparent,
and easier to understand, adaptable to innovation, and less burdensome for producers and
administrations.
While the Quality Package covers all commodity sectors, it is important to the dairy sector because of
the importance of the protected designation of origin (PDO) and protected geographical indication (PGI)
schemes. The discussion about special support for dairying in Least Favored Areas (LFA) in the Rural
Development part of CAP towards 2020 debate touches on this.
Part III and Part IV of Annex 1 of the proposal define the updated marketing standards for dairy
products.
Following the decision of the Permanent Committee for Food Chain and Animal Health adopted on
September 15, 2009, the derogation period for deliveries of non-compliant raw milk to processing
establishments in Romania was extended with 2 years, until December 31, 2011. This extension
concerns both milk quality standards (hygiene) and structural requirements. Non- compliant milk and
its derivates can be traded on the domestic market. It is estimated that out of the total amount of milk
delivered to dairy plants in Romania, only 60 percent complies with EU standards, therefore EU
approved the two-year extension.
The CAP towards 2020 In November 2010, the Commission presented its communication The CAP towards 2020: Meeting the
food, natural resources, and territorial challenges of the future (16348/10).
The Commission communication identified three strategic goals for the future CAP:
To guarantee long-term food security for European citizens and to contribute to growing world
food demand,
To provide the European citizens with quality, value and diversity of food produced sustainably,
in line with our environmental, water, animal health and welfare, plant health and public health
requirements.
To maintain viable rural communities, for whom farming is an important economic activity
creating local employment; this delivers multiple economic, social, environmental, and territorial
benefits.
EU dairy farmers have a lot at stake after the expiration of the milk production quota in 2015. They will
be much more exposed to market forces and subsequent price volatility. Direct payments for dairy
production, which were introduced in the 2008 Mid Term Review, are likely to be significantly cut, if
not completely ceased. New support instruments will have to emerge to protect dairy farming in Least
Favored Areas.
The debate on the future CAP is raging among EU farmer groups, EU food industries, Member States,
but also in the European Parliament, which now has equal decision power through the co-decision
procedure, but also through its co-decision right on the budget discussion. Because of the financial
crisis in the EU, it is most likely that the Member States, through the Council, will pursue budget cuts
for the CAP, while the European Parliament is a strong defender of farmer interests. Agricultural
Commissioner Dacian Ciolos is now scheduled to present the Commission’s formal proposal for the
CAP towards 2020 in the October/November 2011 time frame, after a several months’ delay.
[1]
http://gain.fas.usda.gov/Recent%20GAIN%20Publications/High%20Level%20Group%20makes%207%20recommendations
%20for%20EU%20dairy%20sector_Brussels%20USEU_EU-27_6-21-2010.pdf [2]
http://gain.fas.usda.gov/Recent%20GAIN%20Publications/State%20of%20progress%20of%20the%20High%20Level%20E
xpert%20Group%20on%20Milk_Brussels%20USEU_EU-27_5-12-2010.pdf