eu-27 dairy and products semi-annual 2013
TRANSCRIPT
THIS REPORT CONTAINS ASSESSMENTS OF COMMODITY AND TRADE ISSUES MADE BY
USDA STAFF AND NOT NECESSARILY STATEMENTS OF OFFICIAL U.S. GOVERNMENT
POLICY
Date:
GAIN Report Number:
Approved By:
Prepared By:
Report Highlights:
In 2013,EU-27 milk deliveries are expected to increase only slightly despite favorable world market
conditions for dairy products due to higher production costs and unfavorable weather conditions. The 3
percent decline in milk deliveries recorded early in 2013 is expected to reverse itself as the feed
situation improves. Any increase in milk production will mostly go into production of cheese which
remains high in demand both domestically and internationally. Because of limited supplies of raw milk,
production of Whole Dry Milk should decrease slightly while that of butter and Non Fat Dried Milk
should remain level with last year. In 2013, strong demand from Russia will drive EU-27 exports of
cheeses and butter while limited stocks of NFDM will crimp its availability for export.
Piotr Rucinski, Agricultural Specialist
Michael Henney, Agricultural Attaché
2013
Dairy and Products Semi-annual
EU-27
PL1314
5/15/2013
Required Report - public distribution
Executive Summary:
Production: In 2013, milk deliveries in the EU-27 are expected to increase only slightly (0.1 percent) in comparison
to 2012. The increase will be lower than predicted in the Annual Report (October 2012) because of
increased production costs, a long and severe winter in Europe and a delayed spring which moderated
milk production. The increase in prices on the international dairy market in the last quarter of 2012 and
beginning of 2013 resulted in higher export demand for dairy commodities and an increase of average
EU-27 farm-gate milk prices. The improved world market situation, positive forecast of crops in 2013
and discontinuation of dairy quota system scheduled for April 1, 2015 are expected to stimulate EU-27
dairy production towards the end of 2013 into 2014. The slight increase in milk production expected in
2013 will be mostly directed to the production of cheese, which remains high in demand both
domestically and internationally. For 2013, production of Non-Fat Dry Milk (NFDM) and butter, are
expected to remain at the 2012 levels as production and exports of cheese remain more profitable. In
2013, manufacturing of Whole Dry Milk (WDM) is expected to decrease mostly due to international
competition on the world market and limited supplies of raw milk for processing. The trend of the EU-
27 dairy herd contraction is expected to continue in 2013. However, higher output per cow is expected
to result in increased milk production.
Market Intervention: Remaining intervention stocks of NFDM, built up in 2009, were totally consumed under EU food
assistance programs in 2012. As of May 5, 2013, 34,530 MT of butter were accumulated under the
Private Storage Scheme (PSA), which started on March 1, 2013. The amount of PSA built in the period
of March 1 to May 5, 2013, is 43 percent lower than in the same period of 2012, which indicates strong
demand for butter on the domestic and international markets. Higher PSA stocks built in 2012 were
used for increased domestic consumption and exported. Butter stocks are expected to remain at low
levels at the end of 2013.
Trade: It is expected that in 2013, exports of milk powders (WDM and NFDM) will decrease in comparison to
2012 levels while exports of cheese and butter are expected to increase. During the first two months of
2013 exports of cheese, the main dairy product exported by the EU-27, was 14 percent higher in
comparison to the same period of 2012. In the first two months of 2013, EU-27 exports of NFDM were
reduced by almost 30 percent with most of the decrease in exports to China and Vietnam. However,
exports of NFDM to Algeria, a major export destination for the EU-27 NFDM, showed a 75 percent
increase in comparison to the same period of 2012, which may indicate a recovery after the 2012
decrease of exports to this destination. EU-27 exports of WDM in the first two months of 2013 declined
by seven percent mainly because of lower imports by Algeria, Egypt and China. In the first two months
of 2013, exports of butter increased by 16 percent in line with a seven percent increase of butter oil sales
in comparison to the same period of 2012. The increase in exports of butter to Russia was followed by
higher sales to Singapore and Iran.
As of April 1, 2013, the Custom Union (CU) of Russia, Kazakhstan and Belarus increased tariffs for
certain dairy products for a period of three months. The tariff for butter was increased from 15 percent
to 18.3 percent but not less than 0.4 Euro per kilogram and for cheese from 15 percent to 20 percent (25
percent for Feta cheese). The temporary increase in tariffs for dairy products is scheduled to remain in
effect until June 30, 2013, with a possibility of further extension. Although the increase of tariffs by the
CU is expected to adversely affect trade, Russia is expected to remain a major export market for EU-27
dairy products in 2013 importing mainly hard cheese and butter.
DISCLAIMER
The PS&D numbers in this report are not official USDA numbers. The numbers are the result of
a group effort by the individual FAS EU offices to consolidate PS&D’s from all EU-27.
The authors of this report wish to recognize all colleagues that helped with this report, and
especially thank those who participated in the report teleconference meeting to discuss the
numbers and the report content, as well as all who helped with the editing. The collaboration of
the following FAS colleagues in the EU member states has been critical for the completion of this
report:
Ornella Bettini from FAS Rome covering Greece and Italy
Mila Boshnakova from FAS Sofia covering Bulgaria
Monica Dobrescu from FAS Bucharest covering Romania
Bob Flach from FAS the Hague covering the Benelux, Finland, Denmark and Sweden
Marta Guerrero from FAS Madrid covering Portugal and Spain
Marie-Cecile Henard from FAS Paris covering France
Steve Knight from FAS London covering the United Kingdom and Ireland
Roswitha Krautgartner from FAS Vienna covering Austria
Sabine Lieberz from FAS Berlin covering Germany
Jana Mikulasova from FAS Prague covering the Czech Republic and Slovak Republic
Ferenc Nemes from FAS Budapest covering Hungary and Slovenia
Yvan Polet from FAS USEU covering European Commission data and policies
Piotr Rucinski from FAS Warsaw covering Estonia, Latvia, Lithuania and Poland
Commodities:
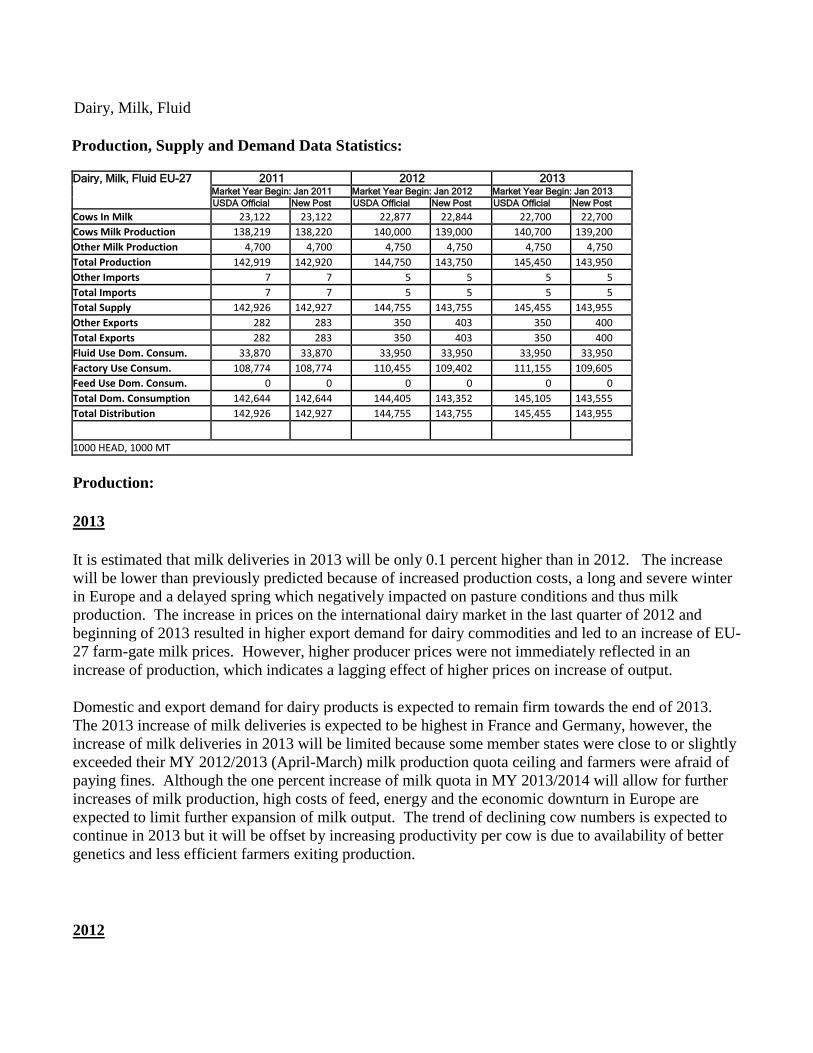
Production, Supply and Demand Data Statistics: Dairy, Milk, Fluid EU-27 2011 2012 2013
Market Year Begin: Jan 2011 Market Year Begin: Jan 2012 Market Year Begin: Jan 2013 USDA Official New Post USDA Official New Post USDA Official New Post
Cows In Milk 23,122 23,122 22,877 22,844 22,700 22,700 Cows Milk Production 138,219 138,220 140,000 139,000 140,700 139,200 Other Milk Production 4,700 4,700 4,750 4,750 4,750 4,750 Total Production 142,919 142,920 144,750 143,750 145,450 143,950 Other Imports 7 7 5 5 5 5 Total Imports 7 7 5 5 5 5 Total Supply 142,926 142,927 144,755 143,755 145,455 143,955 Other Exports 282 283 350 403 350 400 Total Exports 282 283 350 403 350 400 Fluid Use Dom. Consum. 33,870 33,870 33,950 33,950 33,950 33,950 Factory Use Consum. 108,774 108,774 110,455 109,402 111,155 109,605 Feed Use Dom. Consum. 0 0 0 0 0 0 Total Dom. Consumption 142,644 142,644 144,405 143,352 145,105 143,555 Total Distribution 142,926 142,927 144,755 143,755 145,455 143,955
1000 HEAD, 1000 MT
Production:
2013
It is estimated that milk deliveries in 2013 will be only 0.1 percent higher than in 2012. The increase
will be lower than previously predicted because of increased production costs, a long and severe winter
in Europe and a delayed spring which negatively impacted on pasture conditions and thus milk
production. The increase in prices on the international dairy market in the last quarter of 2012 and
beginning of 2013 resulted in higher export demand for dairy commodities and led to an increase of EU-
27 farm-gate milk prices. However, higher producer prices were not immediately reflected in an
increase of production, which indicates a lagging effect of higher prices on increase of output.
Domestic and export demand for dairy products is expected to remain firm towards the end of 2013.
The 2013 increase of milk deliveries is expected to be highest in France and Germany, however, the
increase of milk deliveries in 2013 will be limited because some member states were close to or slightly
exceeded their MY 2012/2013 (April-March) milk production quota ceiling and farmers were afraid of
paying fines. Although the one percent increase of milk quota in MY 2013/2014 will allow for further
increases of milk production, high costs of feed, energy and the economic downturn in Europe are
expected to limit further expansion of milk output. The trend of declining cow numbers is expected to
continue in 2013 but it will be offset by increasing productivity per cow is due to availability of better
genetics and less efficient farmers exiting production.
2012
Dairy, Milk, Fluid
In the first half of 2012 the decrease of international prices for dairy products led to a slower pace of
milk production increase in the EU-27 in comparison to 2011. Although world dairy market prices
started to recover from July 2012 the increase of EU-27 milk output in the second half of the year was
slower than expected because of growing feed costs and farmer’s fears of exceeding the production
quotas. As a result, the EU-27 milk production estimate for 2012 was corrected down in comparison to
the 2012 Annual Dairy and Products Report (October 2012).
Consumption:
In 2013, fluid consumption is forecast to remain at the 2012 level due to the lingering effects of the
economic downturn in Europe with higher milk output used by the processing industry.
In March and April 2013, Bulgarian and Romanian authorities reported aflatoxin incidents in raw milk
tested by regulators. The “aflatoxin” issue led to consumers’ reaction to refrain from consuming milk
for several weeks in March/April. Consequently farm milk acquisition prices dropped to the discontent
of the farmers, but in the same time, retailers made an attempt to prevent further sales from dropping by
selling the milk at significant discounts.
Trade:
In the first two months of 2013, extra EU-27 exports increased by over 60 percent due to continued
demand by China for UHT milk satisfied mainly by France and Germany. However, overall external
exports in 2013 are expected to remain at the 2012 level due to limited availability of raw milk.
Commodities:
Dairy, Cheese

Production, Supply and Demand Data Statistics:
Dairy, Cheese EU-27 2011 2012 2013
Market Year Begin: Jan 2011 Market Year Begin: Jan 2012 Market Year Begin: Jan 2013 USDA Official New Post USDA Official New Post USDA Official New Post
Beginning Stocks 0 0 0 0 0 0 Production 9,035 8,981 9,130 9,080 9,180 9,130 Other Imports 74 74 80 77 80 70 Total Imports 74 74 80 77 80 70 Total Supply 9,109 9,055 9,210 9,157 9,260 9,200 Other Exports 683 682 755 776 770 800 Total Exports 683 682 755 776 770 800 Human Dom. Consumption 8,426 8,373 8,455 8,381 8,490 8,400 Other Use, Losses 0 0 0 0 0 0 Total Dom. Consumption 8,426 8,373 8,455 8,381 8,490 8,400 Total Use 9,109 9,055 9,210 9,157 9,260 9,200 Ending Stocks 0 0 0 0 0 0 Total Distribution 9,109 9,055 9,210 9,157 9,260 9,200
1000 MT
Please note: As of October 2012 a new definition is used for reporting on cheese. The new definition
includes the following categories of cheese: soft cheese, medium soft cheese, medium hard cheese, hard
cheese, extra hard cheese and fresh cheese produced out of cows, ewes, goats, buffalo’s and mixed
milk. It does not include processed cheese. The “New” production data for 2011 were revised down in
order to reflect recent EU production data.
Production:
It is estimated that EU-27 cheese production increased by one percent in 2012 due to higher output of
milk, continuing domestic demand and growing exports. Strong world market prices for cheese are
expected to further stimulate an increase of output in 2013. Dairy industries in Germany, France, and
Italy remain the driving forces behind EU-27 cheese production, supplying over 55 percent of the total
output.
Consumption:
In 2012, increased cheese output was mainly exported while domestic consumption remained at the high
level of the previous year. In 2013, the increase of domestic cheese consumption within the EU-27 is
expected to be limited by the economic downturn and growing exports. In several EU-27 member states
the economic downturn has led to changes in the consumption pattern of cheese. Although the volume
of consumed cheese is growing, consumers have switched to less expensive brands of hard cheese or
substituted it with fresh cheese, while higher quality and more expensive brands of European cheeses are
mainly exported.
Trade:
EU-27 export of cheeses is forecast to continue to grow in 2013, mainly due to higher import demand
from Russia. In the first two months of 2013, EU-27 cheese exports to Russia increased by 23 percent,
supplied mostly by Germany and Lithuania. The increase of EU-27 cheese exports in 2013 is expected
to be limited by the domestic availability of cheese. Major external markets for EU-27 cheeses include
Russia, the United States, Switzerland, Japan, and Algeria. Cheese imports are projected to remain
within the established import quotas due to growing domestic supplies.
Policy:
EU-27 policy on common food names (i.e. generic terms), like parmesan and feta, are raising concern of
the U.S. dairy industry. Over the last few years dairy industries have observed more monitoring by the
EU regarding these terms within its borders. For example, within the EU-27 “feta” cheese can only
come from Greece. Increasingly, the EU is preventing the use of these names in other countries through
its Free Trade Agreement negotiations.
Commodities:
Production, Supply and Demand Data Statistics:
Dairy, Butter
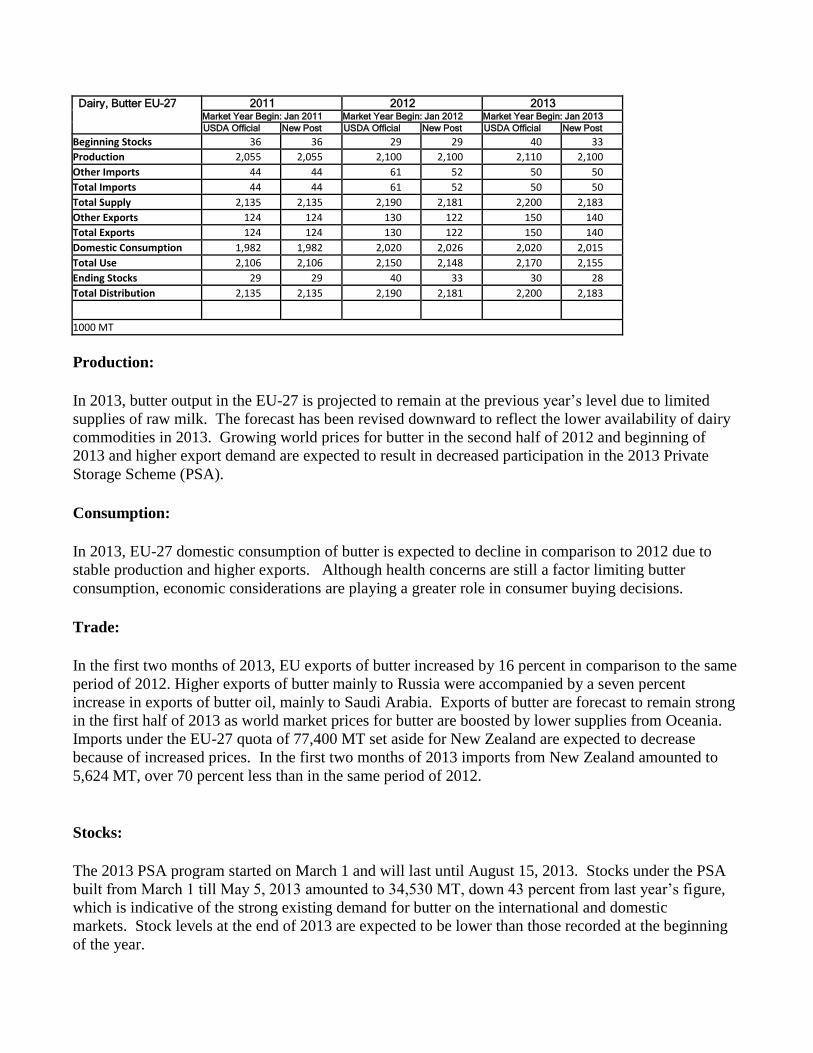
Dairy, Butter EU-27 2011 2012 2013
Market Year Begin: Jan 2011 Market Year Begin: Jan 2012 Market Year Begin: Jan 2013 USDA Official New Post USDA Official New Post USDA Official New Post
Beginning Stocks 36 36 29 29 40 33 Production 2,055 2,055 2,100 2,100 2,110 2,100 Other Imports 44 44 61 52 50 50 Total Imports 44 44 61 52 50 50 Total Supply 2,135 2,135 2,190 2,181 2,200 2,183 Other Exports 124 124 130 122 150 140 Total Exports 124 124 130 122 150 140 Domestic Consumption 1,982 1,982 2,020 2,026 2,020 2,015 Total Use 2,106 2,106 2,150 2,148 2,170 2,155 Ending Stocks 29 29 40 33 30 28 Total Distribution 2,135 2,135 2,190 2,181 2,200 2,183
1000 MT
Production:
In 2013, butter output in the EU-27 is projected to remain at the previous year’s level due to limited
supplies of raw milk. The forecast has been revised downward to reflect the lower availability of dairy
commodities in 2013. Growing world prices for butter in the second half of 2012 and beginning of
2013 and higher export demand are expected to result in decreased participation in the 2013 Private
Storage Scheme (PSA).
Consumption:
In 2013, EU-27 domestic consumption of butter is expected to decline in comparison to 2012 due to
stable production and higher exports. Although health concerns are still a factor limiting butter
consumption, economic considerations are playing a greater role in consumer buying decisions.
Trade:
In the first two months of 2013, EU exports of butter increased by 16 percent in comparison to the same
period of 2012. Higher exports of butter mainly to Russia were accompanied by a seven percent
increase in exports of butter oil, mainly to Saudi Arabia. Exports of butter are forecast to remain strong
in the first half of 2013 as world market prices for butter are boosted by lower supplies from Oceania.
Imports under the EU-27 quota of 77,400 MT set aside for New Zealand are expected to decrease
because of increased prices. In the first two months of 2013 imports from New Zealand amounted to
5,624 MT, over 70 percent less than in the same period of 2012.
Stocks:
The 2013 PSA program started on March 1 and will last until August 15, 2013. Stocks under the PSA
built from March 1 till May 5, 2013 amounted to 34,530 MT, down 43 percent from last year’s figure,
which is indicative of the strong existing demand for butter on the international and domestic
markets. Stock levels at the end of 2013 are expected to be lower than those recorded at the beginning
of the year.
Policy:
On April 14, 2013, butter's weighted average price stood at 371 Euros per 100 kilograms, well above the
EU intervention price set at 221.75 Euros per 100 kilograms and the U.S. price of US$ 287.6 per 100
kilograms.
Commodities:
Production, Supply and Demand Data Statistics: Dairy, Milk, Nonfat Dry EU-27 2011 2012 2013
Market Year Begin: Jan 2011 Market Year Begin: Jan 2012 Market Year Begin: Jan 2013 USDA Official New Post USDA Official New Post USDA Official New Post
Dairy, Milk, Nonfat Dry
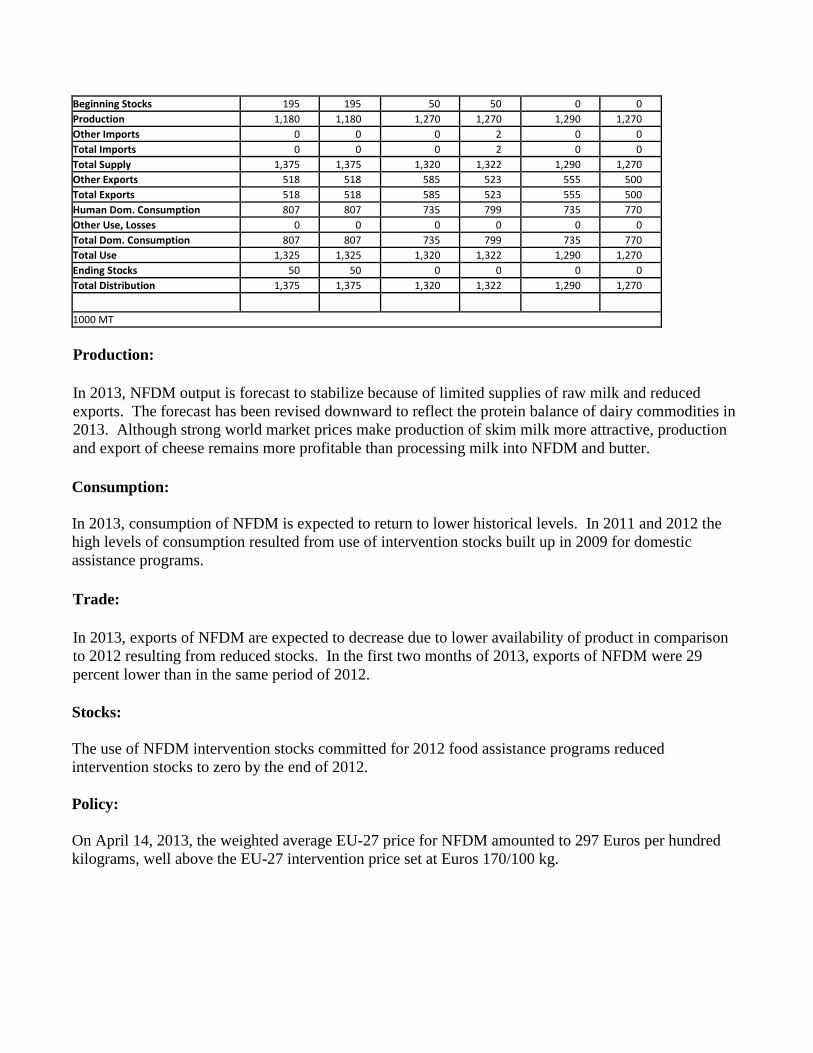
Beginning Stocks 195 195 50 50 0 0 Production 1,180 1,180 1,270 1,270 1,290 1,270 Other Imports 0 0 0 2 0 0 Total Imports 0 0 0 2 0 0 Total Supply 1,375 1,375 1,320 1,322 1,290 1,270 Other Exports 518 518 585 523 555 500 Total Exports 518 518 585 523 555 500 Human Dom. Consumption 807 807 735 799 735 770 Other Use, Losses 0 0 0 0 0 0 Total Dom. Consumption 807 807 735 799 735 770 Total Use 1,325 1,325 1,320 1,322 1,290 1,270 Ending Stocks 50 50 0 0 0 0 Total Distribution 1,375 1,375 1,320 1,322 1,290 1,270
1000 MT
Production:
In 2013, NFDM output is forecast to stabilize because of limited supplies of raw milk and reduced
exports. The forecast has been revised downward to reflect the protein balance of dairy commodities in
2013. Although strong world market prices make production of skim milk more attractive, production
and export of cheese remains more profitable than processing milk into NFDM and butter.
Consumption:
In 2013, consumption of NFDM is expected to return to lower historical levels. In 2011 and 2012 the
high levels of consumption resulted from use of intervention stocks built up in 2009 for domestic
assistance programs.
Trade:
In 2013, exports of NFDM are expected to decrease due to lower availability of product in comparison
to 2012 resulting from reduced stocks. In the first two months of 2013, exports of NFDM were 29
percent lower than in the same period of 2012.
Stocks:
The use of NFDM intervention stocks committed for 2012 food assistance programs reduced
intervention stocks to zero by the end of 2012.
Policy:
On April 14, 2013, the weighted average EU-27 price for NFDM amounted to 297 Euros per hundred
kilograms, well above the EU-27 intervention price set at Euros 170/100 kg.
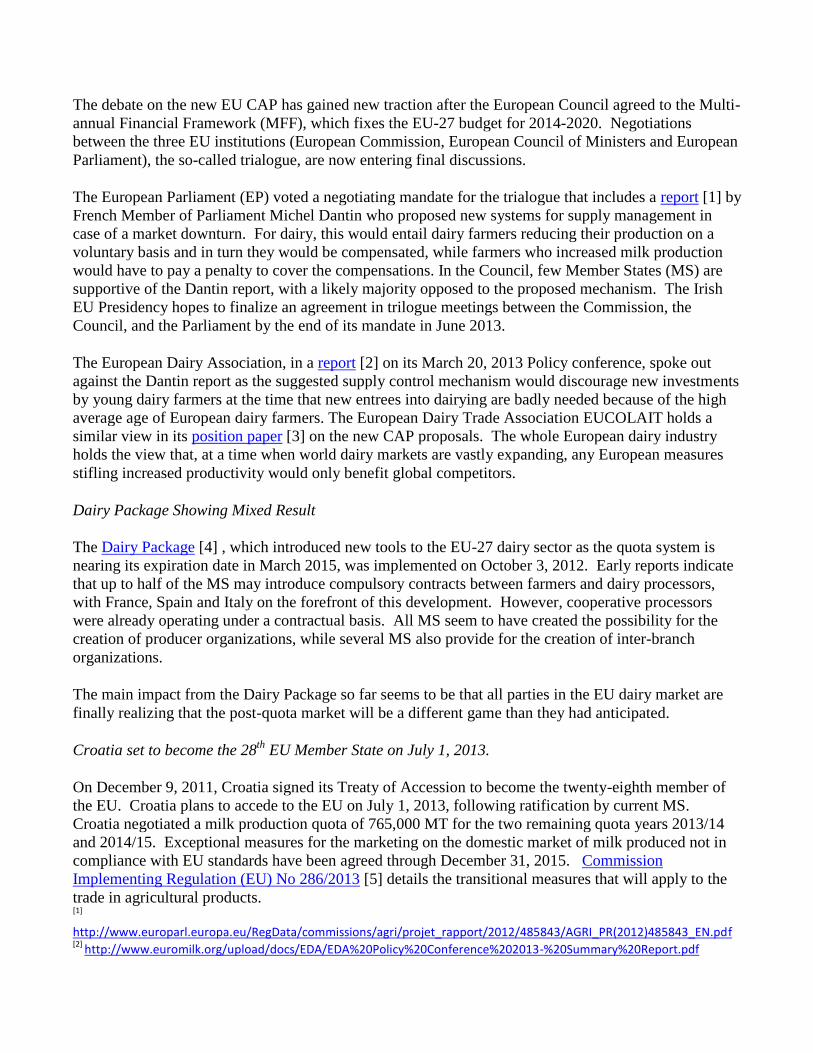
Commodities:
Production, Supply and Demand Data Statistics:
Dairy, Dry Whole Milk Powder EU-27 2011 2012 2013
Market Year Begin: Jan 2011 Market Year Begin: Jan 2012 Market Year Begin: Jan 2013 USDA Official New Post USDA Official New Post USDA Official New Post
Beginning Stocks 0 0 0 0 0 0
Dairy, Dry Whole Milk Powder
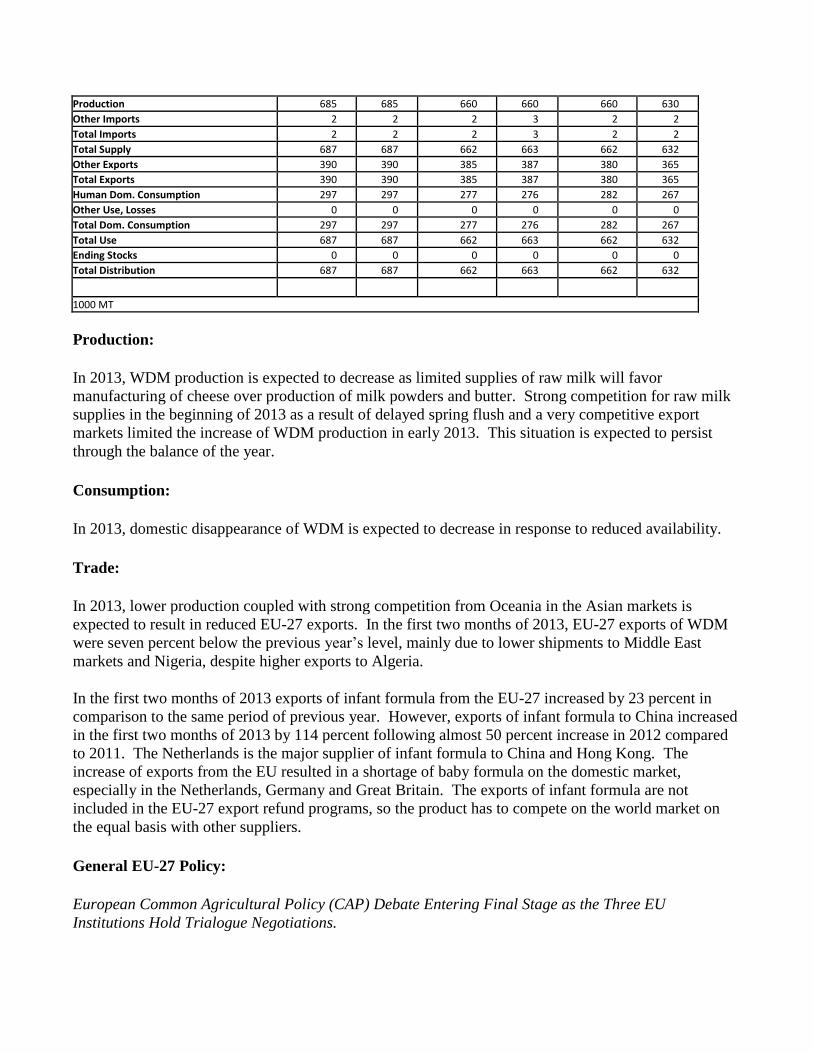
Production 685 685 660 660 660 630 Other Imports 2 2 2 3 2 2 Total Imports 2 2 2 3 2 2 Total Supply 687 687 662 663 662 632 Other Exports 390 390 385 387 380 365 Total Exports 390 390 385 387 380 365 Human Dom. Consumption 297 297 277 276 282 267 Other Use, Losses 0 0 0 0 0 0 Total Dom. Consumption 297 297 277 276 282 267 Total Use 687 687 662 663 662 632 Ending Stocks 0 0 0 0 0 0 Total Distribution 687 687 662 663 662 632
1000 MT
Production:
In 2013, WDM production is expected to decrease as limited supplies of raw milk will favor
manufacturing of cheese over production of milk powders and butter. Strong competition for raw milk
supplies in the beginning of 2013 as a result of delayed spring flush and a very competitive export
markets limited the increase of WDM production in early 2013. This situation is expected to persist
through the balance of the year.
Consumption:
In 2013, domestic disappearance of WDM is expected to decrease in response to reduced availability.
Trade:
In 2013, lower production coupled with strong competition from Oceania in the Asian markets is
expected to result in reduced EU-27 exports. In the first two months of 2013, EU-27 exports of WDM
were seven percent below the previous year’s level, mainly due to lower shipments to Middle East
markets and Nigeria, despite higher exports to Algeria.
In the first two months of 2013 exports of infant formula from the EU-27 increased by 23 percent in
comparison to the same period of previous year. However, exports of infant formula to China increased
in the first two months of 2013 by 114 percent following almost 50 percent increase in 2012 compared
to 2011. The Netherlands is the major supplier of infant formula to China and Hong Kong. The
increase of exports from the EU resulted in a shortage of baby formula on the domestic market,
especially in the Netherlands, Germany and Great Britain. The exports of infant formula are not
included in the EU-27 export refund programs, so the product has to compete on the world market on
the equal basis with other suppliers.
General EU-27 Policy:
European Common Agricultural Policy (CAP) Debate Entering Final Stage as the Three EU
Institutions Hold Trialogue Negotiations.
The debate on the new EU CAP has gained new traction after the European Council agreed to the Multi-
annual Financial Framework (MFF), which fixes the EU-27 budget for 2014-2020. Negotiations
between the three EU institutions (European Commission, European Council of Ministers and European
Parliament), the so-called trialogue, are now entering final discussions.
The European Parliament (EP) voted a negotiating mandate for the trialogue that includes a report [1] by
French Member of Parliament Michel Dantin who proposed new systems for supply management in
case of a market downturn. For dairy, this would entail dairy farmers reducing their production on a
voluntary basis and in turn they would be compensated, while farmers who increased milk production
would have to pay a penalty to cover the compensations. In the Council, few Member States (MS) are
supportive of the Dantin report, with a likely majority opposed to the proposed mechanism. The Irish
EU Presidency hopes to finalize an agreement in trilogue meetings between the Commission, the
Council, and the Parliament by the end of its mandate in June 2013.
The European Dairy Association, in a report [2] on its March 20, 2013 Policy conference, spoke out
against the Dantin report as the suggested supply control mechanism would discourage new investments
by young dairy farmers at the time that new entrees into dairying are badly needed because of the high
average age of European dairy farmers. The European Dairy Trade Association EUCOLAIT holds a
similar view in its position paper [3] on the new CAP proposals. The whole European dairy industry
holds the view that, at a time when world dairy markets are vastly expanding, any European measures
stifling increased productivity would only benefit global competitors.
Dairy Package Showing Mixed Result
The Dairy Package [4] , which introduced new tools to the EU-27 dairy sector as the quota system is
nearing its expiration date in March 2015, was implemented on October 3, 2012. Early reports indicate
that up to half of the MS may introduce compulsory contracts between farmers and dairy processors,
with France, Spain and Italy on the forefront of this development. However, cooperative processors
were already operating under a contractual basis. All MS seem to have created the possibility for the
creation of producer organizations, while several MS also provide for the creation of inter-branch
organizations.
The main impact from the Dairy Package so far seems to be that all parties in the EU dairy market are
finally realizing that the post-quota market will be a different game than they had anticipated.
Croatia set to become the 28th
EU Member State on July 1, 2013.
On December 9, 2011, Croatia signed its Treaty of Accession to become the twenty-eighth member of
the EU. Croatia plans to accede to the EU on July 1, 2013, following ratification by current MS.
Croatia negotiated a milk production quota of 765,000 MT for the two remaining quota years 2013/14
and 2014/15. Exceptional measures for the marketing on the domestic market of milk produced not in
compliance with EU standards have been agreed through December 31, 2015. Commission
Implementing Regulation (EU) No 286/2013 [5] details the transitional measures that will apply to the
trade in agricultural products. [1]
http://www.europarl.europa.eu/RegData/commissions/agri/projet_rapport/2012/485843/AGRI_PR(2012)485843_EN.pdf [2]
http://www.euromilk.org/upload/docs/EDA/EDA%20Policy%20Conference%202013-%20Summary%20Report.pdf

[3] http://www.eucolait.be/positions-a-letters/cap/14310-eucolait-position-single-cmo-trilogue-april-2013
[4] http://ec.europa.eu/agriculture/milk/milk-package/index_en.htm
[5] http://eur-lex.europa.eu/LexUriServ/LexUriServ.do?uri=OJ:L:2013:086:0007:0011:EN:PDF