eupdate - kansas state university
TRANSCRIPT
Issue 547
Extension Agronomy
eUpdate
02/05/2016
These e-Updates are a regular weekly item from K-State Extension Agronomy and Steve
Watson, Agronomy e-Update Editor. All of the Research and Extension faculty in Agronomy
will be involved as sources from time to time. If you have any questions or suggestions for
topics you'd like to have us address in this weekly update, contact Steve Watson,
785-532-7105 [email protected], Jim Shroyer, Crop Production Specialist 785-532-0397
[email protected], or Curtis Thompson, Extension Agronomy State Leader and Weed
Management Specialist 785-532-3444 [email protected].
eUpdate Table of Contents | 02/05/2016 | Issue 547
1. Management of Sudden Death Syndrome in soybeans: K-State research ............................................ 3
2. Optimal time to remove cattle from wheat pastures: First hollow stem ................................................ 9
3. First hollow stem update and fall forage wheat yield report .................................................................... 12
4. Agriculture Technology Day, Herington, Feb. 11 ............................................................................................ 16
5. Kansas weather summary for January 2016: Seasonally dry ..................................................................... 17
6...................................................................................................................................................................................................... 24
Kansas State University Department of Agronomy
2004 Throckmorton Plant Sciences Center | Manhattan, KS 66506
www.agronomy.ksu.edu | www.facebook.com/KState.Agron | www.twitter.com/KStateAgron

1. Management of Sudden Death Syndrome in soybeans: K-State research
Sudden Death Syndrome (SDS) is a disease caused by the soilborne fungus
Fusarium virguliforme.
This fungus prefers wet conditions and thus is usually most severe in irrigated fields. SDS tends to be
most severe on well-managed soybeans with a high yield potential. It also tends to be more
prevalent on fields that are infested with soybean cyst nematode (SCN) or planted early when soils
are wet and cool.
Historical yield losses from this disease are generally in the range of 1 to 25 percent. Losses were
unexpectedly low in 2015 considering the generally favorable soybean growing conditions in
eastern Kansas.
Symptoms of Sudden Death Syndrome
Symptoms of SDS are fairly easy to recognize. SDS begins as small, bright, pale green to yellow
circular spots on the leaves during late vegetative or early reproductive growth stages. As the disease
progresses, the tissue in these spots starts to die and enlarges to form brown streaks between the
veins, which remain green. Symptoms are more pronounced on top leaves.
Figure 1. Scattered yellow spots on some of the greener leaves in the lower right in this photo are the
early leaf symptoms of SDS. The leaves in the center foreground have more advanced symptoms of
SDS. Photo by Stu Duncan, K-State Research and Extension.
Kansas State University Department of Agronomy
2004 Throckmorton Plant Sciences Center | Manhattan, KS 66506
www.agronomy.ksu.edu | www.facebook.com/KState.Agron | www.twitter.com/KStateAgron
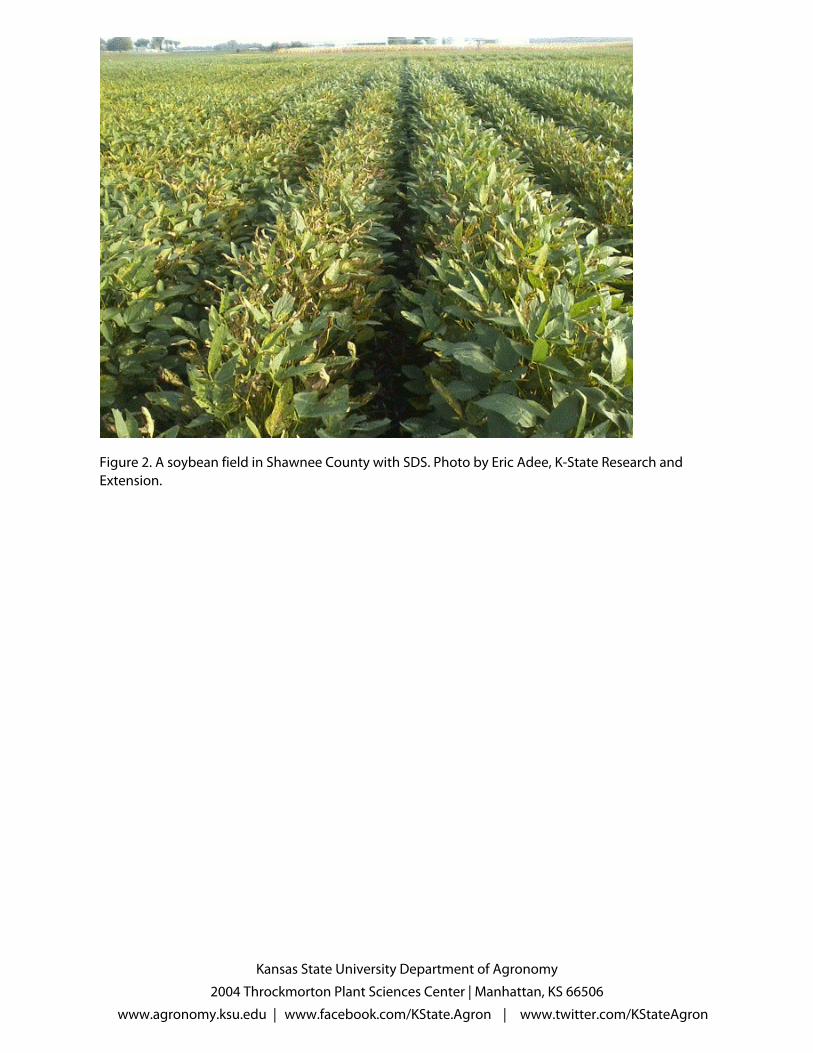
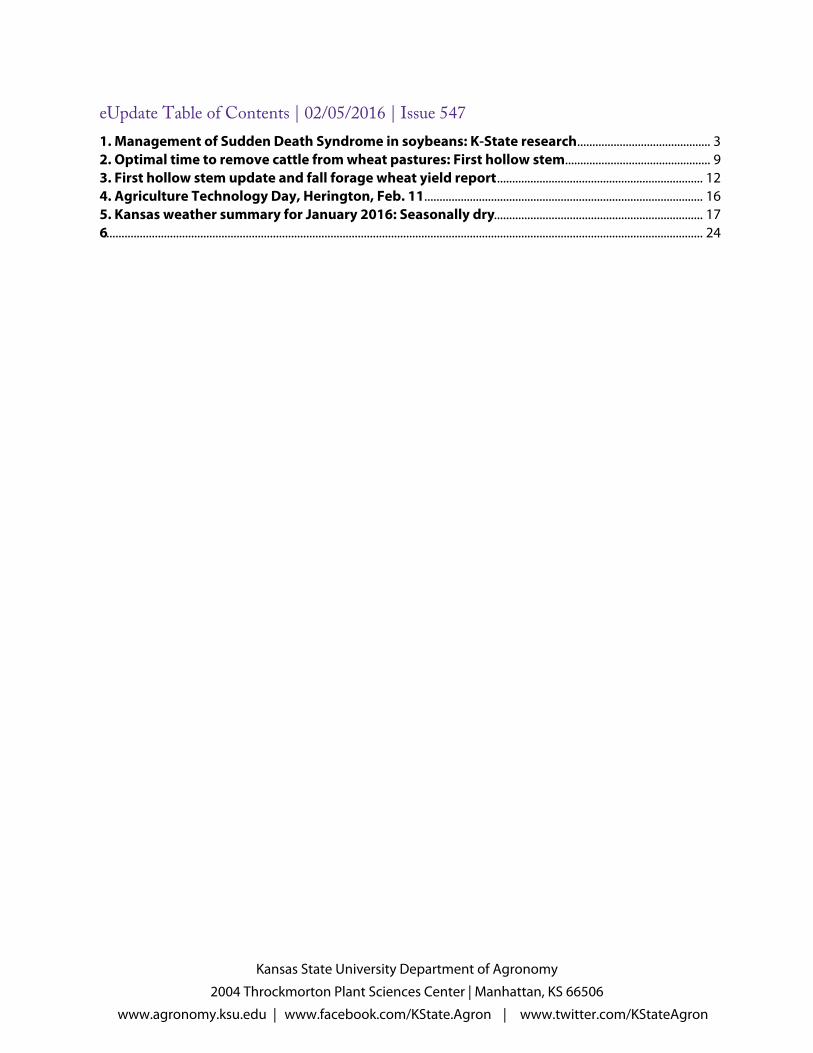
Figure 2. A soybean field in Shawnee County with SDS. Photo by Eric Adee, K-State Research and
Extension.
Kansas State University Department of Agronomy
2004 Throckmorton Plant Sciences Center | Manhattan, KS 66506
www.agronomy.ksu.edu | www.facebook.com/KState.Agron | www.twitter.com/KStateAgron
Figure 3. Rotted roots of SDS-infected soybeans. The blue mold on the root is the Fusarium that
causes SDS. Photo by Doug Jardine, K-State Research and Extension.
Flowers and pods may abort or not fill. Another key symptom of SDS is substantial amounts of root
decay and discoloration of roots and crown. Diseased plants are easily pulled out of the ground
because the taproots and lateral rots have deteriorated. Symptoms present on both the leaves and
roots are diagnostic for SDS.
Management options for Sudden Death Syndrome
Effective management of SDS requires an integrated approach. Management starts with the planting
of SDS resistant varieties. At K-State, we have been evaluating soybean varieties for SDS resistance in
our performance test for the past several years. Most varieties are susceptible to some degree, and
very few have good resistance. The most susceptible varieties yield 40 to 50 percent less than the
resistant varieties at locations where SDS is present and yield levels are in the range of 60+ bushels
per acre.
Kansas State University Department of Agronomy
2004 Throckmorton Plant Sciences Center | Manhattan, KS 66506
www.agronomy.ksu.edu | www.facebook.com/KState.Agron | www.twitter.com/KStateAgron

Figure 4. The variety on the right in a recent K-State performance test was susceptible to SDS. The
foliage was completely dead by early pod fill. Photo by Bill Schapaugh, K-State Research and
Extension.
Seed companies also have SDS ratings for most of their varieties, and there is typically a wide
variation in ratings. There is little or no correlation between the maturity of a variety and its SDS
resistance rating.
The presence of SDS is strongly correlated with the presence of SCN. Therefore, where SDS is present,
soil samples should be taken to determine the level of SCN present and it will need to be managed
along with the SDS. Producers cannot manage SDS simply by selecting varieties that have SCN
resistance, however. Some varieties with resistance to SCN are susceptible to SDS. And some varieties
that are susceptible to SCN are resistant to SDS. Ideally, producers should select varieties that are
resistant to SDS and multiple races of soybean cyst nematode.
Cultural management practices that can reduce the risk of SDS infection include delaying planting
until soil temperatures are warmer, avoiding planting into overly wet soils, and reducing compaction
problems within a field. Producers who have fields with compaction problems should make every
effort to correct that problem before planting soybeans next season.
Crop rotation also seems to have some positive effect on SDS, but only if the field is not planted to
Kansas State University Department of Agronomy
2004 Throckmorton Plant Sciences Center | Manhattan, KS 66506
www.agronomy.ksu.edu | www.facebook.com/KState.Agron | www.twitter.com/KStateAgron
soybeans for four years or more.
Seed treatments: K-State research
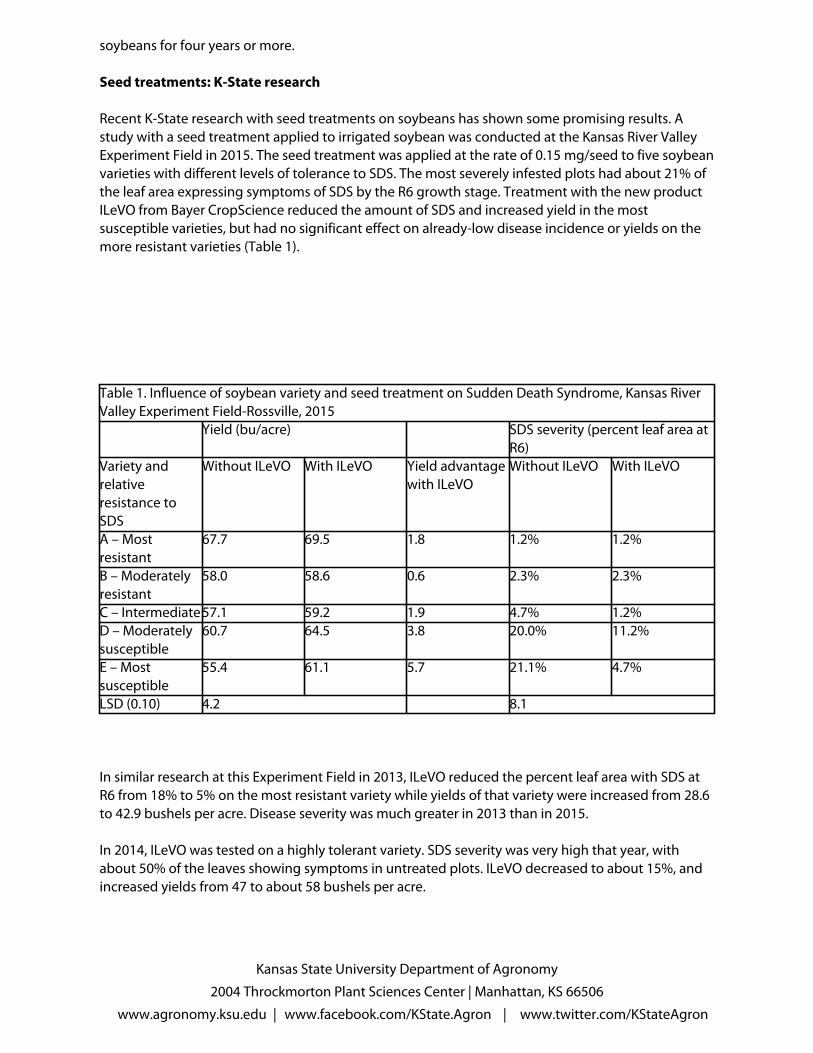
Recent K-State research with seed treatments on soybeans has shown some promising results. A
study with a seed treatment applied to irrigated soybean was conducted at the Kansas River Valley
Experiment Field in 2015. The seed treatment was applied at the rate of 0.15 mg/seed to five soybean
varieties with different levels of tolerance to SDS. The most severely infested plots had about 21% of
the leaf area expressing symptoms of SDS by the R6 growth stage. Treatment with the new product
ILeVO from Bayer CropScience reduced the amount of SDS and increased yield in the most
susceptible varieties, but had no significant effect on already-low disease incidence or yields on the
more resistant varieties (Table 1).
Table 1. Influence of soybean variety and seed treatment on Sudden Death Syndrome, Kansas River
Valley Experiment Field-Rossville, 2015
Yield (bu/acre) SDS severity (percent leaf area at
R6)
Variety and
relative
resistance to
SDS
Without ILeVO With ILeVO Yield advantage
with ILeVO
Without ILeVO With ILeVO
A – Most
resistant
67.7 69.5 1.8 1.2% 1.2%
B – Moderately
resistant
58.0 58.6 0.6 2.3% 2.3%
C – Intermediate57.1 59.2 1.9 4.7% 1.2%
D – Moderately
susceptible
60.7 64.5 3.8 20.0% 11.2%
E – Most
susceptible
55.4 61.1 5.7 21.1% 4.7%
LSD (0.10) 4.2 8.1
In similar research at this Experiment Field in 2013, ILeVO reduced the percent leaf area with SDS at
R6 from 18% to 5% on the most resistant variety while yields of that variety were increased from 28.6
to 42.9 bushels per acre. Disease severity was much greater in 2013 than in 2015.
In 2014, ILeVO was tested on a highly tolerant variety. SDS severity was very high that year, with
about 50% of the leaves showing symptoms in untreated plots. ILeVO decreased to about 15%, and
increased yields from 47 to about 58 bushels per acre.
Kansas State University Department of Agronomy
2004 Throckmorton Plant Sciences Center | Manhattan, KS 66506
www.agronomy.ksu.edu | www.facebook.com/KState.Agron | www.twitter.com/KStateAgron
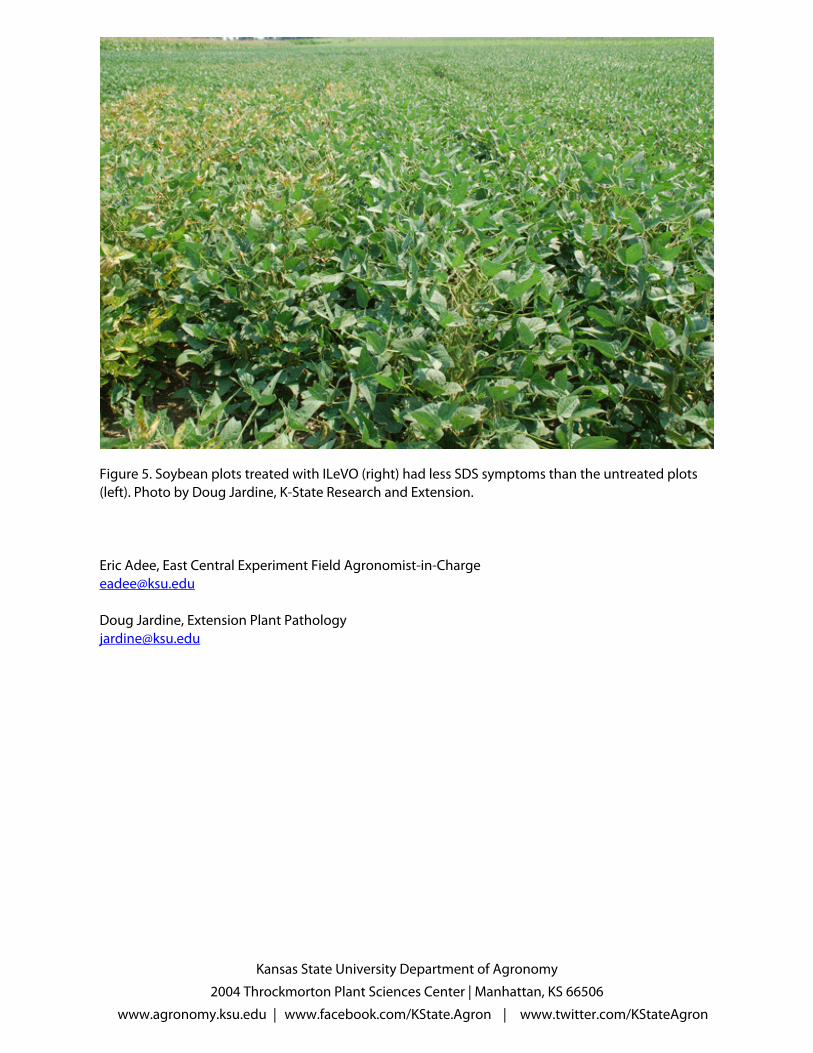
Figure 5. Soybean plots treated with ILeVO (right) had less SDS symptoms than the untreated plots
(left). Photo by Doug Jardine, K-State Research and Extension.
Eric Adee, East Central Experiment Field Agronomist-in-Charge
Doug Jardine, Extension Plant Pathology
Kansas State University Department of Agronomy
2004 Throckmorton Plant Sciences Center | Manhattan, KS 66506
www.agronomy.ksu.edu | www.facebook.com/KState.Agron | www.twitter.com/KStateAgron

2. Optimal time to remove cattle from wheat pastures: First hollow stem
As wheat greens up and begins growing with warmer temperatures in the coming weeks, producers
should start thinking about when to pull cattle off pasture to protect grain yields. After greenup is
underway and before the wheat has reached jointing, it is important to scout fields closely for signs
of the “first hollow stem” (FHS) stage. This stage occurs as the wheat switches from the vegetative
stage to the reproductive stage of growth.
When the leaf sheaths become erect, the developing growing point, which is below the soil surface,
will soon begin to form a tiny head. Although the head is quite small at this point, it has already
established some important yield components. At this stage, the maximum potential number of
spikelets is determined. Sufficient nitrogen (N) should already be available in the root zone at this
growth stage in order to have the maximum effect on the potential number of seeds per head.
Once the embryo head has developed, the first internode will begin to elongate pushing the head up
through the leaf sheaths. This first internode will be hollow. This will be visible before you can
actually feel the first node (joint, located just above the first internode). Prior to this stage the nodes
are all formed but tightly packed together and hard to see.
FHS is the point at which a 1.5 cm (about half-inch) length of hollow stem can first be identified
above the root system and below the developing head (Figure 1). This length is roughly equivalent
to the diameter of a dime, which makes its identification in the field easier. FHS occurs when the
developing head is still below the soil surface, which means that producers have to dig plants out of
the ground to do the examination.
Kansas State University Department of Agronomy
2004 Throckmorton Plant Sciences Center | Manhattan, KS 66506
www.agronomy.ksu.edu | www.facebook.com/KState.Agron | www.twitter.com/KStateAgron

Figure 1. Comparison between wheat at jointing (plant on the left) and wheat at first hollow stem
(plant on the right). Photo courtesy of Jeff Edwards, former Oklahoma State University Extension
Wheat Specialist.
To look for FHS, start by digging up some plants from fields that have not been grazed, such as field
corners or just outside the electric fence. Date of FHS is variety- and field-specific, so it is important to
sample each individual field. Select the largest tillers to examine, and slice the stem open from the
crown area up. Look for the developing head, which will be very small. Next, see if you can find any
hollow stem between the developing head and the crown area. If there is any separation between
the growing point and crown, the hollow stem is elongating. If that separation is 1.5 cm, the wheat
plant is at FHS. FHS occurs between a few days to a week or more prior to jointing, depending on
temperatures.
If the wheat has reached FHS, cattle should be removed to prevent grain yield loss. Yield losses from
grazing after FHS can range from 1 to 5% per day, depending on grazing intensity and the weather
following cattle removal. If cattle removal is followed by cool, moist weather, yield losses will often
average about 1% per day grazed after FHS; if weather is hot, dry, and harsh, yield losses of 5% per
Kansas State University Department of Agronomy
2004 Throckmorton Plant Sciences Center | Manhattan, KS 66506
www.agronomy.ksu.edu | www.facebook.com/KState.Agron | www.twitter.com/KStateAgron

day or more can be expected. In fact, as much as 1.25 bushels per day yield decrease can occur
according to OSU data. It is easy for producers to be late by a few days in removing livestock as they
wait for obvious nodes and hollow stems to appear, and even the first few days can be significant.
Two things are observed when wheat is grazed too long: 1) fewer heads per acre because the
primary tiller has been removed and 2) smaller and lighter heads than expected because leaf area
has been removed. As cattle continue grazing, the wheat plant is stressed and begins to lose some of
the tillers that would produce grain. A little later, if there is not enough photosynthate, the plant
begins aborting the lower spikelets (flowers where seed develops) or some of the florets on each
head. Finally, if there is not enough photosynthate during grain filling, the seed size will be reduced
and if the stress is severe enough, some seed will abort.
Romulo Lollato, Wheat and Forages Specialist
Kansas State University Department of Agronomy
2004 Throckmorton Plant Sciences Center | Manhattan, KS 66506
www.agronomy.ksu.edu | www.facebook.com/KState.Agron | www.twitter.com/KStateAgron

3. First hollow stem update and fall forage wheat yield report
Cattle should be removed from wheat pastures when the crop reaches first hollow stem (FHS).
Grazing past this stage can severely affect wheat yields (for a full explanation, please refer to
eUpdate
article “Optimal time to remove cattle from wheat pastures: First hollow stem” in the Feb. 5, 2016
issue).
First hollow stem update
In order to screen for FHS during this important time in the growing season, the K-State Extension
Wheat and Forages crew measures FHS on a weekly basis in 23 different commonly grown wheat
varieties in Kansas. The varieties are in a September-sown replicated trial at the South Central
Experiment Field near Hutchinson, in cooperation with Gary Cramer, Agronomist-in-Charge of the
Field.
Ten stems are split open per variety per replication (Figure 1), for a total of 40 stems monitored per
variety. The average length of hollow stem is reported in Table 1. As of Feb. 5, all the monitored
varieties have < 0.1 cm of hollow stem and therefore are far from achieving FHS, which occurs at 1.5
cm (about a half-inch). In most cases, there was no separation between the growing point and the
crown area, indicating that the hollow stem did not begin to elongate at this point.
From a FHS perspective, producers grazing wheat in the south central region of Kansas do not have
to worry about removing cattle from wheat pastures at this point, regardless of variety selection.
Figure 1. Ten main wheat stems were split open per replication per variety to estimate first
hollow stem for this report, for a total of 40 stems split per variety. Photo by Romulo Lollato, K-
Kansas State University Department of Agronomy
2004 Throckmorton Plant Sciences Center | Manhattan, KS 66506
www.agronomy.ksu.edu | www.facebook.com/KState.Agron | www.twitter.com/KStateAgron

State Research and Extension.
The intention of this report is to provide producers a weekly update on the progress of first hollow
stem development in different wheat varieties. Producers should use this information as a guide, but
it is extremely important to monitor FHS from an ungrazed portion of each individual wheat pasture
to take the decision of removing cattle from wheat pastures.
Wheat fall forage yield
Forage yield by variety produced during the fall of 2015 is also reported in Table 1. Wheat forage is of
very high quality, with 25-30% protein content, and available at a time of the year when other
forages are low in quantity and quality.
Wheat fall forage production is largely a function of planting date, seeding rate, and moisture and
temperature conditions during the fall. Earlier planting dates at higher seeding rates, coupled with a
warm and moist fall, will result in greater forage yield.
The wheat harvested for fall forage yield in this report was planted at 120 lbs/ac for dual-purpose
production, but was sown relatively late for a dual-purpose system (Sept. 26). According to OSU
research, delaying planting date in two weeks from September 11 can reduce fall forage yields in as
much as 1,000 lbs/acre. Still, the long and open fall of 2015 allowed for mean forage yields measured
on Jan. 6 ranging from about 1,250 to 1,970 lbs/acre (Table 1).
Table 1. Length of hollow stem measured Feb. 1, 2016 and fall forage yield measured on Jan. 6,
2016 of 23 wheat varieties sown Sept. 26, 2015 at the South Central Experiment Field near
Hutchinson. The critical FHS length is 1.5 cm (about a half-inch).
Variety Hollow stem length (cm) Fall forage yield (lbs/acre)
1863 0.04 1,530
Bentley 0.01 1,850
Danby 0.00 1,470
Doublestop CL Plus 0.03 1,610
Duster 0.01 1,660
Everest 0.04 1,400
Gallagher 0.03 1,610
KanMark 0.03 1,230
LCS Chrome 0.01 1,500
LCS Mint 0.01 1,500
LCS Pistol 0.01 1,540
LCS Wizard 0.04 1,580
Overley 0.03 1,290
Kansas State University Department of Agronomy
2004 Throckmorton Plant Sciences Center | Manhattan, KS 66506
www.agronomy.ksu.edu | www.facebook.com/KState.Agron | www.twitter.com/KStateAgron

Ruby Lee 0.03 1,420
SY Flint 0.04 1,760
SY Wolf 0.02 1,420
T158 0.03 1,590
TAM 114 0.01 1,820
WB4303 0.03 1,970
WB4458 0.04 1,250
WB-Cedar 0.02 1,780
WB-Grainfield 0.02 1,330
WB-Redhawk 0.03 1,630
LSD (0.05) 370
Figure 2. Wheat forage yield sampling on Jan. 6, 2016 near Hutchinson. Photo by Romulo
Lollato, K-State Research and Extension.
Romulo Lollato, Wheat and Forages Specialist
Kansas State University Department of Agronomy
2004 Throckmorton Plant Sciences Center | Manhattan, KS 66506
www.agronomy.ksu.edu | www.facebook.com/KState.Agron | www.twitter.com/KStateAgron

DooHong Min, Forage Agronomist
Kansas State University Department of Agronomy
2004 Throckmorton Plant Sciences Center | Manhattan, KS 66506
www.agronomy.ksu.edu | www.facebook.com/KState.Agron | www.twitter.com/KStateAgron

4. Agriculture Technology Day, Herington, Feb. 11
Keep your farming operation up-to-date and efficient by attending K-State Research and Extension’s
“Agriculture Technology Day” on Thursday, Feb. 11 from 10 a.m. to 2:30 p.m., in Herington at the
Herington Community Building, 810 S. Broadway. Topics will include yield mapping, multi-data (soil
type, yield, insects, etc.) inputs, GreenSeeker technologies, big data implications, phone apps for
producers, and more.
K-State Speakers and topics:
Big Data Implications for Farmers – Terry Griffin, Agricultural Economist
Useful farm production apps for your personal smartphone – Ignacio Ciampitti, Crop
Production Specialist
Current drone technologies – Ignacio Ciampitti, Crop Production SpecialistNitrogen
Management
Using GreenSeeker and Grazing Management Phone App – Romulo Lollato, Wheat and
Forages Specialist
Data integration on myFields site – Brian McCornack, Entomologist
Collecting and Using Yield Monitor Data – Lucas Haag, Northwest Area Crops and Soils
Specialist
This event is free, and lunch is provided. Those wishing to attend should RSVP by Feb. 8 to either:
James Coover, Dickinson County Extension Agriculture Agent, 785-263-2001,
Lori Bammerlin, Flint Hills Extension District Agent, 620-767-5136, [email protected]
Rickey Roberts, Marion County Extension Agriculture Agent, 620-382-2325, [email protected]
In addition to K-State Research and Extension, sponsors include Concordia Tractor, Inc.; KanEquip,
Inc.; and Farmers & Drovers Bank in Council Grove.
Kansas State University Department of Agronomy
2004 Throckmorton Plant Sciences Center | Manhattan, KS 66506
www.agronomy.ksu.edu | www.facebook.com/KState.Agron | www.twitter.com/KStateAgron
5. Kansas weather summary for January 2016: Seasonally dry
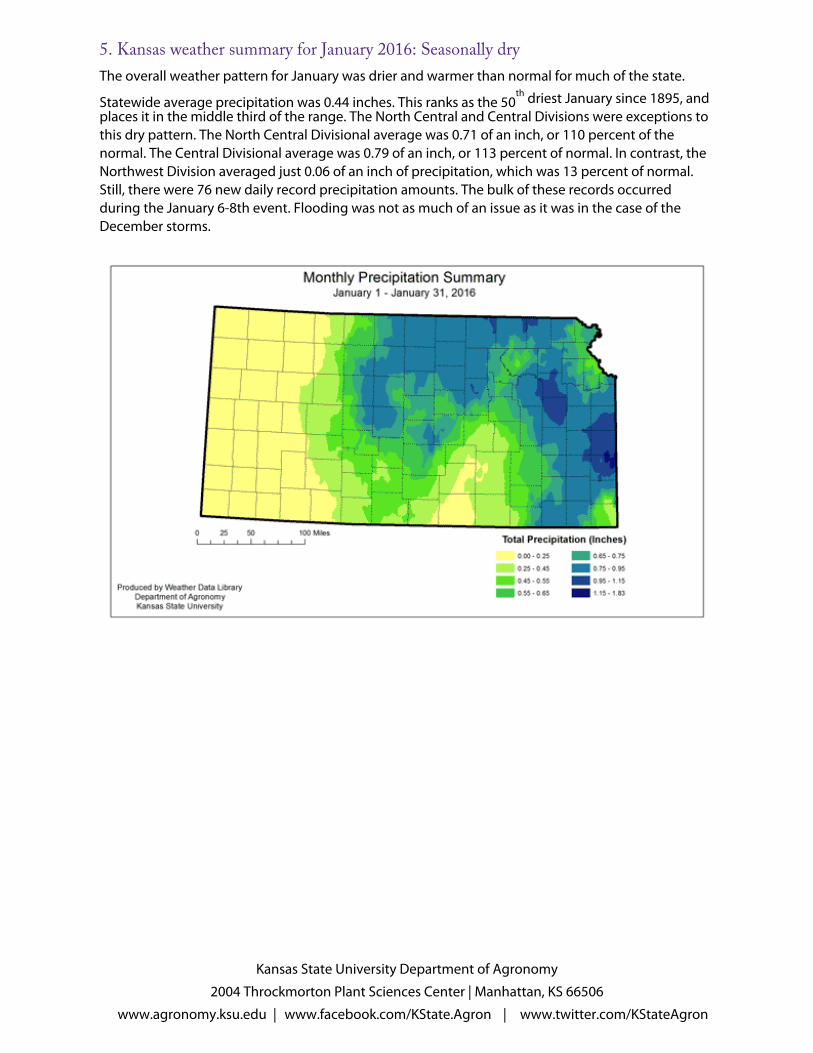
The overall weather pattern for January was drier and warmer than normal for much of the state.
Statewide average precipitation was 0.44 inches. This ranks as the 50
th
driest January since 1895, and
places it in the middle third of the range. The North Central and Central Divisions were exceptions to
this dry pattern. The North Central Divisional average was 0.71 of an inch, or 110 percent of the
normal. The Central Divisional average was 0.79 of an inch, or 113 percent of normal. In contrast, the
Northwest Division averaged just 0.06 of an inch of precipitation, which was 13 percent of normal.
Still, there were 76 new daily record precipitation amounts. The bulk of these records occurred
during the January 6-8th event. Flooding was not as much of an issue as it was in the case of the
December storms.
Kansas State University Department of Agronomy
2004 Throckmorton Plant Sciences Center | Manhattan, KS 66506
www.agronomy.ksu.edu | www.facebook.com/KState.Agron | www.twitter.com/KStateAgron
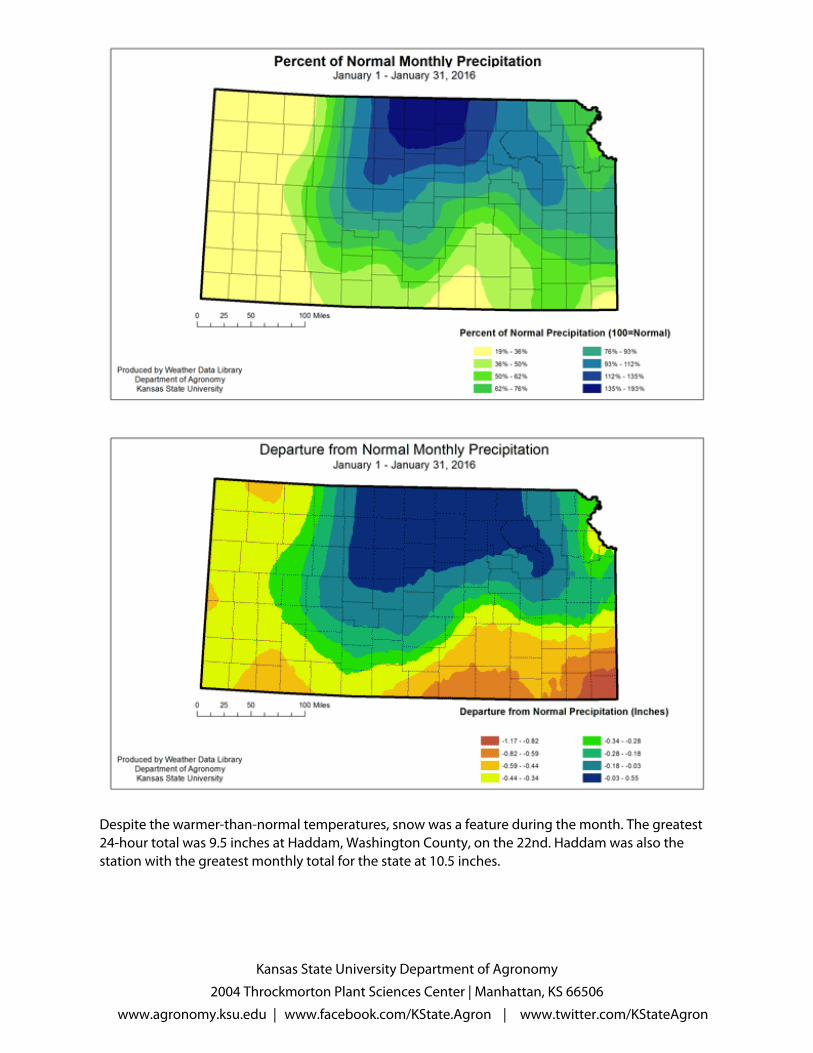
Despite the warmer-than-normal temperatures, snow was a feature during the month. The greatest
24-hour total was 9.5 inches at Haddam, Washington County, on the 22nd. Haddam was also the
station with the greatest monthly total for the state at 10.5 inches.
Kansas State University Department of Agronomy
2004 Throckmorton Plant Sciences Center | Manhattan, KS 66506
www.agronomy.ksu.edu | www.facebook.com/KState.Agron | www.twitter.com/KStateAgron
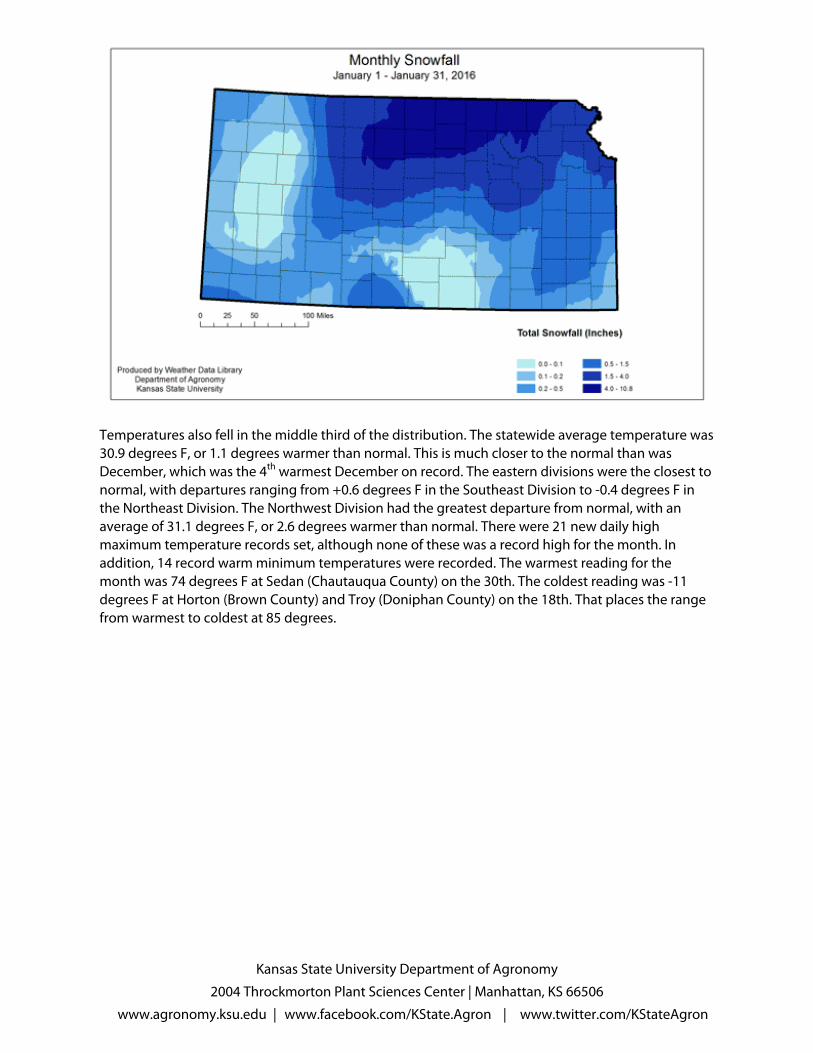
Temperatures also fell in the middle third of the distribution. The statewide average temperature was
30.9 degrees F, or 1.1 degrees warmer than normal. This is much closer to the normal than was
December, which was the 4
th
warmest December on record. The eastern divisions were the closest to
normal, with departures ranging from +0.6 degrees F in the Southeast Division to -0.4 degrees F in
the Northeast Division. The Northwest Division had the greatest departure from normal, with an
average of 31.1 degrees F, or 2.6 degrees warmer than normal. There were 21 new daily high
maximum temperature records set, although none of these was a record high for the month. In
addition, 14 record warm minimum temperatures were recorded. The warmest reading for the
month was 74 degrees F at Sedan (Chautauqua County) on the 30th. The coldest reading was -11
degrees F at Horton (Brown County) and Troy (Doniphan County) on the 18th. That places the range
from warmest to coldest at 85 degrees.
Kansas State University Department of Agronomy
2004 Throckmorton Plant Sciences Center | Manhattan, KS 66506
www.agronomy.ksu.edu | www.facebook.com/KState.Agron | www.twitter.com/KStateAgron
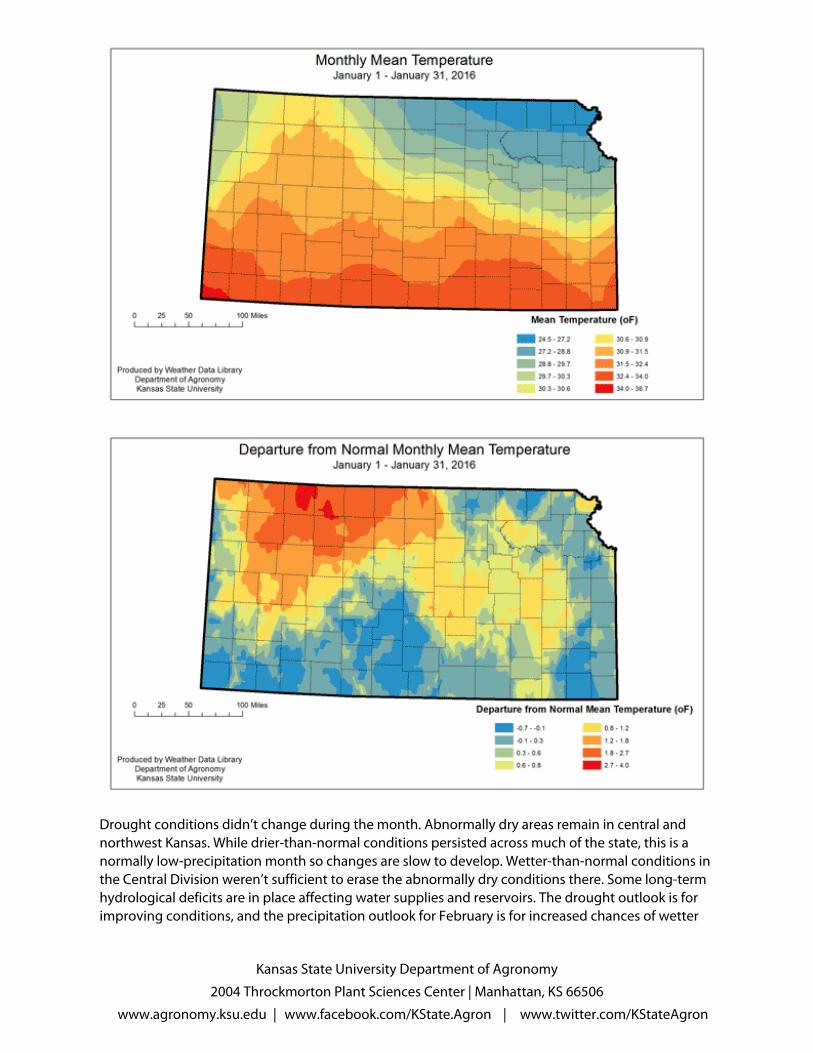
Drought conditions didn’t change during the month. Abnormally dry areas remain in central and
northwest Kansas. While drier-than-normal conditions persisted across much of the state, this is a
normally low-precipitation month so changes are slow to develop. Wetter-than-normal conditions in
the Central Division weren’t sufficient to erase the abnormally dry conditions there. Some long-term
hydrological deficits are in place affecting water supplies and reservoirs. The drought outlook is for
improving conditions, and the precipitation outlook for February is for increased chances of wetter
Kansas State University Department of Agronomy
2004 Throckmorton Plant Sciences Center | Manhattan, KS 66506
www.agronomy.ksu.edu | www.facebook.com/KState.Agron | www.twitter.com/KStateAgron

than normal. However, we are still in a drier period of the year and either above- or below-normal
precipitation will be slow to show impacts.
Kansas State University Department of Agronomy
2004 Throckmorton Plant Sciences Center | Manhattan, KS 66506
www.agronomy.ksu.edu | www.facebook.com/KState.Agron | www.twitter.com/KStateAgron

Table 1
January 2016
Kansas Climate Division Summary
Precipitation (inches) Temperature (
o
F)
January 2016 2016 through January Monthly
Extremes
Division Total Dep.
1
%
Normal
Total Dep.
1
%
Normal
Ave Dep.
1
Max Min
Northw
est
0.06 -0.39 15 0.06 -0.39 15 31.1 2.6 65 2
West
Central
0.13 -0.37 22 0.13 -0.37 22 31.8 2.1 66 3
Southw
est
0.09 -0.38 17 0.09 -0.38 17 34.0 1.9 73 7
Kansas State University Department of Agronomy
2004 Throckmorton Plant Sciences Center | Manhattan, KS 66506
www.agronomy.ksu.edu | www.facebook.com/KState.Agron | www.twitter.com/KStateAgron
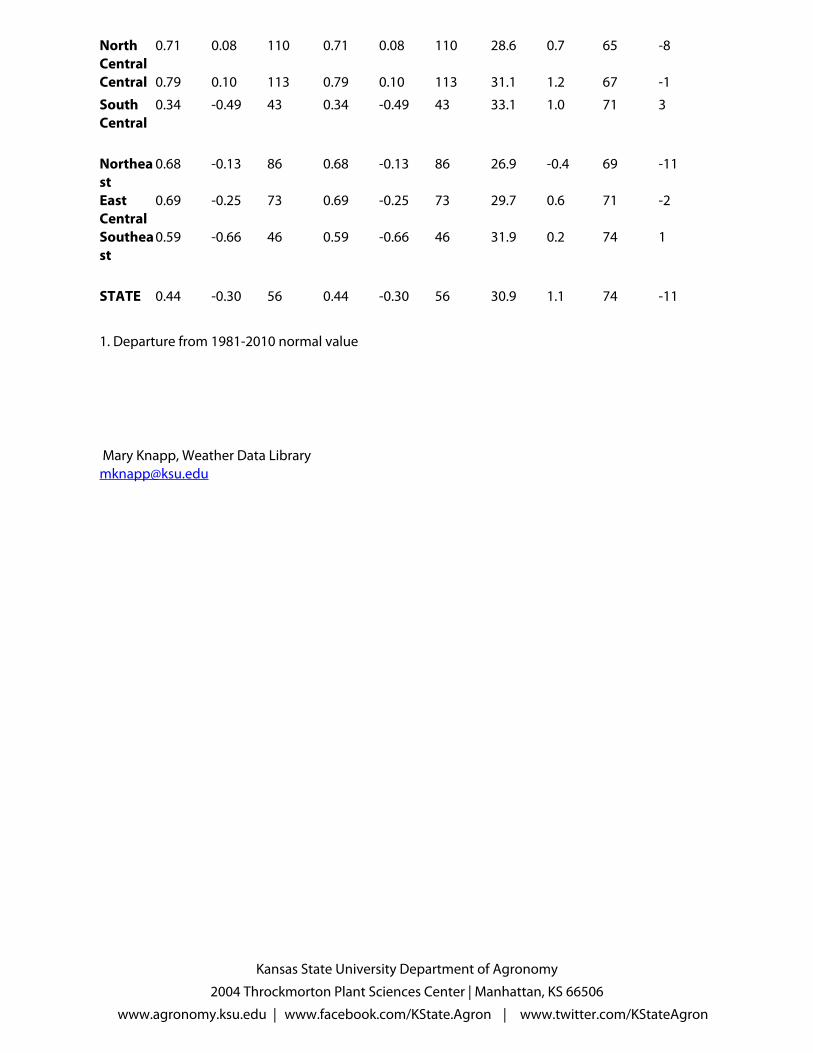
North
Central
0.71 0.08 110 0.71 0.08 110 28.6 0.7 65 -8
Central 0.79 0.10 113 0.79 0.10 113 31.1 1.2 67 -1
South
Central
0.34 -0.49 43 0.34 -0.49 43 33.1 1.0 71 3
Northea
st
0.68 -0.13 86 0.68 -0.13 86 26.9 -0.4 69 -11
East
Central
0.69 -0.25 73 0.69 -0.25 73 29.7 0.6 71 -2
Southea
st
0.59 -0.66 46 0.59 -0.66 46 31.9 0.2 74 1
STATE 0.44 -0.30 56 0.44 -0.30 56 30.9 1.1 74 -11
1. Departure from 1981-2010 normal value
Mary Knapp, Weather Data Library
Kansas State University Department of Agronomy
2004 Throckmorton Plant Sciences Center | Manhattan, KS 66506
www.agronomy.ksu.edu | www.facebook.com/KState.Agron | www.twitter.com/KStateAgron

6
This week’s issue of the eUpdate marks the return of the weekly Vegetation Condition Report maps,
newly revised and improved. These maps can be a valuable tool for making crop selection and
marketing decisions.
The objective of these reports is to provide users with a means of assessing the relative condition of
crops and grassland. The maps can be used to assess current plant growth rates, as well as
comparisons to the previous year and relative to the 27-year average. The report is used by individual
farmers and ranchers, the commodities market, and political leaders for assessing factors such as
production potential and drought impact across their state.
In November 2015, Dr. Nan An, Imaging Scientist, started working on a new version of the Vegetation
Condition Reports (VCR). Dr. An has been collaborating with Dr. Antonio Ray Asebedo, assistant
professor and lab director of the Precision Agriculture Lab in the Department of Agronomy at Kansas
State University, on the new VCR development. Multiple improvements have been made to the VCR,
such as new image processing algorithms with new remotely sensed data from EROS Data Center.
These improvements increase sensitivity for capturing more variability in plant biomass and
photosynthetic capacity. However, the same format as the previous versions of the VCR maps was
retained, thus allowing the transition to be as seamless as possible for the end user. For this spring, it
was decided not to incorporate the snow cover data, which had been used in past years. However,
this feature will be added back at a later date. In addition, production of the Corn Belt maps has been
stopped, as the continental U.S. maps will provide the same data for these areas. Dr. Asebedo and Dr.
An will continue development and improvement of the VCRs and other advanced maps throughout
2016.
The maps in this issue of the newsletter show the current state of photosynthetic activity in Kansas,
and the continental U.S., with comments from Mary Knapp, assistant state climatologist:
Kansas State University Department of Agronomy
2004 Throckmorton Plant Sciences Center | Manhattan, KS 66506
www.agronomy.ksu.edu | www.facebook.com/KState.Agron | www.twitter.com/KStateAgron
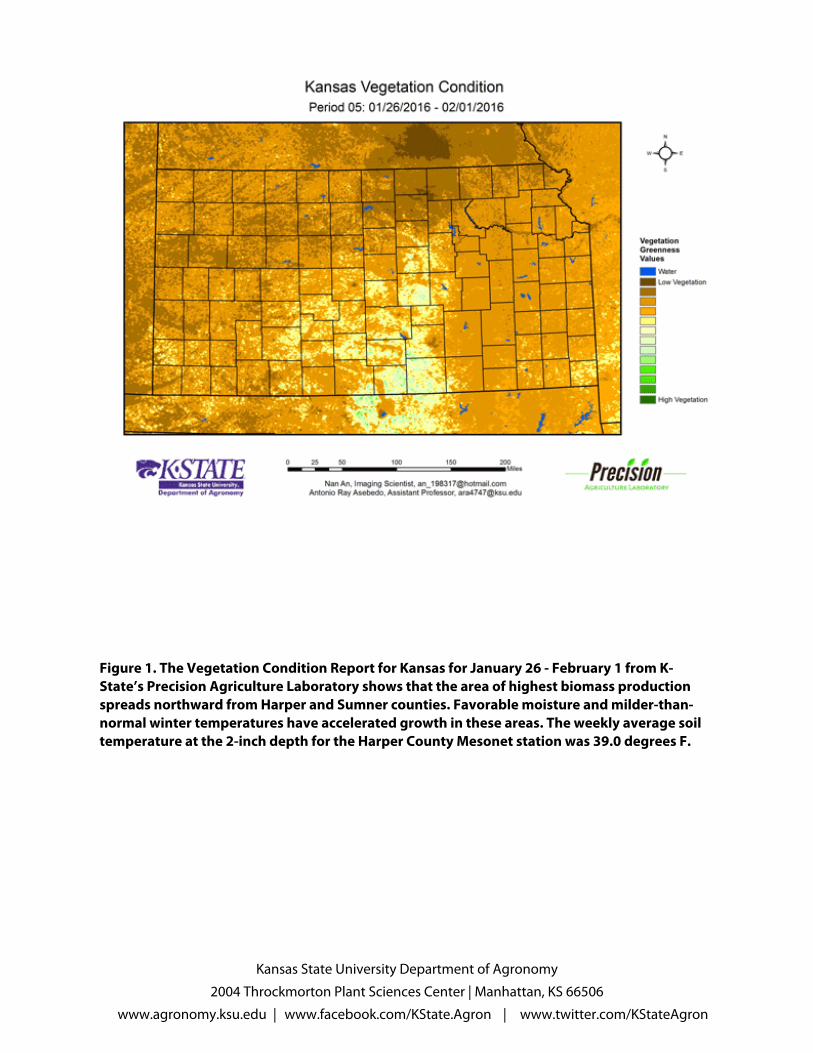
Figure 1. The Vegetation Condition Report for Kansas for January 26 - February 1 from K-
State’s Precision Agriculture Laboratory shows that the area of highest biomass production
spreads northward from Harper and Sumner counties. Favorable moisture and milder-than-
normal winter temperatures have accelerated growth in these areas. The weekly average soil
temperature at the 2-inch depth for the Harper County Mesonet station was 39.0 degrees F.
Kansas State University Department of Agronomy
2004 Throckmorton Plant Sciences Center | Manhattan, KS 66506
www.agronomy.ksu.edu | www.facebook.com/KState.Agron | www.twitter.com/KStateAgron

Figure 2. Compared to the previous year at this time for Kansas, the current Vegetation
Condition Report for January 26 - February 1 from K-State’s Precision Agriculture Laboratory
shows much of the state with higher photosynthetic activity. Only the North Central Division
has lower photosynthetic activity this year. This is mainly the result of snow cover from the
previous winter storm that left snow totals in the 8- to 12-inch range. Impacts from the snow
from the most recent storm won’t be visible until next week’s map.
Kansas State University Department of Agronomy
2004 Throckmorton Plant Sciences Center | Manhattan, KS 66506
www.agronomy.ksu.edu | www.facebook.com/KState.Agron | www.twitter.com/KStateAgron

Figure 3. Compared to the 27-year average at this time for Kansas, this year’s Vegetation
Condition Report for January 26 - February 1 from K-State’s Precision Agriculture Laboratory
shows that most of the state continues to have above-average photosynthetic activity. The
Southwest and South Central Divisions have the largest areas of above-average
photosynthetic activity as moisture continues to be favorable, despite the relatively dry
January. Temperatures have been close to average for the week. As with the previous image,
the reduced vegetative activity in North Central Kansas is largely due to the late January
snowstorm.
Kansas State University Department of Agronomy
2004 Throckmorton Plant Sciences Center | Manhattan, KS 66506
www.agronomy.ksu.edu | www.facebook.com/KState.Agron | www.twitter.com/KStateAgron

Figure 4. The Vegetation Condition Report for the U.S for January 26 - February 1 from K-
State’s Precision Agriculture Laboratory shows that the highest level of photosynthetic
activity is in the Deep South, where favorable temperatures continue. Lack of vegetative
activity in the Pacific Northwest is actually very positive as it indicates a substantial snowpack.
Lingering impacts of the December flooding can be seen in reduced vegetative activity in the
lower Mississippi River Valley.
Kansas State University Department of Agronomy
2004 Throckmorton Plant Sciences Center | Manhattan, KS 66506
www.agronomy.ksu.edu | www.facebook.com/KState.Agron | www.twitter.com/KStateAgron
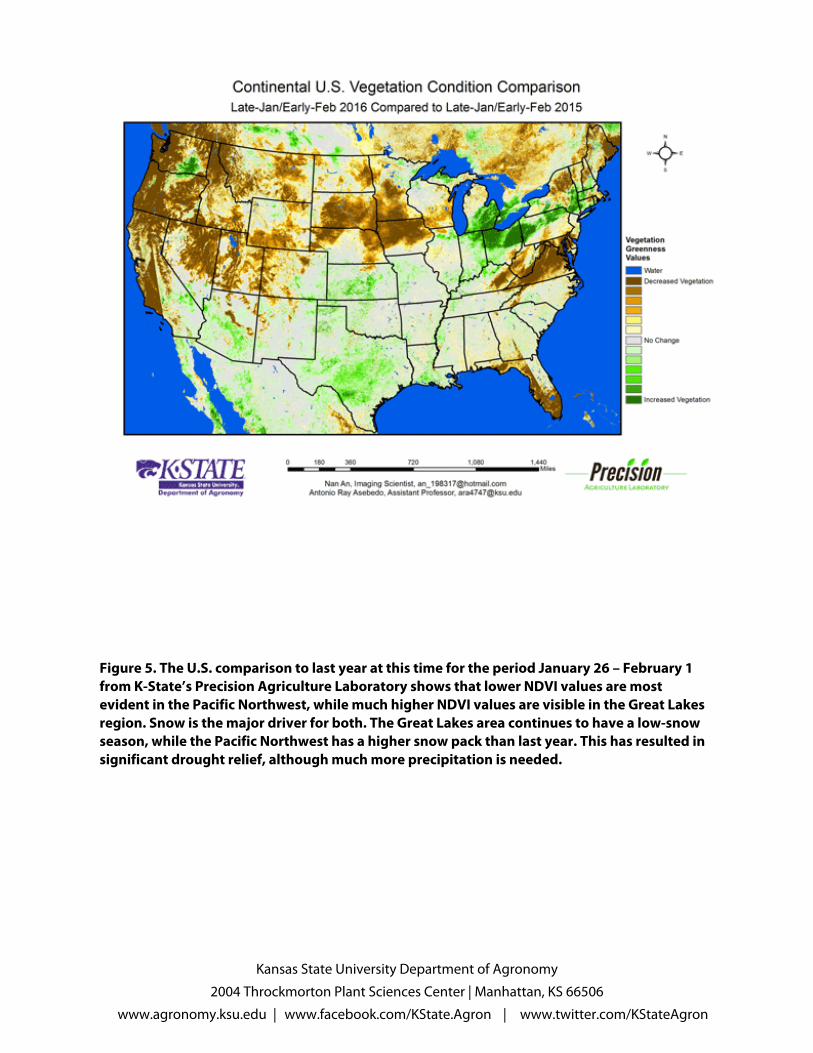
Figure 5. The U.S. comparison to last year at this time for the period January 26 – February 1
from K-State’s Precision Agriculture Laboratory shows that lower NDVI values are most
evident in the Pacific Northwest, while much higher NDVI values are visible in the Great Lakes
region. Snow is the major driver for both. The Great Lakes area continues to have a low-snow
season, while the Pacific Northwest has a higher snow pack than last year. This has resulted in
significant drought relief, although much more precipitation is needed.
Kansas State University Department of Agronomy
2004 Throckmorton Plant Sciences Center | Manhattan, KS 66506
www.agronomy.ksu.edu | www.facebook.com/KState.Agron | www.twitter.com/KStateAgron

Figure 6. The U.S. comparison to the 27-year average for the period January 26 – February 1
from K-State’s Precision Agriculture Laboratory shows below-average photosynthetic activity
in western Washington and Northern Idaho. Decreases in both of these areas are due largely to
a very snowy pattern this winter. The impact of the East Coast blizzard at the end of January is
also clearly visible as reduced NDVI readings. The increased NDVI readings in eastern Montana
and North Dakota is of concern. Snow pack in these areas is below average, and abnormally
dry conditions are beginning to develop in the region.
Mary Knapp, Weather Data Library
Ray Asebedo, Precision Agriculture
Kansas State University Department of Agronomy
2004 Throckmorton Plant Sciences Center | Manhattan, KS 66506
www.agronomy.ksu.edu | www.facebook.com/KState.Agron | www.twitter.com/KStateAgron

Nan An, Imaging Scientist
Powered by TCPDF (www.tcpdf.org)
Kansas State University Department of Agronomy
2004 Throckmorton Plant Sciences Center | Manhattan, KS 66506
www.agronomy.ksu.edu | www.facebook.com/KState.Agron | www.twitter.com/KStateAgron