eur excess liquidity to decline - euro donwtrend -parisbas dec 2010
TRANSCRIPT

Market Economics | Interest Rate Strategy | Forex Strategy 16 December 2010
Market Mover We wish all our readers Happy Holidays and a Happy New Year.
The next edition of Market Mover will be published on 6 January 2011
IMPORTANT NOTICE. Please refer to important disclosures found at the end of this report. Some sections of this report have been written by our strategy teams (shown in blue). Such reports do not purport to be an exhaustive analysis and may be subject to conflicts of interest resulting from their interaction with sales and trading which could affect the objectivity of this report. www.GlobalMarkets.bnpparibas.com
Market Outlook 2-3Fundamentals 4-30
Global: Fire and Ice 4-5
US FOMC: Pricing Out Japan 6-7
US: A Curious Case of Consumer Deleveraging
8-10
ECB: Room at the Top 11-15
UK: HMS QE2 Sunk Before It Was Launched
16-17
SNB: Governing Two Economies 18
Sweden: Further Tightening 19-20
Norway: Hawkish Tone 21-22
Turkey: Reserving Judgement 23-25
Japan: Tankan Points to Soft Patch 26-28
Japan: Marking Up 2010 Growth Forecast
29-30
Interest Rate Strategy 31-59 Bonds: Forecast Update 31-32
USD Rates Outlook in Q1 33-36
US: Ideal Timing for LT Bullish Hedges
37
US: OIS Firm, Libor Under Pressure 38-39
MBS: 2011 Outlook – Status Quo 40-42
EUR: Flattening Trend Will Resume 43
EUR: Excess Liquidity to Decline Next Week
44
EUR: Euribor Red/Greens Opportunities
45
EUR: 2011 EGB Issuance Preview 46-47
Gilts: Strategic Trades for 2011 48
JGBs: Watch the Corporate Sector 49
Global Inflation Watch 50-53
Inflation: Post Mortem 2010 54-56
Technical Analysis 57-58
IR Strategy: Track Record for 2010 59FX Strategy 60-65
Looking for Value in the North 60-62
Technical Strategy: USD Rebound Tests Resistance
63-64
Trading Positions 65
Forecasts & Calendars 66-80 2 Week Economic Calendar 66-67
Key Data Preview 68-74
4 Week Calendar 75
Treasury & SAS Issuance 76-77
Central Bank Watch 78
Economic & Interest Rate Forecasts 79
FX Forecasts 80
Contacts 81
Bond markets are desperately seeking support. Any rebound continues to prove short-lived and the market action shows little sign of a lasting reversal before the turn of the year.
The market is oversold. Although better-than-expected economic data have been fuelling the sharp sell-off, poor year-end liquidity conditions have been a key factor exacerbating the move.
The lows in yields are behind us. We have updated our forecasts to take into account recent moves and the reduction in downside risks to growth as well as upward surprises in inflation in several developed economies.
As real money flows return, we expect yields to decline at the start of 2011, before resuming their rise later in the year.
Curves remain mostly directional as do US/EUR spreads which have widened in the recent sell-off.
JGBs continue to partly resist the sell-off in Treasuries. We expect the belly of the curve to underperform in the near term.
Sterling remains extremely vulnerable. We expect GBPUSD to target the 1.5300/1.5200 area.
USDJPY has not (yet) reacted to the sharp move of the US curve. A rally is likely if US data remain on the strong side.
We expect EURUSD to resume its downtrend going into 2011.
Market Views Current 1 Week 1 Month
UST 10y T-note Yield (%) 3.52 ↔ ↓ 2y/10y Spread (bp) 285 ↔ ↓ EGB 10y Bund Yield (%) 3.06 ↔ ↓ 2y/10y Spread (bp) 199 ↔ ↓ JGB 10y JGB Yield (%) 1.28 ↔ ↔ 2y/10y Spread (bp) 105 ↔ ↔ Forex EUR/USD 1.3218 ↓ ↓ USD/JPY 84.30 ↑ ↑

Cyril Beuzit 16 December 2010Market Mover www.GlobalMarkets.bnpparibas.com
Market Outlook
Analysing the bond market sell-off has not been an easy exercise and, going into the year-end, it remains unclear whether we have seen a fundamental shift or an overdone correction – the reality probably lying in between. As discussed in last week’s Market Mover, the recent sharp sell-off reflects a mix of bad positioning, central bank and political news (US fiscal deal), better economic data (except US payrolls) and year-end market conditions. The difficulty lies in attaching weights to these different factors but, so far, the QE2 sell-off looks similar to the QE1 sell-off seen in the spring of 2009. The recent market action and the risk that upcoming data will continue to surprise to the upside indicate that the lows in yields are behind us (see our updated forecasts in the “Forecasts & Calendars” section). However, although it may remain tough to fight the reflation trade going into 2011, the big picture still favours a low-yield environment. The economic picture does not look as bad as it did six months ago but the US output gap continues to be unusually wide, final demand growth has been lacklustre and the economic recovery faces substantial headwinds. In addition, underlying inflation is very weak and will remain so for some time – the trough on core inflation is still to come. Against this backdrop, policy rates will remain exceptionally low in 2011 with QE2 targeting a rise in inflation expectations.
Both Real and Nominal Yields Should Drop in Q1
-0 .5
0 .0
0 .5
1 .0
1 .5
2 .0
2 .5
3 .0
Ja n-0 3 Jan-05 Jan-07 Jan-09 Ja n-111 .5
2 .0
2 .5
3 .0
3 .5
4 .0
4 .5
5 .0
5 .5C ore , 6m th a headC o re C P I, L H S
core
U S 10y N o min a l
0.0
0 .5
1 .0
1 .5
2 .0
2 .5
3 .0
10y R e al Y ie ld
RY
Source: BNP Paribas
The different measures of inflation expectations indicate that there has not (yet) been a fundamental shift in expectations. The US 5y5y forward breakeven has been rising over the past couple of months while the EUR one has fallen but both remain in the ‘neutral’ zone. The flat(er) 10/30y spreads in both the US and Europe also support this view. Risk appetite remains solid and is still supported by ample global liquidity conditions. Some recent data suggest that investment funds have been switching their allocation from bonds to stocks. But, despite the collapse of the bond market, there has been no acceleration of the bullish momentum in equities. This highlights that, beyond some asset switches, the bond market sell-off has, so far, more to do with wrong positioning − the latest surveys suggest that the market may have to sell off more before reaching a turning point. This probably also indicates concerns about possible political decisions, rising inflation pressures in the emerging world as well as a decoupling between the main western equity indices and the domestic economy (household confidence) which is unlikely to last. Overall, judging from the very poor liquidity in the bond market, year-end pressures to cut balance sheets appear to be a significant factor exacerbating the recent move on Treasuries. The move so far has been primarily cash driven but, over the past couple of sessions, the attendant
Further capitulation by bond markets
Risk appetite remains solid
Looking for signs of a stabilisation on Treasuries
2

Cyril Beuzit 16 December 2010Market Mover www.GlobalMarkets.bnpparibas.com
swap spread widening indicates that convexity hedging flows have also played a role. Peak mortgage negative convexity is in the 3.25 to 3.50% range, which suggests that we may have seen most of the adjustment. From this point onward, convexity flows should become a more modest force. With mortgages finding support, the Treasury market should also become less volatile, which should mark the beginning of the end to this sell-off. Both the 2y and the 5y parts of the curve have cheapened on a forward basis to levels close to the top end of their ranges of the past two years. For instance, the 5y5y rate is around 5.28% within 20bp of the top since end-2008. Therefore, the belly of the curve will offer a buying opportunity… but probably not before the year-end. In Europe the focus will remain on peripheral markets in coming weeks with a big question mark about demand for early 2011 auctions (see “EUR: 2011 EGB Issuance Preview”). Spreads remain off their November highs but renewed tensions look likely with Moody’s putting Spain’s rating on review for a possible downgrade. It is unclear exactly how much progress will be made towards deciding on a permanent rescue framework at the EU Heads of State Summit given the extent of the divergence in views among the individual EU members. We remain neutral on EGBs going into 2011. Regarding the curve, directionality is less significant on rebounds, as the short end has some potential to rally at current levels of yields and the long end is still under pressure in line with the Treasury market. This leads us to see the near-term bias for the curve as neutral to slightly steeper − receiving the 2-10y will be one of our key strategic trades for 2011. The JGB market continues to follow the global bear trend in bond prices, with the 10y yield now just below the psychologically important 1.3% level. Correction pressures appear to have abated slightly, however, with many investors prepared to buy into weakness at current levels. The super-long sector has moved back into its historical range and the 10y sector has also experienced a significant sell-off. Much is now likely to depend on the extent to which yields rise for the short- to medium-term JGBs that constitute the core of banks' bond portfolios. The BoJ Monetary Policy Board will meet on Monday and Tuesday (20-21 December), but is not expected to announce any new measures. Monetary policy still looks likely to remain highly accommodative for quite some time to come and JGB market participants will therefore be focusing most of their attention on rising stock prices (fuelled by an improvement in economic sentiment) and the move in overseas rate markets. Sterling is now in an extremely vulnerable position as the negative mix of higher inflation and slower growth dynamics in the UK economy leave the BoE in a difficult position. Indeed, the sharp spike higher in the BoE’s Inflation Expectations Survey is a particular concern suggesting that sterling is now set to come under increasing pressure. We see GBPUSD as at significant risk as the US continues to produce positive data surprises which, together with the rise in yields, is providing the USD significant support. We expect GBPUSD to target the 1.5300/1.5200 area. However, it is interesting to note that USDJPY, which is traditionally the currency pair most closely correlated with the US yield curve, has remained in a range over the past couple of weeks despite the sharp rise in yields. This seems to be the result of Japanese investors’ continued hedging of their bond portfolios. However, if US data remain strong, this could be enough to encourage investors to unwind their hedges, triggering a sharp move higher in USDJPY. The EUR is also expected to remain weak as the latest data provide further evidence of increasing economic divergence within the eurozone. We expect EURUSD to extend the major down trend into the end of the year and through the first half of 2011 with the USD set to embark on a broad-based rebound.
Early 2011 buying opportunities
Renewed stress on EMU peripherals
JGBs are still outperforming in the sell-off
GBP is at risk
EURUSD to resume its downward trend
USDJPY to push higher
3

Marcelo Carvalho 16 December 2010Market Mover www.GlobalMarkets.bnpparibas.com
Global: Fire and Ice Some say the world will end in fire, some
say in ice.
The pendulum is swinging between these two extremes.
Market attention may shift from fears that things are getting too cold in developed economies…
…to worries that things are getting too hot in emerging markets.
The problem is that policy stimulus in developed economies is fuelling overheating in emerging markets, which are resisting FX appreciation.
To quote from a poem by Robert Frost, “Some say the world will end in fire, Some say in ice.” Earlier in the year, observers feared that things might get too cold in developed economies. But as double-dip fears fade, attention may shift to concerns that emerging markets are getting too hot. Ultra-loose policies in developed economies are fuelling capital flows into emerging markets. But as EM policymakers are resisting FX appreciation, inflation pressures will intensify if central banks fall behind the curve and let their economies overheat. In all, are we moving from concerns of recession ice in developed economies to worries of inflation fire in emerging markets?
Hot and cold The cold front from the North seems mostly behind us now. Earlier in the year, many feared a double dip in growth performance, particularly in the US. However, in part on the heels of further policy accommodation in developed economies, global growth seems to be finding a better footing. Double-dip fears have faded, notwithstanding concerns about sovereign risk in some eurozone economies.
But the Fed's monetary easing is affecting markets well beyond the US. Along with a weaker USD and rising commodity prices, capital flows to emerging markets (EM) have intensified. The resulting currency appreciation across emerging markets has prompted policymakers to introduce measures to cool these inflows, and to tighten monetary policy by less than domestic demand considerations in EM alone would dictate. In many cases, EM policymakers are increasingly resorting to measures other than outright rate hikes (such as higher reserve
requirements and credit restrictions), perhaps fearing the currency implications of rate increases. Specific experiences vary from country to country, but the broader theme seems the same across emerging markets, from Turkey to China, including Brazil.
How will it play out? Our take: global liquidity remains abundant, with policies accommodative in the developed world. Capital flows to emerging markets remain strong. Pressures for FX appreciation in EM persist. But EM policymakers are resisting these FX pressures, and many EM central banks are falling behind the curve. Policies remain too loose for too long. Inflation pressures are building across EM. The question is how policymakers will ultimately respond.
In all, market attention may well swing from fears that things could get too cold in developed economies to worries that things are getting too hot in emerging markets. No one wants a repeat of the great depression of the 1930s. But the inflationary 1970s were not that great either.
Hell is other people At the heart of this ice-and-fire global policy dilemma are the tensions between what is seen as best for developed economies at the current stage of the global business cycle and what is seen as best for emerging markets – especially when countries fail to fully consider the global implications of their individual choices. In that context, each country thinks it is pursuing its own best interests, oblivious to international spillovers. Hell is others.
The US judges it is doing what is best for the US economy (QE). If others (such as China) don't let their currencies appreciate against the USD, that is their problem. For the US, the problem is lack of FX flexibility in EM. My currency, your problem. Hell is emerging markets.
By contrast, EM policymakers judge they should not just allow ultra-loose monetary conditions in developed economies to fuel bubbles in their markets. Emerging market countries do not want FX to appreciate beyond what they judge is consistent with fundamentals. They cannot – and will not – allow their policies to be dictated by Washington DC. Hell is the US.
As often in economic debates, there is some truth on both sides. The US is right: it is harder and more painful to engineer global rebalancing if EM policymakers resist FX adjustment. But EMs are also
4

Marcelo Carvalho 16 December 2010Market Mover www.GlobalMarkets.bnpparibas.com
right: it is hard to rely on the USD as a reliable reserve currency for the international monetary system when the cornerstone country is pursuing domestic policies which are not optimal for others.
Real FX adjustments tend to prevail in the long run – if not via nominal appreciation, then via higher inflation. The problem with the inflation route is that it is much more painful – and probably more destabilising.
In a nutshell, can EM policymakers deliver stability without a credible and steady US policy anchor as the centre of the international monetary system? What happens if things fall apart and the centre cannot hold?
Conclusion Market attention may well start to swing from one extreme to the other – from concerns of recession ice in developed economies to worries of inflation fire in emerging markets. At the heart of the matter: policy stimulus in the developed world is fuelling overheating in emerging markets while EM policymakers are resisting currency appreciation. All claim that hell is other people.
5

Julia Coronado 16 December 2010Market Mover www.GlobalMarkets.bnpparibas.com
US FOMC: Pricing Out Japan
Bold moves by US policymakers have led investors to price out the Japan scenario, suggesting that higher rates are here to stay.
The FOMC confirmed its resolve by interpreting incoming data conservatively and signalling its commitment to QE2 in the December FOMC statement.
That said, we think the FOMC is correct in being cautious about incoming data. With the strong patch in spending yet to show reliable follow-through to job creation, forecasts of significantly above-trend growth and fears of inflation being built into longer-term rates are probably overdone.
Interest rates continued their steady march higher after the December FOMC meeting as markets continued to price out any possibility the US could get stuck in a Japanese-style scenario. US policymakers have shown a remarkable commitment to stimulate the US economy; incoming data suggests some they are getting some traction. The FOMC made only minor changes to its policy statement and stayed the course on QE2. The 10-year Treasury is up more than 100 basis points since the announcement of QE2 (see Chart 1). However, that only puts it back at the levels seen in April, when the recovery looked to be on a moderate but reasonably steady track. Meanwhile, equities are up more than 3% since the November FOMC meeting and nearly 11% for the year. The rise is helping to offset house price declines and keep the recovery in household net worth on track. November retail sales represented yet another data point suggesting we will get a solid gain in GDP in Q4. We have revised up our forecast to 2.6% q/q saar.
The data flow on balance has been encouraging. But we have yet to see good follow-through to job growth, something the FOMC emphasised in its statement. Consumers have maintained a saving rate just under 6% throughout the recovery. Thus the recent data will prove to be a fleeting firm patch unless we see hiring pick up. We think consumer spending and jobs are likely to meet in the middle, with consumer spending growth continuing to post moderate gains (rather than accelerating) and the jobs picture improving gradually. While some of the volatility in rates markets owes to technical factors,
the message from US policymakers has been clear. They will prevent a Japanese scenario at all costs and the market is reacting accordingly. This enthusiasm from investors is not without its risks. Higher rates threaten the recovery in an already-fragile housing market and higher headline inflation will erode some of the stimulus. Nonetheless, we seem to have left the Japanese scenario behind for now.
There were very few changes to the December FOMC statement. The Fed chose a conservative interpretation of recent data following the recent back-up in the unemployment rate. In November, the FOMC said that information received since the last meeting confirmed that the "pace of the recovery in output and employment continues to be slow". In the latest statement, it indicated that information received since the last meeting confirms that the "recovery is continuing, though at a rate that has been insufficient to bring down unemployment”.
Chart 1: Rates Rising Rapidly
Source: Reuters EcoWin Pro
Chart 2: Retail Sales Firm, Need Follow-Through to Jobs
Source: Reuters EcoWin Pro
6

Julia Coronado 16 December 2010Market Mover www.GlobalMarkets.bnpparibas.com
Other changes were also modest. While the Fed previously noted that housing starts continue to be depressed, this time it said the housing sector continues to be depressed. This broader reference includes the decline in prices we have seen of late. Having previously said that measures of underlying inflation have trended lower in recent quarters, this time it said that these measures “have continued to trend downward”. This perhaps suggests a slightly more entrenched dynamic. There were few to no changes in the policy paragraphs and the parameters of the QE2 programme are virtually unchanged. As expected, the Fed remains cautious and sought to send a signal of steady policy.
Retail sales posted a solid gain in November, rising 0.8% after an upward-revised 1.7% increase in October. As shown in Chart 2, gains in consumer spending have not come at the expense of a lower saving rate. Therefore any acceleration in consumer spending growth will likely be dependent on continued improvement in the labour market. We expect that to be forthcoming but gradual. The US
economy lacks the cyclical turbo boosters of manufacturing, construction and finance that fuelled job growth early in prior recoveries; another engine of job creation has yet to come forward.
One encouraging sign on the jobs front came from the NFIB survey of small businesses for November. This reported that a net 4% of small companies are planning to hire. This may sound small, and it is. However, it is up from the record low of -10% reached in March 2009 and has been rising steadily in recent months. Small businesses have been another sector weighing on the recovery. Thus a move into positive territory confirms that the economy is making headway in its healing process and downside risks are diminishing.
The pricing out of Japan likely means that higher rates are here to stay. However, we think the forecasts of significantly above-trend growth and fears of inflation being built into longer-term Treasury rates are probably overdone.
7
Yelena Shulyatyeva 16 December 2010Market Mover www.GlobalMarkets.bnpparibas.com
US: A Curious Case of Consumer Deleveraging
The Q3 Flow of Funds Accounts indicate a
pick-up in household net worth. This was driven by capital gains on equity, partially offset by losses in real estate wealth on the back of house price declines. Also boosting net worth were continued declines in both consumer credit and net mortgage borrowing.
The recent pick-up in retail spending has been supported by gradual improvement in the labour market. However, consumer deleveraging still represents a speed limit.
Three main factors appear to have contributed to ongoing declines in revolving credit: households continue to default on their obligations; they are paying off a larger share of their balances each month; and they are financing less of their new spending with credit.
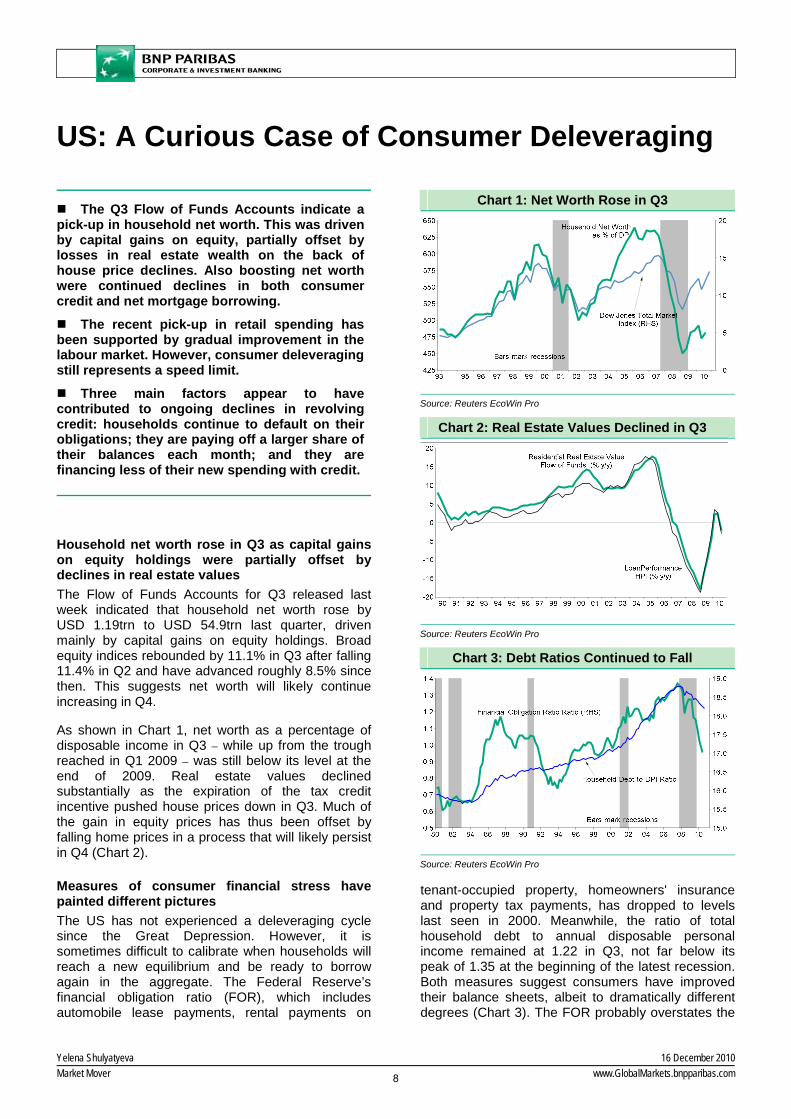
Household net worth rose in Q3 as capital gains on equity holdings were partially offset by declines in real estate values The Flow of Funds Accounts for Q3 released last week indicated that household net worth rose by USD 1.19trn to USD 54.9trn last quarter, driven mainly by capital gains on equity holdings. Broad equity indices rebounded by 11.1% in Q3 after falling 11.4% in Q2 and have advanced roughly 8.5% since then. This suggests net worth will likely continue increasing in Q4.
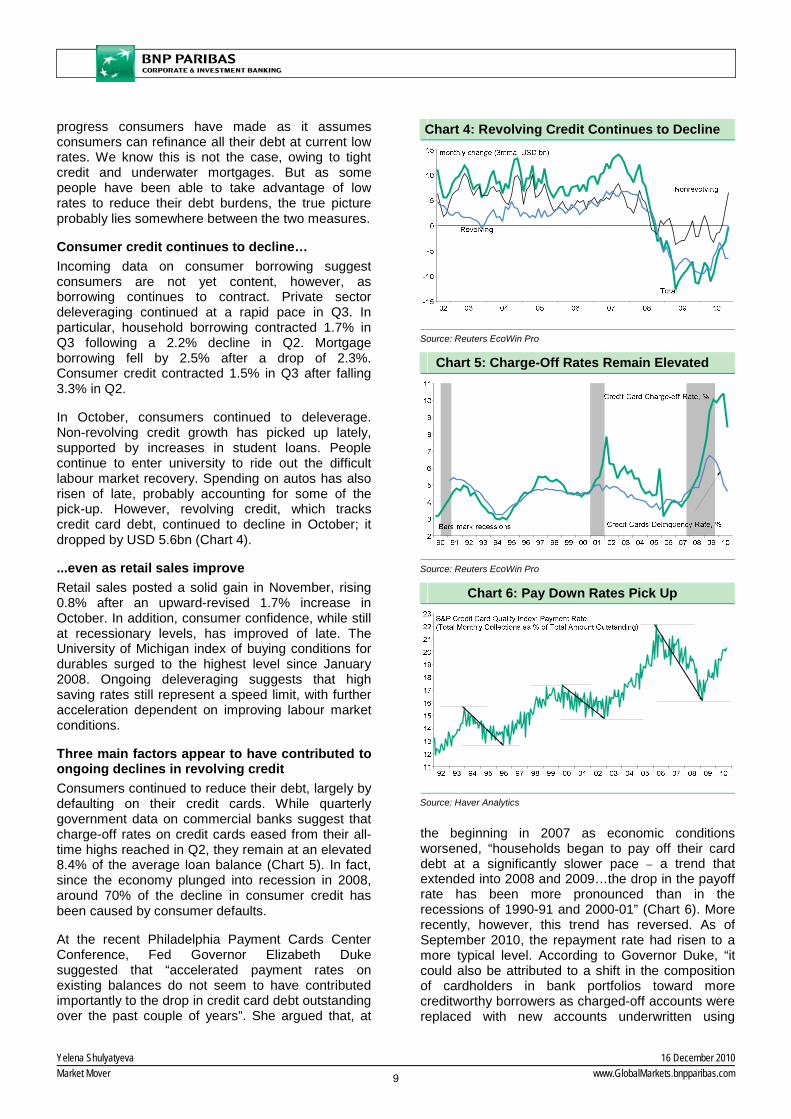
As shown in Chart 1, net worth as a percentage of disposable income in Q3 – while up from the trough reached in Q1 2009 – was still below its level at the end of 2009. Real estate values declined substantially as the expiration of the tax credit incentive pushed house prices down in Q3. Much of the gain in equity prices has thus been offset by falling home prices in a process that will likely persist in Q4 (Chart 2).
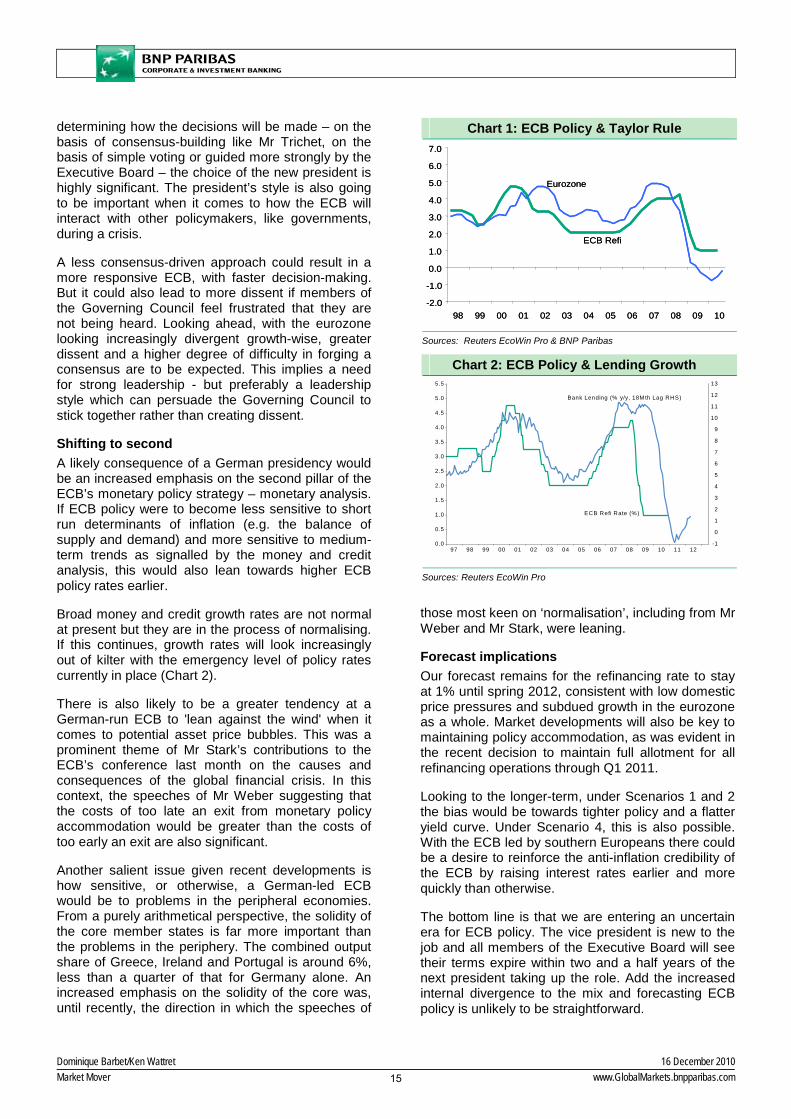
Measures of consumer financial stress have painted different pictures The US has not experienced a deleveraging cycle since the Great Depression. However, it is sometimes difficult to calibrate when households will reach a new equilibrium and be ready to borrow again in the aggregate. The Federal Reserve’s financial obligation ratio (FOR), which includes automobile lease payments, rental payments on
tenant-occupied property, homeowners' insurance and property tax payments, has dropped to levels last seen in 2000. Meanwhile, the ratio of total household debt to annual disposable personal income remained at 1.22 in Q3, not far below its peak of 1.35 at the beginning of the latest recession. Both measures suggest consumers have improved their balance sheets, albeit to dramatically different degrees (Chart 3). The FOR probably overstates the
Chart 1: Net Worth Rose in Q3
Source: Reuters EcoWin Pro
Chart 2: Real Estate Values Declined in Q3
Source: Reuters EcoWin Pro
Chart 3: Debt Ratios Continued to Fall
Source: Reuters EcoWin Pro
8
Yelena Shulyatyeva 16 December 2010Market Mover www.GlobalMarkets.bnpparibas.com
progress consumers have made as it assumes consumers can refinance all their debt at current low rates. We know this is not the case, owing to tight credit and underwater mortgages. But as some people have been able to take advantage of low rates to reduce their debt burdens, the true picture probably lies somewhere between the two measures.
Consumer credit continues to decline… Incoming data on consumer borrowing suggest consumers are not yet content, however, as borrowing continues to contract. Private sector deleveraging continued at a rapid pace in Q3. In particular, household borrowing contracted 1.7% in Q3 following a 2.2% decline in Q2. Mortgage borrowing fell by 2.5% after a drop of 2.3%. Consumer credit contracted 1.5% in Q3 after falling 3.3% in Q2.
In October, consumers continued to deleverage. Non-revolving credit growth has picked up lately, supported by increases in student loans. People continue to enter university to ride out the difficult labour market recovery. Spending on autos has also risen of late, probably accounting for some of the pick-up. However, revolving credit, which tracks credit card debt, continued to decline in October; it dropped by USD 5.6bn (Chart 4).
...even as retail sales improve Retail sales posted a solid gain in November, rising 0.8% after an upward-revised 1.7% increase in October. In addition, consumer confidence, while still at recessionary levels, has improved of late. The University of Michigan index of buying conditions for durables surged to the highest level since January 2008. Ongoing deleveraging suggests that high saving rates still represent a speed limit, with further acceleration dependent on improving labour market conditions.
Three main factors appear to have contributed to ongoing declines in revolving credit Consumers continued to reduce their debt, largely by defaulting on their credit cards. While quarterly government data on commercial banks suggest that charge-off rates on credit cards eased from their all-time highs reached in Q2, they remain at an elevated 8.4% of the average loan balance (Chart 5). In fact, since the economy plunged into recession in 2008, around 70% of the decline in consumer credit has been caused by consumer defaults.
At the recent Philadelphia Payment Cards Center Conference, Fed Governor Elizabeth Duke suggested that “accelerated payment rates on existing balances do not seem to have contributed importantly to the drop in credit card debt outstanding over the past couple of years”. She argued that, at
the beginning in 2007 as economic conditions worsened, “households began to pay off their card debt at a significantly slower pace – a trend that extended into 2008 and 2009…the drop in the payoff rate has been more pronounced than in the recessions of 1990-91 and 2000-01” (Chart 6). More recently, however, this trend has reversed. As of September 2010, the repayment rate had risen to a more typical level. According to Governor Duke, “it could also be attributed to a shift in the composition of cardholders in bank portfolios toward more creditworthy borrowers as charged-off accounts were replaced with new accounts underwritten using
Chart 4: Revolving Credit Continues to Decline
Source: Reuters EcoWin Pro
Chart 5: Charge-Off Rates Remain Elevated
Source: Reuters EcoWin Pro
Chart 6: Pay Down Rates Pick Up
Source: Haver Analytics
9

Yelena Shulyatyeva 16 December 2010Market Mover www.GlobalMarkets.bnpparibas.com
stricter criteria”. Regardless of the cause, consumer credit is currently being paid down at an aggressive rate, particularly when one considers that the uptrend in pay downs between 2003 and 2007 owed in large part to the substitution of home equity debt for credit card borrowing. Both home equity and credit card balances are declining.
Indeed, there has been a recent surge in “cash-in” refinancing whereby homeowners have been reducing their principal balances through a refinancing transaction. This could be the result of tighter lending standards and declining home values, with lenders requiring homeowners to reduce their loan balances to access lower mortgage rates. However, it stands in stark contrast to the peak of the housing bubble in 2006 when “cash-outs” (refinances resulting in loan amounts that were at least 5% greater than the amortised unpaid principal balance of the original loan) accounted for almost 90% of all refinancing transactions. As the housing bubble burst and home values dropped, the cash-out ratio dropped to 18.5% as of Q3 2010 – the lowest level since Freddie Mac records began in 1985. In contrast, the proportion of cash-ins surged to 33% in Q3 (Chart 7).
Some of the deleveraging can be attributed to a reduction in new borrowing. According to the Federal Reserve Board’s quarterly Senior Loan Officer Opinion Survey, despite a modest easing in lending standards, demand for consumer loans remains weak (Chart 8). According to the quarterly report on household debt and credit from the New York Fed, the number of inquiries for new consumer credit is significantly down from its pre-recession levels (Chart 9 – I).
Supply factors have also likely contributed to the decline in overall credit card outstanding balances. Households may be charging less because they had less credit available. Indeed, the same survey shows a significant decline in credit card limits since the peak in mid-2008 (Chart 9 – II).
The relationship between consumers and credit is undergoing a fundamental change. While a solid holiday shopping season should help keep the recovery on track, there are no indications that credit will soon become the accelerator it once was.
Chart 7: Cash-In Refinances Surged This Year
Source: Reuters EcoWin Pro
Chart 8: Demand for Credit Remains Sluggish
Source: Haver Analytics
Chart 9: Supply Factors Also Limit Credit Increases
Source: Reuters EcoWin Pro
10

Dominique Barbet/Ken Wattret 16 December 2010Market Mover www.GlobalMarkets.bnpparibas.com
ECB: Room at the Top The ECB will have a new president from the
beginning of November 2011.
As the process of choosing a new president is lengthy, speculation over who it will be could continue for some time yet.
A German president remains the most likely outcome, with Axel Weber the front runner. But alternative candidates are also in the frame.
Uncertainty over the change of leadership, plus increased divergence within the eurozone, implies a more uncertain policy outlook.
The structure The Governing Council of the ECB is made up of six Executive Board members and the heads of each of the national central banks (NCBs) in the eurozone. The number of NCBs currently stands at 16 but will expand to 17 from the start of 2011 when Estonia joins the eurozone.
The six members of the Executive Board of the ECB serve a non-renewable eight-year term. They can be removed only in the case of incapacity or serious misconduct. The names of the current members are in Table 1, along with the expiry dates for their terms.
Jean-Claude Trichet’s eight-year term as president of the ECB will expire on 31 October 2011. Choosing his replacement may be a lengthy process (Table 2). Who will get the job, when we will find out and what this means for future policy are obviously a source of considerable interest for markets.
The nomination process According to the ECB statutes, the members of the Executive Board should be persons of "recognised standing and professional experience in monetary and banking matters" (Article 283 of the EU Treaty, effective since the ratification of the Lisbon Treaty). The Executive Board members are chosen by the European Council, voting on a qualified majority basis, on the recommendation of the Council and after the European Parliament and the Governing Council of the ECB have expressed their opinions.
The timetable for choosing Mr Trichet to be president of the ECB back in 2003 offers a template for how the procedure will evolve this time. Mr Trichet’s term began in November 2003. The European Council officially chose him in mid-July that year. By the end
of July, the ECB had adopted a positive opinion on his nomination. The European Parliament approved the choice on 23 September, less than two weeks after the EU Commission for Economic and Monetary Affairs had heard the candidate.
Table 1: Executive Board Members
Name Nationality Term Ends J-C Trichet France President 31/10/2011 V Constancio Portugal V/President 31/05/2018 G Tumpel-Gugerell Austria Member 31/05/2011 J-M Gonzales-Paramo Spain Member 31/05/2012 L Bini-Smaghi Italy Member 31/05/2013 J Stark Germany Member 31/05/2014 Source: ECB
Table 2: Timetable for Naming the New ECB President
Steps Likely timing
Heads of State discussions May-June 2011
European Council official approval of Candidate June-July 2011
ECB expresses opinion July 2011
Monetary & Economic Affairs Commission of EU Parliament hears the candidate September 2011
EU Parliament expresses opinion September 2011
European Council formal nomination September 2011
New ECB President takes up duties 1 November 2011
Source: BNP Paribas
Table 3: Governing Council Membership
Country NCB Head Total Number of
GC Members % of
Members% of
Capital KeyGermany A Weber 2 9.1 27.1 France C Noyer 2 9.1 20.4
Italy M Draghi 2 9.1 17.9 Spain MF Ordoñez 2 9.1 11.9
Netherlands N Wellink 1 4.5 5.7 Belgium G Quaden 1 4.5 3.5 Greece G Provopoulos 1 4.5 2.8 Austria E Nowotny 2 9.1 2.8
Portugal C Costa 2 9.1 2.5 Finland E Liikanen 1 4.5 1.8 Ireland P Honohan 1 4.5 1.6
Slovakia J Makuch 1 4.5 1.0 Slovenia M Kranjek 1 4.5 0.5
Luxembourg Y Mersch 1 4.5 0.3 Cyprus A Orphanides 1 4.5 0.2 Malta M Bonello 1 4.5 0.1
Source: ECB, BNP Paribas
11

Dominique Barbet/Ken Wattret 16 December 2010Market Mover www.GlobalMarkets.bnpparibas.com
On the basis of the 2003 timetable, it is most likely that the new president of the ECB will be chosen at the Heads of State and Government meeting in May or June next year. It is likely that the nomination will seep through to the public domain before this as the European Council will want to ensure the candidate has sufficient support beforehand. Negative opinions from the ECB or the European Parliament would not necessarily block the appointment but would be very damaging to the authority of the proposed president and to the credibility of the ECB.
An earlier indication of who will be the new president is also possible. This is because the term of current Executive Board member Mrs Tumpel-Gugerell will come to an end in May next year, so a successor will have to be nominated soon. This could be discussed as soon as the EU Summit on 16-17 December.
The nationality of the proposed successor to Mrs Tumpel-Gugerell may be an indication of the likely nationality of the new president. Media reports have suggested that Germany and France will discuss the choice of the new Executive Board member and the new president in tandem. The suggestion is that a deal could be struck in favour of the ECB president being German as long as a France national fills the vacancy on the Executive Board, replacing Mrs Tumpel-Gugerell but with a high-profile portfolio (such as the responsibility for economic analysis).
The role of ECB president The ECB president has just one vote like the other members but has considerably more influence given his or her position in setting the agenda and chairing the Governing Council meetings. The ECB president is obliged to present and explain the policy decisions of the Governing Council in the press conference that follows the policy-setting meetings (which usually occur on the first Thursday of each month). This is a key part of the job and an important issue for who is chosen – discussed below.
The president also has to deliver a testimony, and answer questions, in the European Parliament twice a year. He or she will usually attend the meetings of finance ministers of the eurozone, an opportunity to make recommendations to finance ministers about other aspects of economic policy. One of the features of Mr Trichet’s ECB presidency has been less public disagreement between the two camps.
Who is in the frame? In theory, any person from the eurozone who meets the relevant criteria can be president. But in practice, choosing a President is a complicated process given the horse-trading between member states over the key roles and responsibilities within the eurozone.
What we know is that both previous presidents were experienced heads of national central banks at the time of their nomination. Having run a central bank is an obvious advantage. But it is not a necessity.
Nationality is probably the more important issue. The presidency of the ECB has not been held by the largest economy, Germany, which is one reason why the initial focus of speculation over who will be the new president centred on the Bundesbank’s current president, Axel Weber.
At the time of writing, we see four main scenarios for the choice of the new president of the ECB which we discuss in turn below. The probabilities which we have attached to each outcome are very fluid given the political nature of the decision.
Box 1: ECB Governing Council - Voting Rights The principle for voting at the Governing Council is one member, one vote. However, with the increasing number of new eurozone members, the ECB has secured specific voting rules insuring that no more than 21 people take part in the voting (the voting system is described in the Article 10 of Protocol 4 annexed to the EU Treaty).
Since January 2009, the number of eurozone member states has exceeded 15 and the new set of rules can apply. However, the Governing Council can decide to stick to the simple one member one vote system as long as the number of member countries remains below 18.
The system works as follows:
Every Executive Board member always has a voting right.
The Governors of the NCBs in the main five countries have at least four permanent voting rights. The main five countries are defined according to two criteria: the size of GDP (with a weighting of 5/6); and the size of the national financial system (for the remaining 1/6 weighting). The so-called first group is currently composed of Governors from Germany, France, Italy, Spain and the Netherlands.
The second group is composed of the Governors from the other central banks and they share the remaining 10 or 11 vote rights on a rotating basis. The frequency of rotation of the first group cannot be lower than that of the second group. As a result the first group currently has 5 voting rights and the second group only 10. From January next year, 10 of the 12 members of the second group will have a voting right. Only when an 18th country joins EMU will the first group lose the fifth voting right it currently holds.
Different rules, with three groups of Governors, will apply from the day the monetary union reaches 22 member countries. These rules are also defined in Article 10. They are intended to prevent the voting rights of the largest countries being overly diluted as the monetary union expands its membership.
Source: EU Treaty, effective since the ratification of the Lisbon Treaty
12

Dominique Barbet/Ken Wattret 16 December 2010Market Mover www.GlobalMarkets.bnpparibas.com
Scenario 1: Axel Weber (40%)
The initial front runner for the position and a very credible candidate in many respects, Mr Weber has the requisite experience of having running a central bank, is a highly respected economist and is, of course, German. The suggestion is that, should Mr Weber secure the presidency, the current Executive Board member Jürgen Stark would then return to the Bundesbank to become its new president.
There have never been two people from the same country on the ECB Executive Board simultaneously, though there is no formal obstacle to this happening. Indeed, as Table 3 highlights, the larger countries are under-represented in relation to their contributions to the ECB’s capital.
At one stage, a Weber presidency was perceived by some to be a ‘done deal’, with Chancellor Merkel a strong supporter of his candidacy. It has looked less of a certainty recently, however, related in part to Mr Weber’s tendency to express a different view to that of the Governing Council as a whole. His dissent has been most vocal in relation to the Securities Markets Programme (or SMP).
His reputation as a ‘hawk’ is also a concern for the countries in most economic and financial distress given the potential implications for future monetary policy. The reservations over Mr Weber have led to speculation of an alternative outcome…
Scenario 2: Another German (20%)
Germany feels that, as the largest economy in the eurozone, it is its turn to hold the ECB presidency. If Mr Weber is too controversial a candidate, then an option would be for another German to take the role. A potential alternative is the current ECB Executive Board member Jürgen Stark. Though he has never been the head of a central bank, he has extensive experience in senior roles at the Bundesbank and the ECB.
His candidacy, however, is complicated by a couple of issues. First, his reputation as a policy hawk. If this is an obstacle to Mr Weber securing the position, then the same reservations may apply to Mr Stark. However, as he has not showed the same degree of public dissent as Mr Weber, he is probably viewed as more of a team player. A second problem is his role on the Executive Board. His eight-year term does not expire until mid-2014. While responsibilities within the Executive Board can be switched around, starting a new term as the president is a different issue.
Our understanding, having spoken to the ECB, is that it would not be possible to nominate an existing Executive Board member for another position on the
Board until his or her current term had expired. A former Executive Board member could, however, be nominated to be president.
Other high-profile German nationals have also been floated as possible candidates, including the current CEO of the EFSF, Klaus Regling. He has extensive experience in the financial sector, including at the German Finance Ministry and the IMF. But he has not run a central bank, or even had a senior position at a central bank, which is an issue. Another is the practical constraint of his current role at the EFSF.
The implication of the probabilities attached to the first two scenarios is that we believe it is more likely than not that a German will be the next president of the ECB. But it is not a done deal. Another member state of the eurozone may yet take the top job. This leads us to the third scenario…
Scenario 3: A Compromise Candidate (20%)
Contrary to perceptions before the formation of the ECB that its first president would be a German, the job went to the Netherlands. The head of the Dutch central bank, Wim Duisenberg, got the job, though only for half a term (i.e. four years). Germany took the role of Chief Economist for the highly influential Otmar Issing.
Mr Duisenberg was a compromise option. He was a highly experienced central banker, from a core member state and sufficiently hawkish to placate Germany.
Such a compromise option is also possible this time. Indeed, there is a long tradition in Europe of a ‘small country’ compromise candidate emerging late in the day when there has been insufficient support for the ‘big country’ front runner. It happened only recently with the choice of Herman Van Rompuy as president of the EU Council.
As the outgoing president is French, another French national is highly unlikely to secure the role. To some extent this also applies to the Netherlands, given the nationality of the first ECB president. Would it really be fair that a country representing just 6% of total eurozone output accounted for two of the first three ECB presidents? This would seem to rule out the current head of the Netherlands central bank, Nout Wellink, who would otherwise be seen as a credible candidate for the compromise option.
That the newly appointed vice president of the ECB, the former head of the Central Bank of Portugal, Mr Constancio, is from southern Europe is an additional complication. This makes it more likely that the new president will be from a northern European country, a
13

Dominique Barbet/Ken Wattret 16 December 2010Market Mover www.GlobalMarkets.bnpparibas.com
key reason why Germany apparently pushed hard for Mr Constancio to get the job of vice president.
With so many member states seemingly out of the running, this has led to speculation that the current head of Finland’s central bank, Mr Liikanen, could become the next president of the ECB. He has the requisite experience of running a central bank and is from a ‘neutral’ part of the eurozone. He also worked for the European Commission from 1995 to 2004, so has plenty of EU experience.
But is he the right fit given the specific requirements of the role? Mr Duisenberg often struggled in dealing with the media. The position of ECB president needs someone who can deal effectively and comfortably with a bombardment of questions on a variety of issues very shortly after the conclusion of what are likely to be, given increasing divergence within the eurozone, difficult discussions on the Governing Council. Does he have the experience required to steer the Governing Council in these difficult times?
The same question marks also apply to other ‘small country’ names which have periodically cropped up in speculation, largely centred on Benelux countries. One could argue, however, that these countries are already over-represented in senior EU positions.
The best compromise option would be for Mr Trichet to stay in the role. The advantages of continuity in these highly uncertain times are obvious. How about extending his term for another four years, say, given the exceptional circumstances? There are, however, procedural obstacles. The terms of Executive Board members are non-renewable which would appear to rule this option out.
The nationality of the current ECB vice president is one of the obstacles in the way of the last of our four scenarios…
Scenario 4: Mario Draghi (20%)
In a number of respects, Mr Draghi is a very credible candidate for the ECB presidency. He ticks many of the most important boxes. He has been a highly effective head of the Banca D’Italia, is the president of the Financial Stability Board, earned a doctorate in economics from MIT, worked at the World Bank for many years and unlike most of the candidates, has extensive private sector experience also.
In contrast to some on the ECB Governing Council, he has kept a remarkably low profile in his near five-year spell running the Banca D’Italia. A key issue in the way of his candidacy is the national politics associated with choosing the leadership of the ECB. Having two Southern Europeans at the helm is not acceptable for some.
Tough call Given the issues highlighted above, predicting who will get the job is not straightforward. Weighing up all the information available, our bottom line assumption is that the most probable outcome is that the next president of the ECB will come from Germany. We are aware that Mr Weber’s candidacy has been damaged by his outspokenness. But given the lack of practical alternatives, we still believe that a Weber presidency is the single most likely outcome.
It is unlikely in our view that the next president of the ECB will come from southern Europe. This is not a refection of Mr Draghi’s candidacy. As stated above, his credentials are impressive. Rather, it reflects the politics of the eurozone.
Policy implications An obvious worry is that if a German with a hawkish reputation takes the presidency, this will lead to a tighter than otherwise monetary policy stance – much too tight potentially for the periphery. This is more of a concern now than in the past. In the early days of EMU, the German economy struggled. Now, it looks structurally strong. The unemployment rate is at its lowest in almost two decades and skill shortages in fast growing sectors risk generating upward pressure on labour costs and inflation.
While the ECB sets monetary policy for the eurozone as a whole it is reasonable to assume that members of the Governing Council will be influenced by what is happening in their own countries or those near by. There is some historical experience of this in respect of German influence on ECB policy.
That the German economy was going strong in early 2008 – GDP surged by over 5% annualised in Q1 – and wage pressures were building, were contributory factors behind the ECB’s decision to raise rates in July 2008 in the eye of the financial storm. Germany had pushed hard – rightly, in our opinion at the time – for a faster pace of tightening in 2006 and 2007 and this frustration was instrumental in the decision to hike in summer 2008.
Germany was also highly influential on policy in the early 2000s but in the other direction. Taylor Rule analysis suggests that rates were low in relation to eurozone needs in the early years of EMU (Chart 1), when the German economy was performing poorly. This contributed to the formation of asset price bubbles in other countries which have now burst with such devastating consequences.
More divided ECB policy is not determined by the president alone. But inasmuch as the president shapes the agenda for Governing Council meetings and is influential in
14
Dominique Barbet/Ken Wattret 16 December 2010Market Mover www.GlobalMarkets.bnpparibas.com
determining how the decisions will be made – on the basis of consensus-building like Mr Trichet, on the basis of simple voting or guided more strongly by the Executive Board – the choice of the new president is highly significant. The president’s style is also going to be important when it comes to how the ECB will interact with other policymakers, like governments, during a crisis.
A less consensus-driven approach could result in a more responsive ECB, with faster decision-making. But it could also lead to more dissent if members of the Governing Council feel frustrated that they are not being heard. Looking ahead, with the eurozone looking increasingly divergent growth-wise, greater dissent and a higher degree of difficulty in forging a consensus are to be expected. This implies a need for strong leadership - but preferably a leadership style which can persuade the Governing Council to stick together rather than creating dissent.
Shifting to second A likely consequence of a German presidency would be an increased emphasis on the second pillar of the ECB’s monetary policy strategy – monetary analysis. If ECB policy were to become less sensitive to short run determinants of inflation (e.g. the balance of supply and demand) and more sensitive to medium-term trends as signalled by the money and credit analysis, this would also lean towards higher ECB policy rates earlier.
Broad money and credit growth rates are not normal at present but they are in the process of normalising. If this continues, growth rates will look increasingly out of kilter with the emergency level of policy rates currently in place (Chart 2).
There is also likely to be a greater tendency at a German-run ECB to 'lean against the wind' when it comes to potential asset price bubbles. This was a prominent theme of Mr Stark’s contributions to the ECB’s conference last month on the causes and consequences of the global financial crisis. In this context, the speeches of Mr Weber suggesting that the costs of too late an exit from monetary policy accommodation would be greater than the costs of too early an exit are also significant.
Another salient issue given recent developments is how sensitive, or otherwise, a German-led ECB would be to problems in the peripheral economies. From a purely arithmetical perspective, the solidity of the core member states is far more important than the problems in the periphery. The combined output share of Greece, Ireland and Portugal is around 6%, less than a quarter of that for Germany alone. An increased emphasis on the solidity of the core was, until recently, the direction in which the speeches of
those most keen on ‘normalisation’, including from Mr Weber and Mr Stark, were leaning.
Forecast implications Our forecast remains for the refinancing rate to stay at 1% until spring 2012, consistent with low domestic price pressures and subdued growth in the eurozone as a whole. Market developments will also be key to maintaining policy accommodation, as was evident in the recent decision to maintain full allotment for all refinancing operations through Q1 2011.
Looking to the longer-term, under Scenarios 1 and 2 the bias would be towards tighter policy and a flatter yield curve. Under Scenario 4, this is also possible. With the ECB led by southern Europeans there could be a desire to reinforce the anti-inflation credibility of the ECB by raising interest rates earlier and more quickly than otherwise.
The bottom line is that we are entering an uncertain era for ECB policy. The vice president is new to the job and all members of the Executive Board will see their terms expire within two and a half years of the next president taking up the role. Add the increased internal divergence to the mix and forecasting ECB policy is unlikely to be straightforward.
Chart 1: ECB Policy & Taylor Rule
-2.0
-1.0
0.0
1.0
2.0
3.0
4.0
5.0
6.0
7.0
98 99 00 01 02 03 04 05 06 07 08 09 10
ECB Refi
Eurozone
-2.0
-1.0
0.0
1.0
2.0
3.0
4.0
5.0
6.0
7.0
98 99 00 01 02 03 04 05 06 07 08 09 10
ECB Refi
Eurozone
Sources: Reuters EcoWin Pro & BNP Paribas
Chart 2: ECB Policy & Lending Growth
97 98 99 00 01 02 03 04 05 06 07 08 09 10 11 12-1
0
1
2
3
4
5
6
7
8
9
10
11
12
13
0.0
0.5
1.0
1.5
2.0
2.5
3.0
3.5
4.0
4.5
5.0
5.5
Bank Lending (% y/y, 18M th Lag RHS)
ECB Refi Rate (% )
Sources: Reuters EcoWin Pro
15

Alan Clarke and Paul Mortimer-Lee 16 December 2010Market Mover www.GlobalMarkets.bnpparibas.com
UK: HMS QE2 Sunk Before It Was Launched
We have changed our Bank of England
monetary policy forecast.
Given higher than expected inflation and the threat this poses to inflation expectations, we no longer expect the Bank to engage in a second round of quantitative easing.
Given our view that GDP will grow much more slowly during 2011 than the BoE’s central projection, we still believe that the first interest rate hike is a long way off (2012).
Nonetheless, if inflation expectations rise abruptly and upside risks to wage inflation emerge, there is a risk that the BoE will hike Bank Rate during 2011.
Enough is enough We have revised our BoE monetary policy forecast. We had expected downward surprises on GDP growth during 2011 to provoke a downward revision to the Bank’s medium-term inflation outlook, opening the door to a second phase of quantitative easing. However, Tuesday’s upward surprise on inflation was the final nail in the coffin.
CPI inflation accelerated by 0.1pp to 3.3% y/y, contrary to earlier indications that we might have seen a slight deceleration. It was a bad number which is only likely to get worse in the coming months. Rising utility bills and petrol prices will add to inflation in December, before the VAT hike to 20% pushes inflation even higher in January. We had expected CPI inflation to peak at 3.6% y/y in February. However, following this week’s surprise, the peak is likely to be 3.8% y/y with a significant risk of 4% y/y.
There have been persistent upward surprises on current inflation over the last two years. While it is typically the medium-term outlook for inflation that matters most for BoE policy, near-term inflation is posing an ever-bigger threat to inflation expectations and wages – with implications for inflation further ahead. The fact remains that around 1pp of current inflation is related to increases in indirect taxes including VAT. The latter will eventually drop out of the y/y calculation. Nonetheless, when this happens (in 2012), the likely undershoot relative to target is looking more and more marginal as time passes.
End-of-year appraisal Given the time of year, it is worthwhile assessing what the BoE has done well and what it has done badly. To its credit, QE1 worked. The economy has recovered more swiftly than expected and unemployment is lower than feared. Contrary to concerns that the economy might flirt with the risk of deflation, the UK seems about the furthest from deflation of the industrialised economies.
However, what the BoE hasn’t done particularly well is forecast inflation. Chart 1 shows where inflation has actually been compared with the BoE’s projection 2 years earlier. The shaded bars show that it is incredibly rare for inflation to be lower than the Bank projects. In fact, on average inflation has been around 0.75pp points higher than the Bank’s projection. Given this, there should be a tendency for the Bank to aim a little higher at the medium-term horizon.
US lessons The key reason the BoE hasn't begun QE2 already is worries about inflation expectations. If inflation stays above 2% for a long time, people will doubt it is truly aiming at 2%. If we go to 4%, they definitely won't believe it.
Also, the Bank will have learned from the Fed's experience that QE can have a perverse effect on bond yields through inflation expectations, with breakevens having risen considerably since Bernanke made his Jackson Hole speech (by around 50bp). Rising inflation expectations are the last thing the BoE needs.
Chart 1: BoE CPI Inflation Forecasting Error 2-Years Ahead
Source: Reuters EcoWin Pro, BoE
16

Alan Clarke and Paul Mortimer-Lee 16 December 2010Market Mover www.GlobalMarkets.bnpparibas.com
Nominal GDP has been increasing at close to a 6% y/y pace over the last year, and it is questionable whether the Bank would want to boost this further. The labour market in recent months has seen very good job growth, and there is anecdotal evidence of pay freezes being less widespread than before. Wage growth will probably pick up.
Faster-than-expected inflation seems to reflect to an important degree a bigger pass-through of the exchange rate shock from sterling's depreciation. Why has this happened? It could be that inflationary expectations have held up better than normal, possibly as a result of BoE policy. It may be that the output gap is a lot smaller than the fall in output might suggest. Neither argues for more QE.
Conclusion Despite our view that GDP growth will disappoint expectations during 2011, the obstruction to further QE now looks too big. Hence we no longer expect QE2 to be launched. We continue to believe that disappointing growth will prevent the first interest rate hike from being delivered any time soon (not until 2012). In particular, the Bank has aimed high with regard to near-term inflation. Nonetheless, if inflation expectations do rise appreciably and there are signs that this is pushing wage inflation higher, there is clearly a risk that the MPC begins to tighten policy during 2011.
17

Eoin O’Callaghan 16 December 2010Market Mover www.GlobalMarkets.bnpparibas.com
SNB: Governing Two Economies
As widely expected, the SNB left the policy target unchanged in December.
The central bank remains extremely sensitive to the strength of the franc and the stress in the euro area periphery.
The SNB continues to expect a marked slowdown in the coming quarters and has revised its inflation forecast down further.
We think growth will surprise to the upside but a hike as soon as March looks very challenging.
The timing of the first hike remains dependent on the exchange rate.
As widely expected, the SNB left the policy target and band unchanged in December. The strength of the franc continues to delay policy normalisation. The dilemma for the SNB is setting a single policy variable for two sectors of the economy that are experiencing very different monetary conditions. For the domestic economy, policy looks too loose. But monetary conditions are tight for exporters. The two sectors’ performance will diverge accordingly – domestic demand will contribute more to growth than in the past, net trade less. If any of the franc’s current strength reflects rate hike expectations, the SNB clearly doesn’t want to validate them. Despite the strength of the economic data since the last meeting, the SNB continues to expect a marked slowdown in growth in 2011. The monetary authority expects growth to slow to 1.5% in 2011 from 2.5% this year. We see risk to the upside of that 2011 forecast (we have 2%). Sectors focused on the domestic market are in a strong position to respond to the SNB’s zero interest rate policy – employment growth is rising and neither the private nor public sector is characterised by the imbalances evident in many parts of Europe. In addition, while net trade should contribute less to growth on the combination of a strong franc and robust domestic demand growth, Swiss exports will benefit vibrant emerging-market demand. The SNB also revised down the medium-term outlook for inflation further. 2012 inflation is now expected at 1% rather than 1.2%. We are less sanguine about medium-term inflation. With a smaller output gap than elsewhere in Europe (we put it at c.0.5%), closing more quickly, the drag from spare capacity is fading quite rapidly. The prospect of stronger inflation in the future is evident in the SNB’s
preferred gauge of core inflation – dynamic factor inflation – which rose from 0.1% y/y in October 2009 to 1.0% last month. Shorter-term measures of momentum in the GDP deflator are also picking up. With the franc delivering monetary tightening independent of SNB policy, the outlook for policy is dependent on the outlook for the exchange rate. Were the franc to depreciate significantly, then given the strength of domestic fundamentals, we would expect the SNB to hike. But if the franc stays strong, the first increase will come later as the SNB awaits further evidence on the robustness of the economy. Since July, we have had the first hike in March 2011. That now looks very challenging, particularly given the subdued level of the SNB’s medium-term inflation forecast. It is also tricky to think of reasons to expect the franc to soften between now and then; there are widespread expectations of an escalation in market tensions early in 2011 when a large amount of euro area sovereign debt supply comes onto the market. We will revisit our call first thing in the New Year – but the risk is clearly that the first hike comes later in 2011.
Chart 1: SNB Policy Rates
Source: Reuters EcoWin Pro
Chart 2: SNB Inflation Forecasts
Source: Reuters EcoWin Pro
18
Gizem Kara 16 December 2010Market Mover www.GlobalMarkets.bnpparibas.com
Sweden: Further Tightening The Riksbank delivered a 25bp rate hike at
its December meeting, taking the policy rate to 1.25%.
There were upward revisions to the GDP and inflation forecasts for 2010 and 2011.
But there were no changes to policy rate projections as the Bank noted that economic prospects remain “largely the same as in October”.
We believe the policy rate is still low given economic fundamentals.
Therefore, we continue to expect another 25bp rate hike in February.
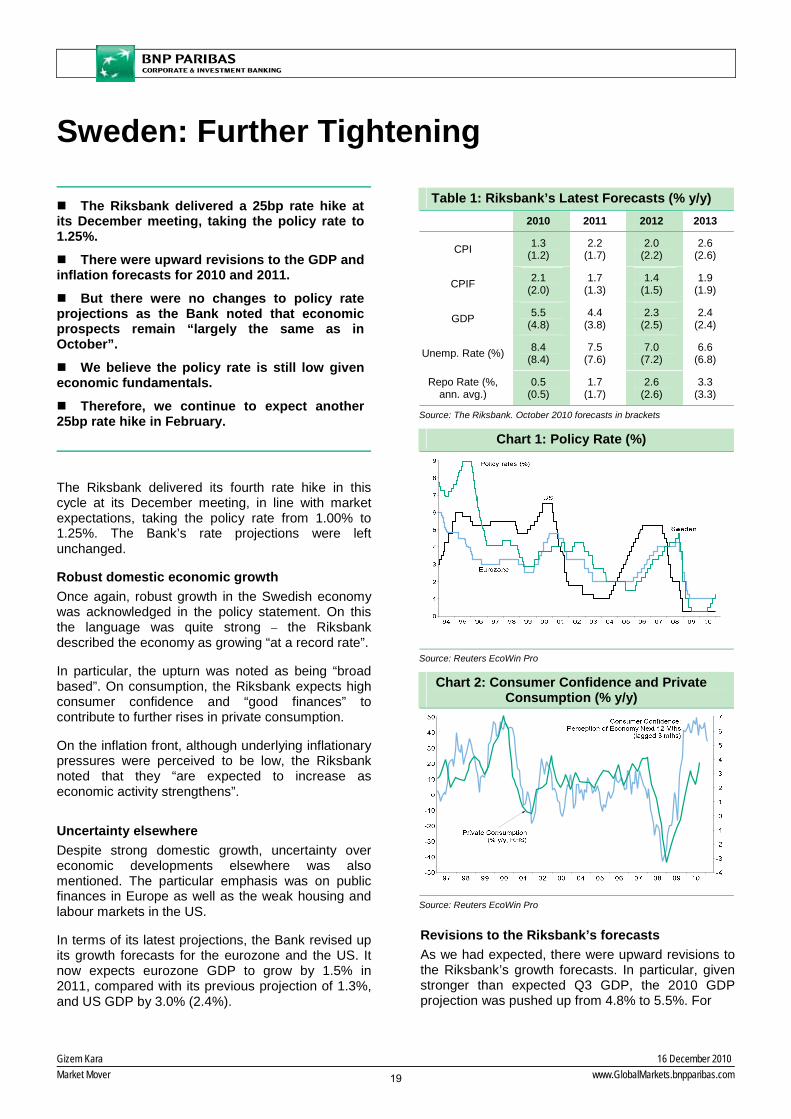
The Riksbank delivered its fourth rate hike in this cycle at its December meeting, in line with market expectations, taking the policy rate from 1.00% to 1.25%. The Bank’s rate projections were left unchanged.
Robust domestic economic growth Once again, robust growth in the Swedish economy was acknowledged in the policy statement. On this the language was quite strong – the Riksbank described the economy as growing “at a record rate”.
In particular, the upturn was noted as being “broad based”. On consumption, the Riksbank expects high consumer confidence and “good finances” to contribute to further rises in private consumption.
On the inflation front, although underlying inflationary pressures were perceived to be low, the Riksbank noted that they “are expected to increase as economic activity strengthens”.
Uncertainty elsewhere Despite strong domestic growth, uncertainty over economic developments elsewhere was also mentioned. The particular emphasis was on public finances in Europe as well as the weak housing and labour markets in the US.
In terms of its latest projections, the Bank revised up its growth forecasts for the eurozone and the US. It now expects eurozone GDP to grow by 1.5% in 2011, compared with its previous projection of 1.3%, and US GDP by 3.0% (2.4%).
Revisions to the Riksbank’s forecasts As we had expected, there were upward revisions to the Riksbank’s growth forecasts. In particular, given stronger than expected Q3 GDP, the 2010 GDP projection was pushed up from 4.8% to 5.5%. For
Table 1: Riksbank’s Latest Forecasts (% y/y) 2010 2011 2012 2013
CPI 1.3 (1.2)
2.2 (1.7)
2.0 (2.2)
2.6 (2.6)
CPIF 2.1 (2.0)
1.7 (1.3)
1.4 (1.5)
1.9 (1.9)
GDP 5.5 (4.8)
4.4 (3.8)
2.3 (2.5)
2.4 (2.4)
Unemp. Rate (%) 8.4 (8.4)
7.5 (7.6)
7.0 (7.2)
6.6 (6.8)
Repo Rate (%, ann. avg.)
0.5 (0.5)
1.7 (1.7)
2.6 (2.6)
3.3 (3.3)
Source: The Riksbank. October 2010 forecasts in brackets
Chart 1: Policy Rate (%)
Source: Reuters EcoWin Pro
Chart 2: Consumer Confidence and Private Consumption (% y/y)
Source: Reuters EcoWin Pro
19
Gizem Kara 16 December 2010Market Mover www.GlobalMarkets.bnpparibas.com
2011, the Riksbank now expects GDP to grow by 4.4%, up from 3.8% previously. These upward revisions again led to lower unemployment rate forecasts. The 2011 and 2013 forecasts were revised down by 0.1-0.2pp.
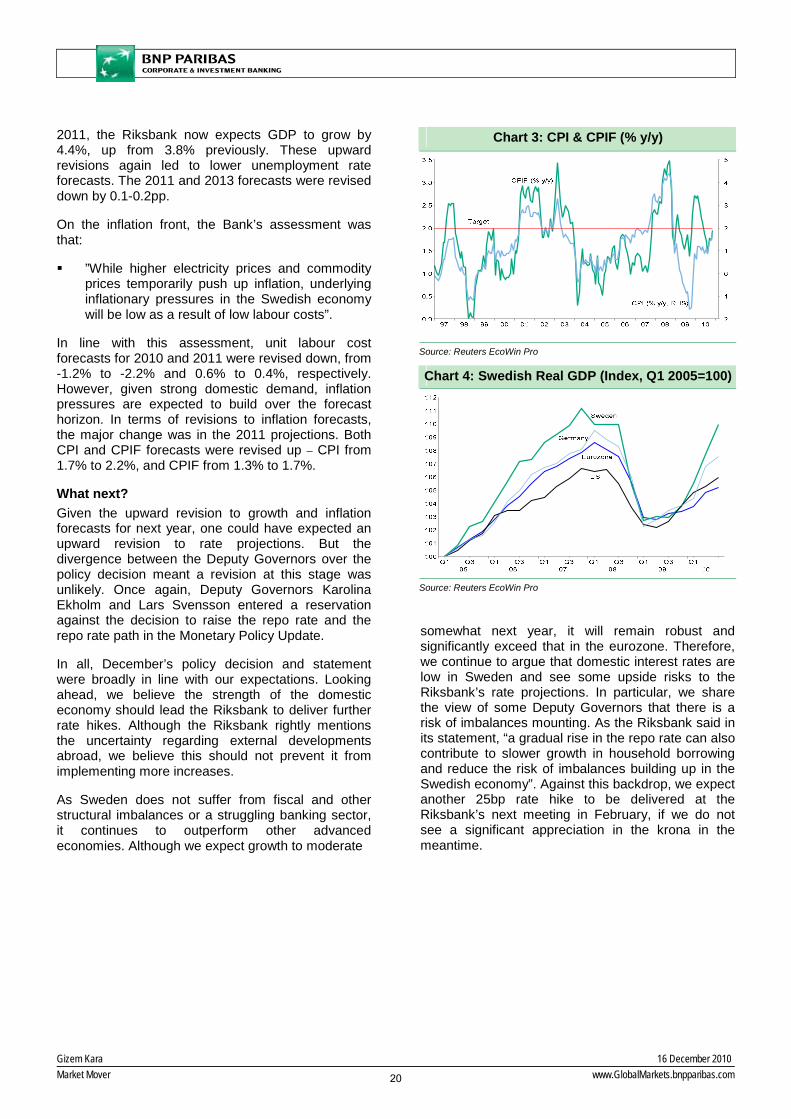
On the inflation front, the Bank’s assessment was that:
”While higher electricity prices and commodity prices temporarily push up inflation, underlying inflationary pressures in the Swedish economy will be low as a result of low labour costs”.
In line with this assessment, unit labour cost forecasts for 2010 and 2011 were revised down, from -1.2% to -2.2% and 0.6% to 0.4%, respectively. However, given strong domestic demand, inflation pressures are expected to build over the forecast horizon. In terms of revisions to inflation forecasts, the major change was in the 2011 projections. Both CPI and CPIF forecasts were revised up – CPI from 1.7% to 2.2%, and CPIF from 1.3% to 1.7%.
What next? Given the upward revision to growth and inflation forecasts for next year, one could have expected an upward revision to rate projections. But the divergence between the Deputy Governors over the policy decision meant a revision at this stage was unlikely. Once again, Deputy Governors Karolina Ekholm and Lars Svensson entered a reservation against the decision to raise the repo rate and the repo rate path in the Monetary Policy Update.
In all, December’s policy decision and statement were broadly in line with our expectations. Looking ahead, we believe the strength of the domestic economy should lead the Riksbank to deliver further rate hikes. Although the Riksbank rightly mentions the uncertainty regarding external developments abroad, we believe this should not prevent it from implementing more increases.
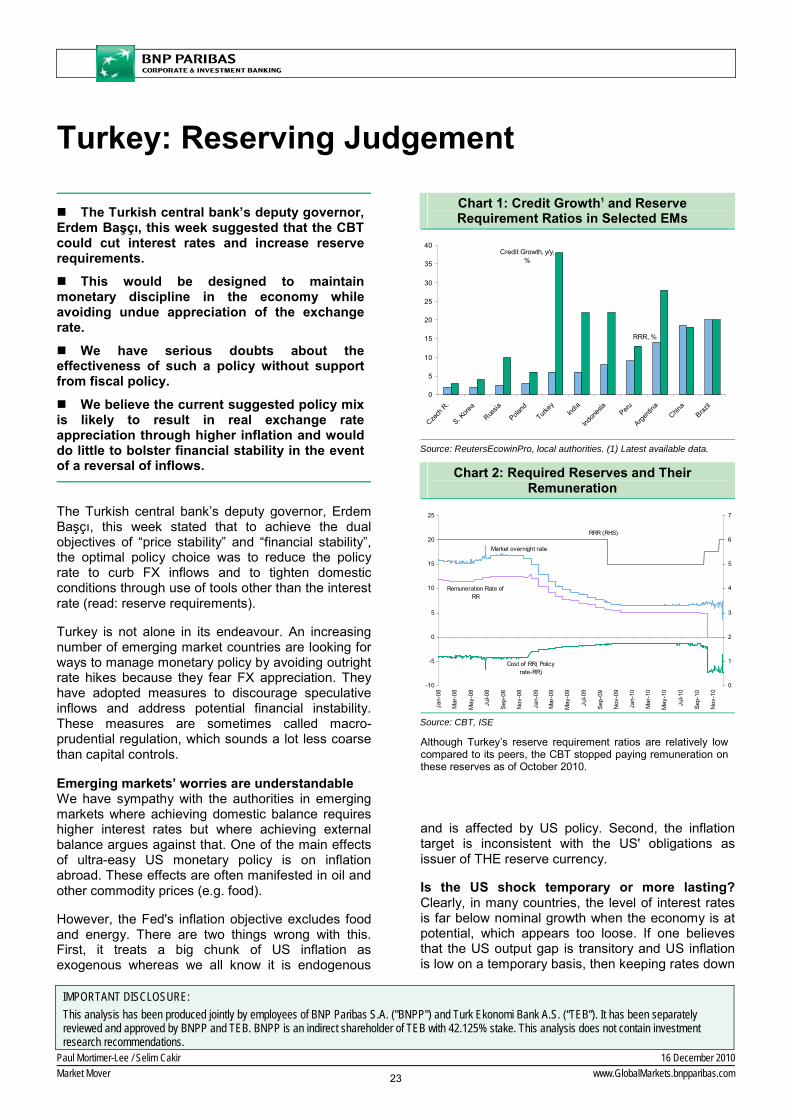
As Sweden does not suffer from fiscal and other structural imbalances or a struggling banking sector, it continues to outperform other advanced economies. Although we expect growth to moderate
somewhat next year, it will remain robust and significantly exceed that in the eurozone. Therefore, we continue to argue that domestic interest rates are low in Sweden and see some upside risks to the Riksbank’s rate projections. In particular, we share the view of some Deputy Governors that there is a risk of imbalances mounting. As the Riksbank said in its statement, “a gradual rise in the repo rate can also contribute to slower growth in household borrowing and reduce the risk of imbalances building up in the Swedish economy”. Against this backdrop, we expect another 25bp rate hike to be delivered at the Riksbank’s next meeting in February, if we do not see a significant appreciation in the krona in the meantime.
Chart 3: CPI & CPIF (% y/y)
Source: Reuters EcoWin Pro
Chart 4: Swedish Real GDP (Index, Q1 2005=100)
Source: Reuters EcoWin Pro
20

Gizem Kara 16 December 2010Market Mover www.GlobalMarkets.bnpparibas.com
Norway: Hawkish Tone The Norges Bank left its policy rate at 2.00%
at its December meeting, in line with market expectations.
The statement accompanying the policy decision was hawkish compared to October’s.
We expect the Norges Bank to deliver a rate hike in Q2 2011, but a hawkish statement overall has increased the chances of a hike in Q1.
If the krone does not appreciate significantly and economic data turn out to be stronger than the Bank’s expectations, a rate hike is likely in Q1.
Rates on hold The Norges Bank kept its policy rate at 2.00% at its December meeting, in line with market expectations.
In the opening paragraph of the statement, the Bank mentioned that “underlying inflation has been approximately as expected” and “growth has picked up”. But the level of activity was perceived to be “probably still somewhat lower than normal”. In terms of external developments, the Bank said that “growth has been unexpectedly high among several of Norway’s most important trading partners”. We believe this mainly reflects stronger-than-expected growth in Sweden in Q3. Another positive factor noted was the increase in oil prices, which provides a boost to the economy overall.
Less positively, there was acknowledgement of the uncertainty regarding developments in Europe due to fiscal concerns. The Norges Bank noted the high level of borrowing rates in peripheral eurozone countries. That said, the emphasis was still that “contagion to other markets has so far been limited”.
Overall, while the Norges Bank kept its policy rate unchanged, it noted that “the consideration of guarding against the risk of future financial imbalances that may disturb activity and inflation somewhat further ahead suggests that the key policy rate should not be kept low for too long”. This was broadly the same as in the Norges Bank’s in-depth assessment back in October. In all, compared to its predecessor, the statement had a hawkish tone.
Risks around the policy outlook In terms of policy, in its in-depth assessment, the
Norges Bank noted that:
“Both the consideration of bringing consumer price inflation up to target and the consideration of stabilising developments in output and employment imply a low key policy rate”.
Although it again mentioned that “the low interest rate level has not triggered an increase in household debt growth so far”, there was particular emphasis on
Chart 1: Policy Rates (%)
Source: Reuters EcoWin Pro
Chart 2: Real GDP (% y/y)
Source: Reuters EcoWin Pro
Chart 3: Private Consumption & Retail Sales
Source: Reuters EcoWin Pro
21

Gizem Kara 16 December 2010Market Mover www.GlobalMarkets.bnpparibas.com
the rise in house prices and consumer spending. Against this backdrop, the Norges Bank remains aware of the risk of financial imbalances building up in the economy. Therefore, rates are not expected to remain low “for too long”.
Policy ahead Overall, the policy statement signalled that we might see an upward revision to the Norges Bank’s rate projections at its March meeting, when the new Monetary Policy Report will be published. As we noted before, recent domestic developments suggest growth will pick up in the quarters ahead. Given the key policy rate is still low compared to what the neutral rate should be in Norway, we expect rate hikes. We expect the next hike to come in Q2, but the hawkish statement has increased the risk of a rate hike in Q1.
At the press conference after the policy decision, Deputy Governor Qvigstad mentioned that he sees no reason to change the Bank’s policy rate projections (the quarterly rate projections in the October Monetary Policy Report suggested the Bank intends to deliver a rate hike, at the earliest, in summer 2011). However, developments in the period ahead will be key for the timing of the hike.
In particular, if we do not see a signicant appreciation in the currency, economic data surprises to the upside and house prices increase markedly, the Norges Bank is likely to deliver a rate hike in Q1. But if tensions in financial markets intensify going into next year due to concerns over the eurozone, the Bank will wait until Q2.
Chart 4: Credit To Households and Non-Financial Corporations (% y/y)
Source: Reuters EcoWin Pro
Chart 5: Import-Weighted NOK
Source: Reuters EcoWin Pro
22
Paul Mortimer-Lee / Selim Cakir 16 December 2010Market Mover www.GlobalMarkets.bnpparibas.com
IMPORTANT DISCLOSURE: This analysis has been produced jointly by employees of BNP Paribas S.A. ("BNPP") and Turk Ekonomi Bank A.S. (“TEB”). It has been separately reviewed and approved by BNPP and TEB. BNPP is an indirect shareholder of TEB with 42.125% stake. This analysis does not contain investment research recommendations.
Turkey: Reserving Judgement The Turkish central bank’s deputy governor,
Erdem Başçı, this week suggested that the CBT could cut interest rates and increase reserve requirements.
This would be designed to maintain monetary discipline in the economy while avoiding undue appreciation of the exchange rate.
We have serious doubts about the effectiveness of such a policy without support from fiscal policy.
We believe the current suggested policy mix is likely to result in real exchange rate appreciation through higher inflation and would do little to bolster financial stability in the event of a reversal of inflows.
The Turkish central bank’s deputy governor, Erdem Başçı, this week stated that to achieve the dual objectives of “price stability” and “financial stability”, the optimal policy choice was to reduce the policy rate to curb FX inflows and to tighten domestic conditions through use of tools other than the interest rate (read: reserve requirements).
Turkey is not alone in its endeavour. An increasing number of emerging market countries are looking for ways to manage monetary policy by avoiding outright rate hikes because they fear FX appreciation. They have adopted measures to discourage speculative inflows and address potential financial instability. These measures are sometimes called macro-prudential regulation, which sounds a lot less coarse than capital controls.
Emerging markets’ worries are understandable We have sympathy with the authorities in emerging markets where achieving domestic balance requires higher interest rates but where achieving external balance argues against that. One of the main effects of ultra-easy US monetary policy is on inflation abroad. These effects are often manifested in oil and other commodity prices (e.g. food).
However, the Fed's inflation objective excludes food and energy. There are two things wrong with this. First, it treats a big chunk of US inflation as exogenous whereas we all know it is endogenous
and is affected by US policy. Second, the inflation target is inconsistent with the US' obligations as issuer of THE reserve currency.
Is the US shock temporary or more lasting? Clearly, in many countries, the level of interest rates is far below nominal growth when the economy is at potential, which appears too loose. If one believes that the US output gap is transitory and US inflation is low on a temporary basis, then keeping rates down
Chart 1: Credit Growth1 and Reserve Requirement Ratios in Selected EMs
RRR, %
Credit Growth, y/y, %
0
5
10
15
20
25
30
35
40
Czech
R.
S. Kore
a
Russia
Poland
Turkey
India
Indon
esia
Peru
Argenti
naChin
aBraz
il
Source: ReutersEcowinPro, local authorities. (1) Latest available data.
Chart 2: Required Reserves and Their Remuneration
Market overnight rate
Remuneration Rate of RR
Cost of RR( Policy rate-RR)
RRR (RHS)
-10
-5
0
5
10
15
20
25
Jan-
08
Mar
-08
May
-08
Jul-0
8
Sep-
08
Nov
-08
Jan-
09
Mar
-09
May
-09
Jul-0
9
Sep-
09
Nov
-09
Jan-
10
Mar
-10
May
-10
Jul-1
0
Sep-
10
Nov
-10
0
1
2
3
4
5
6
7
Source: CBT, ISE
Although Turkey’s reserve requirement ratios are relatively low compared to its peers, the CBT stopped paying remuneration on these reserves as of October 2010.
23

Paul Mortimer-Lee / Selim Cakir 16 December 2010Market Mover www.GlobalMarkets.bnpparibas.com
IMPORTANT DISCLOSURE: This analysis has been produced jointly by employees of BNP Paribas S.A. ("BNPP") and Turk Ekonomi Bank A.S. (“TEB”). It has been separately reviewed and approved by BNPP and TEB. BNPP is an indirect shareholder of TEB with 42.125% stake. This analysis does not contain investment research recommendations.
to avoid a temporary spike in the exchange rate against the USD is fine – that would just misallocate resources and disrupt the pattern of production, growth and inflation.
If however, a large US output gap persists for many years – which seems likely – and if US inflation stays low – also likely – then a permanent change in the exchange rate is justified and rates should not stay long below their domestic equilibrium. Our concern in several economies is that controls designed to lower the exchange rate are being inappropriately applied. They might be fine if the shock affecting the US were temporary, but they are inappropriate if the US shock is more durable, which is our view.
If such policies are applied inappropriately, nominal GDP is likely to surprise on the upside and so will inflation. There will be a rise in the real exchange rate brought about through inflation.
How does lowering rates and increasing reserve requirements work? Lowering rates while increasing reserve requirements could work by lowering deposit rates available to foreigners and hence reducing FX inflows while not reducing loan rates domestically. This increased wedge between loan and deposit rates is a reason why reserve requirements are a favoured instrument now. We also fear that, in some countries, they are a disguised way of running too-slack policy without owning up to it.
We are sceptical about such policies in general, and this applies to the Turkish initiative. We fear that it is in fact an easing in policy. This is of concern when Turkish credit growth is extremely rapid (Chart 1). The rapid growth is associated with a considerable current account deficit (Chart 3).
We are not the only ones to see the policy shift as expansionary. The Turkish equity markets rebounded strongly on the news, with an increase in demand for risk assets.
All this suggests that the policy is indeed expansionary, which we find concerning when growth is already good, credit creation strong and the current account deficit wide. The economy looks as though it needs a touch on the brake, not the accelerator.
We have serious doubts about the effectiveness of such a policy without strong support from fiscal policy. A tighter fiscal policy would be much more effective in containing aggregate demand, limiting exchange rate appreciation and achieving better
post-inflow financial stability. Accordingly, we would argue that a much tighter cyclically adjusted fiscal policy, supported by strict regulations by the Banking Regulation and Supervision Authority (BRSA), and possibly a tighter monetary policy would represent a better policy choice for Turkey. If these options are not possible prior to elections, the CBT could have also considered intensifying FX purchases and/or administrative measures to curb short-term inflows.
Most importantly, for the reserve requirement ratio strategy to work, the CBT should be ready to reduce TRY liquidity in the system. In such a case, money market rates would go above the CBT’s policy rate of 7%. We think the CBT would not allow that and the liquidity it provides will find its way to credit. The economy will thus continue to overheat and ultimately inflation will be the price.
Effects of higher reserve requirements Higher reserve requirements will: 1) Increase the cost of bank intermediation; 2) Lower the rate on deposits and raise the rate on
lending. In Turkey, the cost of raising RR by 1pp increases the cost to banks by 15bp. In the recent past, banks were able to reflect around 60% to 70% of cost increase in the remuneration paid to deposits.
3) Tax bank intermediation and encourage non-bank intermediation and intermediation outside the country's borders. In the 1970s and 1980s, US thrifts developed accounts that were designed to attract household deposits in the US
Chart 3: 2010 Current Account Balances in Selected EMs
-8
-6
-4
-2
0
2
4
6
China
Russia
S. Korea
Argenti
na
Indon
esiaPeru
Czech
R.
Brazil
Poland
India
Turkey
Source: BNP Paribas.
Unlike several other emerging market countries that also need to deal with capital inflows, Turkey has a large current account deficit. As a result, Turkey is more vulnerable to a sharp reversal of capital inflows.
24

Paul Mortimer-Lee / Selim Cakir 16 December 2010Market Mover www.GlobalMarkets.bnpparibas.com
IMPORTANT DISCLOSURE: This analysis has been produced jointly by employees of BNP Paribas S.A. ("BNPP") and Turk Ekonomi Bank A.S. (“TEB”). It has been separately reviewed and approved by BNPP and TEB. BNPP is an indirect shareholder of TEB with 42.125% stake. This analysis does not contain investment research recommendations.
to avoid the reserve requirements applying to banks. The IMF mentions South Korea, where Korean deposits went from 70% being in deposit centre banks in the 1970s to half that in 1992 as a result of extensive use of RR and the consequent disintermediation of the banking system;
4) Reduce stock returns to holders of bank equity. BCB found evidence of this in Brazil, which would reduce the rate effect;
5) People use non-taxed cash more; and 6) The policy operates on domestic deposits, not
credit. For a country that has more or less closed its output gap and which at the margin is financing credit through external wholesale flows and is running a big current account deficit, the money effects will be negligible (wholesale capital comes in, the current account deficit widens and deposits are unchanged). With an open capital account, there will be leakage in the system that would reduce the effectiveness of RR increases. At the same time, we note that circumventing the reserve requirement ratio is rather difficult in Turkey since the regulator (BRSA) applies the RR to every obligation of banks, be it bonds or loans from other banks.
The risk is inflation We have concerns that such a policy could end up being inflationary. Why?
1) It feeds expectations that the central bank is reluctant to raise rates when they in fact need to rise and so stimulates demand (we see the stock market reaction as strong evidence of this);
2) It feeds expectations that the central bank does not want to see a rise in the exchange rate (while admitting it is undervalued in the sense of being weaker than the market would price it left to its own devices). This must encourage greater employment, investment and cost tolerance by exporters and those competing with imports; and
3) Circumvention of the controls is profitable and broad liquidity will continue to rise quickly. The higher the reserve requirement, the greater will be the incentive to circumvent the regulations.
The famous “impossible trinity” of open economy macroeconomics, i.e. the inability to simultaneously target the exchange rate, to run an independent monetary policy and to allow full capital mobility suggests that if capital flows are sustained (i.e in the absence of effective capital controls), Turkey needs to choose between nominal appreciation and inflation.
We believe that the current suggested policy mix is likely to result in real exchange rate appreciation. This will come about through inflation. Moreover, the policy mix would do little to reduce the possible damage to financial stability in the event of a future reversal of inflows.
25

Ryutaro Kono/ Hiroshi Shiraishi 16 December 2010Market Mover www.GlobalMarkets.bnpparibas.com
Japan: Tankan Points to Soft Patch The December Tankan showed that
business sentiment among large firms deteriorated for the first time in seven quarters, but the setback was not as bad as expected.
While the outlook DI is weaker than expected, we judge that sentiment DIs could rise modestly in the March Tankan.
Capital spending plans for large manufacturers were marked up to 2.9% y/y from 2.4% in September. Businesses are focusing more on expansion overseas, but domestic investment should continue picking up as long as the recovery in exports and production continues.
The BoJ’s next move depends on the Fed. So long as the Fed does not expand QE2, pressures are unlikely to intensify on the BoJ for further easing to counter appreciating pressures on the yen.
If the Fed takes additional action, causing the yen to strengthen against the dollar, the BoJ will be pressed to do more to neutralise such pressures by expanding the scale of its Asset Purchase Programme.
Modest decline in DIs confirms a soft patch In the December Tankan survey, business sentiment modestly retreated for the first time in seven quarters. This indicates that the economy has entered a lull, as corporate earnings have stalled due to slowing exports and the end of domestic stimulus programmes. Even so, the setback in business confidence was not as bad as expected, and the survey results confirm that fallout from the end of green car subsidies and yen appreciation had only limited adverse effects on overall business activity.
Setback in confidence not as bad as expected In terms of the Tankan’s headline index, the current conditions diffusion index (DI) for large manufacturers fell three points from the September survey to +5. Weakness was pronounced in sectors affected by the end of stimulus programmes such as motor vehicles or by ongoing inventory adjustments in the global IT/digital sector like electrical machinery. Collateral damage was sustained by material-supplying sectors such as non-ferrous metals and chemicals. However, business confidence continued to improve on the back of solid Asian demand for capital goods in industries such as general-purpose
machinery and shipbuilding/heavy machinery. Interestingly, the business conditions DI for small manufacturers, while remaining in negative territory, improved two points from September, suggesting that the negative factors weighing on the mood of their larger manufacturing cousins have not filtered down (though the outlook does not look good, with the forecast DI for small makers showing an 11-point drop).
Moving on to non-manufacturers, the current conditions DI for large enterprises fell just one point from September to +1. The setback in sentiment was modest both in areas directly connected to factory activity such as the wholesale trade and in areas connected to consumer spending like the retail trade and services for individuals. As for the retail trade, despite the stabilisation of department store sales and the surge in last-minute demand for eco-friendly appliances ahead of the downsizing of the eco-point
Chart 1: Business Conditions DI – All Enterprises
-60
-50
-40
-30
-20
-10
0
10
00 01 02 03 04 05 06 07 08 09 10 11
*Q1 2011 is forecast from December Tankan.
Source: BoJ, BNP Paribas
Chart 2: Business Conditions DI – Large Enterprises
-60
-50
-40
-30
-20
-10
0
10
20
30
00 01 02 03 04 05 06 07 08 09 10 11
ManufacturingNonmanufacturing
*Q1 2011 is forecast from December Tankan.
Source: BoJ, BNP Paribas
26

Ryutaro Kono/ Hiroshi Shiraishi 16 December 2010Market Mover www.GlobalMarkets.bnpparibas.com
system in December, the plunge in car sales following the end of fiscal incentives inevitably took a greater toll on confidence. On the upside, the DI for the communications industry was relatively strong, and the DI for business-oriented services posted a sharp increase. The DI for small-sized non-manufacturers fell just one point to -22.
Outlook DI also shows weakness but… While the decline in the current condition DIs were smaller than expected, the forecast DIs showed that firms are quite cautious about the outlook. We had caution about the outlook as it is difficult to gauge the level of domestic demand following the end of stimulus programmes. But the December Tankan shows large manufacturers are more wary about the future than we expected, with their outlook DI falling seven points. It seems that producers are quite concerned about the uncertainties surrounding demand for cars and home appliances, as well as the squeeze on profit margins from resurgent commodity prices. In contrast, the outlook DI for large non-manufacturers is down just two points.
The resurgent commodities market reflects the revival in global manufacturing, spearheaded by booming domestic demand in China and other emerging economies. At least for the time being, brisk exports to these economies will likely offset the damage from higher commodity prices. Meanwhile, with US Christmas sales proving solid (so far), it is likely that inventory adjustments in the IT/digital sectors will make faster headway. Consequently, despite the downbeat tone of the latest forecast DIs, when the next Tankan is released on 1 April we feel business sentiment may not be all that weak. It could even modestly rise, as we expect the export-led recovery to resume at the start of 2011, with momentum steadily growing from the spring as the negative payback from eco-point sales fades. (Domestic demand, however, will be too weak to drive the economy due to the effects of an ageing population.)
Meanwhile, the latest sales and profit projections show a slight upward revision for FY 2010 as a whole, but forecasts for the latter half of the year have been marked down for both sales and profits. In fact, second-half profits for large enterprises (all industries) are now projected to drop a modest 1.0%. On the surface, it seems that these companies are pessimistic about the future, following a first half year when profits surpassed expectations. However, it is more likely that second-half forecasts are being adjusted now to avoid large-scale revisions of the annual projection. Once it becomes clear that exports are back on a recovery track, sales and profit projections for FY 2010 could well be revised upward,
despite fallout from the probable rise in commodity prices.
Capex plans largely unchanged from September With regard to the FY 2010 capital spending plans, large manufacturers project a 2.9% y/y increase (2.4% in September), for a revision rate of -1.0%. Large non-manufacturers forecast gains of 3.0% (1.6%), for a revision rate of 1.3%. The upward revision for non-manufacturers is largely due to a mark-up for land purchases, which suggests improving conditions in the real estate market. But GDP-based capital investment is closer to the Tankan’s “software and fixed investment excluding land purchases”. Spending plans here show large manufacturers project a rise of 4.1% y/y and large non-manufacturers a rise of 4.5%, with the revisions rates for both being negative at -0.9% and -0.3%, respectively. Whether spending plans include real estate or not, domestic appetite for capex is not robustly picking up. Indeed, while many firms during Q3 settlements marked up their spending plans, alongside increased profit projections, the upward revisions for investment were concentrated in
Chart 3: Business Conditions DI – Medium-Sized Enterprises
-70
-60
-50
-40
-30
-20
-10
0
10
20
00 01 02 03 04 05 06 07 08 09 10 11
Manufacturing Nonmanufacturing
*Q1 2011 is forecast from December Tankan.
Source: BoJ, BNP Paribas
Chart 4: Business Conditions DI – Small Enterprises
-70
-60
-50
-40
-30
-20
-10
0
10
20
00 01 02 03 04 05 06 07 08 09 10 11
ManufacturingNonmanufacturing
*Q1 2011 is forecast from December Tankan.
Source: BoJ, BNP Paribas
27

Ryutaro Kono/ Hiroshi Shiraishi 16 December 2010Market Mover www.GlobalMarkets.bnpparibas.com
spending on overseas plants. Owing to the appreciation of the weak yen and the robustness of domestic demand in emerging markets, manufacturers and non-manufacturers are both focusing more on expansion overseas, rather than investment at home. Hence the recovery in domestic investment continues to lag that of profits.
Even so, with the export-led recovery set to get back on track in 2011, we believe domestic investment will continue to gradually pick up. On this score, spending plans show downward revision in the first half of FY 2010, when concerns were mounting about a double dip in the US/Europe and yen appreciation. But the plans for the second half are uniformly marked up as these uncertainties have been dispelled.
BoJ policy: No policy change, unless the Fed acts With the concern over a double-dip recession having faded, global share prices and bond yields have crept higher and the greenback has appreciated of late. This reflects that fact that global manufacturing started to turn up again in October, led by emerging economies. The manufacturing cycle in the developed world is also reviving on the back of exports to booming EMs. On this score, that the recoveries in emerging economies are accelerating reflects not just their autonomous growth dynamics but also the effects of the Fed’s QE2 (via defence of fixed exchange rates). In this sense, QE2 is starting to benefit the US economy (via exports). Given this backdrop, the Fed seems likely to take a wait-and-see stance for a while.
As pointed out in earlier reports, Japanese monetary policy is influenced most by the exchange rate, and the factor currently impacting the exchange rate most is US monetary policy. So long as the Fed does not move to expand QE2, pressures are unlikely to intensify on the BoJ for further easing to counter appreciating pressures on the yen. Hence, Japanese monetary policy should be unchanged for the time being.
That said, it will still take a considerable amount of time for the US’s balance sheet troubles to be undone. US domestic demand is thus likely to continue lacklustre, even if revived exports trigger a cyclical recovery. More fiscal stimulus might give US growth a firmer tone, but it will likely be only short-lived. As a result, the US jobless rate will probably show only limited improvement and the core inflation rate will probably continue trending lower (the headline inflation rate, however, could rise on the resurgent commodities market and higher crude oil prices). If such weak conditions continue, the Fed
could move to ease further. While America’s natural rate of interest is unlikely to be revived by such macro-stabilisation measures, the Fed – fully aware of this – will probably still undertake aggressive action.
In such an event, the yen is likely to strengthen further against the dollar, and the BoJ will inevitably be pressed to do more to neutralise such pressures. Given that Japan depends on exports for growth, as domestic demand is chronically sluggish due to the effects of an ageing population (and the economic structure is not yet geared to benefit from yen appreciation), Japan cannot allow currency appreciation to damage the export sectors. Consequently, if the action by the Fed causes another wave of yen appreciation, we expect the BoJ to respond by expanding the scale of its Asset Purchase Programme (currently JPY 35 trillion).
Chart 5: Fixed Investment Including Land Purchasing Expenses, Excluding Software
Investment (%)
-40
-30
-20
-10
0
10
20
30
02 03 04 05 06 07 08 09 10
Large Enterprises/ManufacturingLarge Enterprises/Nonmanufacturing
Source: BoJ, BNP Paribas
Chart 6: Fixed Investment Including Land Purchasing Expenses, Excluding Software
Investment (%)
-50
-40
-30
-20
-10
0
10
20
30
02 03 04 05 06 07 08 09 10
Small Enterprises/ManufacturingSmall Enterprises/Nonmanufacturing
Source: BoJ, BNP Paribas
28

Ryutaro Kono/ Hiroshi Shiraishi 16 December 2010Market Mover www.GlobalMarkets.bnpparibas.com
Japan: Marking Up 2010 Growth Forecast Growth in Q3 was marked up slightly more
than projected, to 4.5% annualised from 3.9%, due to upward revisions in private capital investment and inventory.
But the robust tone of Q3 is essentially a product of policies that triggered a surge in demand for green car and cigarettes; the underlying pace of growth slowed alongside softening exports. Payback for the Q3 policy factors is likely to see contraction in Q4.
Even so, with the global economy back on a recovery track, Japanese growth should resume in early 2011 and accelerate from the spring.
Meanwhile, the final figures for last year show the economy contracted 6.3% in 2009 (rather than 5.2%). The economy’s collapse in the two quarters following the Lehman shock was sharper than previously estimated while the subsequent recovery was slightly faster.
Following the revision of past GDP data, our new forecasts call for 4.4% growth in 2010 (up from 3.6%) and 1.6% in 2011 (1.4%).
Annualised growth rises to 4.5% on stronger capital spending In the second preliminary real GDP reading for Q3, growth was marked up slightly more than we had projected, coming in at 1.1% q/q (4.5% annualised). This compares to the preliminary (first estimate) reading of 0.9% q/q (3.9% annualised). On the upside, as expected, private capital investment was marked up (to 1.3% q/q from 0.8%), reflecting the latest MOF survey of corporate financial statements. There were also upward revisions to inventory (contribution of 0.2pp from 0.1pp); personal consumption (1.2% q/q from 1.1%); and government consumption (0.2% q/q from 0.1%). On the downside, public investment was revised down to -1.0% q/q from -0.6%.
The robust growth registered in Q3 was essentially a product of special factors that bolstered household spending (last-minute demand for eco-friendly cars and hoarding of cigarettes ahead of a tax hike). Indeed, the underlying pace of growth appears to have slowed as export growth eased. With nominal GDP growth being marked down to 0.6% q/q or 2.6% annualised (from 0.7% q/q, 2.9% annualised), and the GDP deflator’s negative margin expanding to
-2.4% y/y (from -2.0%), the latest report also indicates that deflationary pressures have not let up.
Growth in FY 2009 sharply marked down Meanwhile, the final figures for growth in FY 2009 were also released. Real GDP’s rate of contraction was marked sharply down, to -2.4% from -1.8% (on a CY-basis, to -6.3% from -5.2%). On a quarterly basis, there were steeper annualised drops in both Q4 2008 (-11.9% rather than -10.4%) and Q1 2009 (-19.9% rather than -15.8%), reflecting sharper declines in personal consumption and inventory. All quarterly readings thereafter have been revised up modestly. The new figures show that the swing in the inventory cycle was greater; hence the economy’s collapse in the wake of the Lehman shock was sharper and its subsequent pace of recovery slightly faster.
Chart 1: Contributions to Real GDP (% q/q, pp)
-6
-5
-4
-3
-2
-1
0
1
2
3
06/1Q 07/1Q 08/1Q 09/1Q 10/1Q
Domestic Demand(excluding Stocks)Stocks
External Demand
Source: Cabinet Office, BNP Paribas
Chart 2: Real GDP (% q/q)
-6
-5-4
-3
-2
-1
01
23
4
06 07 08 09 10
The 1st preliminaryThe 2nd preliminary
Source: Cabinet Office, BNP Paribas
29

Ryutaro Kono/ Hiroshi Shiraishi 16 December 2010Market Mover www.GlobalMarkets.bnpparibas.com
After a modest contraction in Q4, the recovery should resume Looking ahead, we expect growth to be significantly affected by policy factors in the coming months. These ‘policy-created fluctuations’ will become apparent in Q4, when negative payback will emerge for the Q3 rush to buy green cars and cigarettes. According to our estimates, these two factors alone could depress Q4 GDP quarterly growth by roughly 0.7pp (2.8pp in annualised terms). But the economy is unlikely to contract that much, thanks to the downsizing of another stimulus programme – the eco-point system. This programme for buying energy-efficient appliances generated a surge in last-minute demand products such as LCD TVs in October and November. That said, the eco-point system, just like the green car subsidies, has only robbed demand from the future. Thus, while the economy might enjoy some support in Q4, there will be comparable negative payback in Q1 2011.
These policy-induced fluctuations make it hard to gauge the economy’s true state. However, the outlook does not look too bad as there are growing signs that global manufacturing, led by China, is recovering again. Thus, we see Japan emerging from its soft patch. Although exports have been stagnant, partly owing to ongoing adjustments in the global IT/digital industries, they should start accelerating in the not-too-distant future on the back of surging Asian demand. On this score, exports to China, Japan’s largest trading partner, rebounded in October. Early indications for November suggest exports overall should pick up the pace. In a similar vein, data for machinery orders show overseas bookings grew at a double-digit rate in October.
With the global economy back on a recovery path, we suspect that Japan’s stalled factory sector would have touched bottom in October before starting to bounce back – were it not for misguided interventions by the authorities. In short, domestic demand still lacks the vigour to drive the economy, owing to the effects of an ageing population. But we expect a cyclical recovery, triggered by exports, to resume in early 2011. The pace of growth should accelerate from the spring, by which time fallout from the end of the eco-point system will have faded. It is these fundamentals (the state of the economy, looking through the effects of policy meddling) that are probably driving the current stock market rally.
New forecasts Based on the latest official GDP data, our new annual growth forecasts are as follows: 3.4% in FY 2010 (up from 2.7%) and 1.6% in FY 2011 (unchanged); on a CY basis, 4.4% in 2010 (3.6%) and 1.6% in 2011 (1.4%). Our quarterly forecasts (annualised) are now -0.8% in Q4, 1.2% in Q1 2011, 2.0% in Q2, 2.0% in Q3, 2.0% in Q4 and 1.6% in Q1 2012. The large upward revision to our 2011 forecast is largely due to the official revisions to the growth path in the past several quarters noted above. (The base effect for FY 2011 rose to 1.9pp from 1.6pp, while Q2 and Q3 2010 were also revised up). Were it not for the revisions to past data, our forecasts would not be significantly different.
Chart 3: Real GDP (JPY trn, sa)
500
510
520
530
540
550
560
570
02 03 04 05 06 07 08 09 10 11
minus 10.1% 7.5%Annualized
4.9%
Source: Cabinet Office, BNP Paribas
Chart 4: Domestic Final Consumption Expenditure of Households (s.a., Q1 2008=100)
859095
100105110115120125130135140
Q1'07 Q1'08 Q1'09 Q1'10
Durable goodsSemi-durable goodsNon-durable goodsServices
Source: Cabinet Office, BNP Paribas
30

Paul Mortimer-Lee / Cyril Beuzit 16 December 2010Market Mover www.GlobalMarkets.bnpparibas.com
Bonds: Forecast Update We have revised our government bond
forecasts in light of the surprisingly large jump in yields in recent weeks.
In the near term, we believe the sell-off is overdone and will partly reverse during Q1.
Longer term, we believe that QE2 is a commitment to create inflation and, among other things, should exert upward pressure on 10-year yields. We expect 10-year Treasury yields to reach 3.75% by the end of 2011 and 4.6% a year later.
In light of the surprisingly large jump in bond yields in recent weeks, we have revised up our yield forecasts for the next two years (Table 1). We believe that the sell-off reflects a combination of bad positioning, central bank and political news (US fiscal agreement), better economic data (except US payrolls) and year-end market conditions. The difficulty is attaching weights to these different factors.
We believe that the key influences on the outlook for yields are:
There is an unusually large output gap. At some stage, this means the economy will grow significantly above trend for an unusually long period;
In the near term, the recovery faces substantial headwinds and final demand growth has remained lacklustre;
Underlying inflation is very weak and will remain so for some time;
Policy rates are exceptionally low. The Fed is making exceptional helicopter drops of money to build up expectations that it will be able to avoid deflation;
The Fed has made it clear that it wants to raise inflation. Our view is that the stock of QE is a promise to create excess inflation down the road (i.e. around 2014) that will raise inflation expectations today and so raise prices and activity today by lowering real policy rates;
The budget deficit is unusually high. Debt is rising quickly in relation to GDP. There are no credible fiscal consolidation plans;
At some stage, the Fed will sell Treasuries back to the market − an exceptional occurrence;
Also at some stage, mortgage demand will return (it may be the middle of the decade but that should affect bonds);
We believe that the first Fed rate hike is a long way off; and
The USD's reserve currency status is fraying around the edges.
Putting this into the context of our bond yield forecasts, the 2-year yield will continue to be very much dependent on the outlook for the Fed funds rate. We believe that the Fed is unlikely to hike rates any time soon (not until late 2012). Given this, the 2-year yield should maintain a narrow spread to Fed funds through to mid-2012 (Chart 1). Thereafter, we expect a sharp widening in that spread in anticipation of the first hike, which should flatten the 2s10s portion of the curve at that time (Chart 2).
Table 1: Key Bond Yield Forecasts Spot Q1'11 Q2'11 Q3'11 Q4'11 Q1'12
USFed Funds 0.25 0.25 0.25 0.25 0.25 0.252-year 0.66 0.50 0.75 0.85 1.00 1.1010-year 3.50 3.00 3.25 3.50 3.75 4.00EurozoneRefi 1.00 1.00 1.00 1.00 1.00 1.002-year 1.08 1.00 1.20 1.30 1.50 1.7010-year 3.07 2.75 2.90 3.15 3.35 3.50JapanODR 0.30 0.30 0.30 0.30 0.30 0.30Call Rate 0.10 0.10 0.10 0.10 0.10 0.102-year 0.20 0.25 0.25 0.25 0.25 0.2510-year 1.28 1.20 1.30 1.40 1.40 1.40Source: BNP Paribas. End Period, Spot Rates as at 16 December
Source: Reuters EcoWin Pro
Chart 2: 2s10s vs Fed Funds
Source: Reuters EcoWin Pro
31

Paul Mortimer-Lee / Cyril Beuzit 16 December 2010Market Mover www.GlobalMarkets.bnpparibas.com
Further out along the curve, we believe that the lows in yields are behind us. However, while the trend in yields is likely to be upwards through most of 2011, we expect a rally early in the new year. In particular, the recent sell-off looks overdone. The start of the recent sell-off was primarily due to extreme market positioning (QE2’s ‘buy the rumour, sell the fact’, like QE1 in 2009) and the move has been exacerbated by year-end market conditions. We expect 10-year yields to move back down during Q1.
Risk appetite remains solid and supported by ample liquidity conditions. Recent data suggest that investment funds have been switching their allocation from bonds to stocks. Nonetheless, it is noteworthy that risky assets have not extended their gains in the wake of the recent sharp setback on bonds.
This highlights that, beyond some asset switches, the bond market sell-off has so far more to do with wrong positioning − the latest surveys of speculative positioning suggest that the market may have to sell off more before reaching a turning point.
Overall, judging from the very poor liquidity in bond markets, year-end pressures to cut balance sheets appears to be a significant factor exacerbating the recent moves on Treasuries. The move so far has been primarily cash driven but, over the past couple of sessions, the attendant swap spread widening indicates that convexity hedging flows have also played a role.
We expect the rally in the 10-year during Q1 to give way to a sell-off over the remainder of the year – in turn, temporarily steepening the curve. Thereafter, we would expect 2s10s to flatten during 2012 as the first Fed rate hike approaches. The pace of the sell-off will depend on: How much the fiscal and debt premium adds to
yields; How much competition from the return of private
funding needs adds to yields (since mortgage rates are rising it argues for less demand via refinancing, though the flip side is more demand as new purchases recover);
Less central bank appetite; and The extent that the market prices in an inflation
overshoot over the coming decade.
The last will be the most important, particularly for the belly of the curve. We suspect that the commitment to excess inflation will be a temporary one. We would be surprised if this does not add up to 50bp or more of excess steepness compared with past cycles.
More generally, the curve is likely to fluctuate a lot because long-term expectations about growth, inflation and the deficit are going to be the main drivers – not Fed funds expectations. Growth this year has been very close to consensus expectations at the end of 2009 – yet the market has done a lot without that much solid macro ‘news’. Expectations about the future are very unstable, so the long-term bond will be unstable and hence the curve’s shape will fluctuate.
In one year’s time we would expect: The recovery to be better established; QE to have ended; Inflation on the core measure to have troughed
but at a level below today's; Emerging market inflation to be higher; Debt to be higher, but the deficit not much better;
and The market to be looking for Fed rate hikes and
maybe Treasury sales by the Fed (the soft exchange rate policy favours the latter first).
These factors argue for higher bond yields over the coming year. By contrast, policy is currently 75bp lower than ahead of the 2003/04 Fed-hiking cycle. Based on a 3:1 relationship between policy and 10-year yields, this suggests that the 10-year yield should be around 25bp lower now compared with 2003/04. This and lower spot inflation argue for lower yields.
Ahead of the 2003/04 hiking cycle yields were 3½%. We believe that, taking on board all of the above, yields should be higher by the end of 2011 than at the end of 2003, hence we target 3.75%.
During 2012, the first Fed rate hike will be approaching and possibly even the start of a reversal of QE. The political and fiscal prospects are highly uncertain, but it seems likely that there will be a reasonable risk premium in Treasuries. With inflation rising, we would expect at least a 100bp sell-off. We expect 10-year yields to rise to around 4.6% by end-2012.
In Europe, we have also revised up our forecast for Bund yields, though by slightly less than in the US. The focus will remain on peripheral markets over the weeks ahead with a big question mark about the demand for early 2011 auctions. Spreads remain off their November highs but renewed stress looks likely with Moody’s putting Spain’s rating on review for a possible downgrade. Although we expect the ECB to begin hiking rates earlier than the Fed, we continue to expect Bunds to outperform Treasuries linked to the greater willingness of the Fed to deliver unconventional policy stimulus to raise inflation and inflation expectations.
32

IR Strategy NY 16 December 2010Market Mover, Non-Objective Section www.GlobalMarkets.bnpparibas.com
Macro environment supportive of low rates through Q1 The confluence of lacklustre growth, core inflation at its
Treasury purchases by the Fed are likely to prevent a runaway selloff in the early part of 2011. The driving force in the USD rate market will continue to be yield grab, which will manifest itself in duration extension, preference for (high-quality) spread products and selling convexity (think callables and mortgages). Having said that, the back-up in rates seen since November threw cold water on expectations that QE would put a soft cap on rates. What became apparent is that the Fed is doggedly going after inflation expectations, trying to boost them in the long run. And if they succeed, and there is reason to believe they will given the amount of excess liquidity they are pumping into the system, then intermediate and long term rates have no reason to be anywhere near the lows of 2009 and 2010. In other words, even in the absence of a material improvement in the economy in short order, Fed’s actions may actually have conspired to put a soft floor on the 10y and 30y rates, more so than the 2y. Any improvement in the employment picture, no matter how temporary or tentative it may prove to be, would almost surely add fuel to the fire and bring expectations for a faster recovery. As a result, we are revising up our earlier forecasts, putting the 10y at around 3% by the end of Q1. There are clearly risks to either side of this level. Still we believe that after the turn of the year, no longer held back by balance sheet constraints as they are now, investors will test long positions. Why? Because rates along the curve do offer value in the near term thanks to all the factors cited above. So at the very least what we can say is, look for a reversal in rates – back to 3%, below, or somewhat above? That is not quite the point, as much as the direction.
QE2 purchases will cancel out net Tsy supply The peak in Treasury issuance was seen during 2008-09, at over USD 150bn of net supply per month. Since then the Treasury has cut issuance sizes and net supply is now running at USD 100-110bn per month which we expect to remain relatively stable through FY11 (see Table 1 for breakdown of issuance forecast). This monthly figure closely matches the USD 110bn per month that the Fed intends to purchase as part of QE2. Interestingly, when looking at specific maturity sectors it appears the Fed’s purchases will not perfectly match the supply in that sector (see Table 2) The 5y was the main beneficiary of the rally before the market reversed course in November. Is this likely to happen
as rates turn around? We are confident that we will not see the extent of richness we did at the time, with Treasury 2s5s10s reaching -75bp. However, the 5y should still lead the way down. The 10y should also follow suit, giving rise to a compression of the 2s10s30s spread. Therefore, it is best to overweight the belly of the curve. Turning to the back end, the 30y yield is unlikely to drop precipitously because concerns about long-term inflation in the face of QE are likely to persist. Unless the collective mindset of investors shifts toward disinflation, we would be hard pressed to see 10s30s
Table 1: FY 2011 Treasury Coupon Issuance Forecast (USD bn)
Net Issuance in Bills 120Redemptions (ex-Bills) -755
2y 4203y 3845y 4207y 34810y 26430y 1685y TIPS 3210y TIPS 6430y TIPS 15Coupon Issuance: 2,115
Total Net Issuance 1.5 TrillionSource: BNP Paribas
Table 2: 7y-17y Debt Outstanding is Shrinking (USD bn)
MaturityExpected Fed Purchases in
Next 8 Months
Gross Supply in Next 8 Months
Issuance Net of Fed Buying
1.5 - 2.5y 45 280 2352.5 - 4y 180 256 764 - 5.5y 180 280 1005.5 - 7y 207 232 257 - 10y 207 176 -3110 - 17y 18 0 -1817 - 30y 36 112 76
Source: BNP Paribas
Table 3: Fed Will Shift Purchases Away From 2y and 5-7y in Favour of 7-10y Sector
Maturity Allocation in MBS Program
Allocation in 2009 Program New Allocation Change vs
MBS PatternChange vs
2009 Pattern
1.5 - 2.5y 14% 18% 5% -9% -13%2.5 - 4y 11% 20% 20% 9% 0%4 - 5.5y 21% 18% 20% -1% 2%5.5 - 7y 38% 21% 23% -15% 2%7 - 10y 4% 10% 23% 19% 13%10 - 17y 6% 7% 2% -4% -5%17 - 30y 5% 6% 4% -1% -2%
Source: BNP Paribas
lowest in decades, persistently high unemployment and
USD Rates Outlook in Q1
33

IR Strategy NY 16 December 2010Market Mover, Non-Objective Section www.GlobalMarkets.bnpparibas.com
move decisively below current levels of around 100bp – even though that is still on the high side as far as the history of this spread. On the flipside, a significant steepening in the back end is also rather unlikely, because of the implication for forward rates. To provide some perspective, the 10y forward 10y swap rate is in the 5.25% area as of this writing. Anything above 5% begins to look attractive for long duration players such as pension funds and insurance companies. In our view, the very presence of this backstop bid will likely keep the back end from selling off, or lagging massively in the event of a rally. For example the Fed will not purchases securities under 1.5yrs in maturity, and purchase only about half of the supply out till the 5yr sector. In the 7-10y sector the Fed will be purchasing more than the monthly supply, and in the very long end the Fed will purchase about half of supply. Thus, the support for the belly of the curve is greater. Another important point is that the market will have to adjust to the Fed’s shift in purchase allocation. Purchases will now focus on the 7-10y sector much more than the market was previously accustomed to, and the 2y and 5y sectors will get fewer purchases (see Table 3). This was the rationale behind one of our top relative value trades since the November FOMC meeting – the 5s10s Tsy flattener. Having now backed away from record steep levels, we expect this to continue as the overall disinflation theme also helps flatten the yield curve.
RV along the Treasury Curve A quick look at Chart 1 shows us the various peaks and troughs along the 3-month return profile of Treasuries under an unchanged yield curve environment. The local kinks on the return profile mark the sectors to buy (peaks) and the sectors to sell (troughs). The most prominent peak is in the mid 2016 to early 2017 sector and newly issued 10y notes. In addition to the profile in an unchanged yield curve, analyzing the Treasury universe under various bullish/bearish scenarios we find that issues maturing mid/late 2016 still look attractive from a return perspective, while issues maturing in early 2014 (Jan 2014 and Jan 2014) and late 2017 (Aug 2017 and Sept 2017) fall in the troughs of the return profile, helping us favour bullets over barbells (see Chart 2). Interestingly, the above mentioned portfolio would perform the best in the event one were neutral on rates or overweight bullish scenarios while limiting losses on bearish scenarios.
Cautiously optimistic on swap spreads With rates likely to be range-bound/moderately lower in the coming months, this should also keep 5y and 10y swap spreads from rising substantially due to the general directionality. Nevertheless, there are other technical factors at play that lead us to foresee a moderate upward bias in the coming months. The y/y
pace of Treasury supply has historically had strong explanatory power, and it seems this is set to decline in the months ahead (see Chart 3). In fact, Tsy issuance
Chart 1: Projected 3-Month Treasury Returns under an Unchanged Yield Curve (%)
0
0.2
0.4
0.6
0.8
1
1.2
1.4
1.6
0 5 10 15 20Effective Duration
3m N
omin
al R
etur
ns
Mid 2016 -Early 2017
Newly Issued 10s
2029 / 2030 / 2031
Late 2012 / Early 2013
2014
Source: BNP Paribas, Yield Book
Chart 2: Favour Bullets over Barbells in the 4-7y Sector
0.4
0.6
0.8
1
1.2
1.4
2 3 4 5 6 7Effective Duration
3m N
omin
al R
etur
ns
Sell 1.875% 02/14 or 1.75% 01/14and 1.875% 08/17 or 1.875% 09/17
Buy 3.25% 05/16
Source: BNP Paribas, Yield Book
Chart 3: Declining Treasury Supply to Put Widening Pressure on Swap Spreads
-20
0
20
40
60
80
100
120
140
96 98 00 02 04 06 08 10
-0.15
-0.10
-0.05
0.00
0.05
0.10
0.15
0.20
10y Swap Spread
YoY Change in 1+ Yrs Debt Outstanding net of Fed Purchases (R.H.S, Log Scale Inv.)
Issuance Forecast
Source: BNP Paribas, Treasury Direct
34

IR Strategy NY 16 December 2010Market Mover, Non-Objective Section www.GlobalMarkets.bnpparibas.com
net of Fed buying is going to have an even steeper decline relative to what was seen in recent years. There are other factors at play that will periodically tilt the balance one way or the other. Corporate issuance tends to weigh on swap spreads due to issuers hedging their fixed liabilities by receiving in swaps. Issuance tends to be below average near the end of the year so this should help spreads widen, although January tends to be one of the biggest issuance months in the year so this will pose challenges (see Chart 4). In general, issuers appear to be comfortable swapping from fixed to floating out to 5yrs, due to the widely held view that the economic backdrop will not be conducive to a big spike in rates in the next few years. This makes earning the carry an attractive proposition over that time span. Go out to the 10yr sector though and the story changes somewhat. Many issuers are content to lock in rates 10 years at the current levels (despite the recent backup) as they still fall in the lower end of historical ranges. In other words, issuers are reluctant to take a risk by getting into the carry game for fear that rates may indeed back up briskly past the first few years. Therefore, the widening impact could be magnified in the 10y sector in particular due to a combination of net removal of Treasury supply in that sector as noted above, and a dearth of swapped issuance. We would expect the 10y swap spread to reach 20-25bp as a result.
Agencies to do well, especially callables GSE reform will start coming back into focus as we approach the congressional deadline of January 2011 for an overhaul plan. However, the deadline is unlikely to be met given lack of progress on this issue. We would expect a proposal to be presented by the deadline, followed by the first draft in Q2 2011, with a final resolution possible in H2 2011. Although we don’t think private recapitalization is on the cards, we would expect that the government will guarantee both MBS and debentures whatever the arrangement is. In the interim, Fannie and Freddie continue be supported by unlimited backstop from the US Treasury and investors don’t seem to be worried. We like agencies due to carry/rolldown advantage over Treasuries. The 5y sector was recently under pressure mostly due to temporary re-allocation related flows, and now offers biggest carry/rolldown package. We prefer the 3y-5 sector, which not only provide best carry/rolldown along the agency curve at 49-51bp over 6m (see Chart 5) in absolute terms, but also on vol adjusted basis. We expect investors to continue moving out the curve to pick up yield and extend duration, especially if yields start to come down again. We also like callables for additional pick-up in yield and a wide band of outperformance relative to duration matched bullets, especially in the sell-off. Since we expect lower rates in Q1, before gradually rising
Chart 4: Expect High Corp Issuance in January (USD bn)
0
15
30
45
60
75
90
Jan
Feb
Mar
Apr
May
June July
Aug
Sep Oct
Nov
Dec
Average Issuance since 2000
Source: BNP Paribas
Chart 5: Carry and Rolldown in Agency Bullets
17 21 25 27 25 20
10
2826
1512
4
-517
1319253137434955
2y 3y 5y 7y 10y 30y
RolldownCarry
Source: BNP Paribas
Chart 6: 5y Agency Callable vs Bullet
-100-80-60-40-20
020406080
100120140160180200220
-30 -20 -10 0 10 20 30 40 50 60 70 80 90 100Parallel Shift (bps)
Tota
l Rat
e of
Ret
urn
Diff
eren
ce (b
p)
5nc3m berm vs. bullet5nc6m berm vs. bullet5nc1y berm vs. bullet
Source: BNP Paribas
Table 4: Combined GSE Issuance Projections
in billionsProj 2010
Proj 2011
Proj 2012
Discount Fannie Mae 512 563 620Notes Freddie Mac 486 535 481
FHLBanks 1167 1284 1477Sub-Total 2,165 2,382 2,578
Callables Fannie Mae 319 287 258Freddie Mac 216 206 185
FHLBanks 314 340 391Sub-Total 849 833 834
Bullets Fannie Mae 86 77 69Freddie Mac 128 122 110
FHLBanks 148 170 196Sub-Total 362 369 375
Total Issuance 3,376 3,584 3,787
Source: BNP Paribas, FNMA, FHLMC, FHLB
35

IR Strategy NY 16 December 2010Market Mover, Non-Objective Section www.GlobalMarkets.bnpparibas.com
through the rest of the year, we recommend callables with 6m to 1y lockouts. In general, an investor will give up some outperformance potential but widen the outperformance range for any given horizon by moving from a 5nc3m berm to a 5nc6m berm (Chart 6). A 5nc6m has a lower projected maximum outperformance of ~150p over a duration-matched bullet, but will withstand a larger range of yield curve shifts (from -20bp to +100bp) before underperforming over the 6m horizon. Total debt issuance for the three housing GSEs – Fannie Mae, Freddie Mac and the Federal Home Loan Banks – is on pace to total ~USD 3.4 trillion for 2010. Just under two-thirds of this issuance has been in discount notes, with the other third in long-term callables and bullets. Projections for 2011 and 2012 are for total agency debt issuance to rise by ~6% per year, to USD 3.6trn and USD 3.8trn respectively, primarily driven by re-growth of the advance business at the FHLBanks. Fannie and Freddie are likely to shrink their long-term debt issuance while filling in financing gaps with increased discount note issuance (see Table 4).
Volatility surface may gradually rotate toward that of Japan's
As rates have risen since the FOMC delivered QE2, so has swaption implied vol. More specifically, shorter expiry/front end volatilities jumped significantly. This was not only because of realized volatility but also because the sell-off moved the front end of the curve out of the "anchoring" region of ultra-low rates. Taking into account our bullish view for the coming months, volatilities will likely go back down especially for shorter expiry/front end. Additionally, issuance in structured notes such as Agency callables picked up during the period when rates remained low and investors searched for yield pick-up. This has supplied vol into the marketplace and if rates go back down a similar pattern is likely to play out (Chart 7). As the Fed-on-hold and low-rate environment becomes more and more prolonged, then it could be useful to look at the vol surface's evolution in Japan for some guidance. Not only are levels of vol much lower, but the ratio of 2y tails over 10y tails are lower since short rates are not expected to be raised any time soon. Also, the ratio of short expiries over longer expiries is much lower since rates become increasingly range-bound and this drives gamma vol lower vs vega vol. All of these are symptoms of a low-rate environment, and in the US the pattern has been quite strong (Chart 8). We certainly acknowledge the risk scenario of higher rates, and vol will likely rise in that scenario. In fact, even when considering that vol is higher at strike levels above the forward rates (i.e. payer skew is positive), when the market sells off and reaches those higher strikes then the vol at that particular strike still tends to increase (Chart 9). Payer skew is already at historical highs, and this should continue to be supported since
investors will show interest in buying protection against higher rates while rates are still low. But even then one can expect vol to rise for fixed strike levels (e.g. at 5% strikes as opposed to ATM+50bp) if economic sentiment picks up.
Chart 7: Agy Issuance Supplying Vega to Vol Market – Helping Keep Vol Relatively Low
40
60
80
100
120
140
160
180
200
Mar-09 Jun-09 Sep-09 Dec-09 Apr-10 Jul-10 Oct-10-140
-120
-100
-80
-60
-40
-20
06m5y Implied Volatility
Vega Vol Supply from AgyIssuance ($mm, Inverted R.H.S)
Source: BNP Paribas
Chart 8: Upper-Left Vol Leads the Move
0.5
0.7
0.9
1.1
1.3
1.5
1.7
Mar-08 Sep-08 Apr-09 Oct-09 May-10 Nov-100
0.5
1
1.5
2
2.5
3
3.5
41y2y/1y10y Vol Ratio1y2y/5y2y Vol Ratio2y Swap Rate (R.H.S)
Source: BNP Paribas
Chart 9: Actual Directionality in Implied Vol is Vastly Greater than That Implied by Skew
-12
-8
-4
0
4
8
12
Jan-10 Apr-10 Jul-10 Oct-10
1y10y ATM Vol Change on Week(ATM Vol) minus (Previous Week's Vol at that Strike)
Source: BNP Paribas
36

Suvrat Prakash 16 December 2010Market Mover, Non-Objective Research Section www.GlobalMarkets.bnpparibas.com
US: Ideal Timing for LT Bullish Hedges
Much has been said recently about the failure of QE2 to drive rates lower. However, our forecast for a prolonged period of relatively low rates is based on the economic backdrop of low/stable inflation and a high unemployment rate. The consensus across Wall Street economists is that this fundamental landscape is unlikely to improve much in the
The recent rise in rates and vol has led to a much improved entry level on strategies such as those which are long delta and short vol.
STRATEGY: Consider receiver spreads in vega space such as the structure below.
We explore strategies with a limited upfront cost but large potential for gains if spot rates continue to stay near current levels. The trade we show is to buy an at-the-money 4y10y receiver (roughly 5.00% strike at the time of writing) and sell twice the notional in a 200bp out-of-the-money receiver. This reduces the upfront cost and the only scenario where the trade loses money at expiry beyond the premium is if the 10y spot rate is at ultra-low levels (below 1.00%). Chart 1 shows the profit region for the trade at expiry, and Chart 2 shows a PnL profile.
These types of structures have often been unwound well before maturity. In the meantime, they carry well and gain value in a rally; thus they are often thought of as interim hedge assets. The carry is positive due to theta and rolldown in the 4y10y rate. After one year, the estimated PnL is +25% of the entry cost in an unchanged scenario, +50% in a -50bp move, and flat in a +50bp move.
Table 1 shows the trade details and various greeks. Note that the investor would be selling the receiver skew (ratio of 3%-strike norm vol over 5%-strike
norm vol) at just over 100%. This has improved significantly from the 92-94% range it had been in during the three months prior to the recent selloff.
Table 1: Trade Details for Receiver Spread with Current Cost of 303c Structure Strike Norm Vol (bp) Notional ($) PV01 ($) Vega ($) Gamma ($) Theta ($)
Buy 4y10y Rec 5.00% 115.8 100,000,000 34,591 644,080 1,391 (3,063)Sell 4y10y Rec 3.00% 116.2 (200,000,000) (20,370) (658,871) (653) 3,987
Net 14,222 (14,791) 739 924 Source: BNP Paribas
Chart 1: Hedging Against a Wide Range of Lower Rates (Profit Region at Expiry)
0
1
2
3
4
5
6
7
Jan-01 Jun-03 Dec-05 Jun-08 Dec-10
10y Swap Rate
Profit Region
Source: BNP Paribas
Chart 2: PnL Profile at Expiry
(10)
(5)
0
5
10
15
0% 1% 2% 3% 4% 5% 6%10y Spot Rate at Expiry
PnL
($M
M)
Source: BNP Paribas
coming quarters.
37
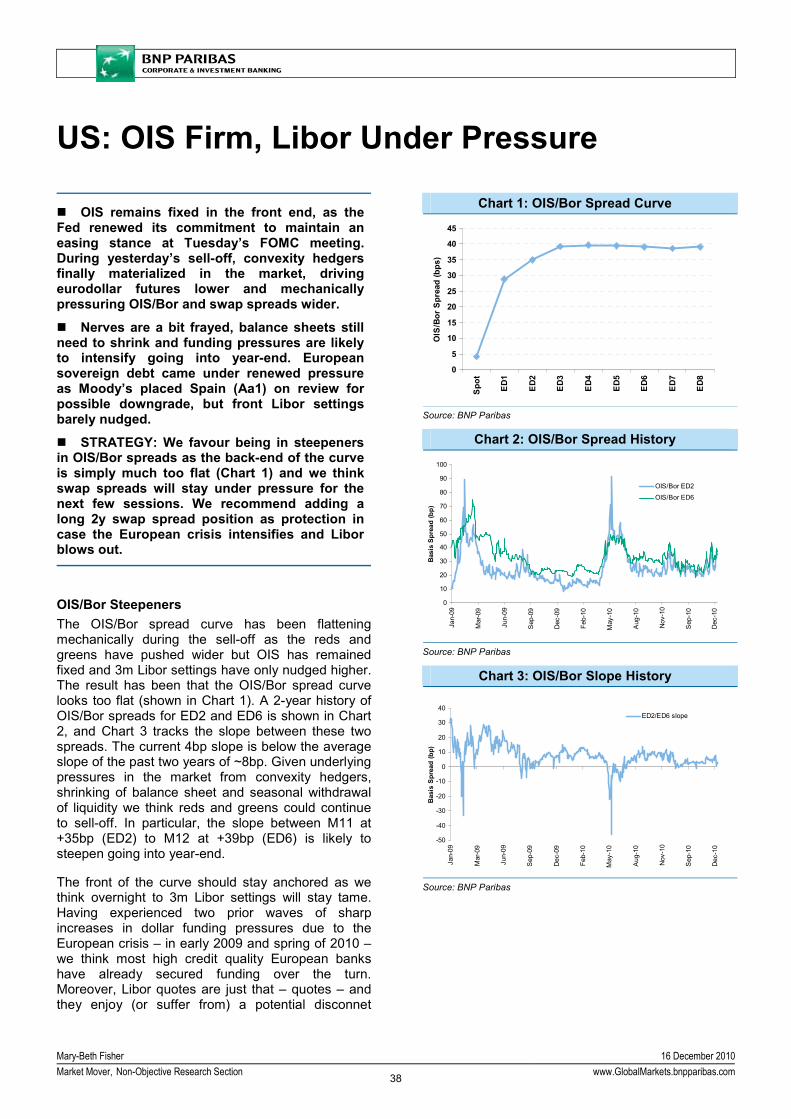
Mary-Beth Fisher 16 December 2010Market Mover, Non-Objective Research Section www.GlobalMarkets.bnpparibas.com
US: OIS Firm, Libor Under Pressure
OIS remains fixed in the front end, as the Fed renewed its commitment to maintain an easing stance at Tuesday’s FOMC meeting. During yesterday’s sell-off, convexity hedgers finally materialized in the market, driving eurodollar futures lower and mechanically pressuring OIS/Bor and swap spreads wider.
Nerves are a bit frayed, balance sheets still need to shrink and funding pressures are likely to intensify going into year-end. European sovereign debt came under renewed pressure as Moody’s placed Spain (Aa1) on review for possible downgrade, but front Libor settings barely nudged.
STRATEGY: We favour being in steepeners in OIS/Bor spreads as the back-end of the curve is simply much too flat (Chart 1) and we think swap spreads will stay under pressure for the next few sessions. We recommend adding a long 2y swap spread position as protection in case the European crisis intensifies and Libor blows out.
OIS/Bor Steepeners The OIS/Bor spread curve has been flattening mechanically during the sell-off as the reds and greens have pushed wider but OIS has remained fixed and 3m Libor settings have only nudged higher. The result has been that the OIS/Bor spread curve looks too flat (shown in Chart 1). A 2-year history of OIS/Bor spreads for ED2 and ED6 is shown in Chart 2, and Chart 3 tracks the slope between these two spreads. The current 4bp slope is below the average slope of the past two years of ~8bp. Given underlying pressures in the market from convexity hedgers, shrinking of balance sheet and seasonal withdrawal of liquidity we think reds and greens could continue to sell-off. In particular, the slope between M11 at +35bp (ED2) to M12 at +39bp (ED6) is likely to steepen going into year-end.
The front of the curve should stay anchored as we think overnight to 3m Libor settings will stay tame. Having experienced two prior waves of sharp increases in dollar funding pressures due to the European crisis – in early 2009 and spring of 2010 – we think most high credit quality European banks have already secured funding over the turn. Moreover, Libor quotes are just that – quotes – and they enjoy (or suffer from) a potential disconnet
Chart 1: OIS/Bor Spread Curve
0
5
10
15
20
25
30
35
40
45
Spo
t
ED1
ED2
ED3
ED4
ED5
ED6
ED7
ED8
OIS
/Bor
Spr
ead
(bps
)
Source: BNP Paribas
Chart 2: OIS/Bor Spread History
0
10
20
30
40
50
60
70
80
90
100
Jan-
09
Mar
-09
Jun-
09
Sep
-09
Dec
-09
Feb-
10
May
-10
Aug
-10
Nov
-10
Sep
-10
Dec
-10
Basi
s Sp
read
(bp)
OIS/Bor ED2
OIS/Bor ED6
Source: BNP Paribas
Chart 3: OIS/Bor Slope History
-50
-40
-30
-20
-10
0
10
20
30
40
Jan-
09
Mar
-09
Jun-
09
Sep
-09
Dec
-09
Feb-
10
May
-10
Aug
-10
Nov
-10
Sep
-10
Dec
-10
Basi
s Sp
read
(bp)
ED2/ED6 slope
Source: BNP Paribas
38

Mary-Beth Fisher 16 December 2010Market Mover, Non-Objective Research Section www.GlobalMarkets.bnpparibas.com
between a bank’s perception vs. reality of where they can fund.
Longer-dated eurodollar futures, however, appear to be coming under renewed pressure from convexity hedgers who are squaring-up positions before year-end, generating considerable paying in swaps and pushing spreads wider.
We recommend entering an OIS/Bor spread curve steepener by being short the OIS/Bor M11 spread
and long the M12 spread. The primary risk to this position is that an intensifying crisis in the Eurozone translates into sharply higher 3m Libor and this section of the spread curve inverts – similar to what occurred in the spring of 2010 and February of 2009. The Feb09 inversion was sharp but only lasted a few days, while the inversion last spring endured for several weeks. To hedge that risk we recommend overlaying a long 2-year swap spread, which should outperform if such a crisis occurs.
39

Anish Lohokare / Timi Ajibola 16 December 2010Market Mover, Non-Objective Research Section www.GlobalMarkets.bnpparibas.com
MBS: 2011 Outlook – Status Quo We favour an overweight MBS position as
convexity flows are likely behind us with the 10Y selling off beyond 3.50%. Incremental extension in a sell-off is not likely to be material.
Prepays should remain contained on an overall scale in a rally due to capacity constraints.
The status quo is likely to prevail on GSE reform, as close exploration of every possibility leads to a dead end.
Issuance should be about USD 100bn/month at current level of rates with net issuance about flat. More importantly, net supply is choked off as Fed prepays may have slowed from USD 32bn to USD 12bn due to the sell-off and should be readily absorbed by other investors.
We continue to favour up in coupon on attractive carry and the low probability of a government-induced refi wave in 2011.
15s/30s should underperform on the strength of the basis. GN/FNs should maintain the status quo, but if it rallies, up in coupon in GNs could outperform on supply.
We like buying lower coupon specified pools as a cheap option against a rally but higher coupon specifieds may not hold as much value.
Short resets and higher coupon seasoned ARMs offer attractive spreads and IO ARMs should continue to prepay slower with limited prepay opportunities.
We like CMOs that benefit from the slowdown in speeds due to the sell-off that locked out PACs. TBA-ish IIOs look attractive vs storied IIOs for the same reason.
STRATEGY: Overweight into 2011 with up in coupon bias.
Overweight mortgages with the major convexity flush behind us The mortgages basis has suffered as the sell-off caused convexity selling, leading to an overhang of dealer inventory in lower coupons. As shown in Chart 1, the convexity profile of the mortgage universe indicates that the main choke off in prepays happens around the 3.50% 10Y treasury. While these numbers are expressed in 10Y terms, this is a
reasonable mapping from primary mortgage rates given current spread levels. In terms of the current coupon the 4.30% threshold was key in our mind (roughly 75 bp in the money). After convexity selling as Treasuries crossed the 3.50% mark on Wednesday, with the current coupon overshooting to 4.43%, we think that mortgage duration may have a smooth ride in either rate direction going forward. The prepayment S-curve of the universe in aggregate is more relevant since servicers are the dominant convexity hedger in today’s market. Servicer convexity flows do not depend on who holds the MBS. With major convexity selling behind us, we like being overweight mortgages into the New Year.
Prepays: Remain muted, with capacity limits at low rates, though specific coupon-vintages under threat We think that capacity constraints may have come into play in prepays over the past couple of months, and should we rally back to rate lows or beyond, capacity constraints are likely to keep prepayments relatively dampened. Of course, prepays in lower coupons are likely to be significant. But once we hit capacity limits, lack of a further increase in prepayments should keep overall convexity of the universe at bay. In fact, if we rally beyond a certain point, prepays for example in 4.5s and 5s may
Chart 1: FNM 30Y October 2010 S-Curve
33.230.1 30.5
26.5 26.724.3
28.627.7
21.2
8.63.8
1.43.5
0
5
10
15
20
25
30
35
-50 -25 0 25 50 75 100 125 150 175 200 225 250
Moneyness
1m C
PR
s
Nov 15, 2010 (10Y~ 3%)
10Y~ 3.25%
10Y ~ 3.50%
Source: BNP Paribas
Chart 2: 15Y vs 30Y Performance by Coupon (12/15 close)
30Y 1M Performance 15Y 1M Performance30Y 4, 15Y 3.5 -1-05 1 -0-16 230Y 4.5, 15Y 4 -0-30 5 -0-16 730Y 5, 15Y 4.5 -0-13 0 -0-05 530Y 5.5, 15Y 5 0-03 0 0-05 130Y 6, 15Y 5.5 0-19 6 0-10 7
Source: BNP Paribas, Yield Book
40

Anish Lohokare / Timi Ajibola 16 December 2010Market Mover, Non-Objective Research Section www.GlobalMarkets.bnpparibas.com
reduce while those in 4s pick up, as the overall prepay speed remains the same while the contribution of 4s increases pushing that of 4.5s and 5s down. Thus we expect the status quo of muted prepays (<30 CPR aggregate) to be maintained on an overall scale, with specific coupon vintage prepay stories continuing to be in play.
Regulatory outlook: GSE reform too big to solve Status quo is likely to be maintained despite any discussions of reform, as a close exploration of every possibility leads to a dead end. Taking GSEs on the government balance sheet is unlikely to be a palatable option due to the bloody battle over debt ceiling expected even without the GSEs. To find a buyer with enough capital in this market to take on almost USD 5trn mortgage credit portfolio is also unlikely. Equally unlikely is spinning off the companies as private firms due to considerable losses, large delinquent loan portfolios and already low equity prices. GSEs’ retained portfolio is already shrinking, and a faster shrinkage is possible (though esp FRE is significantly lower on portfolio size than mandated). A merger of the GSEs is possible but should not impact the overall marketability of securities. Differences in operations would need to be ironed out. If any or both GSEs are merged with GNMA, in addition to operational constraints, fee schedules and underwriting standards would also have to be merged, but once again this would mean the government taking on GSE debt which seems unlikely.
Supply and demand Even if the refi index were to increase beyond the highs reached recently, capacity constraints are likely to keep supply stuck at current levels. For 2011, we expect issuance to be around the current USD 100bn/month levels at current rate levels. Net issuance is likely to straddle the flat level. Net supply however is a different story due to the reinvestment of Fed MBS paydowns into Treasuries. But due to the sell-off these may have reduced sharply from a USD 32bn level to roughly USD 12bn. Given cheap valuations, both on a spread and rate basis, we see banks, overseas investors and money managers easily taking up this slack, but we may have to wait until the new year to see these flows coming fully to fruition. Of course, these lower prepays on the Fed portfolio may take a couple of months to realize due to processing times.
UIC should outperform The new-year brings in a gridlocked Congress that’s likely to be focussed on high level issues facing the country. The possibility of a government induced refinancing wave is unlikely in our opinion. A sell-off is likely to cause up in coupon flows, helping the trade. A rally may hurt low coupons disproportionately due to convexity and supply, and help up in coupon as well.
15/30s: Negative as 30Ys rebound Lower coupon 15Ys performed very well in the sell-off as lower coupon 30Ys underperformed, but as the mortgage basis rebounds, either after an incremental sell-off or in a further rally, 15s/30s should underperform. As we expect up in coupon in 30Ys to do well, as a result, down in coupon in 15Ys/30Ys may outperform.
Specified Pool Valuation (payup levels indicative only)
MBS Identifier Payup %Even OAS
Payup Payup %Even OAS Payup
FNMA4.5-2008 2008 0 0% 2 -250%FNMA4.5-2007 2007 4 26% 12 71%FNMA4.5-2006 2006 8 34% 18 69%FNMA4.5-2005 2005 12 33% 23 70%FNMA4.5-2004 2004 18 37% 29 73%FNMA4.5-2003 2003 22 36% 38 77%FNMA4.5-2002 2002 26 39% 38 72%
LLB 34 64% 46 43%MLB 22 51% 40 47%HLB 16 60% 25 48%
FNMA5.0-2008 2008 0 0% 0 0%FNMA5.0-2007 2007 0 0% 0 0%FNMA5.0-2006 2006 6 28% 6 27%FNMA5.0-2005 2005 10 35% 20 80%FNMA5.0-2004 2004 16 48% 26 115%FNMA5.0-2003 2003 20 51% 31 110%FNMA5.0-2002 2002 22 44% 36 84%
LLB 60 101% 72 87%MLB 38 83% 60 98%HLB 28 108% 36 116%
FNMA5.5-2008 2008 0 0% 1 -25%FNMA5.5-2007 2007 2 30% 8 173%FNMA5.5-2006 2006 8 72% 18 221%FNMA5.5-2005 2005 12 45% 28 105%FNMA5.5-2004 2004 20 76% 35 213%FNMA5.5-2003 2003 26 80% 40 175%FNMA5.5-2002 2002 21 47% 45 124%
LLB 74 112% 82 91%MLB 60 120% 70 106%HLB 30 106% 32 93%
FNMA6.0-2008 2008 2 -23% 2 -13%FNMA6.0-2007 2007 4 205% 8 141%FNMA6.0-2006 2006 16 407% 20 795%FNMA6.0-2005 2005 32 111% 36 120%FNMA6.0-2004 2004 48 183% 56 225%FNMA6.0-2003 2003 60 215% 60 282%FNMA6.0-2002 2002 68 130% 70 177%
LLB 80 139% 85 117%MLB 56 140% 64 127%HLB 26 148% 32 143%
Source: BNP Paribas, Yield Book
41

Anish Lohokare / Timi Ajibola 16 December 2010Market Mover, Non-Objective Research Section www.GlobalMarkets.bnpparibas.com
GN/FN: status quo We expect a status quo on the structure of the GSEs, and thus the premium attributed to the explicit guarantee for GNs is unlikely to change materially. With the sell-off, Fed paydowns reinvested into treasuries, a negative factor for conventionals, has subsided considerably. Should we rally however, up in coupon in GN/FNs should outperform as lower coupons may suffer due to increased supply. One wild card could be the additional data provided by GNMA. Starting in February 2011, GNMA will require servicers to collect loan purposes data with possible values of purchase, refi, loan mod-hamp and loan mod-non hamp. If the data is not available then the pool would be a fail. GNMA did release some of this data for pools originated since May 2010 but the data provision was voluntary on part of servicers. While there was talk of loss mitigation loans having high CPR, this was not the case in the limited data that was disclosed. Depending on the statistics that ultimately come out, the adverse selection of pools could affect the TBA deliverability.
Spec pools: Comeback in a rally? Pay-ups initially came under pressure at higher rates as concerns moved away from call risk, but have since stabilized. We continue to favour selling seasoned higher coupon pools, as muted prepayments reduce the need for call protection. The moneyness of the coupons implies that extension risk is not likely to come into the picture unless we sell off materially from already high rate levels. We like loan balance collateral off lower coupons, as valuation is attractive after recent cheapening, and it provides excellent insurance in a rally.
ARMs: Favour short resets and high coupon seasoned ARMs As seen in recent prepayment reports, newer collateral in ARMs picked up, responding to lower rates while seasoned collateral remained call protected. In fixed rates on the other hand, in 5s and to some extent in 5.5s, seasoned collateral speeds have been quite significant. In terms of relative value, we continue to like short resets into Q1-2011. Higher coupon seasoned ARMs offer attractive spreads as well. IO ARMs continue to offer call protection vs amortizing ARMs as their refinancing options remain constrained.
CMOs: Pricing in the speed slowdown As the market has sold off, the CMO market appears to have been lagging the pricing in of slower speeds. We like the theme of picking bonds benefiting from this slowdown going into the New Year. Locked out PACs off seasoned 5s for example benefit from this theme. In the inverse IO space, selling bonds off
storied collateral in favour of TBAish collateral makes sense. Consider a locked out PAC off around 66 WALA FG 5s. At an indicative price of 107-04 as of Wednesday 3pm, this bond is only 63 bp to the I-curve at 40 CPR, about the speed at which it paid in Nov. However at a speed of 20 CPR, which is quite reasonable given the considerable slowdown in the refi index, the spread is much higher at 150 bp. If we rally back to only about 2.9% 10Y (our expectation for Q1-11), the profile is still likely to be attractive, as the spread is about 152 bp/I at 25 CPR, as the locked out feature helps protect the bond. The average life profile is also quite protected at relevant prepay speeds, given the PAC structure. Consider two Inverse IOs off 6s, one loan balance another TBAish. The TBA-ish bond at a USD 11 handle as a 4.25% yield to forward (YTF) at 33 CPR, its November speed. If the speed slows down to about 16 CPR, the YTF improves to 16.25%. For the loan balance IIO which prepaid at about 18 CPR last month and priced roughly around 15-24, the YTF is 4.65%, but at 12 CPR it improves to 11.7%. The TBA-ish collateral thus offers a much better YTF if the speed slowdown is maintained.
Chart 4: IO ARMs Continue to be Call Protected; Seasoning Provides Call Protection
in ARMs
0
5
10
15
20
25
30
35
40
45
2010 2009 2008 2007 2006 2005 2004
Vintage
CPR
Libor IO Libor Amort
Source: eMBS
Chart 5: WAL and I-Spread Profiles for a Locked-Out PAC Off Seasoned 5s
0
20
40
60
80
100
120
140
160
6 12 18 24 30 36 420
1
2
3
4
5
6
7
8
9
10
Spd/I WAL
Source: BNP Paribas, Bloomberg
42

Patrick Jacq 16 December 2010Market Mover, Non-Objective Research Section www.GlobalMarkets.bnpparibas.com
EUR: Flattening Trend Will Resume Although the curve is still flatter than at the
start of the year, the flattening bias has been interrupted by strong steepening pressures.
However, the recent correction should prove temporary. Flattening remains the structural theme for the curve next year.
STRATEGY: Receiving the 2-10y remains our key strategic trade for 2011.
The belly of the curve severely hit by QE Same player shoots again… When, in 2009, the Fed started QE1, the US curve suffered bear-steepening pressures that persisted for roughly two months. This also affected the EUR curve. Indeed, bearish pressures on the belly of the curve accompanied the ECB’s rate cuts, favouring lower rates at the short end.
The latest developments are similar in several respects. QE2 is raising inflation expectations, fuelling bear-steepening pressures across the US curve and, given contagion effects, across the EUR curve as well. In 2009, the EUR 2-10y sector steepened by more than 40bp in the sell-off. So far, the recent bear-steepening bias has resulted in a steepening of the EUR 2-10y of more than 50bp. This is a significant move especially as, unlike in 2009, the steepening correction was not aided by a decline in short-term rates. The resteepening that took place therefore seems too large to be consistent with structural factors. Hence there is now room for a return to the structural flattening trend.
Inflation expectations will moderate A decline of inflation expectations is a precondition for a better tone on the belly of the curve. We expect the current rise in inflation expectations to prove temporary. In the main, inflation expectations are tracking actual inflation rates. As core inflation continues to moderate in the US and will remain subdued in Europe, expectations should also decline. This will help to lower the inflation expectation component on medium and long-term yields. Such a development will help the belly of the curve to rally slightly in the early months of 2011.
The short end will be more exposed next year The ECB recently decided to extend its accommodative conditions for liquidity, but this has not prevented the level of excess liquidity from
easing from the peaks reached earlier this year. The outlook for next year is less favourable. The gradual normalisation of liquidity conditions will cause the ECB to remove, at least partly, current non-standard measures. This will put rates at the front end under modest upward pressures. At the moment, the market is discounting that normalisation will be achieved at the start of Q4 2011. So far, this has not spread significantly through the short end of the bond market curve. But, as the normalisation takes place, yields at the short end will push higher. The flattening bias will therefore be reinforced during the year, although the bull flattening we expect in Q1 will gradually give way to bear flattening.
Strategy: Receiving the 2-10y remains our key strategic trade for 2011.
Chart 1: Expectations Track Actual Inflation
Source: BNP Paribas
Chart 2: Higher Real Rates Will Help Flattening
Source: BNP Paribas
43

Patrick Jacq 16 December 2010Market Mover, Non-Objective Research Section www.GlobalMarkets.bnpparibas.com
EUR: Excess Liquidity to Decline Next Week In addition to its regular weekly MRO, the
ECB will have to provide liquidity as EUR 200.9bn are expiring from 3mth and 1y tenders.
We expect liquidity to drop on the back of next week’s operations. The magnitude of the decrease in liquidity will set the tone in the eonia space.
STRATEGY: Benefit from the recent compression to play tactical OIS/BOR (IMM1) spread extension.
Demand at next week’s tenders The expiry of the 3mth (EUR 104bn) and the 1y (EUR 96.9bn) tenders next week will be offset by a new 3mth LTRO and a 13day quick tender that will provide liquidity beyond the turn of the year. From the 1y tender which is maturing, one can expect that at least a quarter will not be rolled, as this corresponds to carry trades benefiting from the last 1y tender the ECB conducted in December 2009. When it comes to the 3mth LTRO expiring, it corresponds to the roll of different LTROs (3tmh, 6mth, 1y) that matured in September. It is difficult to see precisely where demand came from, in particular because liquidity fell significantly at the end of September despite the solid demand for the 3mth. However, liquidity provided at recent 3mth LTRO suggests that demand for this maturity is solid. As a result, the total demand for both 3mth and 13day tenders next week could be in the EUR 150-170bn area, or a EUR 30-50bn drop in liquidity. This range is wide as uncertainty remains high, and the drop in liquidity is significant.
When it comes to the split between 3mth and 13day tenders, it makes sense to see 3mth liquidity still elevated. At the moment, liquidity provided by the MRO is less than EUR 190bn and the liquidity provided by LTROs is slightly below EUR 350bn. After next week’s tenders, we expect a higher proportion to come from short-term liquidity. A split of EUR 130bn/EUR 30bn between the 3mth and the 13day tenders would lead, other things being equal, to an extension of short-term liquidity in the total liquidity provided in the eurosystem.
Limited impact on rates near term The eurosystem is running long of liquidity in the amount of around EUR 90bn. A EUR 40bn fall in liquidity will have therefore have limited impact on rates near term, as excess liquidity will remain
elevated enough at this juncture. Don’t expect significant upward pressures on eonias near term. If liquidity falls more significantly, the impact will be more pronounced. There was evidence in the past that the impact on eonia is more significant when excess liquidity falls below EUR 40bn. As a result, we expect limited impact given our expectations for demand next week. Neither do we expect strong tensions at the end of the year, as a significant proportion of liquidity in the system will run beyond the turn. Further, there will be a MRO on 29 December, which will provide short-term liquidity. The ECB will do what is necessary to avoid year-end tensions. Strategy: Benefit from the recent compression to play tactical OIS/BOR (IMM1) spread extension.
Chart 1: Short-Term Liquidity is Increasing
Source: BNP Paribas
Chart 2: Limited Impact Near Term
Source: BNP Paribas
44

Eric Oynoyan 16 December 2010Market Mover, Non-Objective Research Section www.GlobalMarkets.bnpparibas.com
EUR: Euribor Red/Greens Opportunities Reds Euribor are back in cheap territory
versus fronts and greens and also relative to Euro$.
Further downward pressure – which is likely in illiquid year-end market conditions – should be used to enter bullish trades.
STRATEGY: Sell the U1U2U3 fly in the +12/15 area or the U1H2-U2H3 box at +3/5 targeting -10 on both.
Reds Euribor below mid-November’s lows In this article, we focus on trading opportunities on Euribor flies and calendar spreads. The rally seen at the short end in the wake of disappointing non-farm payrolls was short-lived and some stronger US data over the past week have pushed reds Euribor below mid-November’s lows. The bearish dynamics should persist in the very near term fuelled by weak sterling (November RPI data were again disappointing) and Eurodollar contracts (the latest retail sales data surprised to the upside). However, it is worth remembering that a similar sell-off in December 2009 was followed by a sharp rebound in January.
In addition, 1y calendar spreads, such as the 3rd/7th, currently Sep 11/Sep 12, have bear steepened almost 50bp from late-August’s low and are getting close to the 50% retracement of the November 2009-August 2010 flattening trend. Even though August’s level on spreads should remain the cyclical low, the pricing in of a 65bp tightening on the eonia curve by September 2012 seems excessive given current uncertainty regarding the eurozone.
Chart 1 shows the 3rd/7th/11th generic flies on the USD, Euro and GBP curves. The difference between the Euribor and the Eurodollar flies is really overstretched pointing to the relative cheapness of red Euribor. Another way to underscore that cheapness is the position of the Euribor fly within its distribution relative to the Eurodollar fly. An additional panic sell-off, pushing the Euribor fly to the high 10s, would provide an attractive risk/reward for longs Sep 11 versus Sep 12 and Sep 13 targeting a return to the -5/-10bp area.
Another interesting RV trade on a final downward move would be to sell the front/red-red/green box. As Chart 3 shows, the Sep 11/Mar 12-Sep 12/Mar 13 box disinverted 12bp over the past week’s sell-off. The +5/7bp area has tended to be a strong resistance on the generic over the past year and the dollar one is trading 15bp below the Euribor one!
Strategy: 1) Sell the U1U2U3 Euribor fly in the +12/15 area targeting -10 by late January.
2) Sell the U1H2 – U2H3 box at +3/+5.
Chart 1: Eur, GBP, USD 3/7/11 Gen Flies: Cheapening More Pronounced On Euribor
-70
-55
-40
-25
-10
5
20
35
50
Jan-10 Mar-10 May-10 Jul-10 Sep-10 Nov-10
3/7/11 Euribor fly 3/7/11 Sterling fly 3/7/11 Eurodollar fly
Red Euribor decoupling from Eurodollar
Source: BNP Paribas
Chart 2: Distribution of 3/7/11 Gen Euribor Fly vs. Euro$ One: Euribor Fly Getting Too High
EUR 3/7/11 with USD 3/7/11
0
0.005
0.01
0.015
0.02
0.025
0.03
0.035
0.04
0.045
0.05
-80 -70 -60 -50 -40 -30 -20 -10 0 10 20 30
Peak at -10.1
Current level: 5.0
Selling area
Source: BNP Paribas
Chart 3: 3/5-7/9 Euribor Box: Sell U1H2 vs. U2H3 in the 4-6bp Area
-25
-10
5
20
35
50
65
80
Jan-09 Apr-09 Jul-09 Sep-09 Dec-09 Mar-10 Jun-10 Sep-10 Dec-10
3/5 vs 7/9 Euribor box 3/5 generic Eur spd3/5 vs 9/11 Euribor box 7/9 generic Eur spd
selling area
Source: BNP Paribas
45

Ioannis Sokos 16 December 2010Market Mover, Non-Objective Research Section www.GlobalMarkets.bnpparibas.com
EUR: 2011 EGB Issuance Preview We expect gross EGB issuance of
EUR 827bn in 2011 from EUR 943bn in 2010. In net supply terms, we expect EUR 311bn in 2011 from EUR 430bn in 2010. Bond redemptions will be EUR 35bn higher in 2011 at EUR 548bn. January is expected to be the heaviest month in terms of issuance with an estimated EUR 84bn of EGB supply.
We present the full 2011 bond and bill redemption profile as this often signals pressure points, especially for weaker sovereigns where concentration is higher. Only AAA bond redemptions are scheduled for January. Heavy AAA issuance in early January is historically linked to ASW compression.
A more detailed research piece will follow once the official funding plans of all eurozone issuers have been released.
Forecasting 2011 European government bond (EGB) issuance has become more difficult lately given the need to forecast not only how much a country will issue in the coming year but also whether a country will need to issue in the first place or not. We expect Greece and Ireland to stay away from the primary markets in 2011 as they are both under EU/IMF aid mechanisms that cover state financing except for T-bills which will keep being rolled-on in the market. In our central case scenario, we believe that, sooner or later, Portugal will need to follow the same route towards the EFSF but we do not believe this will be the case for Spain, which we do not think faces the same fate at the three smaller peripherals. As a result, a direct comparison between 2010 and estimated 2011 issuance is distorted by the fact that not all countries that issued paper in 2010 will issue in 2011.
Nevertheless, we expect both gross and net 2011 issuance to decline since most European governments have adopted fiscal consolidation measures aimed at decreasing their budget deficits. Bond redemptions will be higher in 2011 (by EUR 35bn), offsetting part of the impact of the fiscal consolidation efforts on gross supply, but net supply will decrease significantly in the year ahead (see Table 1 for more details). In total, we expect 2011 EGB issuance of around EUR 827bn, down from 943bn in 2010 (-12%). In net supply terms in 2011, a steeper reduction is expected to around EUR 311bn from EUR 430bn in 2010 (-28%). Note these
forecasts are subject to revision on the release of eurozone countries’ funding plans for 2011.
Charts 1 and 2 show the gross and net supply figures in the 2009-2011 period for eurozone countries. In percentage terms, we expect Belgium (-17%), Portugal (-17%) and Italy (-13%) to see the biggest decrease in gross supply in the year ahead. In net supply terms, Portugal, Belgium and Germany will
Table 1: 2011 EGB Issuance Projections EUR Sovereign Financing: Projections for 2011 (EUR bn)
Issuer Redemptions Deficit Borrowing Needs Bond Issuance Net IssuanceAustria 8.3 10.2 18 19 21 11 12Belgium 24.0 16.0 40 34 41 10 16Finland 5.7 6.3 12 15 16 9 7France 91.8 90.0 182 180 188 88 105
Germany 147.3 33.0 180 195 207 48 74Greece 27.7 18.7 46 - 18 - 2Ireland 4.4 16.4 24 - 22 - 22
Italy 155.2 73.0 228 225 260 70 88Netherlands 27.9 23.9 52 50 52 22 29
Portugal 9.6 9.3 19 18 22 8 16Slovenia 1.0 2.1 3 3 3 2 2
Spain 45.1 43.7 89 88 94 43 59Total 548 343 894 827 943 311 430
2010 Bond Issuance
2010 Net Issuance
Source: BNP Paribas
Chart 1: Gross Supply in 2009-2011 Gross Supply
0
40
80
120
160
200
240
280
German
y
France
Italy
Spain
Netherl
ands
Belgium
Austria
Portug
al
Finlan
d
Irelan
d
Greece
Slovenia
2009 2010 2011 est.
Source: BNP Paribas
Chart 2: Net Supply in 2009-2011
Net Supply
0
20
40
60
80
100
120
German
y
France
Italy
Spain
Netherl
ands
Belgium
Austria
Portug
al
Finlan
d
Irelan
d
Greece
Slovenia
2009 2010 2011 est.
Source: BNP Paribas
46

Ioannis Sokos 16 December 2010Market Mover, Non-Objective Research Section www.GlobalMarkets.bnpparibas.com
see the biggest falls although net supply will be much lower in almost all eurozone countries in 2011.
As we’ve seen over the course of 2010, the redemption profile can signal pressure points for weaker sovereigns. In Table 2 we present the monthly bond and bill redemption profile for 2011. In January, for example, only AAA bond redemptions are scheduled. For Spain, the pressure points will be in April, July and October in 2011, while for Portugal they lie in April and June. Countries with a higher concentration in terms of accumulated redemptions as a percentage of the total, such as Portugal and Spain, usually face higher pressure around their redemption dates. The redemptions of core countries are better dispersed throughout the year. In the table we include redemptions of bonds issued in all currencies and this is why the total figure of EUR 569bn is higher than the figure shown in Table 1.
In Table 3 we estimate the monthly issuance in each country taking into account the historical patterns of issuance and the existing redemption profile. As is usually the case, January is expected to be the heaviest month in terms of EGB issuance with a EUR 84bn forecast. Bear in mind that EFSF and EFSM issuance needs to be added on top of that figure. AAA issuance in January is estimated at around EUR 50bn. This could lead to a compression in ASW in January, repeating a seasonal pattern that has been seen in previous years. EFSF’s Regling has already said that the EFSF may issue between EUR 5bn and 8bn of bonds in January. At these levels we do not think that the extra EFSF issuance will have an impact on AAA eurozone issuance.
In 2010, the 10y sector’s share of total issuance rose to 31% from 27% in 2009. The 30y sector’s share of total issuance was unchanged at 7%. In 2011 we expect core countries to increase the duration of their debt, taking into account the search for duration by real money accounts. T-Bill issuance could decrease further, continuing the trend seen in 2010. In the case of Germany which is one of the few countries that has released its funding plans, the breakdown across different maturity buckets will not change much compared to 2010. 2y and 5y issuance increases by 1.1% as a percentage of total supply while 10y issuance’s share falls by 1.4% and 30y issuance’s by 0.8%.
Finally, for Spain, we calculate that redemptions that stem from regional bonds in 2011 amount to around EUR 6.5bn versus a 50bn outstanding. Out of these EUR 6.5bn, 3.7bn will expire in November. These figures are not high enough to be a threat right now since SPGB redemptions will be EUR 46bn in 2011 and Spanish Letras another EUR 73bn.
2011 issuance starts in December with the end-of-month Italian auctions which settle in the first days of 2011. Then, during the first week of January, Germany will tap the 10y DBR Jan-21 for EUR 5bn. We also expect France to issue OATs that week. Austria and Netherlands are expected to issue bonds in the second week of the year, together with Italy and potentially Spain. In the absence of Greece and Ireland, we expect Portuguese and Spanish auctions to be a barometer for investors’ appetite for peripherals.
Table 2: Monthly Bond & Bill Redemptions
Bonds Jan Feb Mar Apr May Jun Jul Aug Sep Oct Nov Dec 2011ITA 0.0 21.7 30.5 0.0 14.6 12.2 2.7 20.2 46.0 0.0 15.5 0.0 163.3FRA 17.8 0.0 0.0 18.4 0.0 0.0 29.3 0.0 13.8 15.7 0.0 0.0 95.0GER 23.3 0.0 15.0 19.0 0.0 15.0 24.0 0.0 16.0 17.0 0.0 18.0 147.3SPA 0.0 0.0 0.0 15.5 0.0 0.0 17.0 0.0 0.0 14.1 0.0 0.0 46.6GRE 0.0 0.0 9.1 1.0 7.0 0.0 0.0 6.8 0.0 0.0 0.0 5.8 29.8BEL 0.0 0.0 11.3 0.0 0.0 3.4 0.0 0.0 12.7 0.0 0.0 0.6 28.0NET 13.9 0.0 0.0 0.0 0.0 0.0 14.1 0.0 0.0 0.0 0.0 0.0 27.9AUS 8.3 0.1 0.1 0.0 0.9 0.0 0.6 0.0 0.0 0.0 0.0 0.1 10.0POR 0.0 0.0 0.0 4.5 0.0 5.0 0.0 0.0 0.0 0.0 0.0 0.0 9.5IRE 0.0 0.0 0.0 0.0 0.0 0.0 0.0 0.0 0.0 0.0 4.5 0.0 4.5FIN 0.0 5.7 0.0 0.0 1.5 0.0 0.0 0.1 0.1 0.0 0.0 0.0 7.3
Total 63.2 27.4 66.1 58.5 24.0 35.5 87.6 27.1 88.6 46.7 20.0 24.5 569.2
T-Bills Jan Feb Mar Apr May Jun Jul Aug Sep Oct Nov Dec 2011ITA 17.4 17.3 17.3 17.3 14.6 6.6 7.5 7.2 7.7 7.2 6.1 4.2 130.1FRA 33.3 35.9 29.7 15.1 15.8 14.2 8.5 7.4 5.6 7.1 5.8 2.0 180.3GER 11.0 11.0 11.0 11.0 11.0 11.0 4.0 4.0 4.0 3.0 3.0 2.0 86.0SPA 8.7 7.8 6.5 6.2 6.5 4.2 4.2 7.1 5.3 8.2 3.7 4.6 73.0GRE 4.2 0.4 1.4 2.4 0.4 0.0 0.0 0.0 0.0 0.0 0.0 0.0 8.8BEL 5.5 6.2 6.4 4.1 3.7 2.0 1.9 2.1 2.0 2.0 1.8 1.6 39.5NET 9.7 8.3 11.6 3.5 4.0 8.0 0.0 0.0 2.7 0.0 0.0 0.0 47.9AUS 0.1 0.0 0.7 1.1 0.0 0.0 0.2 0.9 0.2 0.2 0.3 0.0 3.5POR 3.4 3.5 3.8 0.0 0.0 0.0 1.8 1.4 1.4 1.4 1.4 0.0 18.1IRE 2.1 1.2 1.6 1.3 0.0 0.0 0.0 0.0 0.0 0.0 0.0 0.0 6.0FIN 3.6 2.2 2.5 1.1 1.5 0.0 0.0 0.0 0.0 0.0 0.0 0.0 10.8
Total 99.0 93.7 92.4 63.0 57.4 46.0 28.0 30.1 28.9 29.0 22.1 14.4 604.0
Source: BNP Paribas
Table 3: Monthly/Country Breakdown of 2011 EGB Issuance
2011 GER FRA ITA SPA NET BEL AUS POR FIN TotalJan 19.0 19.7 20.6 9.1 5.5 4.2 4.0 0.8 1.0 83.9Feb 18.0 16.2 19.6 8.5 6.5 3.7 1.5 3.3 0.0 77.3Mar 16.0 19.9 18.0 10.5 3.0 3.3 1.5 0.8 4.0 77.1Apr 19.0 16.7 23.2 5.2 6.5 3.3 2.0 1.7 1.5 79.0May 19.0 17.6 15.2 6.2 7.8 0.0 1.8 1.8 0.0 69.4Jun 18.0 17.4 23.2 7.7 3.5 3.3 1.9 2.2 1.5 78.7Jul 11.0 17.0 16.8 12.4 6.0 6.6 1.2 2.5 0.0 73.5Aug 13.0 0.0 18.5 3.3 0.0 2.8 0.9 1.1 0.0 39.5Sep 20.0 16.5 23.7 6.9 2.5 2.9 1.9 1.7 4.0 80.0Oct 12.0 16.9 21.2 6.6 5.7 2.3 1.4 1.0 1.7 68.9Nov 20.0 16.7 18.1 8.5 3.0 1.7 1.0 1.0 1.5 71.4Dec 10.0 5.3 6.8 3.2 0.0 0.0 0.0 0.0 0.0 25.3
Total 195 180 225 88 50 34 19 18 15 824
Source: BNP Paribas
47

Matteo Regesta 16 December 2010Market Mover, Non-Objective Research Section www.GlobalMarkets.bnpparibas.com
Gilts: Strategic Trades for 2011 Realised Gilt interest rate volatility has
markedly increased since mid-October. It has hence become a complex task to establish strategic positions given the elevated macro uncertainty. In this context, we recommend two trades for investors with a medium-term horizon.
STRATEGY: a) Buy Gilt 4.25% 2039 asset swap around 6M Libor +29bp; b) sell the Gilt/Bund 2s10s box, i.e. sell Gilt 5.25% 2012 vs Gilt 4.75% 2020 duration weighted and buy Schatz 1.00% 2012 vs Bund 3.25% 2020 duration weighted.
Gilts have recently been driven more by events in the eurozone than domestic developments. Level correlation with Germany has increased above 0.9 since November (Chart 1). Indeed, interest rate volatility has markedly increased. In contrast to gyrations in yields, swap spreads have been relatively stable over the past month. The average spreads on Short and Medium Gilts are unchanged whereas the average spread has widened by 3bp on Long Gilts. At the same time, gross financing requirement is expected to remain stable around GBP 170bn in 2011 and to drop from GBP 143bn in 2012 to GBP 87bn in 2014 (Chart 2). Meanwhile, Moody’s UK banking system outlook released on Monday remains negative. Of particular concern, in our view, is the still-high utilisation of wholesale funding which exposes banks to refinancing risk as the SLS will not be renewed. GBP 110bn is to be repaid by February 2010. Moreover, GBP 125bn of government-guaranteed debt will mature through April 2014. Clearly, the cost of liquidity (hence libor rates) will increase. We thus recommend playing the normalisation of Long-Gilts swap spreads, which are still hovering in negative territory. Strategy: Buy Gilt 4.25% 2039 asset swap around 6M Libor +29bp. The Gilt/Bund 2s10s box is hovering around 40bp. In our view, steepening pressures on core yield curves in the eurozone next year will be more pronounced than on the Gilt curve. Firstly, markets are likely to price in increased exposure of core paper in the eurozone to the euro periphery via the EFSF while Gilts could retain their status as safe haven assets. Note that the price return for the 7y-10y sectors in Germany and in the UK in November (peak of Irish crisis) were -1.36% and -1.26% respectively. Secondly, inflation and inflation expectations are markedly different. The BoE will be expected to
tighten earlier than the ECB, we think. Accordingly we recommend short positions in the box at current levels. It visited levels below -140bp in mid-2004 when the policy rate differential reached 2.75% (Chart 3). Strategy: Sell Gilt 5.25% 2012 vs buy Gilt 4.75% 2020 duration weighted. Buy Schatz 1.00% 2012 vs Sell Bund 3.25% 2020 duration weighted.
Chart 1: Gilt/Bund Rolling Correlation
Source: BNP Paribas
Chart 2: Evolution of Gilt Issuance
Source: BNP Paribas
Chart 3: Gilt/Bund 2s10s Box
-2.0
-1.5
-1.0
-0.5
0.0
0.5
1.0
1.5
2.0
2003 2004 2005 2006 2007 2008 2009 2010 Source: BNP Paribas
0
50
100
150
200
250
1998 2000 2002 2004 2006 2008 2010 2012 2014
Gilt Issuance
BNP Paribas Forecast
GBP bn
0.0
0.1
0.2
0.3
0.4
0.5
0.6
0.7
0.8
0.9
1.0
Jan-09 Jul-09 Jan-10 Jul-100.5
0.6
0.7
0.8
0.9
1.0
3M Corr (Gilt 10y, Bund 10y)
3M F.D. Corr(Gilt 10y, Bund 10y) -(RHS)
Dec-10
48
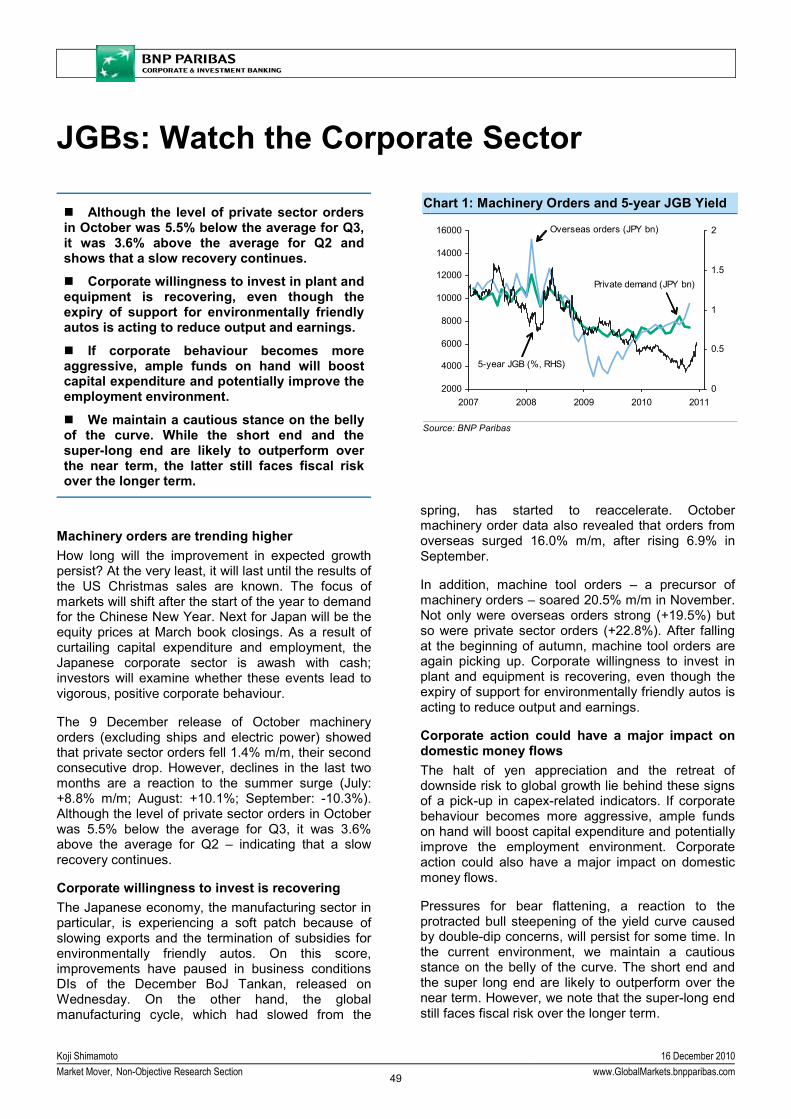
Koji Shimamoto 16 December 2010Market Mover, Non-Objective Research Section www.GlobalMarkets.bnpparibas.com
JGBs: Watch the Corporate Sector
Although the level of private sector orders in October was 5.5% below the average for Q3, it was 3.6% above the average for Q2 and shows that a slow recovery continues.
Corporate willingness to invest in plant and equipment is recovering, even though the expiry of support for environmentally friendly autos is acting to reduce output and earnings.
If corporate behaviour becomes more aggressive, ample funds on hand will boost capital expenditure and potentially improve the employment environment.
We maintain a cautious stance on the belly of the curve. While the short end and the super-long end are likely to outperform over the near term, the latter still faces fiscal risk over the longer term.
Machinery orders are trending higher How long will the improvement in expected growth persist? At the very least, it will last until the results of the US Christmas sales are known. The focus of markets will shift after the start of the year to demand for the Chinese New Year. Next for Japan will be the equity prices at March book closings. As a result of curtailing capital expenditure and employment, the Japanese corporate sector is awash with cash; investors will examine whether these events lead to vigorous, positive corporate behaviour.
The 9 December release of October machinery orders (excluding ships and electric power) showed that private sector orders fell 1.4% m/m, their second consecutive drop. However, declines in the last two months are a reaction to the summer surge (July: +8.8% m/m; August: +10.1%; September: -10.3%). Although the level of private sector orders in October was 5.5% below the average for Q3, it was 3.6% above the average for Q2 – indicating that a slow recovery continues.
Corporate willingness to invest is recovering The Japanese economy, the manufacturing sector in particular, is experiencing a soft patch because of slowing exports and the termination of subsidies for environmentally friendly autos. On this score, improvements have paused in business conditions DIs of the December BoJ Tankan, released on Wednesday. On the other hand, the global manufacturing cycle, which had slowed from the
spring, has started to reaccelerate. October machinery order data also revealed that orders from overseas surged 16.0% m/m, after rising 6.9% in September.
In addition, machine tool orders – a precursor of machinery orders – soared 20.5% m/m in November. Not only were overseas orders strong (+19.5%) but so were private sector orders (+22.8%). After falling at the beginning of autumn, machine tool orders are again picking up. Corporate willingness to invest in plant and equipment is recovering, even though the expiry of support for environmentally friendly autos is acting to reduce output and earnings.
Corporate action could have a major impact on domestic money flows The halt of yen appreciation and the retreat of downside risk to global growth lie behind these signs of a pick-up in capex-related indicators. If corporate behaviour becomes more aggressive, ample funds on hand will boost capital expenditure and potentially improve the employment environment. Corporate action could also have a major impact on domestic money flows.
Pressures for bear flattening, a reaction to the protracted bull steepening of the yield curve caused by double-dip concerns, will persist for some time. In the current environment, we maintain a cautious stance on the belly of the curve. The short end and the super long end are likely to outperform over the near term. However, we note that the super-long end still faces fiscal risk over the longer term.
Chart 1: Machinery Orders and 5-year JGB Yield
2000
4000
6000
8000
10000
12000
14000
16000
2007 2008 2009 2010 20110
0.5
1
1.5
2
5-year JGB (%, RHS)
Overseas orders (JPY bn)
Private demand (JPY bn)
Source: BNP Paribas
49
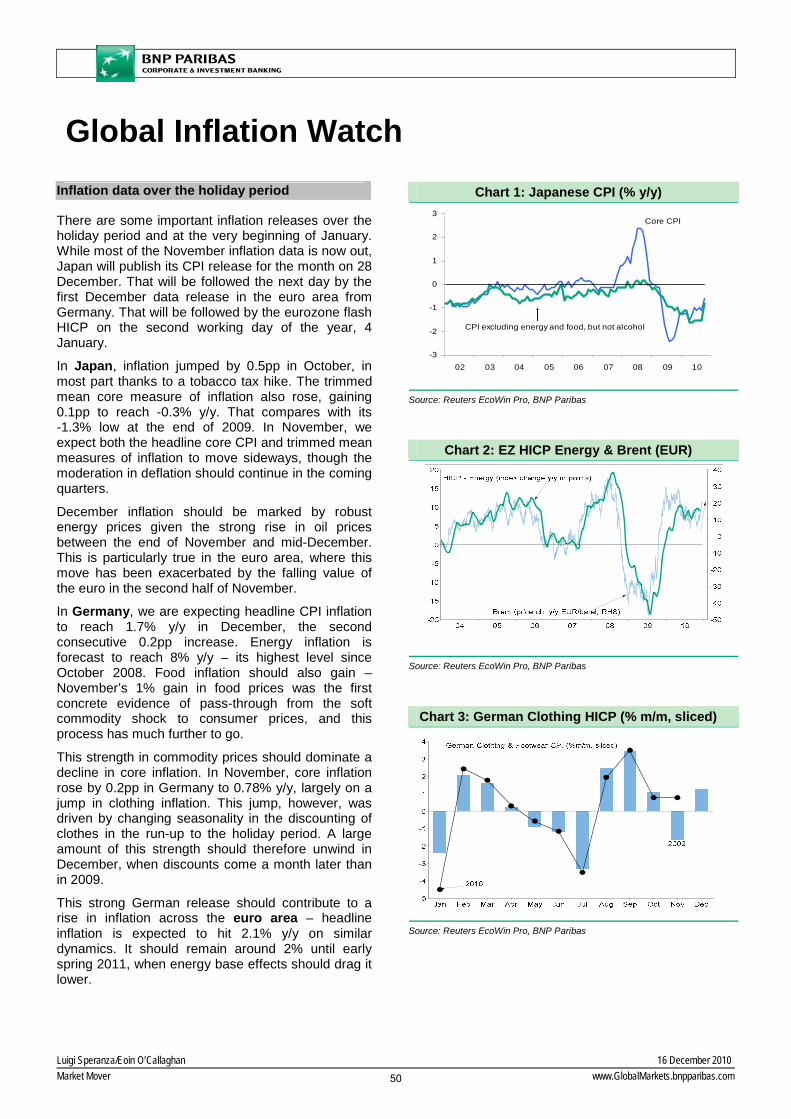
Luigi Speranza/Eoin O’Callaghan 16 December 2010Market Mover www.GlobalMarkets.bnpparibas.com
Global Inflation WatchInflation data over the holiday period
There are some important inflation releases over the holiday period and at the very beginning of January. While most of the November inflation data is now out, Japan will publish its CPI release for the month on 28 December. That will be followed the next day by the first December data release in the euro area from Germany. That will be followed by the eurozone flash HICP on the second working day of the year, 4 January.
In Japan, inflation jumped by 0.5pp in October, in most part thanks to a tobacco tax hike. The trimmed mean core measure of inflation also rose, gaining 0.1pp to reach -0.3% y/y. That compares with its -1.3% low at the end of 2009. In November, we expect both the headline core CPI and trimmed mean measures of inflation to move sideways, though the moderation in deflation should continue in the coming quarters.
December inflation should be marked by robust energy prices given the strong rise in oil prices between the end of November and mid-December. This is particularly true in the euro area, where this move has been exacerbated by the falling value of the euro in the second half of November.
In Germany, we are expecting headline CPI inflation to reach 1.7% y/y in December, the second consecutive 0.2pp increase. Energy inflation is forecast to reach 8% y/y – its highest level since October 2008. Food inflation should also gain – November’s 1% gain in food prices was the first concrete evidence of pass-through from the soft commodity shock to consumer prices, and this process has much further to go.
This strength in commodity prices should dominate a decline in core inflation. In November, core inflation rose by 0.2pp in Germany to 0.78% y/y, largely on a jump in clothing inflation. This jump, however, was driven by changing seasonality in the discounting of clothes in the run-up to the holiday period. A large amount of this strength should therefore unwind in December, when discounts come a month later than in 2009.
This strong German release should contribute to a rise in inflation across the euro area – headline inflation is expected to hit 2.1% y/y on similar dynamics. It should remain around 2% until early spring 2011, when energy base effects should drag it lower.
Chart 1: Japanese CPI (% y/y)
-3
-2
-1
0
1
2
3
02 03 04 05 06 07 08 09 10
Core CPI
CPI excluding energy and food, but not alcohol
Source: Reuters EcoWin Pro, BNP Paribas
Chart 2: EZ HICP Energy & Brent (EUR)
Source: Reuters EcoWin Pro, BNP Paribas
Chart 3: German Clothing HICP (% m/m, sliced)
Source: Reuters EcoWin Pro, BNP Paribas
50

Luigi Speranza/Eoin O’Callaghan 16 December 2010Market Mover www.GlobalMarkets.bnpparibas.com
Index % m/m % y/y Index % m/m % y/y Index % m/m % y/y index % m/m % y/y Index % m/m % y/y Index % m/m % y/y2009 108.1 - 0.3 107.9 - 0.2 119.3 - 0.1 118.0 - 0.1 214.5 - -0.3 214.5 - -0.42010(1) 109.8 - 1.6 109.5 - 1.5 121.1 - 1.5 119.8 - 1.5 218.1 - 1.6 218.0 - 1.62011(1) 111.6 - 1.6 111.2 - 1.6 123.2 - 1.7 121.7 - 1.6 221.0 - 1.3 221.0 - 1.4
Q3 2009 108.0 - -0.4 107.8 - -0.5 119.4 - -0.4 118.1 - -0.4 215.4 - -1.6 215.7 - -1.6Q4 2009 108.6 - 0.4 108.4 - 0.3 119.7 - 0.4 118.4 - 0.3 216.8 - 1.5 216.2 - 1.4Q1 2010 108.6 - 1.1 108.3 - 1.0 120.3 - 1.3 119.0 - 1.2 217.6 - 2.4 217.0 - 2.4Q2 2010 110.0 - 1.5 109.7 - 1.4 121.3 - 1.6 120.0 - 1.5 217.2 - 1.8 218.1 - 1.8Q3 2010 109.9 - 1.7 109.5 - 1.6 121.2 - 1.5 119.8 - 1.5 218.0 - 1.2 218.3 - 1.2Q4 2010(1) 110.8 - 2.0 110.4 - 1.9 121.7 - 1.6 120.2 - 1.6 219.4 - 1.2 218.8 - 1.2Q1 2011(1) 110.7 - 1.9 110.3 - 1.9 122.2 - 1.6 120.8 - 1.5 220.6 - 1.4 220.0 - 1.4Q2 2011(1) 111.6 - 1.5 111.2 - 1.4 123.1 - 1.5 121.6 - 1.4 220.8 - 1.6 221.6 - 1.6
Jan 10 108.1 -0.8 1.0 107.75 -0.8 0.9 119.7 -0.2 1.1 118.32 -0.2 1.0 217.6 0.2 2.7 216.69 0.3 2.6Feb 10 108.4 0.3 0.9 108.10 0.3 0.8 120.4 0.6 1.3 118.99 0.6 1.2 217.6 0.0 2.2 216.74 0.0 2.1Mar 10 109.4 0.9 1.4 109.09 0.9 1.3 120.9 0.5 1.6 119.58 0.5 1.5 217.7 0.1 2.4 217.63 0.4 2.3Apr 10 109.9 0.5 1.5 109.58 0.4 1.4 121.3 0.3 1.7 119.90 0.3 1.6 217.6 -0.1 2.2 218.01 0.2 2.2May 10 110.0 0.1 1.6 109.71 0.1 1.5 121.4 0.1 1.6 120.04 0.1 1.6 217.2 -0.2 2.0 218.18 0.1 2.0Jun 10 110.0 0.0 1.4 109.70 0.0 1.3 121.4 0.0 1.5 120.02 0.0 1.4 216.9 -0.1 1.1 217.97 -0.1 1.1Jul 10 109.7 -0.3 1.7 109.31 -0.4 1.7 121.0 -0.3 1.7 119.68 -0.3 1.6 217.6 0.3 1.3 218.01 0.0 1.2Aug 10 109.9 0.2 1.6 109.54 0.2 1.5 121.3 0.2 1.4 119.97 0.2 1.3 218.2 0.3 1.2 218.31 0.1 1.1Sep 10 110.1 0.2 1.8 109.76 0.2 1.7 121.2 -0.1 1.6 119.88 -0.1 1.5 218.4 0.1 1.1 218.44 0.1 1.1Oct 10 110.5 0.4 1.9 110.16 0.4 1.8 121.4 0.1 1.6 120.03 0.1 1.5 218.9 0.2 1.2 218.71 0.1 1.2Nov 10 110.6 0.1 1.9 110.27 0.1 1.8 121.5 0.1 1.6 120.09 0.0 1.5 219.1 0.1 1.1 218.80 0.0 1.1Dec 10(1) 111.2 0.5 2.1 110.87 0.5 2.1 122.1 0.4 1.8 120.59 0.4 1.7 220.2 0.5 1.4 218.85 0.0 1.3Jan 11(1) 110.3 -0.9 2.0 109.87 -0.9 2.0 121.7 -0.3 1.7 120.24 -0.3 1.6 220.4 0.1 1.3 219.52 0.3 1.3Feb 11(1) 110.6 0.3 2.1 110.25 0.3 2.0 122.3 0.5 1.6 120.83 0.5 1.5 220.7 0.2 1.4 219.95 0.2 1.5Mar 11(1) 111.3 0.6 1.7 110.89 0.6 1.6 122.7 0.3 1.4 121.19 0.3 1.3 220.6 -0.1 1.3 220.58 0.3 1.4Apr 11(1) 111.5 0.2 1.5 111.11 0.2 1.4 123.0 0.2 1.4 121.47 0.2 1.3 220.7 0.1 1.4 221.16 0.3 1.4May 11(1) 111.6 0.1 1.5 111.24 0.1 1.4 123.2 0.2 1.5 121.69 0.2 1.4 220.8 0.0 1.7 221.72 0.3 1.6Jun 11(1) 111.7 0.0 1.5 111.27 0.0 1.4 123.3 0.1 1.6 121.77 0.1 1.5 220.9 0.0 1.8 222.04 0.1 1.9UpdatedNext ReleaseSource: BNP Paribas, (1) Forecasts
Dec Flash HICP (Jan 4)
Table 1: BNP Paribas' Inflation Forecasts
Dec CPI (Jan 13) Dec CPI (Jan 14)
Dec 16 Dec 16Dec 16
Headline HICP Ex-tobacco HICPEurozone
Headline CPI Ex-tobacco CPIFrance US
CPI Urban SA CPI Urban NSA
Chart 5: US Core CPI (% y/y)
Source: Reuters EcoWin Pro
The downward trend in shelter inflation was recently interrupted and leading indicators suggest its strength will continue until year-end. The renewed collapse in the housing market should see a reversion to a downward trend from early next year.
Chart 4: Eurozone Core HICP (% y/y)
Source: Reuters EcoWin Pro
Since printing an all-time low in April, core inflation has been a touch stronger in recent months, reflecting gains in both core goods and core services inflation. While we expect core services inflation to head lower, the rebound in core goods has further to run. We expect a brief interruption to the downward trend in core.
51

Luigi Speranza/Eoin O’Callaghan 16 December 2010Market Mover www.GlobalMarkets.bnpparibas.com
Index % m/m % y/y Index % m/m % y/y Index % m/m % y/y Index % m/m % y/y Index % m/m % y/y Index % m/m % y/y2009 100.3 - -1.3 100.3 - -1.3 110.8 - 2.1 213.7 - -0.5 299.7 - -0.3 191.2 - 1.92010(1) 99.2 - -1.1 99.2 - -1.1 114.5 - 3.3 223.6 - 4.6 303.3 - 1.2 195.1 - 2.02011(1) 98.6 - -0.6 98.6 - -0.6 118.3 - 3.3 232.7 - 4.1 309.2 - 2.0 197.6 - 1.3
Q3 2009 99.9 - -2.3 100.1 - -2.3 111.3 - 1.5 214.4 - -1.4 299.5 - -1.2 191.6 - 1.6Q4 2009 99.7 - -1.8 99.9 - -1.8 112.1 - 2.1 216.9 - 0.6 301.3 - -0.4 193.2 - 2.3Q1 2010 99.7 - -1.3 99.3 - -1.2 112.9 - 3.2 219.3 - 4.0 301.2 - 1.0 194.0 - 2.6Q2 2010 99.3 - -1.2 99.3 - -1.2 114.4 - 3.4 223.5 - 5.1 302.8 - 1.1 194.9 - 2.1Q3 2010 98.8 - -1.1 99.1 - -1.0 114.7 - 3.1 224.5 - 4.7 302.9 - 1.1 194.8 - 1.7Q4 2010(1) 99.1 - -0.6 99.3 - -0.6 115.8 - 3.3 227.0 - 4.7 306.2 - 1.6 196.5 - 1.7Q1 2011(1) 98.9 - -0.9 98.4 - -0.9 117.0 - 3.6 229.4 - 4.6 305.9 - 1.5 195.5 - 0.8Q2 2011(1) 98.7 - -0.6 98.7 - -0.6 118.2 - 3.3 232.6 - 4.1 309.0 - 2.1 197.2 - 1.2
Jan 10 99.6 -0.1 -1.3 99.2 -0.6 -1.3 112.4 -0.2 3.4 217.9 0.0 3.7 299.8 -0.6 0.6 193.0 -0.2 2.6Feb 10 99.8 0.2 -1.2 99.2 0.0 -1.2 112.9 0.4 3.0 219.2 0.6 3.7 301.6 0.6 1.2 194.2 0.6 2.7Mar 10 99.8 0.0 -1.2 99.5 0.3 -1.2 113.5 0.5 3.4 220.7 0.7 4.4 302.3 0.2 1.2 194.7 0.3 2.5Apr 10 99.3 -0.5 -1.5 99.2 -0.3 -1.5 114.2 0.6 3.7 222.8 1.0 5.3 302.4 0.0 1.0 194.8 0.0 2.2May 10 99.3 0.0 -1.2 99.3 0.1 -1.2 114.4 0.2 3.3 223.6 0.4 5.1 302.9 0.2 1.2 195.0 0.1 2.1Jun 10 99.2 -0.1 -1.0 99.3 0.0 -1.0 114.6 0.2 3.2 224.1 0.2 5.0 303.0 0.0 0.9 195.0 0.0 1.9Jul 10 98.9 -0.3 -1.1 99.0 -0.3 -1.1 114.3 -0.3 3.1 223.6 -0.2 4.8 302.0 -0.3 1.1 194.3 -0.3 1.7Aug 10 98.8 -0.1 -1.0 99.1 0.1 -1.0 114.9 0.5 3.1 224.5 0.4 4.7 302.1 0.0 0.9 194.3 0.0 1.4Sep 10 98.7 -0.1 -1.1 99.1 0.0 -1.1 114.9 0.0 3.0 225.3 0.4 4.6 304.6 0.8 1.4 195.8 0.8 1.8Oct 10 99.1 0.4 -0.6 99.5 0.4 -0.6 115.2 0.2 3.1 225.8 0.2 4.5 305.6 0.3 1.5 196.3 0.3 1.8Nov 10(1) 99.2 0.1 -0.6 99.3 -0.2 -0.6 115.6 0.4 3.2 226.8 0.4 4.7 306.6 0.3 1.8 196.8 0.2 1.9Dec 10(1) 99.1 -0.1 -0.6 99.2 -0.1 -0.6 116.6 0.9 3.6 228.4 0.7 4.8 306.5 0.0 1.6 196.4 -0.2 1.5Jan 11(1) 99.0 -0.1 -0.6 98.6 -0.6 -0.6 116.6 -0.1 3.7 228.4 0.0 4.8 304.4 -0.7 1.5 194.7 -0.9 0.8Feb 11(1) 98.9 -0.1 -0.9 98.3 -0.3 -0.9 117.1 0.5 3.8 229.5 0.5 4.7 306.1 0.6 1.5 195.5 0.4 0.6Mar 11(1) 98.7 -0.2 -1.1 98.4 0.1 -1.1 117.4 0.3 3.5 230.3 0.3 4.3 307.1 0.3 1.6 196.3 0.5 0.8Apr 11(1) 98.7 0.0 -0.6 98.6 0.2 -0.6 117.9 0.4 3.3 232.0 0.8 4.1 308.6 0.5 2.1 196.9 0.3 1.1May 11(1) 98.7 0.0 -0.6 98.7 0.1 -0.6 118.2 0.3 3.3 232.7 0.3 4.1 309.1 0.2 2.1 197.2 0.2 1.1Jun 11(1) 98.6 -0.1 -0.6 98.7 0.0 -0.6 118.4 0.1 3.3 233.0 0.2 4.0 309.2 0.0 2.1 197.4 0.1 1.2UpdatedNext ReleaseSource: BNP Paribas, (1) Forecasts
Dec CPI (Jan 13)Dec CPI (Jan 18)
Table 2: BNP Paribas' Inflation Forecasts
Nov CPI (Dec 28)
Nov 26 Dec 14 Dec 09
RPIUK SwedenJapan
Headline CPI CPI CPIFCore CPI SA Core CPI NSA
Chart 6: Japanese CPI (% y/y)
Source: Reuters EcoWin Pro
Prices are expected to continue falling but the pace of decline is easing as the economy recovers.
Chart 7: UK CPI (% y/y)
Source: Reuters EcoWin Pro, BNP Paribas
We expect inflation to remain above target for the remainder of the year, although trending down.
52

Luigi Speranza/Eoin O’Callaghan 16 December 2010Market Mover www.GlobalMarkets.bnpparibas.com
Index % q/q % y/y Index % q/q % y/y Index % q/q % y/y Index % q/q % y/y Index % q/q % y/y Index % q/q % y/y2009 114.4 0.3 113.6 1.8 125.7 2.2 118.4 2.6 167.8 - 1.8 - - 3.72010(1) 116.5 1.8 115.5 1.6 128.7 2.3 120.0 1.4 172.9 - 3.1 - - 2.82011(1) 118.6 1.8 117.1 1.4 130.3 1.3 121.6 1.3 178.3 - 3.3 - - 2.9
Q3 2009 114.7 0.5 -0.9 113.9 1.2 1.6 125.8 0.0 1.8 118.5 0.0 2.4 168.6 1.0 1.3 - - 3.5Q4 2009 114.9 0.6 0.8 114.4 1.9 1.6 126.6 0.6 1.4 119.3 0.7 2.3 169.5 0.5 2.1 - - 3.4Q1 2010 115.4 2.0 1.6 114.9 1.6 1.9 128.4 1.4 2.9 119.4 0.1 2.0 171.0 0.9 2.9 - - 3.1Q2 2010 116.2 2.6 1.4 115.5 2.3 1.8 129.1 0.6 2.6 120.3 0.8 1.5 172.1 0.6 3.1 - - 2.7Q3 2010 116.8 2.2 1.8 115.6 0.3 1.6 128.2 -0.7 1.9 119.9 -0.3 1.2 173.3 0.7 2.8 - - 2.4Q4 2010(1) 117.4 1.5 2.2 116.0 1.2 1.4 129.0 0.7 1.9 120.5 0.5 1.0 175.2 1.1 3.1 - - 2.5Q1 2011(1) 117.9 1.6 2.1 116.4 1.6 1.4 129.4 0.2 0.8 120.6 0.1 1.0 176.1 0.6 3.2 - - 2.4Q2 2011(1) 118.3 1.7 1.9 116.9 1.7 1.2 130.3 0.8 1.0 121.7 0.9 1.1 177.3 0.7 3.3 - - 2.6UpdatedNext ReleaseSource: BNP Paribas, (1) Forecasts
CPI CoreCPI Core CPI Headline CPI Core
Table 3: BNP Paribas' Inflation ForecastsCanada Norway Australia
Nov CPI (Dec 21)
Dec 10 Oct 29
Dec CPI (Jan 10) Q4 CPI (Jan 25)
Nov 23
Chart 8: Canadian Total Versus Core CPI
Source: Reuters EcoWin Pro, BNP Paribas
Wage pressures appear subdued, suggesting that underlying inflation should remain within the target range.
Chart 9: Australian CPI (% y/y)
Source: Reuters EcoWin Pro, BNP Paribas
Near-term inflation pressures should be muted but, with the limited spare capacity in the labour market being eroded, underlying inflation is likely to settle near the top of the RBA's target range.
CPI Data Calendar for the Coming Week Day GMT Economy Indicator Previous BNPP F’cast Consensus
Mon 20/12 07:00 08:00 PPI y/y : Nov 4.3% 4.6% 4.6% Tue 21/12 12:00 07:00 CPI m/m : Nov 0.4% 0.3% n/a 12:00 07:00 Bank of Canada Core CPI m/m : Nov 0.4% 0.2% n/a Thu 23/12 07:45 08:45 PPI y/y: Nov 4.3% 4.0% n/a 10:15 11:15 CPI y/y : Dec 2.9% 3.1% n/a Tue 28/12 23:30 08:30 CPI National y/y : Nov 0.2% 0.0% n/a 23:30 08:30 Core CPI National y/y : Nov -0.6% -0.6% n/a 23:30 08:30 CPI Tokyo y/y : Dec 0.2% 0.1% n/a 23:30 08:30 Core CPI Tokyo y/y : Dec -0.5% -0.5% n/a Wed 29/12 09:00 10:00 States Cost of Living y/y : Dec 1.5% 1.7% 1.5% 09:00 10:00 HICP (Prel) y/y : Dec 1.6% 1.8% n/a Release dates and forecasts as at c.o.b. prior to the date of publication: See Daily Economic Spotlight for any revision Source: BNP Paribas
53

Herve Cros / Shahid Ladha / Sergey Bondarchuk 16 December 2010Market Mover, Non-Objective Research Section www.GlobalMarkets.bnpparibas.com
Inflation: Post Mortem 2010
Increasing supply and liquidity in 2010.
Real Yields: At or below Jan levels.
Breakevens: At or below Jan levels.
ASW: Strong despite stress on EGBs & vol. Volatility: Normalisation continues.
Tomorrow, we will publish our main views for 2011 in the Inflation Monitor but today we focus one last time on 2010. Deepening credit and balance-sheet concerns, greater uncertainty and risk aversion, an increased regulatory burden and anxiety about inflation and deflation: 2010 has not been a year for the faint-hearted.
Supply & Demand: Thanks to the normalisation in market conditions in 2009, sovereigns came back to inflation markets more aggressively in 2010. The US issued USD 87bn of TIPS in 2010 against only USD 59bn in 2009. The UK issued GBP 31bn of UKTI against GBP 28bn in 2009. In the eurozone, France doubled linkers supply to EUR 24bn thanks to the launch of new 10y benchmarks in FRF and EUR inflation. With EUR 11bn in 2010 compared to EUR 5bn in 2009, Germany stuck to its commitment to issue EUR 2-3bn of linkers every quarter although it did not issue a new benchmark. Finally, with only EUR 14.5bn vs EUR 17bn in 2009, Italy is the only issuer to have reduced inflation supply, probably because of the launch of the CCT-eu programme.
Liquidity wise, we note a marked improvement in 2010 (Chart 2). Using official data, turnover increased in the US, UK and France by 21%, 37% and 55% respectively. Based on BNPP data (note BNPP is number one in TIPS and top three in EZ secondary markets), activity has jumped even more for German linkers while barely improving on BTPeis.
Demand wise, HFs are coming back gradually but ALM demand has stayed strong and ASW activity is still supporting activity in linkers and swap. The focus has also switched to structured solutions that reduce counterparty and funding risk. In this context, use of TRS solutions should expand further. In 2010, pension funds have continued to be active in linkers despite deterioration in funding ratios while inflows in ETFs have declined compared to 2009. In France, the increase of the Livret A rate and of real yields is triggering some activity in swap in Q4, distorting slightly further valuations vs. EUR breakevens.
Real Yields and Breakevens: Real yields mainly followed gold prices and weakening growth
Chart 1: Inflation Supply
0
20
40
60
80
2003 2004 2005 2006 2007 2008 2009 2010YTD
2011For
US EMU UK JPYEUR bn
Chart 2: Monthly Turnovers in Linkers
0
50
100
150
Jan-07 Jan-08 Jan-09 Jan-10 Jan-11
USD
EUR
GBP
EUR bn, 1M LehmanConso in 2009 Up in 2010
Chart 3: TIPS TR vs Gold & ED15
Chart 4: US 10y BE vs NY, WTI and SPX
Source: BNP Paribas, Bloomberg, AFT, Fed, UK DMO
54

Herve Cros / Shahid Ladha / Sergey Bondarchuk 16 December 2010Market Mover, Non-Objective Research Section www.GlobalMarkets.bnpparibas.com
expectations until November’s FOMC then rose in line with short-term contracts (Chart 3). Deflation fears surged during the summer but breakevens have been more sensitive to oil and stocks than nominals since the Jackson-Hole speech (Chart 4). Looking at the 10y maturity, the sell-off was huge in November but real yields are finishing 2010 at (EUR) or a bit below (US & UK) levels prevailing in early January. Meanwhile, breakevens are finishing the year close to (US) or below (UK, EUR) Jan levels.
Total returns: Late sell-off and EGB crisis. 2009 was a year of normalisation for distressed assets. Therefore it is unsurprising that linkers have not managed to repeat the same performance in 2010 as in 2009. Beyond the recent unwinding of the QE trade, the market seems to be acknowledging the positive effects of loose monetary policy more on growth (via higher real yields) than on inflation (inflation breakevens mainly stable since November). This also explains stocks’ strong performance.
Overall, in local-currency terms, TIPS have returned 5% in 2010 vs. 10% in 2009, slightly underperforming vs. nominals against 16% outperformance in 2009. UK linkers have done better with 5% return in 2010 vs. 6% in 2009. Still, relative to nominals, UKTI has barely outperformed against 8% differential in 2009. Finally, in the eurozone, performance has been mixed between issuers. BTPei underperformed both in real and breakeven terms (around -4% return) while French and German linkers underperformed only vs. nominals. Overall, EUR linkers have returned 1% in 2010 (vs. 8% in 2009), i.e. 3% less than nominals (vs. +3.5% outperformance in 2009). Clearly, the stress on EGBs and the need for fiscal tightening are putting pressure on breakevens, especially on BTPei.
Asset Swap: Strong performance. After being stable most of H1, linkers ASW have followed nominals in H2 and are returning close to 0bp margin vs. Libor (Chart 7), benefiting from an expected improvement in governments’ deficits next year. Given the context of volatility and stress in EGBs, we highlight the stability in Linkers/Nominals ASW discounts, especially in the EZ and the US (Chart 8). Globally, ASW discounts are finishing the year tighter than in Jan. The carry trade has worked again in 2010. We also expect the trend of switching out of P/P to proceeds ASW to continue in EZ in 2011.
Volatility: Down but still 50% higher than nominal. Despite a resurgence of deflation fears during the summer, inflation volatility has declined in 2010 (Chart 9) although it still trades 50% richer than nominal vol. We also note an expansion of the real rate swaptions market and arbitrage between local inflations.
C. 5: Quarterly Returns in Linkers 1y+ Indices
-4%
-3%
-2%
-1%
0%
1%
2%
3%
4%
5%
6%
Q1-09 Q2-09 Q3-09 Q4-09 Q1-10 Q2-10 Q3-10 Q4-10
EUR GBP USD
Linkers
Chart 6: Quarterly Returns in BE trades
-4%
-2%
0%
2%
4%
6%
8%
Q1-09 Q2-09 Q3-09 Q4-09 Q1-10 Q2-10 Q3-10 Q4-10
EUR GBP USD
Breakevens
Chart 7: Linkers ASW: Return to 0
0
20
40
60
80
Dec-09 Mar-10 Jun-10 Sep-10 Dec-10
OATEI20 Real ASW
UKTI20 Real ASW
TIPS Jan-19 Real ASW
Chart 8: Linkers R/N ASW Discounts: Tight
-10
0
10
20
30
40
50
60
Dec-09 Mar-10 Jun-10 Sep-10 Dec-1010
15
20
25
30
35
40OATEI20 R/N ASW Discount
UKTI20 R/N ASW Discount
TIPS Jan-19 R/N ASW Discount
VIX, RHS
TIPS
UKTI
OATei
Chart 9: Implied Vol
0.50%
0.70%
0.90%
1.10%
1.30%
1.50%
1.70%
1.90%
2.10%
2.30%
2.50%
Dec-09 Mar-10 Jun-10 Sep-10 Dec-10
EUR Implied Inflation VolEUR Implied Interest Rate VolUSD Implied Inflation VolUSD Implied Interest Rate Vol
EUR
USD
Source: BNP Paribas, Bloomberg
55

Herve Cros / Shahid Ladha / Sergey Bondarchuk 16 December 2010Market Mover, Non-Objective Research Section www.GlobalMarkets.bnpparibas.com
Table 1: BNP Paribas Carry Analysis
Pricing Date 2mRepo RateSett. Date
Yield BE Real BE Real BE Real BE Real BE Real BE Real BEShort-endOATei Jul-12 -1.00% 1.91% 3.9 0.8 34.2 29.7 24.8 21.3 -16.3 -20.8 2.1 -2.7 -77.6 -40.5OATI Jul-13 -0.37% 1.71% -0.9 -5.0 12.8 6.3 8.9 3.4 2.0 -5.7 27.1 12.8 30.2 7.1TIPS Jul-12 -0.78% 1.34% -4.3 -7.2 -13.4 -18.2 -9.0 -13.0 -5.5 -11.5 51.7 36.7 22.5 -18.5UKTi Aug-13 -1.62% 2.83% 21.5 17.2 15.8 8.6 23.1 17.4 17.0 8.7 66.6 49.5 72.6 38.55yOATei Jul-15 0.51% 1.65% 5.5 0.7 18.2 10.5 14.4 7.7 3.9 -5.7 19.9 1.1 30.5 -5.9OATi Jul-17 0.72% 2.02% 1.7 -2.9 8.3 0.8 6.5 -0.1 5.2 -4.2 18.8 0.3 29.1 -6.9TIPS Apr-15 0.09% 1.69% 1.2 -3.8 -0.1 -8.2 0.5 -6.2 3.6 -6.4 26.1 4.8 30.2 -16.3UKTi Jul-16 0.05% 2.62% 14.5 9.0 14.2 5.3 16.6 9.3 16.2 5.6 47.0 25.4 66.2 22.3JGBI-4 June-15 1.05% -0.55% 5.3 4.1 4.9 2.9 6.0 4.5 0.9 -1.5 -6.2 -11.0 17.9 7.210yOATei Jul-20 1.34% 1.98% 3.9 -0.2 11.1 4.3 8.9 3.0 4.4 -4.1 14.7 -1.9 24.5 -7.9OATI Jul-19 1.06% 2.08% 1.8 -2.5 7.3 0.2 5.8 -0.4 5.1 -3.8 16.7 -0.8 26.6 -7.4TIPS Jul-20 1.14% 2.26% 2.1 -3.1 2.4 -6.0 2.2 -4.7 4.6 -5.6 17.7 -3.4 25.4 -18.2UKTi Nov-22 0.83% 3.07% 5.6 0.7 12.3 4.4 9.2 2.7 12.5 3.1 24.8 5.9 40.1 2.4JGBI-16 June-18 1.37% -0.44% 3.9 2.3 4.0 1.4 4.5 2.5 1.7 -1.4 -1.4 -7.6 15.1 2.030yOATei Jul-40 1.71% 2.18% 1.7 -0.6 4.4 0.7 3.6 0.3 2.0 -2.7 6.2 -2.9 10.2 -7.1OATI Jul-29 1.59% 2.22% 1.5 -1.7 4.8 -0.3 3.9 -0.7 3.8 -2.7 11.0 -1.6 18.0 -6.2TIPS Feb-40 1.98% 2.61% 1.3 -2.2 1.8 -3.9 1.6 -3.1 2.8 -4.0 9.0 -4.9 13.8 -14.4UKTI Mar-40 0.78% 3.67% 2.2 -0.9 4.9 -0.2 3.6 -0.5 4.9 -1.0 9.6 -2.2 15.1 -8.2Short-endOATei Jul-12 30.3 28.9 20.5 18.9 -41.1 -42.1 18.4 18.1 -79.7 -37.7OATI Jul-13 13.7 11.3 9.1 6.4 -6.9 -9.1 25.1 18.5 3.1 -5.7TIPS Jul-12 -9.1 -11.0 -7.3 -9.3 3.5 1.4 57.2 48.3 -29.3 -55.2UKTi Aug-13 -5.7 -8.7 20.5 17.6 -6.1 -8.7 49.6 40.8 6.0 -11.15yOATei Jul-15 0.0 0.0 0.0 0.0 0.0 0.0 0.0 0.0 0.0 0.0OATi Jul-17 12.7 9.7 9.9 6.6 -10.5 -13.4 16.0 6.8 10.6 -7.0TIPS Apr-15 6.6 3.7 5.1 1.8 -1.2 -4.1 13.5 4.5 10.3 -7.2UKTi Jul-16 -1.2 -4.4 -0.7 -3.9 3.0 -0.2 22.5 11.1 4.2 -21.0JGBI-4 June-15 -0.4 -1.2 -2.7 -3.4 -5.2 -6.0 -7.1 -9.5 24.1 18.210yOATei Jul-20 7.1 4.5 5.9 2.9 -4.5 -7.1 10.3 2.2 9.8 -5.9OATI Jul-19 5.5 2.7 4.4 1.2 -0.6 -3.4 11.5 3.0 9.9 -6.6TIPS Jul-20 0.3 -2.9 0.6 -2.7 2.3 -0.9 13.2 2.2 7.6 -14.9UKTi Nov-22 6.8 3.7 5.7 2.6 3.4 0.4 12.3 2.8 15.4 -3.5JGBI-16 June-18 0.1 -0.9 0.1 -0.9 -2.8 -3.9 -3.1 -6.2 16.5 9.630yOATei Jul-40 2.8 1.3 2.3 0.7 -1.6 -3.0 4.1 -0.3 4.1 -4.1OATI Jul-29 3.3 1.3 2.7 0.5 -0.1 -2.1 7.3 1.1 6.9 -4.6TIPS Feb-40 0.4 -1.7 0.5 -1.7 1.2 -0.9 6.2 -1.0 4.7 -9.5UKTI Mar-40 2.7 0.8 2.3 0.3 1.3 -0.5 4.7 -1.2 5.5 -5.9
6m -> 12m3m -> 6m
Benchmark Carry15-Dec-10
0.42% 0.42% 0.34% 0.34% 0.34% 0.56%12m
16-Jun-11 16-Dec-1116-Dec-10 01-Feb-11 01-Mar-11
Term 1
Term 1 -> Term 2 Term 2 -> 3m
3m 6mTerm 2
16-Feb-11 16-Mar-11
Term 1 -> Term 2
Source: BNP Paribas
56

Christian Séné 16 December 2010Market Mover, Non-Objective Research Section www.GlobalMarkets.bnpparibas.com
Technical Analysis – Interest Rates & Commodities
Bond & Short-Term Contracts Europe 10y: Still weak MT within a ST rising channel & now close to key 3.08/3.11 (LT 38.2%+MT 61.8%) US 10y: Break above 3.37 (MT 61.8%) increased MT weak bias for LT falling resistance (3.68) Short-term contracts m1: ST toppish bias on ED (risk of top H&S) & Euribor (falling ABC to develop?)
Equities & Commodities WTI (Cl1): Sill up MT within MT rising channel but stalling below 90.19 top with risk of further ST consolidation Equity markets: MT positive bias persists with new tops in US while European markets remain rather toppish
US 10y: Break above 3.37 (MT 61.8%) calls for key 3.68 MT Trend: Up Range: 3.25/3.58 2.80 <= 2.94 <= 3.09 <= 3.37 –!– 3.58 => 3.68 => 4.00/4.07 MT SCENARIO remains up
Market broke decisively above 2.96 (wave “3” top) early December to then extend rising wave “5”. This strengthened MT bearish scenario with a move above critical 3.37 (MT 61.8%), which is now targeting 3.68 (LT falling resistance line) & then on a breakout 4.00/4.07 (April top & LT 61.8%). Trend indicators (DMI+MACD) are up oriented again
ALTERNATIVE SCENARIO...ST correction It will fail to extend rise beyond 3.68 (LT falling resistance line) & will start a ST consolidation towards 3.05/3.08 (ST 38.2%+ 61.8%) initially with 3.25 & 3.15 (38.2, 50%) before. First step would be a break below ST daily rising channel support (now at 3.41)
STRATEGY Waiting for a signal now
US/EUR 10y bond: Is it developing the rising “C of ABC” of a major wave “B”?MT Trend: Neutral Range: 25/55 -20.9/-21.4 <= 4.0/8.0 <= 23.5 <= 33.8 -!!- 47.0 => 56.2 => 85.8/86.5 => 119.7 MT SCENARIO is up
After 5 waves down move (major wave “A”?) which reached key 0.2/0.6 support area, it has started a correction (major wave “B”?) above the MT falling wedge resistance. It is perhaps still developing the rising wave “C” of ABC” towards 47.0 & 56.2 (ST 50, 61.8%), sustained by trend indicators which have turned up oriented again
ALTERNATIVE SCENARIO...Wave C to start Correction (major wave “B”?) could end now around ST 50% (47.0) and will resume fall to perhaps develop the major wave “C” for a move below critical 0.0/4.0/8.0 (LT 50% & end-2009 low & last low) towards -21.4 (LT 61.8%) with intermediates on 33.8 & 23.5 (ST 38.2, 61.8%)
STRATEGY Long on 10/15 sold 30/40. Wait for a 56 test to sell
57

Christian Séné 16 December 2010Market Mover, Non-Objective Research Section www.GlobalMarkets.bnpparibas.com
Germany 10y: Stalling below MT 61.8%. Beware of a ST rising channel break MT Trend: Up Range: 2.80/3.10 2.64 <= 2.70 <= 2.95 –!– 3.08/3.11 => 3.39 => 3.70 MT SCENARIO is still up
Negative break above MT falling channel and 2.50 (wave “1” top) allowed the rising wave “3” to develop beyond key 2.64 (LT falling wedge res) to extend MT rise towards key 3.08/3.11 (LT 38.2%+MT 61.8%) area initially within a ST rising channel. A break would see an extension towards 3.39 (LT 50%) then ALTERNATIVE SCENARIO...ST correction Current ST correction in wave “3” will stall & end below key 3.11 (MT 61.8%) and it will then resume fall for a classic pullback towards 2.62/64/69 (61.8%+LT falling wedge res + ST 38.2%) with 2.79 & 2.70 (38.2, 50%) before. Slight bearish divergences on daily RSI could help such a scenario to develop. STRATEGY Sell stop 2.95 S/L 3.01 for 2.70/2.80 UK 10y: Negative within ST rising wedge towards MT 61.8% (3.73) MT Trend: Up Range: 3.40/3.75
3.14 <= 3.23 <= 3.33 <= 3.49 –!– 3.73 => 3.80/3.83 => 4.00 => 4.30 MT SCENARIO remains up Break above bottom 2-dip neckline turned MT bias negative. It took sharply the way up with 3.53/3.55 (MT 50%+end-July top+2-dip target) now overcome for a move towards critical 3.73 (MT 61.8%) & 3.83 (LT falling wedge resistance). Trend indicators (DMI & MACD) remain up but RSI looking expensive ALTERNATIVE SCENARIO… ST correction It will now stall below MT 61.8% at 3.73 & take the way down again with a break then below MT rising wedge support (3.49) to extend correction towards 3.33 (ST 50%) & 3.23 (ST 50%) initially. A break below 61.8% (3.14) is needed to rekindle the previous MT falling bias towards 2.79 (last low) STRATEGY Buy break below 3.49, for 3.33 S/L 3.54. S&P: Above key 1228 but is the corrective wave “IV” now over or not? MT Trend: Up Range: 1180/1260
1129 <= 1156 <= 1173 <= 1215/28 –!– 1287 => 1299 => 1393 MT SCENARIO is still up Last sharp rise allowed now to slightly over-come 1220/28 (April top & LT 61.8%). This break is strengthening last bullish bias & possible rising wave “5” scenario with 1246 (bottom H&S target) now reached, next targets being 1272 (ST rising wedge res), 1299 (MT 138.2% extension) & then 1393 (LT rising channel res).
ALTERNATIVE SCENARIO…wave 4 not over The corrective wave “4” is not yet over. Indeed, we still have the risk of being within a wave “4” in irregular and not yet in a wave “5”. In this event, we could see soon a continu-ation of the corrective wave “4” by developing a falling “C of ABC” towards 1156 (ST 38.2%). This would be confirmed with a move below ST rising wedge support (1215) STRATEGY: Sell only below 1215 for 1150/70 S/L 1228. Stay long above 1215 if you are
58
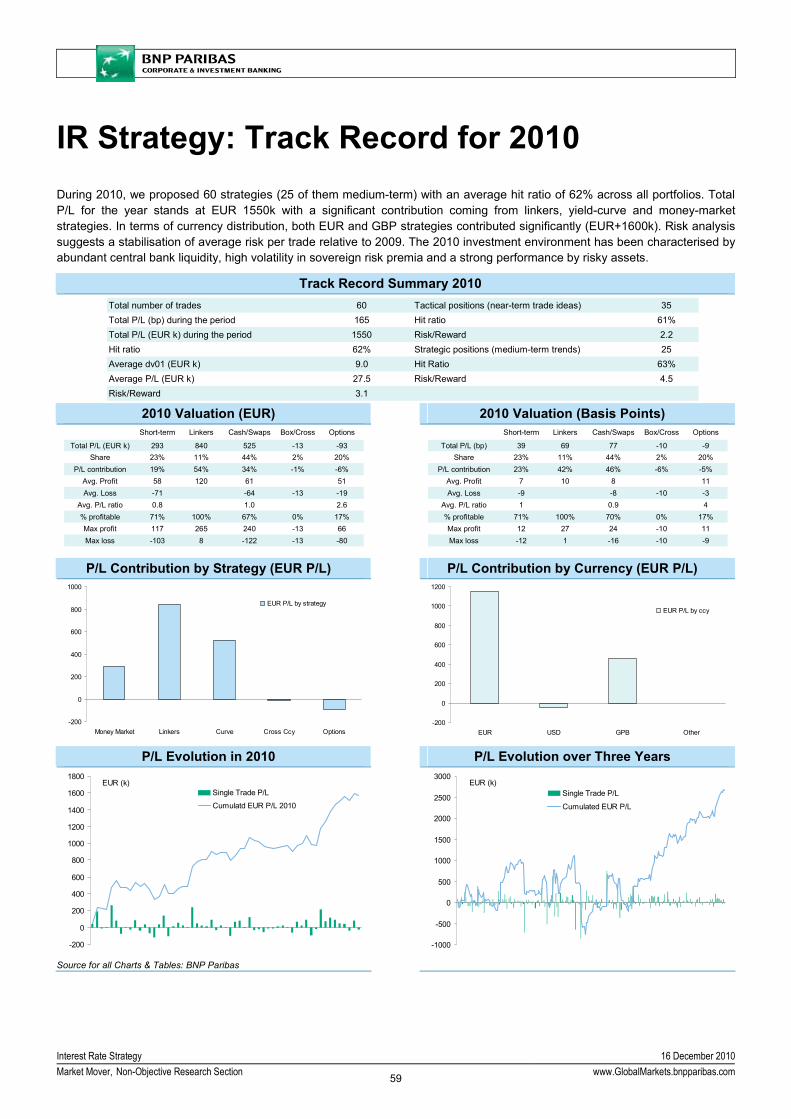
Interest Rate Strategy 16 December 2010Market Mover, Non-Objective Research Section www.GlobalMarkets.bnpparibas.com
IR Strategy: Track Record for 2010 During 2010, we proposed 60 strategies (25 of them medium-term) with an average hit ratio of 62% across all portfolios. Total P/L for the year stands at EUR 1550k with a significant contribution coming from linkers, yield-curve and money-market strategies. In terms of currency distribution, both EUR and GBP strategies contributed significantly (EUR+1600k). Risk analysis suggests a stabilisation of average risk per trade relative to 2009. The 2010 investment environment has been characterised by abundant central bank liquidity, high volatility in sovereign risk premia and a strong performance by risky assets.
Track Record Summary 2010 Total number of trades 60 Tactical positions (near-term trade ideas) 35Total P/L (bp) during the period 165 Hit ratio 61%Total P/L (EUR k) during the period 1550 Risk/Reward 2.2Hit ratio 62% Strategic positions (medium-term trends) 25Average dv01 (EUR k) 9.0 Hit Ratio 63%Average P/L (EUR k) 27.5 Risk/Reward 4.5Risk/Reward 3.1
2010 Valuation (EUR) 2010 Valuation (Basis Points) Short-term Linkers Cash/Swaps Box/Cross Options
Total P/L (EUR k) 293 840 525 -13 -93Share 23% 11% 44% 2% 20%
P/L contribution 19% 54% 34% -1% -6%Avg. Profit 58 120 61 #DIV/0! 51Avg. Loss -71 #DIV/0! -64 -13 -19
Avg. P/L ratio 0.8 #DIV/0! 1.0 #DIV/0! 2.6% profitable 71% 100% 67% 0% 17%Max profit 117 265 240 -13 66Max loss -103 8 -122 -13 -80
Short-term Linkers Cash/Swaps Box/Cross Options
Total P/L (bp) 39 69 77 -10 -9Share 23% 11% 44% 2% 20%
P/L contribution 23% 42% 46% -6% -5%Avg. Profit 7 10 8 #DIV/0! 11Avg. Loss -9 #DIV/0! -8 -10 -3
Avg. P/L ratio 1 #DIV/0! 0.9 #DIV/0! 4% profitable 71% 100% 70% 0% 17%Max profit 12 27 24 -10 11Max loss -12 1 -16 -10 -9
P/L Contribution by Strategy (EUR P/L) P/L Contribution by Currency (EUR P/L)
-200
0
200
400
600
800
1000
Money Market Linkers Curve Cross Ccy Options
EUR P/L by strategy
-200
0
200
400
600
800
1000
1200
EUR USD GPB Other
EUR P/L by ccy
P/L Evolution in 2010 P/L Evolution over Three Years
-200
0
200
400
600
800
1000
1200
1400
1600
1800
Single Trade P/L
Cumulatd EUR P/L 2010
EUR (k)
-1000
-500
0
500
1000
1500
2000
2500
3000
Single Trade P/L
Cumulated EUR P/L
EUR (k)
Source for all Charts & Tables: BNP Paribas
59
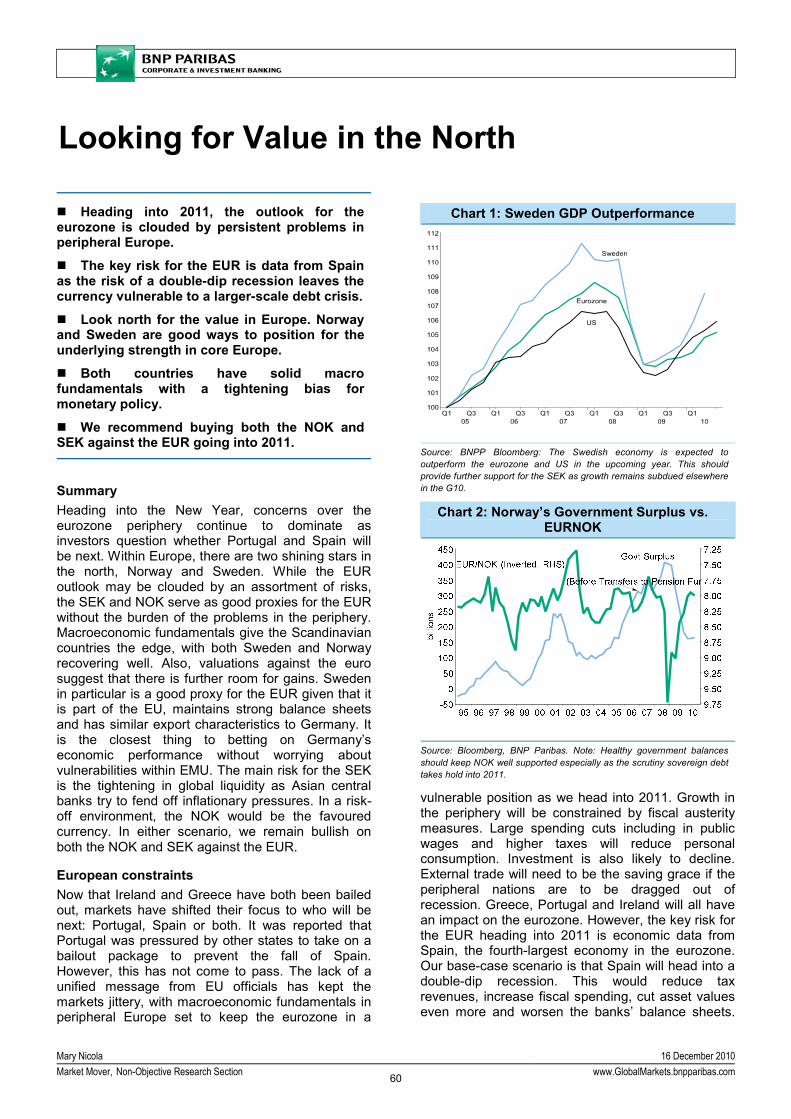
Mary Nicola 16 December 2010Market Mover, Non-Objective Research Section www.GlobalMarkets.bnpparibas.com
Looking for Value in the North
Heading into 2011, the outlook for the
eurozone is clouded by persistent problems in peripheral Europe.
The key risk for the EUR is data from Spain as the risk of a double-dip recession leaves the currency vulnerable to a larger-scale debt crisis.
Look north for the value in Europe. Norway and Sweden are good ways to position for the underlying strength in core Europe.
Both countries have solid macro fundamentals with a tightening bias for monetary policy.
We recommend buying both the NOK and SEK against the EUR going into 2011.
Summary Heading into the New Year, concerns over the eurozone periphery continue to dominate as investors question whether Portugal and Spain will be next. Within Europe, there are two shining stars in the north, Norway and Sweden. While the EUR outlook may be clouded by an assortment of risks, the SEK and NOK serve as good proxies for the EUR without the burden of the problems in the periphery. Macroeconomic fundamentals give the Scandinavian countries the edge, with both Sweden and Norway recovering well. Also, valuations against the euro suggest that there is further room for gains. Sweden in particular is a good proxy for the EUR given that it is part of the EU, maintains strong balance sheets and has similar export characteristics to Germany. It is the closest thing to betting on Germany’s economic performance without worrying about vulnerabilities within EMU. The main risk for the SEK is the tightening in global liquidity as Asian central banks try to fend off inflationary pressures. In a risk-off environment, the NOK would be the favoured currency. In either scenario, we remain bullish on both the NOK and SEK against the EUR.
European constraints Now that Ireland and Greece have both been bailed out, markets have shifted their focus to who will be next: Portugal, Spain or both. It was reported that Portugal was pressured by other states to take on a bailout package to prevent the fall of Spain. However, this has not come to pass. The lack of a unified message from EU officials has kept the markets jittery, with macroeconomic fundamentals in peripheral Europe set to keep the eurozone in a
vulnerable position as we head into 2011. Growth in the periphery will be constrained by fiscal austerity measures. Large spending cuts including in public wages and higher taxes will reduce personal consumption. Investment is also likely to decline. External trade will need to be the saving grace if the peripheral nations are to be dragged out of recession. Greece, Portugal and Ireland will all have an impact on the eurozone. However, the key risk for the EUR heading into 2011 is economic data from Spain, the fourth-largest economy in the eurozone. Our base-case scenario is that Spain will head into a double-dip recession. This would reduce tax revenues, increase fiscal spending, cut asset values even more and worsen the banks’ balance sheets.
Chart 1: Sweden GDP Outperformance
Source: BNPP Bloomberg: The Swedish economy is expected to outperform the eurozone and US in the upcoming year. This should provide further support for the SEK as growth remains subdued elsewhere in the G10.
Chart 2: Norway’s Government Surplus vs. EURNOK
Source: Bloomberg, BNP Paribas. Note: Healthy government balances should keep NOK well supported especially as the scrutiny sovereign debt takes hold into 2011.
60

Mary Nicola 16 December 2010Market Mover, Non-Objective Research Section www.GlobalMarkets.bnpparibas.com
Spain’s ambitious budget targets coincide with optimistic assumptions on nominal growth. As such, we expect them to be missed – only deepening the gloom over Spain.
The other problem the eurozone will face next year is the disparity in growth rates between core and peripheral Europe. Growth in Germany is expected to moderate in 2011 but should remain strong. External demand will drive growth, especially as emerging markets’ expansion continues. About 16% of total German exports end up in Asia. This divergence in growth within EMU will leave the ECB with a policy dilemma as one part of the eurozone will need loose monetary policy and the other part will need tighter monetary policy. Loose monetary policy may have to remain in place to allow the peripheral just to muddle through. This growing divergence between the core of Europe and the periphery will add to pressure on the euro.
Norway and Sweden: the favoured ones While the EUR will remain vulnerable to events in peripheral Europe, the NOK and SEK will be proxies for performance of the eurozone core. Economic fundamentals in both countries support a bullish view on the Scandies, which will likely lead to further rate hikes by both central banks in 2011. While the Norges Bank sat on its hands this week, it did adopt a more hawkish tone. The Riksbank, however, increased the repo rate by 25bp to 1.25%, making clear in the accompanying statement that further hikes are in the pipeline.
Unlike the eurozone, Norway’s consumer and government sectors are both relatively strong. While much of the eurozone must restore its balance sheets, leading indicators and PMI data underline the expansionary trend in Norway. Rising oil prices will boost economic performance. Debt levels in Norway remain low and the current account surplus is robust. These dynamics alone warrant NOK appreciation. While the economy is in good shape, the Norges Bank has been reluctant to hike interest rates due to softer inflation. CPI figures have consistently undershot central-bank and market expectations. With the more hawkish tone set by the Norges Bank, we now expect speculation to build for a hike in March rather than the middle of the year, compounding the NOK’s strength.
Sweden: Europe’s outperformer Among European countries, Sweden has been one of the fastest-growing economies in 2010. Low government debt and strong current account surpluses will appeal to investors, especially since Sweden is part of the European Union – just not the EMU. With the strong growth seen over the last year, this week’s hike from the Riksbank will lead to
speculation that the pace of tightening will be maintained into 2011. The central bank increased its growth forecast for 2011 to 4.4% vs. 3.8% and the inflation forecast was raised to 2.2% from 1.7% in 2011. CPI is nearing the Riksbank’s 2% target, with the headline rate coming in at 1.8% y/y in November. Swedish house prices have risen for eighteen consecutive months, increasing an annual 5% in the three months through October. The Riksbank Governor said that he personally tracks household credit when deciding rate policy. Interest rate differentials will spark further strength of the SEK, which may lead to a decline in competitiveness against Sweden’s trading partners.
Nevertheless, the strength of the domestic economy underscores the need to hike interest rates. The real economy, particularly the labour market, is recovering well.
Chart 3: EURNOK Spot vs. EURNOK PPP
Source: Bloomberg, BNPParibas. EURNOOK spot is trading around PPP levels after being significantly “undervalued” for some time. In light of potential tight liquidity in 2011, the NOK is a safe trade given its defensive qualities.
Chart 4: EURSEK Spot vs. EURSEK PPP
Source: Bloomberg, BNP Paribas. Note: Current EURSEK spot levels is above EURSEK PPP. Based on this, the SEK is of particularly good value against the EUR as there is strong justification for further appreciation. SEK appreciation against the EUR will only bring it to its “fair value” level.
61

Mary Nicola 16 December 2010Market Mover, Non-Objective Research Section www.GlobalMarkets.bnpparibas.com
The currency side of the story Growth and interest rate differentials suggest that both the NOK and SEK will outperform the EUR and even the USD in 2011. But what is the story on the currency front? The market was significantly short USD on the back of the prospects of QE2. This provided some support for both the EUR and SEK, in particular the SEK as it benefited from the pick-up in risk appetite and the liquidity trade. The NOK, on the other hand, did not reap the same benefits as its defensive qualities kept it relatively stable.
As 2011 approaches and global liquidity drops off on the back of Asia policy tightening, the NOK may outperform the SEK but they will both outperform the EUR. From a valuation perspective, EURNOK is trading around the PPP level while EURSEK is trading above the PPP level. This implies that further appreciation against the EUR is warranted, especially for the SEK.
Against the USD, both the NOK and SEK spot values are above the PPP values. This may suggest that they are not good buys against the USD. However, it is worth noting two things. First, as shown in Charts 5 and 6, they are no longer at extreme levels. Second, the USD was arguably used as a funding currency for much of 2008 and again in recent months on the anticipation of QE2. Short USD positioning was at an extreme over the past few months.
The risks to NOK and SEK in 2011 While both currencies look attractive, there are a few risks worth noting. Global risk appetite is of particular importance to these two countries. The SEK benefits in a risk-on environment while the NOK gains in risk-off.
For example, when China allowed faster appreciation of its currency in September, the SEK’s beta to CNY appreciation was similar to that of the AUD. This was mostly on the back of the improvement in risk appetite rather than Sweden’s links to China (these are fairly limited). In 2011, Asia will have to start tightening more aggressively than they have been, thereby limiting the ample global liquidity that had been provided by central banks around the world.
On the back of that, the NOK should outperform the SEK. In addition, OPEC is calling for USD 100/bbl as a fair price for oil. If there is a significant rise in oil prices, again the NOK should outperform the SEK. However, if Asia allows for faster FX appreciation as a way to offset inflationary pressures, then the risk-on environment will take hold and the SEK will likely outperform the NOK. Moves against the USD will be a function of risk appetite as well.
Also, the pace of rate hikes in Norway versus Sweden will to some degree depend on how the currencies perform. We expect the Riksbank to be more hawkish than the Norges Bank, finding support for the SEK. The Riksbank may nevertheless be cautious on hiking too fast as the SEK’s appreciation against the EUR, its key trading partner, could present roadblocks for the recovery.
Weakness in the eurozone periphery will position the two Scandie currencies as the more favoured currencies by investors. Sweden serves as a good proxy for Germany’s likely strong growth in 2011 given their similar export characteristics. We expect the SEK to outperform the NOK in early 2011, but gains will slow if risk appetite is challenged and NOK will outperform the SEK. But given the differing characteristics of the SEK and NOK, we recommend buying both these currencies against the EUR.
Chart 5: USDSEK Spot vs. USDSEK PPP
Source: Bloomberg, BNP Paribas. Note: USDSEK is currently trading below the USDSEK PPP, suggesting that SEK is “overvalued” against the USD. However, it is important to note that it is not at extreme levels as seen in 2008. The USD was weakened as it was being used as a funding currency as prospects of QE2 came to light.
Chart 6: USDNOK Spot vs. USDNOK PPP
Source: Bloomberg, BNP Paribas: USDNOK spot is also trading below USDNOK PPP implying that NOK is “overvalued” against the USD. Like the SEK it is not trading at extreme levels as seen back in 2008 before the peak of the financial crisis and the start of the USD unwind.
62
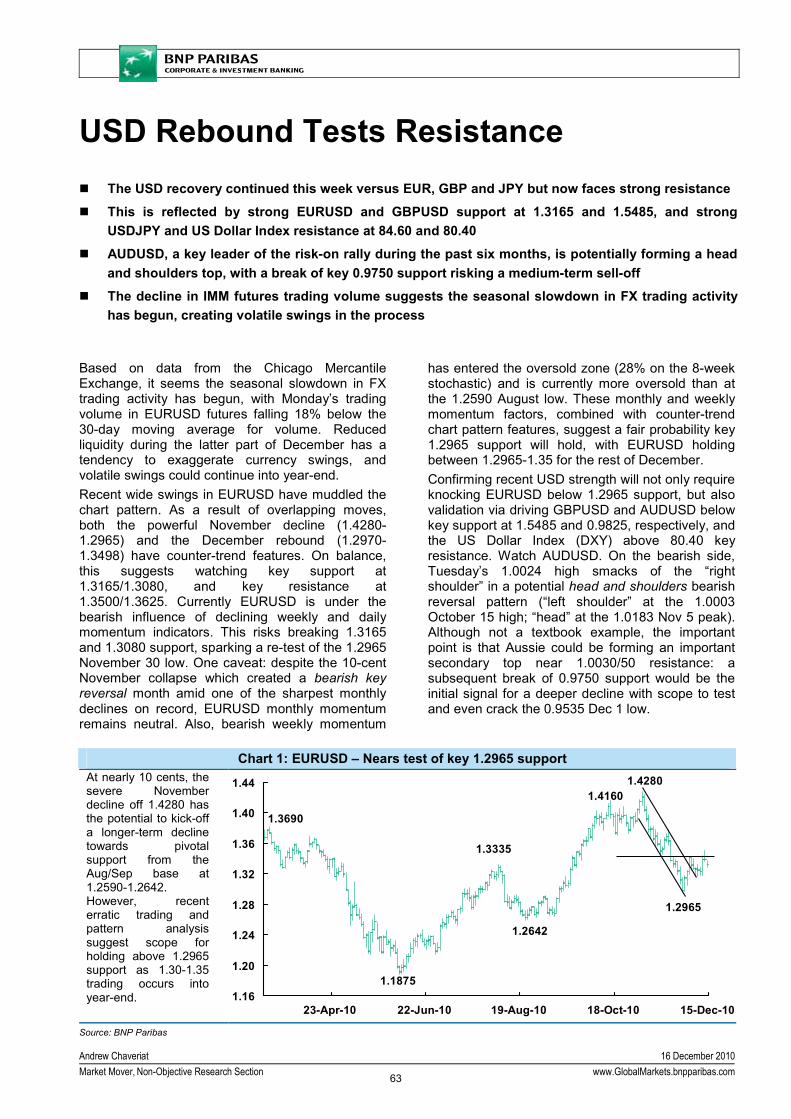
Andrew Chaveriat 16 December 2010Market Mover, Non-Objective Research Section www.GlobalMarkets.bnpparibas.com
USD Rebound Tests Resistance The USD recovery continued this week versus EUR, GBP and JPY but now faces strong resistance
This is reflected by strong EURUSD and GBPUSD support at 1.3165 and 1.5485, and strong USDJPY and US Dollar Index resistance at 84.60 and 80.40
AUDUSD, a key leader of the risk-on rally during the past six months, is potentially forming a head and shoulders top, with a break of key 0.9750 support risking a medium-term sell-off
The decline in IMM futures trading volume suggests the seasonal slowdown in FX trading activity has begun, creating volatile swings in the process
Based on data from the Chicago Mercantile Exchange, it seems the seasonal slowdown in FX trading activity has begun, with Monday’s trading volume in EURUSD futures falling 18% below the 30-day moving average for volume. Reduced liquidity during the latter part of December has a tendency to exaggerate currency swings, and volatile swings could continue into year-end. Recent wide swings in EURUSD have muddled the chart pattern. As a result of overlapping moves, both the powerful November decline (1.4280-1.2965) and the December rebound (1.2970-1.3498) have counter-trend features. On balance, this suggests watching key support at 1.3165/1.3080, and key resistance at 1.3500/1.3625. Currently EURUSD is under the bearish influence of declining weekly and daily momentum indicators. This risks breaking 1.3165 and 1.3080 support, sparking a re-test of the 1.2965 November 30 low. One caveat: despite the 10-cent November collapse which created a bearish key reversal month amid one of the sharpest monthly declines on record, EURUSD monthly momentum remains neutral. Also, bearish weekly momentum
has entered the oversold zone (28% on the 8-week stochastic) and is currently more oversold than at the 1.2590 August low. These monthly and weekly momentum factors, combined with counter-trend chart pattern features, suggest a fair probability key 1.2965 support will hold, with EURUSD holding between 1.2965-1.35 for the rest of December. Confirming recent USD strength will not only require knocking EURUSD below 1.2965 support, but also validation via driving GBPUSD and AUDUSD below key support at 1.5485 and 0.9825, respectively, and the US Dollar Index (DXY) above 80.40 key resistance. Watch AUDUSD. On the bearish side, Tuesday’s 1.0024 high smacks of the “right shoulder” in a potential head and shoulders bearish reversal pattern (“left shoulder” at the 1.0003 October 15 high; “head” at the 1.0183 Nov 5 peak). Although not a textbook example, the important point is that Aussie could be forming an important secondary top near 1.0030/50 resistance: a subsequent break of 0.9750 support would be the initial signal for a deeper decline with scope to test and even crack the 0.9535 Dec 1 low.
Chart 1: EURUSD – Nears test of key 1.2965 support
At nearly 10 cents, the severe November decline off 1.4280 has the potential to kick-off a longer-term decline towards pivotal support from the Aug/Sep base at 1.2590-1.2642. However, recent erratic trading and pattern analysis suggest scope for holding above 1.2965 support as 1.30-1.35 trading occurs into year-end. 1.16
1.20
1.24
1.28
1.32
1.36
1.40
1.44
15-Dec-1018-Oct-1019-Aug-1022-Jun-1023-Apr-10
1.1875
1.3690
1.2642
1.3335
1.42801.4160
1.2965
Source: BNP Paribas
63

Andrew Chaveriat 16 December 2010Market Mover, Non-Objective Research Section www.GlobalMarkets.bnpparibas.com
Chart 2: AUDUSD – Head and shoulders top may be forming Although not a classic example by any means, the past 2 months of A$ trading resemble a head & shoulders bearish reversal pattern. Critically, this week’s high is stalling close to resistance from the mid-Oct high (“left shoulder”) below the 1.0183 Nov peak (“head”). Mixed momentum indicates a break below 0.9750 support is an open question: but if seen, a medium-term decline would be favoured
0.78
0.82
0.86
0.90
0.94
0.98
1.02
15-Dec-1018-Oct-1019-Aug-1022-Jun-1023-Apr-10
0.9380
0.8315
0.9535
0.8085
0.8860
0.9220
0.8770
1.0180
Source: BNP Paribas
Chart 3: EURGBP – Retracing the autumn decline The breakout above the Oct down channel plus bullish daily momentum and multiple bullish daily divergence suggest the Oct-Dec decline is being retraced. We expect bullish weekly momentum to arrive soon, for the first time since mid-Oct. Anchored by the recent 0.8332/48 double-bottom, we favour a choppy rebound initially targeting 0.8565-0.8600, and then 0.8635/50 over the next 2-4 weeks 0.80
0.81
0.82
0.83
0.84
0.85
0.86
0.87
0.88
0.89
15-Dec-1018-Oct-1019-Aug-1022-Jun-1023-Apr-10
0.8810
0.8140
0.8530
0.8065
0.8425
0.8510
0.8345
0.8940
Source: BNP Paribas
Chart 4: USDKRW – Higher toward 1190 and potentially 1210 The April/Nov twin-bottom just above 1100 psychological support is an ideal way to complete the May decline off 1277 and begin a multi-month rebound. The dollar rebound is driven by bullish weekly momentum, currently as strong as during the explosive Apr-May jump. The support base at 1130 is seen holding as a medium-term rebound extends toward 1190, and if exceeded, 1210 (61.8% retracement of the May-Nov decline). 1080
1130
1180
1230
1280
1330
28-Oct-1031-Aug-1002-Jul-1005-May-1008-Mar-1007-Jan-10
1277
1185
1103 11071115
1167
1199
Source: BNP Paribas
64

Andrew Chaveriat 16 December 2010Market Mover, Non-Objective Research Section www.GlobalMarkets.bnpparibas.com
Currency Spot Trade Recommendations Date
EURAUD 1.3400 Short 1.3930, lower stop to 1.3600, target 1.2930 19 Nov 2010
EURCHF 1.2810 Short from 1.3475 achieved the 1.2775 target 17 Nov 2010
USDKZT 147.56 Short at 147.00, stop at 149.50, target 135.00 28 May 2010
Source: BNP Paribas
65

Market Economics 16 December 2010Market Mover www.GlobalMarkets.bnpparibas.com
Economic Calendar: 17 - 31 December GMT Local Previous Forecast Consensus
Fri 17/12 07:45 08:45 France Industry Survey : Dec 100 102 102 08:00 09:00 Norway Unemployment Rate : Dec 2.7% 2.7% 2.8% 08:45 09:45 Eurozone ECB’s Weber Speaks in Munich 10:00 11:00 Foreign Trade Balance (sa) : Oct EUR2.4bn EUR2.0bn n/a 12:45 13:45 ECB’s Honohan Speaks in Dublin 09:00 10:00 EU EU Leaders Conclude Summit in Brussels 09:00 10:00 Italy Industrial Orders y/y : Oct 17.9% 20.0% 16.0% 09:00 10:00 Germany Ifo Business Climate : Dec 109.3 109.8 109.0 09:00 10:00 Ifo Expectations : Dec 106.3 106.8 106.0 09:00 10:00 Ifo Current Conditions : Dec 112.3 112.8 112.5 14:00 15:00 Belgium Consumer Confidence : Nov 0 0 n/a 15:00 10:00 US Leading Indicators m/m : Nov 0.5% 1.0% 1.1% Mon 20/12 07:00 08:00 Germany PPI m/m : Nov 0.4% 0.4% 0.4% 07:00 08:00 PPI y/y : Nov 4.3% 4.6% 4.6% 08:30 09:30 Neths Consumer Confidence : Dec -7 -5 n/a 09:00 10:00 Eurozone Current Account (sa) : Oct EUR-13.1bn EUR-2.0bn n/a Tue 21/12 Japan BoJ Rate Announcement 00:01 00:01 UK GfK Consumer Confidence : Dec -21 -22 -21 09:30 09:30 PSNCR : Nov GBP2.4bn GBP14.7bn n/a 09:30 09:30 PSNB : Nov GBP9.7bn GBP17.0bn GBP16.8bn 00:30 11:30 Australia RBA MPC Minutes 07:00 08:00 Germany GfK Consumer Confidence : Jan 5.5 5.7 5.7 08:00 09:00 Sweden Consumer Confidence : Dec 22.6 22.0 n/a 10:00 11:00 Italy Unemployment Rate : Q3 8.5% 12:00 07:00 Canada CPI m/m : Nov 0.4% 0.3% n/a 12:00 07:00 CPI y/y : Nov 2.4% 2.2% n/a 12:00 07:00 Bank of Canada Core CPI m/m : Nov 0.4% 0.2% n/a 12:00 07:00 Bank of Canada Core CPI y/y : Nov 1.8% 1.7% n/a Wed 22/12 23:50
(21/12) 08:50 Japan Trade Balance (nsa) : Nov JPY821.3bn JPY510.1bn JPY480.1bn
08:30 09:30 Sweden PPI m/m : Nov -0.7% 0.3% n/a 08:30 09:30 PPI y/y : Nov 2.3% 1.7% n/a 08:30 09:30 Italy ISAE Consumer Confidence : Dec 108.5 09:00 10:00 Retail Sales y/y : Oct 0.3% 10:00 11:00 Wages y/y : Nov 1.5% 09:00 10:00 Norway Unemployment Rate (sa) : Oct 3.5% 3.5% n/a 09:30 09:30 UK BoE MPC Minutes 09:30 09:30 GDP (Final) q/q : Q3 0.8% (p) 0.8% 0.8% 09:30 09:30 GDP (Final) y/y : Q3 2.8% (p) 2.8% 2.8% 09:30 09:30 Current Account : Q3 13:30 08:30 US GDP (Final, saar) q/q : Q3 2.5% (p) 2.5% 2.8% 13:30 08:30 GDP Deflator (Final, saar) q/q : Q3 2.3% (p) 2.3% 2.3% 13:30 08:30 Corporate Profits (Rev, saar) q/q : Q3 2.8% (p) 2.7% n/a 15:00 10:00 Existing Home Sales : Nov 4.43mn 4.74mn 4.71mn 15:00 10:00 FHFA House Prices m/m : Oct 15:30 10:30 EIA Oil Inventories 14:00 15:00 Belgium Business Confidence : Dec 0.8 1.0 n/a Thu 23/12 Japan Public Holiday 07:45 08:45 France Household Consumption m/m : Nov -0.7% 1.1% n/a 07:45 08:45 Household Consumption y/y : Nov -0.3% -0.3% n/a 07:45 08:45 PPI m/m : Nov 0.8% -0.1% n/a 07:45 08:45 PPI y/y: Nov 4.3% 4.0% n/a 08:30 09:30 Neths GDP (Final) q/q : Q3 -0.1% (p) -0.1% n/a 08:30 09:30 GDP (Final) y/y : Q3 1.8% (p) 1.8% n/a 10:15 11:15 Belgium CPI m/m : Dec 0.1% 0.4% n/a 10:15 11:15 CPI y/y : Dec 2.9% 3.1% n/a
66

Market Economics 16 December 2010Market Mover www.GlobalMarkets.bnpparibas.com
GMT Local Previous Forecast Consensus Thu 23/12 13:30 08:30 US Durable Goods Orders m/m : Nov -3.4% -0.5% -0.6% (Cont.) 13:30 08:30 Personal Income m/m : Nov 0.5% 0.2% 0.3% 13:30 08:30 Personal Spending m/m : Nov 0.4% 0.5% 0.5% 13:30 08:30 Initial Claims 420k 425k 420k 14:55 09:55 Michigan Sentiment (Final) : Dec 71.6 74.3 74.5 15:00 10:00 New Home Sales : Nov 283k 300k 300k 13:30 08:30 Canada GDP m/m : Oct Fri 24/12 US Public Holiday 10:00 11:00 Switzerland SNB Quarterly Bulletin 14:00 15:00 France Job Seekers (sa) : Nov -20k -10k n/a Mon 27/12 Holiday UK, Canada Japan BoJ Minutes 05:00 14:00 Housing Starts y/y : Nov 6.4% -0.6% n/a 08:30 09:30 Neths Producer Confidence : Dec 0.3 0.5 n/a Tue 28/12 Holiday UK, Canada 23:30 08:30 Japan CPI National y/y : Nov 0.2% 0.0% n/a 23:30 08:30 Core CPI National y/y : Nov -0.6% -0.6% n/a 23:30 08:30 CPI Tokyo y/y : Dec 0.2% 0.1% n/a 23:30 08:30 Core CPI Tokyo y/y : Dec -0.5% -0.5% n/a 23:30 08:30 Household Consumption y/y : Nov -0.4% 0.4% n/a 23:30 08:30 Unemployment Rate (sa) : Nov 5.1% 5.0% n/a 23:50 08:50 Industrial Production (sa) m/m : Nov -2.0% 1.0% n/a 23:50
(27/12) 08:50 Retail Sales y/y : Nov -0.2% 1.4% n/a
06:30 07:30 France GDP (Final) q/q : Q3 0.4% (p) 0.4% n/a 06:30 07:30 GDP (Final) y/y : Q3 1.8% (p) 1.8% n/a 07:45 08:45 Housing Starts (nsa, 3-mths) y/y : Nov 2.3% 3.0% n/a 08:30 09:30 Sweden Retail Sales (sa) m/m : Nov 0.8% 0.4% n/a 08:30 09:30 Retail Sales (nsa) y/y : Nov 5.1% 5.5% n/a 14:00 09:00 US S&P/Case-Shiller Home Price Index : Oct 15:00 10:00 Consumer Confidence : Dec 54.1 57.0 54.5 Wed 29/12 08:00 09:00 Spain Retail Sales y/y : Nov -2.8% 09:00 10:00 Eurozone M3 y/y : Nov 1.0% 1.5% 1.6%
09:00 10:00 M3 y/y (3-Mth) : Nov 1.1% 1.2% 1.2% Germany States Cost of Living m/m : Dec 0.1% 1.0% 0.9% States Cost of Living y/y : Dec 1.5% 1.7% 1.5% HICP (Prel) m/m : Dec 0.1% 1.1% n/a HICP (Prel) y/y : Dec 1.6% 1.8% n/a
09:30 09:30 UK BoE Housing Equity Withdrawal : Q3 10:30 11:30 Switzerland KoF Leading Indicator : Dec 2.12 2.08 n/a 15:30 10:30 US EIA Oil Inventories Thu 30/12 08:30 09:30 Italy ISAE Business Confidence : Dec 101.6 08:10 09:10 Eurozone Retail PMI : Dec 51.3 52.0 n/a 08:30 09:30 Eurocoin : Dec 0.45 0.50 n/a 13:30 08:30 US Initial Claims 14:45 09:45 Chicago PMI : Dec 62.5 61.0 61.0 Fri 31/12 Holiday US, Germany, Italy, Spain, Sweden During 29-31 UK Nationwide House Prices Index m/m : Dec -0.3% -0.3% n/a Week Nationwide House Prices Index y/y : Dec 0.4% -0.3% n/a Release dates and forecasts as at c.o.b. prior to the date of publication: See Daily Economic Spotlight for any revision Source: BNP Paribas
67

Market Economics 16 December 2010Market Mover www.GlobalMarkets.bnpparibas.com
Key Data Preview Chart 1: German Ifo Business Climate BNP Paribas Forecast: Still Going Strong
93 94 95 96 97 98 99 00 01 02 03 04 05 06 07 08 09 1075
80
85
90
95
100
105
110
115
120
Current Conditions
Expectations (4-Mth Lag)
Source: Reuters EcoWin Pro
Dec (f) Nov Oct Sep Headline 109.8 109.3 107.7 106.8 Expectations 106.8 106.3 105.2 103.9 Current Conditions 112.8 112.3 110.2 109.8
Key Point: Sentiment will remain elevated, with the economic expansion broadening out.
Germany: Ifo Business Climate (December) Release Date: Friday 17 December Ifo’s business climate index improved for the sixth straight month in November, rising above its high point during the previous expansion from 2005 to 2008. The sub-indices measuring current business conditions and future expectations both improved last month, with the former at a very elevated level (see chart). The assessment of current business conditions in Germany is still a little short of its cycle high in 2006 (115.5) and we expect a further improvement in December. The improvement in Ifo’s sentiment surveys was initially due to the exceptional strength in the manufacturing and export sectors but domestic sectors, including retail, have also shown a pronounced improvement more recently. The business climate index for the retail sector has risen to its strongest level since the early 1990s. Survey participants have signalled a moderation in the rate of externally-driven growth relative to the spring peaks but domestic demand is picking up the baton. The latest ‘hard’ activity data have been strong in Germany, with industrial output rising at its fastest m/m rate for six months in October. This points to a further pick-up in expectations, though this could be tempered by the recent sharp rise in bond yields.
Chart 2: French Business Surveys (Normalised) BNP Paribas Forecast: Modest Gain
00 01 02 03 04 05 06 07 08 09 1065
70
75
80
85
90
95
100
105
110
115
120
125Manufacturing
Services
Source: Reuters EcoWin Pro
SA Dec (f) Nov Oct Dec 09Services Index 102 102 101 90 Manufacturing Index 102 100 102 88 Overall Manuf. Outlook 10 8 8 -5 Own Manuf. Outlook 14 11 16 4
Key Point: We expect a technical recovery in manufacturing, but there is no post-recession catch-up in sight.
France: Monthly Industrial Survey (December) Release Date: Friday 17 December The correction of manufacturing confidence in November can be partly explained by social unrest and its impact on the chemical industry. This should be temporary, and we forecast a production catch-up starting in November. Apart from the automobile industry, orders have been relatively robust recently, which should support confidence and output in the coming months. It is important to highlight that, contrary to what has happened in Germany, the recession is being followed by normalisation but no real catch-up. Headline indices for services as well as for manufactured goods have both been in a narrow range, from 99 to 102, during the last three months. There is still plenty of scope for production to increase, as the low capacity utilisation ratio shows, should demand be strong enough. The French economy is trapped between dynamic northern Europe and poor-performing southern Europe. This may have to do with geography, but it is also due to competitiveness. We are thus moderately confident about the growth outlook for France.
68
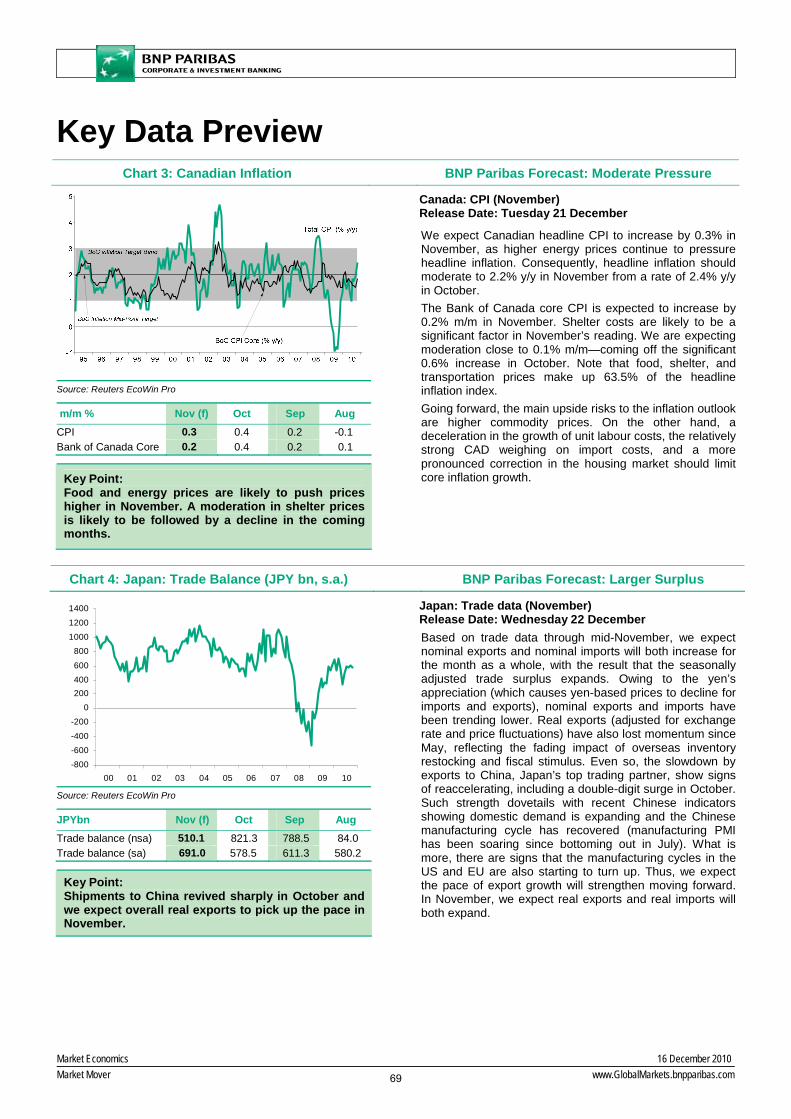
Market Economics 16 December 2010Market Mover www.GlobalMarkets.bnpparibas.com
Key Data Preview Chart 3: Canadian Inflation BNP Paribas Forecast: Moderate Pressure
Source: Reuters EcoWin Pro
m/m % Nov (f) Oct Sep Aug CPI 0.3 0.4 0.2 -0.1 Bank of Canada Core 0.2 0.4 0.2 0.1
Key Point: Food and energy prices are likely to push prices higher in November. A moderation in shelter prices is likely to be followed by a decline in the coming months.
Canada: CPI (November) Release Date: Tuesday 21 December
We expect Canadian headline CPI to increase by 0.3% in November, as higher energy prices continue to pressure headline inflation. Consequently, headline inflation should moderate to 2.2% y/y in November from a rate of 2.4% y/y in October. The Bank of Canada core CPI is expected to increase by 0.2% m/m in November. Shelter costs are likely to be a significant factor in November’s reading. We are expecting moderation close to 0.1% m/m—coming off the significant 0.6% increase in October. Note that food, shelter, and transportation prices make up 63.5% of the headline inflation index. Going forward, the main upside risks to the inflation outlook are higher commodity prices. On the other hand, a deceleration in the growth of unit labour costs, the relatively strong CAD weighing on import costs, and a more pronounced correction in the housing market should limit core inflation growth.
Chart 4: Japan: Trade Balance (JPY bn, s.a.) BNP Paribas Forecast: Larger Surplus
-800-600-400
-2000
200400600
80010001200
1400
00 01 02 03 04 05 06 07 08 09 10
Source: Reuters EcoWin Pro
JPYbn Nov (f) Oct Sep Aug Trade balance (nsa) 510.1 821.3 788.5 84.0 Trade balance (sa) 691.0 578.5 611.3 580.2
Key Point: Shipments to China revived sharply in October and we expect overall real exports to pick up the pace in November.
Japan: Trade data (November) Release Date: Wednesday 22 December Based on trade data through mid-November, we expect nominal exports and nominal imports will both increase for the month as a whole, with the result that the seasonally adjusted trade surplus expands. Owing to the yen’s appreciation (which causes yen-based prices to decline for imports and exports), nominal exports and imports have been trending lower. Real exports (adjusted for exchange rate and price fluctuations) have also lost momentum since May, reflecting the fading impact of overseas inventory restocking and fiscal stimulus. Even so, the slowdown by exports to China, Japan’s top trading partner, show signs of reaccelerating, including a double-digit surge in October. Such strength dovetails with recent Chinese indicators showing domestic demand is expanding and the Chinese manufacturing cycle has recovered (manufacturing PMI has been soaring since bottoming out in July). What is more, there are signs that the manufacturing cycles in the US and EU are also starting to turn up. Thus, we expect the pace of export growth will strengthen moving forward. In November, we expect real exports and real imports will both expand.
69

Market Economics 16 December 2010Market Mover www.GlobalMarkets.bnpparibas.com
Key Data Preview Chart 5: US: Existing & Pending Home Sales BNP Paribas Forecast: Up
Source: Reuters EcoWin Pro
Nov (f) Oct Sep Aug New Home Sales
(000s saar) 300 283 308 275 Existing Home Sales (millions saar) 4.74 4.43 4.53 4.12
Key Point: Existing home sales are expected to jump 7% m/m to 4.74mn annualised units while new home sales should rebound 6% to 300k in November, in line with strong mortgage applications.
US: Existing & New Home Sales (November) Release Date: Wednesday & Thursday 22 & 23 Dec Existing home sales are expected to jump 7% m/m to 4.74mn annualised units in November, more than offsetting the last month’s 2.2% decline. Pending sales that are based on contract signings and lead existing sales by one to two months jumped 10.4% m/m in November. In addition, mortgage applications to purchase surged 17.9% m/m in November, further supporting our forecast for an increase in existing home sales. New home sales plunged 8.1% in October to 283k annualised units. We expect a rebound of 6% m/m to 300k in November, in line with strong mortgage applications. Both new and existing home sales remain low by historical standards and relatively small monthly changes in the number of homes sold translate into relatively large swings in growth rates.
Chart 6: French Sales of Manuf. Goods BNP Paribas Forecast: Rebounding
05 06 07 08 09 10-40
-35
-30
-25
-20
-15
-10
-5
0
5
-4-3-2-1012345678
Household Confid. (RHS)Commission Survey
Manuf. Goods Sales (% y/y, volume)
Source: Reuters EcoWin Pro
Volume index Nov (f) Oct Sep Nov 09 SA-WDA % m/m 1.1 -0.7 1.6 1.2 % y/y -0.3 -0.3 1.2 3.8
Key Point: Correction of car sales should boost the November figure. The underlying trend should remain strong.
France: Hh Consumption of Manuf. Goods (November)Release Date: Thursday 23 December Household confidence has been rising since July despite social unrest. The INSEE index is still very weak in absolute terms, but the EU Commission puts confidence in line with long-term average. As a result, durable goods sales ex-autos have been quite dynamic recently; this momentum should continue. Sales of clothes have been relatively robust in the last few months, printing strong gains vs. weak 2009 levels. This trend should continue, with the help of cold weather. Some 90% of the retail sales decline in October was due to cars; we expect this to be corrected. Car sales, which are included in the French overall retail sales data, were boosted last year by car sales incentives. As the incentive has been halved since last year (to EUR 500), the effect is weaker this year but has not totally disappeared. November new car registrations, up 19% m/m but down 10.4% y/y, show this. Car sales will again drive the headline retail sales data in the last few months of this year. According to retailers, Christmas sales are proving relatively dynamic; this could boost their turnover during the last weekend of November. The bulk of the benefit should be visible in the December data (due on 25 January 2011).
70

Key Data Preview Chart 7: US Confidence vs Consumption BNP Paribas Forecast: Solid Spending,
Subdued Income
Source: Reuters EcoWin Pro
% m/m Nov (f) Oct Sep Aug Personal Income 0.2 0.5 0.0 0.5 Consumption 0.5 0.4 0.2 0.3 Core PCE Prices 0.0 0.0 0.0 0.1
Key Point: A surge in holiday shopping should lead to a solid gain in spending while income gains will be subdued.
US: Personal Income & Spending (November) Release Date: Thursday 23 December Personal consumption is forecast to rise 0.5% in November after a similar gain in October. The gain will be driven by a surge in retail holiday spending while auto purchases were flat on the month and we look for a modest increase in service expenditures. The increase would be consistent with a healthy gain of between 2.5% and 3.0% in overall consumer spending in Q4 as consumers gain a little more confidence in the recovery. Meanwhile personal income is forecast to rise by a subdued 0.2% in November reflecting weakness in aggregate hours worked captured in the employment report. This comes on the heels of a 0.5% surge that was driven by a more robust increase in wages and salaries. Smoothing through the monthly volatility, wage and salary income is growing at a moderate pace serving as a foundation for continued gains in spending. The more subdued increase in income should lead the personal saving rate to move lower. The core PCE price index is expected to be flat in November, which would hold the y/y steady at a record low 0.9% where we expect it to be for the next four months. Headline inflation is expected to rise 0.2% suggesting a 0.3% increase in real consumer spending.
Chart 8: US: ISM Points to Moderation BNP Paribas Forecast: Small Decline
Source: Reuters EcoWin Pro
% m/m Nov (f) Oct Sep Aug Durable Goods -0.5 -3.4 5.0 -0.8 Ex-Transport 1.5 -2.7 1.3 2.1
Key Point: A decline in the headline will mask a solid rebound in orders ex-transportation.
US: Durable Goods (November) Release Date: Thursday 23 December Durable goods orders are expected to fall 0.5% in November, reflecting a plunge in orders for Boeing aircraft. Meanwhile, we look for orders ex transportation to rise a solid 1.5% after plunging 2.7% a month prior. The October reading was disappointing and contradicts some of the resilience we have seen in other manufacturing indicators. Therefore we look for a rebound which would leave equipment and software investment on a more moderate but still robust growth trajectory in Q4.
Market Economics 16 December 2010Market Mover www.GlobalMarkets.bnpparibas.com
71

Market Economics 16 December 2010Market Mover www.GlobalMarkets.bnpparibas.com
Key Data Preview Chart 9: Japanese Unemployment Rate (% sa) BNP Paribas Forecast: Slight Improvement
3.5
4.0
4.5
5.0
5.5
6.0
00 01 02 03 04 05 06 07 08 09 10
Source: Reuters EcoWin Pro
% s.a. Nov (f) Oct Sep Aug Unemployment rate 5.0 5.1 5.0 5.1
Key Point: The jobless rate continues to seesaw in the low 5% range. With the economy likely to contract in Q4, it will be some time before job growth clearly picks up.
Japan: Unemployment rate (November) Release Date: Tuesday 28 December We expect the unemployment rate in November to drop 0.1pp to 5.0%, reversing the 0.1pp increase in October. Basically, though, the jobless rate is still seesawing in the low 5% range, a pattern that has continued since the rapid improvement from 5.6% in July 2009 ended in January-February at 4.9%. Despite the economy’s relatively robust expansion, job growth continues to lag because corporations are reluctant to aggressively hire owing to lingering perceptions of over-staffing. Although perceptions of excessive employment are steadily waning, it will be some time before job growth clearly picks up, especially since the economy looks headed for a momentary contraction in Q4 due to the winding down of stimulus programmes and negative payback for front-loaded demand.
Chart 10: Japanese CPI (% y/y) BNP Paribas Forecast: Modest Improvement
-3
-2
-1
0
1
2
3
02 03 04 05 06 07 08 09 10
Core CPI
CPI excluding energy and food, but not alcohol
Source: Reuters EcoWin Pro
% y/y Nov (f) Oct Sep Aug Core CPI -0.6 -0.6 -1.1 -1.0 CPI 0.0 0.2 -0.6 -0.9
Key Point: Although one-off factors have made prices volatile of late, trend indicators (10% trimmed mean CPI) confirm deflation continues to moderate.
Japan: CPI (National, November) Release Date: Tuesday 28 December In October, the rate of decline in the national core CPI improved a sharp 0.5pp from September to -0.6% y/y, due in large part to the effects of a tobacco tax hike. But even excluding such one-off policy factors, the “10% trimmed mean CPI” – which excludes volatile special factors such as the tobacco tax (contribution:+0.28pp) and the earlier tuition fee exemptions for public high schools (+0.52pp) – showed an improvement of 0.1pp to -0.3% in November. This index has been steadily on the mend since hitting a low of -1.3% in November 2009. Based on the Tokyo CPI numbers for November (after making allowances for differences with the national index), we estimate that the national core index in November will decline at the same 0.6% rate as in October and that the national 10% trimmed mean CPI will also move sideways.
72
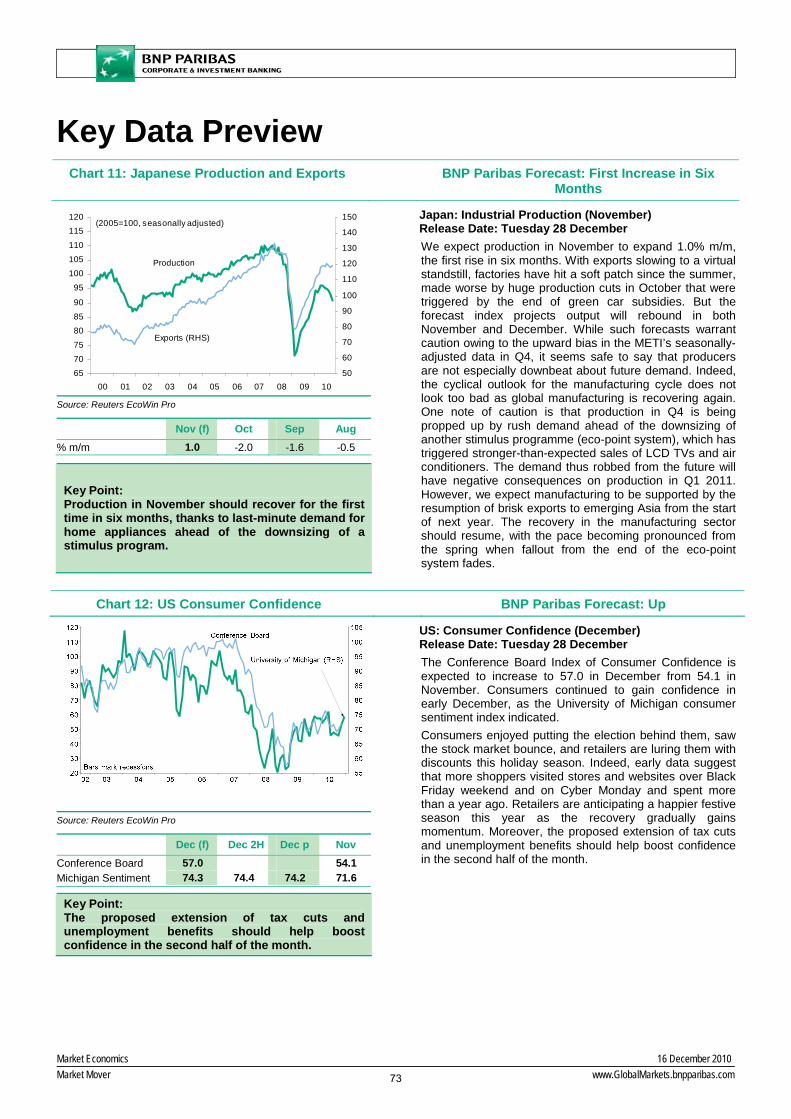
Market Economics 16 December 2010Market Mover www.GlobalMarkets.bnpparibas.com
Key Data Preview Chart 11: Japanese Production and Exports BNP Paribas Forecast: First Increase in Six
Months
6570
75
8085
90
95
100105
110
115120
00 01 02 03 04 05 06 07 08 09 1050
60
70
80
90
100
110
120
130
140
150
Exports (RHS)
Production
(2005=100, seasonally adjusted)
Source: Reuters EcoWin Pro
Nov (f) Oct Sep Aug % m/m 1.0 -2.0 -1.6 -0.5
Key Point: Production in November should recover for the first time in six months, thanks to last-minute demand for home appliances ahead of the downsizing of a stimulus program.
Japan: Industrial Production (November) Release Date: Tuesday 28 December We expect production in November to expand 1.0% m/m, the first rise in six months. With exports slowing to a virtual standstill, factories have hit a soft patch since the summer, made worse by huge production cuts in October that were triggered by the end of green car subsidies. But the forecast index projects output will rebound in both November and December. While such forecasts warrant caution owing to the upward bias in the METI’s seasonally-adjusted data in Q4, it seems safe to say that producers are not especially downbeat about future demand. Indeed, the cyclical outlook for the manufacturing cycle does not look too bad as global manufacturing is recovering again. One note of caution is that production in Q4 is being propped up by rush demand ahead of the downsizing of another stimulus programme (eco-point system), which has triggered stronger-than-expected sales of LCD TVs and air conditioners. The demand thus robbed from the future will have negative consequences on production in Q1 2011. However, we expect manufacturing to be supported by the resumption of brisk exports to emerging Asia from the start of next year. The recovery in the manufacturing sector should resume, with the pace becoming pronounced from the spring when fallout from the end of the eco-point system fades.
Chart 12: US Consumer Confidence BNP Paribas Forecast: Up
Source: Reuters EcoWin Pro
Dec (f) Dec 2H Dec p Nov Conference Board 57.0 54.1 Michigan Sentiment 74.3 74.4 74.2 71.6
Key Point: The proposed extension of tax cuts and unemployment benefits should help boost confidence in the second half of the month.
US: Consumer Confidence (December) Release Date: Tuesday 28 December The Conference Board Index of Consumer Confidence is expected to increase to 57.0 in December from 54.1 in November. Consumers continued to gain confidence in early December, as the University of Michigan consumer sentiment index indicated. Consumers enjoyed putting the election behind them, saw the stock market bounce, and retailers are luring them with discounts this holiday season. Indeed, early data suggest that more shoppers visited stores and websites over Black Friday weekend and on Cyber Monday and spent more than a year ago. Retailers are anticipating a happier festive season this year as the recovery gradually gains momentum. Moreover, the proposed extension of tax cuts and unemployment benefits should help boost confidence in the second half of the month.
73
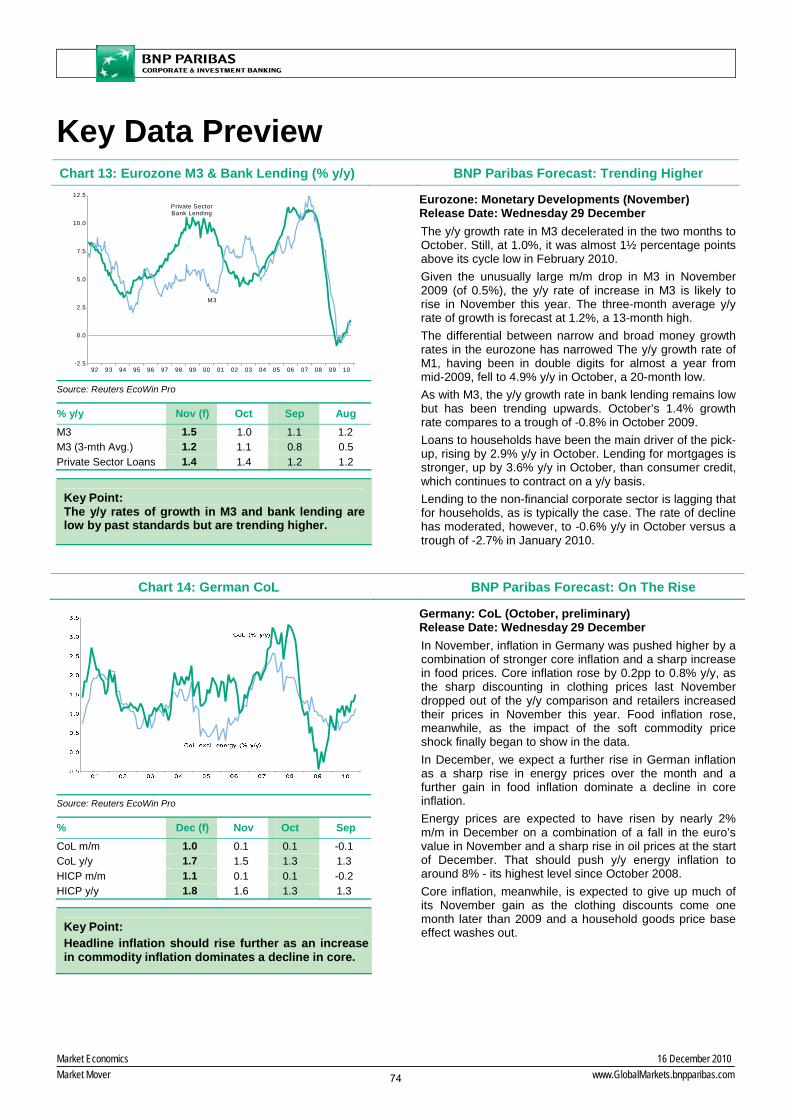
Market Economics 16 December 2010Market Mover www.GlobalMarkets.bnpparibas.com
Key Data Preview Chart 13: Eurozone M3 & Bank Lending (% y/y) BNP Paribas Forecast: Trending Higher
92 93 94 95 96 97 98 99 00 01 02 03 04 05 06 07 08 09 10-2.5
0.0
2.5
5.0
7.5
10.0
12.5
Private Sector Bank Lending
M3
Source: Reuters EcoWin Pro
% y/y Nov (f) Oct Sep Aug M3 1.5 1.0 1.1 1.2 M3 (3-mth Avg.) 1.2 1.1 0.8 0.5 Private Sector Loans 1.4 1.4 1.2 1.2
Key Point: The y/y rates of growth in M3 and bank lending are low by past standards but are trending higher.
Eurozone: Monetary Developments (November) Release Date: Wednesday 29 December The y/y growth rate in M3 decelerated in the two months to October. Still, at 1.0%, it was almost 1½ percentage points above its cycle low in February 2010. Given the unusually large m/m drop in M3 in November 2009 (of 0.5%), the y/y rate of increase in M3 is likely to rise in November this year. The three-month average y/y rate of growth is forecast at 1.2%, a 13-month high. The differential between narrow and broad money growth rates in the eurozone has narrowed The y/y growth rate of M1, having been in double digits for almost a year from mid-2009, fell to 4.9% y/y in October, a 20-month low. As with M3, the y/y growth rate in bank lending remains low but has been trending upwards. October’s 1.4% growth rate compares to a trough of -0.8% in October 2009. Loans to households have been the main driver of the pick-up, rising by 2.9% y/y in October. Lending for mortgages is stronger, up by 3.6% y/y in October, than consumer credit, which continues to contract on a y/y basis. Lending to the non-financial corporate sector is lagging that for households, as is typically the case. The rate of decline has moderated, however, to -0.6% y/y in October versus a trough of -2.7% in January 2010.
Chart 14: German CoL BNP Paribas Forecast: On The Rise
Source: Reuters EcoWin Pro
% Dec (f) Nov Oct Sep CoL m/m 1.0 0.1 0.1 -0.1 CoL y/y 1.7 1.5 1.3 1.3 HICP m/m 1.1 0.1 0.1 -0.2 HICP y/y 1.8 1.6 1.3 1.3
Key Point: Headline inflation should rise further as an increase in commodity inflation dominates a decline in core.
Germany: CoL (October, preliminary) Release Date: Wednesday 29 December In November, inflation in Germany was pushed higher by a combination of stronger core inflation and a sharp increase in food prices. Core inflation rose by 0.2pp to 0.8% y/y, as the sharp discounting in clothing prices last November dropped out of the y/y comparison and retailers increased their prices in November this year. Food inflation rose, meanwhile, as the impact of the soft commodity price shock finally began to show in the data. In December, we expect a further rise in German inflation as a sharp rise in energy prices over the month and a further gain in food inflation dominate a decline in core inflation. Energy prices are expected to have risen by nearly 2% m/m in December on a combination of a fall in the euro’s value in November and a sharp rise in oil prices at the start of December. That should push y/y energy inflation to around 8% - its highest level since October 2008. Core inflation, meanwhile, is expected to give up much of its November gain as the clothing discounts come one month later than 2009 and a household goods price base effect washes out.
74

Market Economics 16 December 2010Market Mover www.GlobalMarkets.bnpparibas.com
Economic Calendar: 3 – 28 January 3 January 4 January 5 January 6 January 7 January Eurozone: Manufacturing PMI (Final) Dec Spain: HICP (Flash) Dec UK: Holiday Switz: PMI Dec US: ISM Manufacturing Dec
Eurozone: HICP (Flash) Dec UK: CIPS Manufacturing Dec, Net Consumer Credit Nov, Mortgage Approvals Nov Germany: Labour Nov France: Consumer Confidence Dec US: Factory Orders Nov, FOMC Minutes
Eurozone: PPI Nov, Industrial Orders Oct, PMI Services (Final) Dec Spain: IP Nov US: ADP Employment Change Dec, ISM Services Dec
Eurozone: Retail Sales Nov, Business and Consumer Confidence Dec UK: CIPS Services Dec Germany: Factory Orders Nov Neths: CPI Dec Switz: CPI Dec
Eurozone: Labour Nov, GDP (Final) Q3 Germany: Industrial Production Nov, Trade Balance Nov France: Trade Balance Nov Norway: Industrial Production Oct, Retail Sales Nov US: Labour Dec, Consumer Credit Nov Canada: Labour Dec
During Week: Germany Retail Sales Nov, Italy CPI Dec, UK Halifax House Prices Dec 10 January 11 January 12 January 13 January 14 January Australia: Retail Sales Nov France: Industrial Production Nov Sweden: Industrial Production Nov Norway: CPI Dec, PPI Dec
Australia: Trade Balance Nov Japan: Leading Indicator Nov France: BoF Survey Dec UK: BRC Retail Sales Monitor Dec US: NFIB Small Business Optimism Dec, Wholesale Inventories Nov
Japan: M2 Dec, Current Account Nov Eurozone: Industrial Production Nov France: Current Account Nov UK: Trade Balance Nov US: Import Prices Dec
Australia: Labour Dec Japan: Machinery Orders Nov Eurozone: ECB Rate Announcement & Press Conference France: CPI Dec Neths: Retail Sales Nov, Industrial Production Nov UK: Industrial Production Nov, BoE Rate Announcement Sweden: CPI Dec US: PPI Dec, Trade Balance Nov
Japan: CGPI Dec Eurozone: Trade Balance Nov, HICP Dec Germany: HICP Dec Spain: HICP Dec UK: PPI Dec US: CPI Dec, Retail Sales Dec, Industrial Production Dec, UoM Sentiment (Prel) Jan, Business inventories Nov
During Week: Germany Retail Sales Nov, WPI Dec 17 January 18 January 19 January 20 January 21 January UK: Rightmove House Prices Jan
Canada: BoC Rate Announcement UK: DCLG House Prices Nov, CPI Dec Germany: ZEW Survey Jan US: Empire Manufacturing Jan, TICS Data Nov, NAHB Housing Index Jan
Japan: Tertiary Index Nov Eurozone: Current Account Nov Belgium: Consumer Confidence Dec UK: Labour Dec Canada: BoC Monetary Policy Report US: Housing Starts Dec
Germany: PPI Dec Neths: Labour Dec, Consumer confidence Jan US: Existing Home Sales Dec
Eurozone: PMIs (Flash) Jan Germany: Ifo Survey Jan Belgium: Business Confidence Dec UK: PSNCR Dec, PSNB Dec, Retail Sales Dec
During Week: Germany WPI Dec
24 January 25 January 26 January 27 January 28 January Australia: PPI Dec Eurozone: Industrial Orders Nov France: Industry Survey Jan Neths: Producer Confidence Jan
Australia: CPI Dec Japan: BoJ Rate Announcement France: Housing Starts Dec, Retail Sales Dec, Quarterly Industrial Survey Q1 UK: GDP (Adv) Q4 US: S&P/CaseShiller House Prices Nov, Consumer Confidence Jan, FHFA House Prices Nov Canada: CPI Dec
France: Job Seekers Dec UK: BoE Minutes Norway: Norges Bank Rate Announcement US: New Home Sales Dec, FOMC Rate Announcement
Japan: Trade Balance Dec Eurozone: Business and Consumer Confidence Jan Germany: HICP (Prel) Jan France: Consumer Confidence Jan Spain: Retail Sales Dec Sweden: Labour Dec, PPI Dec, Consumer Confidence Jan US: Durable Goods Orders Dec, Pending Home Sales Nov
Japan: BoJ Monetary Policy Meeting Minutes, CPI Tokyo Jan, CPI National Dec, Labour Dec, Household Consumption Dec, Retail Sales Dec Eurozone: Eurocoin Jan, Monetary Developments Dec US: ECI Q4, GDP (Adv) Q4, UoM Sentiment (Final) Jan
During Week: Germany GfK Consumer Confidence Jan, UK Nationwide House Prices Jan Source: BNP Paribas Release dates as at c.o.b. prior to the date of this publication. See our Daily Spotlight for any revisions
75

Interest Rate Strategy 16 December 2010Market Mover, Non-Objective Research Section www.GlobalMarkets.bnpparibas.com
Treasury and SAS Issuance Calendar Daily update onto https://globalmarkets.bnpparibas.com, Research & Apps, Tools & Applications, Mkt Calendar, Government Flows
In the pipeline - Treasuries: France: Cancelled its BTF auction initially planned for 27 Dec. First BTF auction of 2011 will take place on 3 Jan, settlement on 6 Jan Austria: Expects to make one or two syndicated issues in 2011 Germany: Intends to issue inflation-linked federal securities (EUR2-3bn quarterly) and reserves the right to issue foreign currency bonds in '11 Poland: May issue euro-denominated bonds as early as January 2011 UK: Index-Linked Gilt 30y-50y area (syndicated) in the second half of January 2011 and two mini tenders, one in Feb & the other in Mar Belgium: Likely to issue 3 new OLO benchmarks (launched through syndications) in 2011 - plans also to buy back bonds maturing in 2012 for EUR 2.19bn in 2011 Neths: DSL 10-year (new, DDA) in Feb/Mar 2011 - exact timing yet to be announced, may lead to changes in the regular issuance calendar Czech Rep.: Plans at least one eurobond benchmark in 2011 - currency denomination is to be defined Denmark: In 2011, to issue a 5-year EUR loan (EUR 1-2bn) and EUR or USD loans may be issued in the 2-5y maturity segment Slovak Rep.: Will open two new bond issues in 2011, a 3y zero-coupon bond (up to EUR 1.5bn) and a 7y or 10y bond (EUR 3bn) Slovenia: Plans to issue Eurobond in H1 2011 During the week: US: Announcement of 2-, 5- & 7y Notes (new) details on Thu 23 Dec FNMA: December syndicated auction, details announced on Mon 20 Dec
Date Day Closing Country Issues Details BNPP forecasts Local GMT
17/12 Fri 11:00 16:00 US Outright Treasury Coupon Purchase (2028-2040) USD 1.5-2.5bn20/12 Mon 11:00 16:00 US Outright Treasury Coupon Purchase (2018-2020) USD 7-9bn
Outright Treasury Coupon Purchase (2014-2016) USD 6-8bn21/12 Tue 12:00 17:00 Canada Repurchase of 10 Cash Mgt Bonds (Jun11 - Jun12) CAD 1bn
11:00 16:00 US Outright Treasury Coupon Purchase (2016-2017) USD 7-9bn Outright TIPS Purchase (2012-2040) USD 1-2bn
22/12 Wed 12:00 03:00 Japan JGB 15 Jan 2013 JPY 2.6tn 11:00 16:00 US Outright Treasury Coupon Purchase (2021-2027) USD 1.5-2.5bn
27/12 Mon 13:00 18:00 US Notes 2-year (new) 23 Dec USD 35bn28/12 Tue 11:00 16:00 US Outright Treasury Coupon Purchase (2013-2014) USD 6-8bn
13:00 18:00 US Notes 5-year (new) 23 Dec USD 35bn29/12 Wed 10:55 09:55 Italy CTZ 23 Dec EUR 2-3bn
11:00 16:00 US Outright Treasury Coupon Purchase (2012-2013) USD 4-6bn 13:00 18:00 US Notes 7-year (new) 23 Dec USD 29bn
30/12 Thu 10:55 09:55 Italy 3 & 10y BTPs and CCT 23 Dec EUR 5-8bn03/01 Mon 11:00 16:00 US Outright Treasury Coupon Purchase (2018-2020) USD 7-9bn04/01 Tue 11:00 16:00 US Outright TIPS Purchase (2012-2040) USD 1-2bn05/01 Wed 11:00 10:00 Germany Bund 2.5% 4 Jan 2021 EUR 5bn
11:00 16:00 US Outright Treasury Coupon Purchase (2028-2040) USD 1.5-2.5bn06/01 Thu 12:00 03:00 Japan JGB 10-year 30 Dec JPY 2.2tn
10:50 09:50 France OATs 31 Dec EUR 7-9bn 10:30 10:30 UK Gilt 3.75% 7 Sep 2020 29 Dec 11:00 16:00 US Outright Treasury Coupon Purchase (2015-2016) USD 6-8bn
07/01 Fri 11:00 16:00 US Outright Treasury Coupon Purchase (2013-2014) USD 6-8bn10/01 Mon Slovak Rep. SLOVGB 4% 27 Apr 2020 (#214) 6 Jan
11:00 16:00 US Outright Treasury Coupon Purchase (2018-2020) USD 7-9bn11/01 Tue 12:00 03:00 Japan Auction for Enhanced-liquidity 4 Jan JPY 0.3tn
11:00 10:00 Austria RAGBs 4 Jan EUR 1-2bn 10:30 10:30 UK Index-Linked Gilt 1.25% 22 Nov 2032 4 Jan Neths DSL 15 Jan 2014 (new) EUR 2.5-3.5bn Denmark DGBs 6 Jan 11:00 16:00 US Outright Treasury Coupon Purchase (2016-2017) USD 7-9bn 13:00 18:00 US Notes 3-year (new) 6 Jan USD 32bn
12/01 Wed 11:00 10:00 Germany OBL 26 Feb 2016 (Series 159) (new) EUR 6bn 11:00 10:00 Sweden T-bonds 5 Jan 10:30 10:30 Portugal OTs (To be confirmed) 6 Jan EUR 1-2bn 13:00 18:00 US Notes 10-year 6 Jan USD 21bn
13/01 Thu 12:00 03:00 Japan JGB 30-year 6 Jan JPY 0.6tn 10:30 09:30 Spain Bonos (TBC) 27 Dec EUR 3-5bn 10:55 09:55 Italy 5-year BTP and possibly 15- or 30-year BTP 5 Jan EUR 7-9bn 13:00 18:00 US Bond 30-year 6 Jan USD 13bn
Sources: Treasuries, BNP Paribas
76
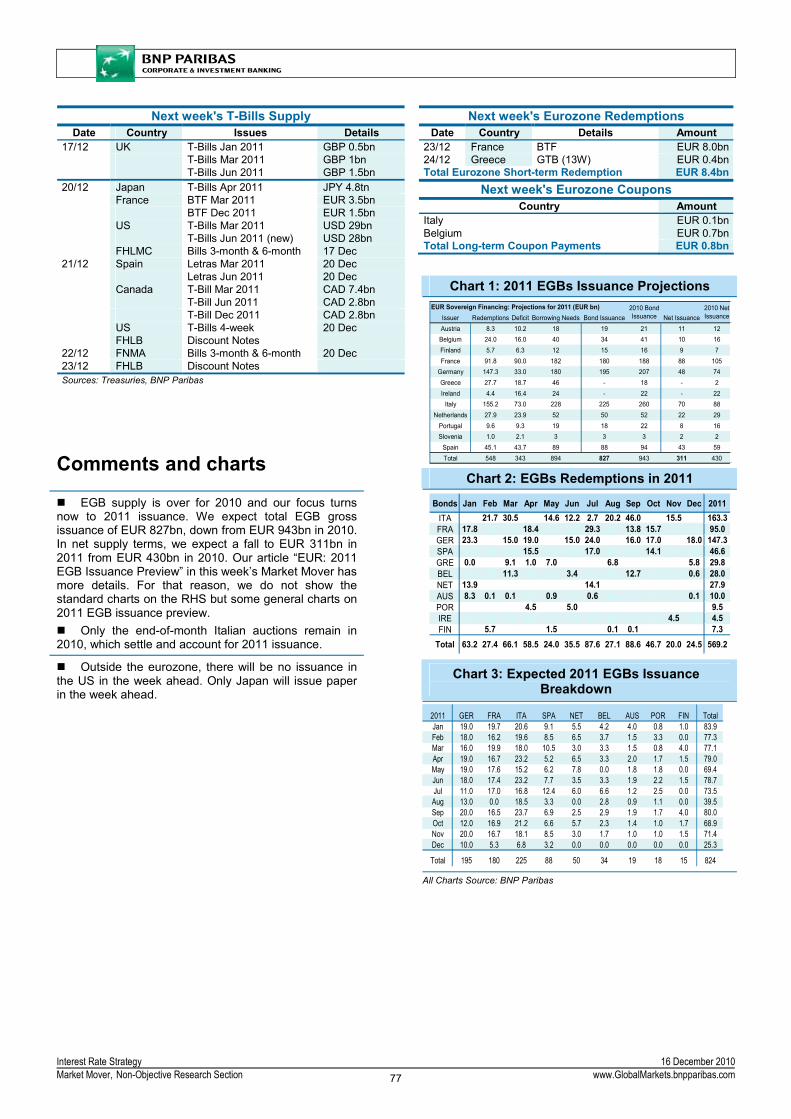
Interest Rate Strategy 16 December 2010Market Mover, Non-Objective Research Section www.GlobalMarkets.bnpparibas.com
Chart 1: 2011 EGBs Issuance Projections EUR Sovereign Financing: Projections for 2011 (EUR bn)
Issuer Redemptions Deficit Borrowing Needs Bond Issuance Net IssuanceAustria 8.3 10.2 18 19 21 11 12Belgium 24.0 16.0 40 34 41 10 16Finland 5.7 6.3 12 15 16 9 7France 91.8 90.0 182 180 188 88 105
Germany 147.3 33.0 180 195 207 48 74Greece 27.7 18.7 46 - 18 - 2Ireland 4.4 16.4 24 - 22 - 22
Italy 155.2 73.0 228 225 260 70 88Netherlands 27.9 23.9 52 50 52 22 29
Portugal 9.6 9.3 19 18 22 8 16Slovenia 1.0 2.1 3 3 3 2 2
Spain 45.1 43.7 89 88 94 43 59Total 548 343 894 827 943 311 430
2010 Bond Issuance
2010 Net Issuance
Chart 2: EGBs Redemptions in 2011
Bonds Jan Feb Mar Apr May Jun Jul Aug Sep Oct Nov Dec 2011ITA 0.0 21.7 30.5 0.0 14.6 12.2 2.7 20.2 46.0 0.0 15.5 0.0 163.3FRA 17.8 0.0 0.0 18.4 0.0 0.0 29.3 0.0 13.8 15.7 0.0 0.0 95.0GER 23.3 0.0 15.0 19.0 0.0 15.0 24.0 0.0 16.0 17.0 0.0 18.0 147.3SPA 0.0 0.0 0.0 15.5 0.0 0.0 17.0 0.0 0.0 14.1 0.0 0.0 46.6GRE 0.0 0.0 9.1 1.0 7.0 0.0 0.0 6.8 0.0 0.0 0.0 5.8 29.8BEL 0.0 0.0 11.3 0.0 0.0 3.4 0.0 0.0 12.7 0.0 0.0 0.6 28.0NET 13.9 0.0 0.0 0.0 0.0 0.0 14.1 0.0 0.0 0.0 0.0 0.0 27.9AUS 8.3 0.1 0.1 0.0 0.9 0.0 0.6 0.0 0.0 0.0 0.0 0.1 10.0POR 0.0 0.0 0.0 4.5 0.0 5.0 0.0 0.0 0.0 0.0 0.0 0.0 9.5IRE 0.0 0.0 0.0 0.0 0.0 0.0 0.0 0.0 0.0 0.0 4.5 0.0 4.5FIN 0.0 5.7 0.0 0.0 1.5 0.0 0.0 0.1 0.1 0.0 0.0 0.0 7.3
Total 63.2 27.4 66.1 58.5 24.0 35.5 87.6 27.1 88.6 46.7 20.0 24.5 569.2
Chart 3: Expected 2011 EGBs Issuance Breakdown
2011 GER FRA ITA SPA NET BEL AUS POR FIN TotalJan 19.0 19.7 20.6 9.1 5.5 4.2 4.0 0.8 1.0 83.9Feb 18.0 16.2 19.6 8.5 6.5 3.7 1.5 3.3 0.0 77.3Mar 16.0 19.9 18.0 10.5 3.0 3.3 1.5 0.8 4.0 77.1Apr 19.0 16.7 23.2 5.2 6.5 3.3 2.0 1.7 1.5 79.0May 19.0 17.6 15.2 6.2 7.8 0.0 1.8 1.8 0.0 69.4Jun 18.0 17.4 23.2 7.7 3.5 3.3 1.9 2.2 1.5 78.7Jul 11.0 17.0 16.8 12.4 6.0 6.6 1.2 2.5 0.0 73.5Aug 13.0 0.0 18.5 3.3 0.0 2.8 0.9 1.1 0.0 39.5Sep 20.0 16.5 23.7 6.9 2.5 2.9 1.9 1.7 4.0 80.0Oct 12.0 16.9 21.2 6.6 5.7 2.3 1.4 1.0 1.7 68.9Nov 20.0 16.7 18.1 8.5 3.0 1.7 1.0 1.0 1.5 71.4Dec 10.0 5.3 6.8 3.2 0.0 0.0 0.0 0.0 0.0 25.3
Total 195 180 225 88 50 34 19 18 15 824
All Charts Source: BNP Paribas
Comments and charts
EGB supply is over for 2010 and our focus turns now to 2011 issuance. We expect total EGB gross issuance of EUR 827bn, down from EUR 943bn in 2010. In net supply terms, we expect a fall to EUR 311bn in 2011 from EUR 430bn in 2010. Our article “EUR: 2011 EGB Issuance Preview” in this week’s Market Mover has more details. For that reason, we do not show the standard charts on the RHS but some general charts on 2011 EGB issuance preview.
Only the end-of-month Italian auctions remain in 2010, which settle and account for 2011 issuance.
Outside the eurozone, there will be no issuance in the US in the week ahead. Only Japan will issue paper in the week ahead.
Next week's Eurozone Redemptions Date Country Details Amount
23/12 France BTF EUR 8.0bn24/12 Greece GTB (13W) EUR 0.4bnTotal Eurozone Short-term Redemption EUR 8.4bn
Next week's Eurozone Coupons Country Amount
Italy EUR 0.1bnBelgium EUR 0.7bnTotal Long-term Coupon Payments EUR 0.8bn
Next week's T-Bills Supply Date Country Issues Details
17/12 UK T-Bills Jan 2011 GBP 0.5bn T-Bills Mar 2011 GBP 1bn T-Bills Jun 2011 GBP 1.5bn 20/12 Japan T-Bills Apr 2011 JPY 4.8tn France BTF Mar 2011 EUR 3.5bn BTF Dec 2011 EUR 1.5bn US T-Bills Mar 2011 USD 29bn T-Bills Jun 2011 (new) USD 28bn FHLMC Bills 3-month & 6-month 17 Dec 21/12 Spain Letras Mar 2011 20 Dec Letras Jun 2011 20 Dec Canada T-Bill Mar 2011 CAD 7.4bn T-Bill Jun 2011 CAD 2.8bn T-Bill Dec 2011 CAD 2.8bn US T-Bills 4-week 20 Dec FHLB Discount Notes 22/12 FNMA Bills 3-month & 6-month 20 Dec 23/12 FHLB Discount Notes Sources: Treasuries, BNP Paribas
77
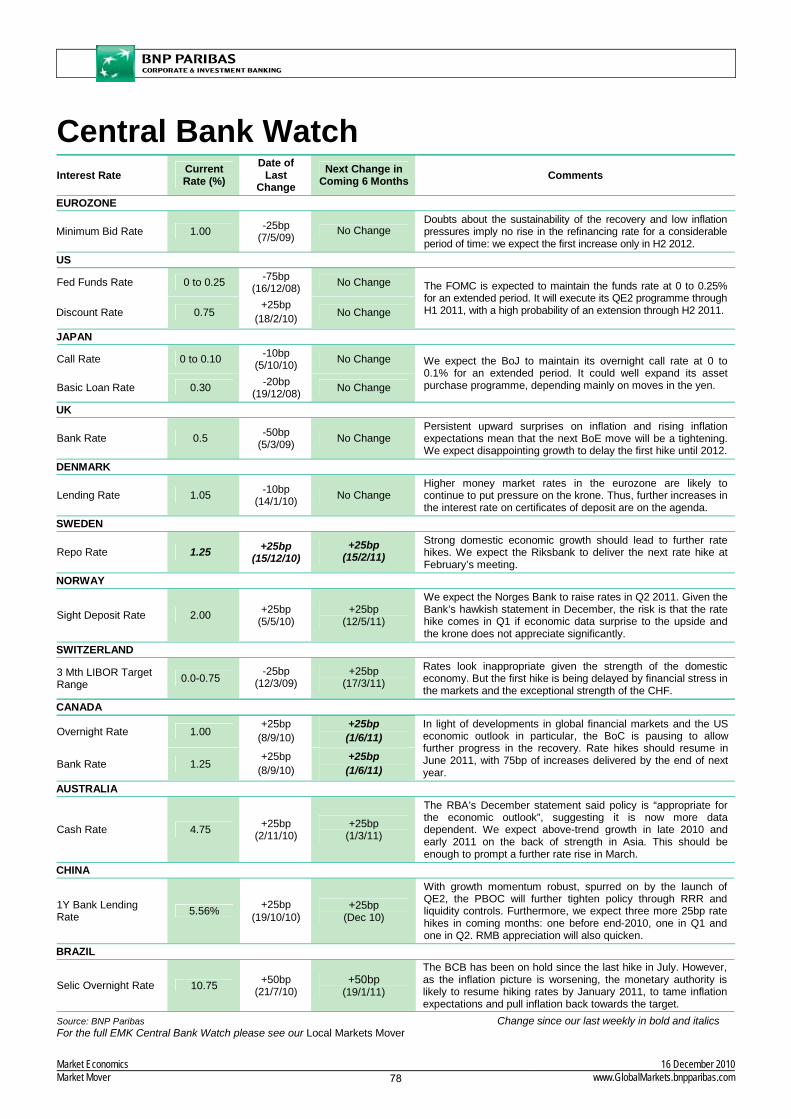
Market Economics 16 December 2010Market Mover www.GlobalMarkets.bnpparibas.com
Central Bank Watch Interest Rate Current
Rate (%) Date of
Last Change
Next Change in Coming 6 Months Comments
EUROZONE
Minimum Bid Rate 1.00 -25bp (7/5/09) No Change
Doubts about the sustainability of the recovery and low inflation pressures imply no rise in the refinancing rate for a considerable period of time: we expect the first increase only in H2 2012.
US
Fed Funds Rate 0 to 0.25 -75bp (16/12/08) No Change
Discount Rate 0.75 +25bp
(18/2/10) No Change
The FOMC is expected to maintain the funds rate at 0 to 0.25% for an extended period. It will execute its QE2 programme through H1 2011, with a high probability of an extension through H2 2011.
JAPAN
Call Rate 0 to 0.10 -10bp (5/10/10) No Change
Basic Loan Rate 0.30 -20bp (19/12/08) No Change
We expect the BoJ to maintain its overnight call rate at 0 to 0.1% for an extended period. It could well expand its asset purchase programme, depending mainly on moves in the yen.
UK
Bank Rate 0.5 -50bp (5/3/09) No Change
Persistent upward surprises on inflation and rising inflation expectations mean that the next BoE move will be a tightening. We expect disappointing growth to delay the first hike until 2012.
DENMARK
Lending Rate 1.05 -10bp (14/1/10) No Change
Higher money market rates in the eurozone are likely to continue to put pressure on the krone. Thus, further increases in the interest rate on certificates of deposit are on the agenda.
SWEDEN
Repo Rate 1.25 +25bp (15/12/10)
+25bp (15/2/11)
Strong domestic economic growth should lead to further rate hikes. We expect the Riksbank to deliver the next rate hike at February’s meeting.
NORWAY
Sight Deposit Rate 2.00 +25bp (5/5/10)
+25bp (12/5/11)
We expect the Norges Bank to raise rates in Q2 2011. Given the Bank’s hawkish statement in December, the risk is that the rate hike comes in Q1 if economic data surprise to the upside and the krone does not appreciate significantly.
SWITZERLAND
3 Mth LIBOR Target Range 0.0-0.75 -25bp
(12/3/09) +25bp
(17/3/11) Rates look inappropriate given the strength of the domestic economy. But the first hike is being delayed by financial stress in the markets and the exceptional strength of the CHF.
CANADA
Overnight Rate 1.00 +25bp
(8/9/10) +25bp (1/6/11)
Bank Rate 1.25 +25bp
(8/9/10) +25bp (1/6/11)
In light of developments in global financial markets and the US economic outlook in particular, the BoC is pausing to allow further progress in the recovery. Rate hikes should resume in June 2011, with 75bp of increases delivered by the end of next year.
AUSTRALIA
Cash Rate 4.75 +25bp (2/11/10)
+25bp (1/3/11)
The RBA’s December statement said policy is “appropriate for the economic outlook”, suggesting it is now more data dependent. We expect above-trend growth in late 2010 and early 2011 on the back of strength in Asia. This should be enough to prompt a further rate rise in March.
CHINA
1Y Bank Lending Rate 5.56% +25bp
(19/10/10) +25bp
(Dec 10)
With growth momentum robust, spurred on by the launch of QE2, the PBOC will further tighten policy through RRR and liquidity controls. Furthermore, we expect three more 25bp rate hikes in coming months: one before end-2010, one in Q1 and one in Q2. RMB appreciation will also quicken.
BRAZIL
Selic Overnight Rate 10.75 +50bp (21/7/10)
+50bp (19/1/11)
The BCB has been on hold since the last hike in July. However, as the inflation picture is worsening, the monetary authority is likely to resume hiking rates by January 2011, to tame inflation expectations and pull inflation back towards the target.
Source: BNP Paribas Change since our last weekly in bold and italics For the full EMK Central Bank Watch please see our Local Markets Mover
78

Market Economics / Interest Rate Strategy 16 December 2010Market Mover www.GlobalMarkets.bnpparibas.com
GDP(% y/y) ’09 ’10 (1) ’11 (1) Q1 Q2 Q3 Q4 (1) Q1 (1) Q2 (1) Q3 (1) Q4 (1)
US -2.6 2.8 2.4 2.4 3.0 3.2 2.6 2.2 2.4 2.5 2.5Eurozone -4.0 1.7 1.3 0.8 1.9 1.9 2.0 1.9 1.2 1.1 1.2Japan -5.2 3.6 1.4 5.0 2.7 4.4 2.6 1.4 1.4 1.0 1.9World (2) -0.6 4.7 4.1 4.8 5.0 4.8 4.4 4.1 3.9 4.0 4.2
Industrial Production(% y/y) ’09 ’10 (1) ’11 (1) Q1 Q2 Q3 Q4 (1) Q1 (1) Q2 (1) Q3 (1) Q4 (1)
US -9.3 5.5 3.0 2.7 7.4 6.6 5.3 4.2 3.0 2.4 2.5Eurozone -14.6 6.4 1.6 4.6 9.0 6.9 5.2 3.1 1.1 0.8 1.6Japan -21.9 15.0 1.2 27.4 21.0 13.4 2.6 -1.3 -1.6 1.2 6.2
Unemployment Rate(%) ’09 ’10 (1) ’11 (1) Q1 Q2 Q3 Q4 (1) Q1 (1) Q2 (1) Q3 (1) Q4 (1)
US 9.3 9.7 9.5 9.7 9.7 9.6 9.7 9.7 9.7 9.5 9.3Eurozone 9.4 10.0 10.2 9.9 10.0 10.0 10.1 10.1 10.2 10.2 10.2Japan 5.1 5.1 4.6 4.9 5.2 5.1 5.0 4.8 4.7 4.5 4.5
CPI (% y/y) ’09 ’10 (1) ’11 (1) Q1 Q2 Q3 Q4 (1) Q1 (1) Q2 (1) Q3 (1) Q4 (1)
US -0.3 1.6 1.2 2.4 1.8 1.2 1.2 1.2 1.5 1.3 0.9Eurozone 0.3 1.6 1.6 1.1 1.5 1.7 2.0 1.9 1.5 1.5 1.6Japan -1.4 -0.7 -1.0 -1.2 -0.9 -0.8 0.1 -1.0 -1.1 -0.8 -1.3
Current Account(% GDP) ’09 ’10 (1) ’11 (1) ’09 ’10 (1) ’11 (1)
US -2.7 -3.4 -3.3 US (4) -10.0 -8.9 -9.9Eurozone -0.6 -0.5 -0.2 Eurozone -6.3 -6.2 -4.7Japan 2.8 3.5 3.5 Japan -10.2 -8.2 -6.8
Interest Rate (3)
(%) ’09 ’10 (1) ’11 (1) Q1 (1) Q2 (1) Q3 (1) Q4 (1) Q1 (1) Q2 (1) Q3 (1) Q4 (1)
USFed Funds Rate 0.25 0.25 0.25 0.25 0.25 0.25 0.25 0.25 0.25 0.25 0.503-month Rate 0.25 0.30 0.30 0.30 0.30 0.30 0.30 0.30 0.45 0.75 0.902-year yield 1.14 0.60 1.00 0.50 0.75 0.85 1.00 1.10 1.50 2.15 2.4010-year yield 3.84 3.35 3.75 3.00 3.25 3.50 3.75 4.00 4.25 4.50 4.602y/10y Spread (bp) 269 275 275 250 250 265 275 290 275 235 220EurozoneRefinancing Rate 1.00 1.00 1.00 1.00 1.00 1.00 1.00 1.00 1.25 1.50 1.753-month Rate 0.70 1.05 1.35 1.20 1.25 1.30 1.35 1.50 1.75 1.75 2.002-year yield 1.37 1.00 1.50 1.00 1.20 1.30 1.50 1.70 2.05 2.30 2.4510-year yield 3.40 2.95 3.35 2.75 2.90 3.15 3.35 3.50 3.75 3.90 4.102y/10y Spread (bp) 203 195 185 175 170 185 185 180 170 160 165JapanO/N Call Rate 0.10 0.10 0.10 0.10 0.10 0.10 0.10 0.10 0.10 0.10 0.103-month Rate 0.46 0.35 0.35 0.35 0.35 0.35 0.35 0.35 0.35 0.35 0.352-year yield 0.15 0.25 0.25 0.25 0.25 0.25 0.25 0.25 0.30 0.30 0.3010-year yield 1.30 1.30 1.40 1.20 1.30 1.40 1.40 1.40 1.40 1.50 1.502y/10y Spread (bp) 115 105 115 95 105 115 115 115 110 120 120
2010
Economic Forecasts Year 2011
2011
2010
Year
Source: BNP Paribas
Year Year
Year
Interest Rate Forecasts
General Government
20122011
(% GDP)
Year
Year
Footnotes: (1) Forecast (2) Country weights used to construct world growth are those in the IMF World Economic Outlook Update
April 2010 (3) End Period (4) Fiscal year Figures are y/y percentage change unless otherwise indicated
2010 2011
20112010
79

Foreign Exchange Strategy 16 December 2010Market Mover, Non-Objective Research Section www.GlobalMarkets.bnpparibas.com
FX Forecasts* USD Bloc Q4 '10 Q1 '11 Q2 '11 Q3 '11 Q4 '11 Q1 '12 Q2 '12 Q3 '12 Q4 '12 Q1 '13 Q2 '13 EUR/USD 1.34 1.27 1.25 1.20 1.23 1.25 1.30 1.32 1.32 1.33 1.34 USD/JPY 82 85 84 88 92 95 100 110 120 119 118 USD/CHF 0.97 1.01 1.05 1.11 1.09 1.08 1.05 1.05 1.06 1.06 1.07 GBP/USD 1.61 1.55 1.51 1.46 1.45 1.52 1.55 1.57 1.61 1.66 1.70 USD/CAD 0.98 0.95 0.96 0.93 0.95 0.95 1.00 1.02 1.09 1.11 1.14 AUD/USD 1.02 1.02 0.99 0.92 0.93 0.92 0.93 0.92 0.90 0.87 0.85 NZD/USD 0.78 0.79 0.78 0.74 0.73 0.72 0.69 0.67 0.66 0.64 0.62 USD/SEK 6.90 7.09 7.04 7.58 7.56 7.36 7.08 6.89 6.89 6.99 6.94 USD/NOK 6.04 6.22 6.16 6.33 6.10 5.92 5.77 5.76 5.68 5.49 5.30 EUR Bloc Q4 '10 Q1 '11 Q2 '11 Q3 '11 Q4 '11 Q1 '12 Q2 '12 Q3 '12 Q4 '12 Q1 '13 Q2 '13 EUR/JPY 110 108 105 106 113 119 130 145 158 158 158 EUR/GBP 0.83 0.82 0.83 0.82 0.85 0.82 0.84 0.84 0.82 0.80 0.79 EUR/CHF 1.30 1.28 1.31 1.33 1.34 1.35 1.36 1.38 1.40 1.41 1.44 EUR/SEK 9.25 9.00 8.80 9.10 9.30 9.20 9.20 9.10 9.10 9.30 9.30 EUR/NOK 8.10 7.90 7.70 7.60 7.50 7.40 7.50 7.60 7.50 7.30 7.10 EUR/DKK 7.46 7.46 7.46 7.46 7.46 7.46 7.46 7.46 7.46 7.46 7.46 Central Europe Q4 '10 Q1 '11 Q2 '11 Q3 '11 Q4 '11 Q1 '12 Q2 '12 Q3 '12 Q4 '12 Q1 '13 Q2 '13 USD/PLN 2.87 3.07 3.16 3.25 3.09 3.12 2.96 2.88 2.84 2.78 2.69 EUR/CZK 24.4 24.7 24.5 24.3 24.5 24.3 24.0 23.9 23.8 24.0 23.8 EUR/HUF 280 290 285 280 275 270 270 270 265 260 255 USD/ZAR 6.90 7.30 7.50 7.40 7.30 7.40 7.30 7.30 7.50 7.20 7.10 USD/TRY 1.43 1.50 1.52 1.48 1.47 1.49 1.46 1.47 1.46 1.45 1.43 EUR/RON 4.30 4.35 4.50 4.50 4.40 4.20 4.30 4.20 4.20 4.20 4.20 USD/RUB 32.00 32.10 31.46 31.65 30.81 30.11 29.07 28.85 28.41 27.86 27.32 EUR/PLN 3.85 3.90 3.95 3.90 3.80 3.90 3.85 3.80 3.75 3.70 3.60 USD/UAH 8.0 7.9 7.9 7.8 7.8 7.5 7.5 7.5 7.5 7.5 7.5 EUR/RSD 110 105 115 105 100 98 97 96 95 93 92 Asia Bloc Q4 '10 Q1 '11 Q2 '11 Q3 '11 Q4 '11 Q1 '12 Q2 '12 Q3 '12 Q4 '12 Q1 '13 Q2 '13 USD/SGD 1.30 1.29 1.28 1.27 1.26 1.25 1.24 1.23 1.22 1.21 1.20 USD/MYR 3.10 3.05 3.00 2.95 2.90 2.87 2.85 2.83 2.80 2.77 2.75 USD/IDR 8800 8600 8400 8300 8200 8100 8000 7900 7800 7800 7800 USD/THB 30.00 29.50 29.00 28.70 28.50 28.30 28.00 27.70 27.50 27.50 27.50 USD/PHP 43.00 42.50 42.00 41.50 41.00 40.50 40.00 39.50 39.00 39.00 39.00 USD/HKD 7.80 7.80 7.80 7.80 7.80 7.80 7.80 7.80 7.80 7.80 7.80 USD/RMB 6.65 6.58 6.52 6.49 6.45 6.40 6.35 6.30 6.26 6.23 6.20 USD/TWD 30.00 29.70 29.40 29.00 28.70 28.50 28.30 28.00 28.00 28.00 28.00 USD/KRW 1100 1080 1060 1050 1040 1030 1020 1010 1000 1000 1000 USD/INR 44.00 43.50 43.00 42.50 42.00 41.50 41.00 40.50 40.00 40.00 40.00 USD/VND 20500 20500 20500 20500 20500 20500 20500 20500 20500 20500 20500 LATAM Bloc Q4 '10 Q1 '11 Q2 '11 Q3 '11 Q4 '11 Q1 '12 Q2 '12 Q3 '12 Q4 '12 Q1 '13 Q2 '13 USD/ARS 3.98 4.05 4.13 4.20 4.28 4.36 4.44 4.52 4.60 4.68 4.75 USD/BRL 1.70 1.68 1.66 1.65 1.63 1.63 1.65 1.67 1.70 1.71 1.73 USD/CLP 480 473 467 463 458 460 462 465 471 473 475 USD/MXN 12.30 12.00 11.70 11.45 11.30 11.30 11.50 11.80 12.00 12.08 12.15 USD/COP 1830 1800 1750 1720 1700 1705 1730 1745 1760 1770 1780 USD/VEF (Priority) (1) 2.59 2.59 2.59 2.59 2.59 2.59 2.59 2.59 2.59 5.30 5.30 USD/VEF (Oil) (1) 4.29 4.29 4.29 4.29 4.29 4.29 4.29 4.29 4.29 8.80 8.80 Others Q4 '10 Q1 '11 Q2 '11 Q3 '11 Q4 '11 Q1 '12 Q2 '12 Q3 '12 Q4 '12 Q1 '13 Q2 '13 USD Index 78.79 82.04 83.11 86.11 85.63 84.56 83.26 83.51 84.81 84.22 83.77
*End Quarter
(1) Following the devaluation of the VEF, there is now an official ‘priority’ exchange rate and a so-called ‘oil’ exchange rate used for certain transactions Source: BNP Paribas
80

Market Coverage Market Economics Paul Mortimer-Lee Global Head of Market Economics London 44 20 7595 8551 [email protected] Ken Wattret Chief Eurozone Market Economist London 44 20 7595 8657 [email protected] Luigi Speranza Head of Inflation Economics, Eurozone, Italy London 44 20 7595 8322 [email protected] Alan Clarke UK London 44 20 7595 8476 [email protected] Eoin O’Callaghan Inflation, Eurozone, Switzerland, Ireland London 44 20 7595 8226 [email protected] Gizem Kara Scandinavia London 44 20 7595 8783 [email protected] Dominique Barbet Eurozone, France Paris 33 1 4298 1567 [email protected] Julia Coronado Chief US Economist New York 1 212 841 2281 [email protected] Yelena Shulyatyeva US, Canada New York 1 212 841 2258 [email protected] Dwyer US, Canada New York 1 212 471-7996 [email protected] Ryutaro Kono Chief Economist Japan Tokyo 81 3 6377 1601 [email protected] Hiroshi Shiraishi Japan Tokyo 81 3 6377 1602 [email protected] Azusa Kato Japan Tokyo 81 3 6377 1603 [email protected] Makiko Fukuda Japan Tokyo 81 3 6377 1605 [email protected] Richard Iley Head of Asia Economics Hong Kong 852 2108 5104 [email protected] Dominic Bryant Asia, Australia Hong Kong 852 2108 5105 [email protected] Mole Hau Asia Hong Kong 852 2108 5620 [email protected] Xingdong Chen Chief China Economist Beijing 86 10 6561 1118 [email protected] Isaac Y Meng China Beijing 86 10 6561 1118 [email protected] Chan Kok Peng Chief Economist South East Asia Singapore 65 6210 1946 [email protected] Marcelo Carvalho Head of Latin American Economics São Paulo 55 11 3841 3418 [email protected] Italo Lombardi Latin America New York 1 212 841 6599 [email protected] Florencia Vazquez Latin American Economist Buenos Aires 54 11 4875 4363 [email protected] Michal Dybula Central & Eastern Europe Warsaw 48 22 697 2354 [email protected] Julia Tsepliaeva Russia & CIS Moscow 74 95 785 6022 [email protected] Interest Rate Strategy Cyril Beuzit Global Head of Interest Rate Strategy London 44 20 7595 8639 [email protected] Patrick Jacq Europe Strategist Paris 33 1 4316 9718 [email protected] Hervé Cros Chief Inflation Strategist London 44 20 7595 8419 [email protected] Shahid Ladha Inflation Strategist London 44 20 7 595 8573 [email protected] Alessandro Tentori Chief Alpha Strategy Europe London 44 20 7595 8238 [email protected] Eric Oynoyan Europe Alpha Strategist London 44 20 7595 8613 [email protected] Matteo Regesta Europe Alpha Strategist London 44 20 7595 8607 [email protected] Ioannis Sokos Europe Alpha Strategist London 44 20 7595 8671 [email protected] Camille de Courcel Europe Alpha Strategist London 44 20 7595 8295 [email protected] Bülent Baygün Head of Interest Rate Strategy US New York 1 212 471 8043 [email protected] Mary-Beth Fisher US Senior Strategist New York 1 212 841 2912 [email protected] Sergey Bondarchuk US Strategist New York 1 212 841 2026 [email protected] Prakash US Strategist New York 1 917 472 4374 [email protected] Rohit Garg US Strategist New York 1212 841 3937 [email protected] Anish Lohokare MBS Strategist New York 1 212 841 2867 [email protected] Olurotimi Ajibola MBS Strategist New York 1 212 8413831 [email protected] Koji Shimamoto Head of Interest Rate Strategy Japan Tokyo 81 3 6377 1700 [email protected] Tomohisa Fujiki Japan Strategist Tokyo 81 3 6377 1703 [email protected] Masahiro Kikuchi Japan Strategist Tokyo 81 3 6377 1703 [email protected] Christian Séné Technical Analyst Paris 33 1 4316 9717 christian.séné@bnpparibas.com FX Strategy Hans Redeker Global Head of FX Strategy London 44 20 7595 8086 [email protected] Ian Stannard FX Strategist London 44 20 7595 8086 [email protected] James Hellawell Quantitative Strategist London 44 20 7595 8485 [email protected] Kiran Kowshik FX Strategist Singapore 65 6210 3264 [email protected] Mary Nicola FX Strategist New York 1 212 841 2492 [email protected] Andy Chaveriat Technical Analyst New York 1 212 841 2408 [email protected] Emerging Markets FX & Interest Rate Strategy Drew Brick Head of FX & IR Strategy Asia Singapore 65 6210 3262 [email protected] Chin Loo Thio FX & IR Asia Strategist Singapore 65 6210 3263 [email protected] Robert Ryan FX & IR Asia Strategist Singapore 65 6210 3314 [email protected] Jasmine Poh FX & IR Asia Strategist Singapore 65 6210 3418 [email protected] Gao Qi FX & IR Asia Strategist Shanghai 86 21 2896 2876 [email protected] Bartosz Pawlowski Head of FX & IR Strategy CEEMEA London 44 20 7595 8195 [email protected] Elisabeth Gruié FX & IR CEEMEA Strategist London 44 20 7595 8492 [email protected] Diego Donadio FX & IR Latin America Strategist São Paulo 55 11 3841 3421 diego.donadio@@br.bnpparibas.com
81

For Production and Distribution, please contact: Ann Aston, Market Economics, London. Tel: 44 20 7595 8503 Email: [email protected], Danielle Catananzi, Interest Rate Strategy, London. Tel: 44 20 7595 4418 Email: 1 [email protected], Derek Allassani, FX Strategy, London. Tel: 44 20 7595 8486 Email: 2 [email protected], Martine Borde, Market Economics/Interest Rate Strategy, Paris. Tel: 33 1 4298 4144 Email 3 [email protected] Editors: Amanda Grantham-Hill, Interest Rate Strategy/Market Economics, London. Tel: 44 20 7595 4107 Email: 4 [email protected]; Nick Ashwell, FX/Market Economics, London. Tel: 44 20 7595 4120 Email: 5 [email protected]
BNP Paribas Global Fixed Income Website 6 Hwww.globalmarkets.bnpparibas.com
Bloomberg Fixed Income Research BPCM Market Economics BPEC Interest Rate Strategy BPBS Forex Strategy BPFR
RESEARCH DISCLAIMERS:
IMPORTANT DISCLOSURES: Please see important disclosures in the text of this report.
Some sections of this report have been written by our strategy teams. These sections are clearly labelled and do not purport to be an exhaustive analysis,and may be subject to conflicts of interest resulting from their interaction with sales and trading which could affect the objectivity of this report. (Please see further important disclosures in the text of this report). These sections are a marketing communication. They are not independent investmentresearch. They have not been prepared in accordance with legal requirements designed to provide the independence of investment research, and are not subject to any prohibition on dealing ahead of the dissemination of investment research.
The information and opinions contained in this report have been obtained from, or are based on, public sources believed to be reliable, but no representation or warranty, express or implied, is made that such information is accurate, complete or up to date and it should not be relied upon as such.This report does not constitute an offer or solicitation to buy or sell any securities or other investment. Information and opinions contained in the report arepublished for the assistance of recipients, but are not to be relied upon as authoritative or taken in substitution for the exercise of judgement by anyrecipient, are subject to change without notice and not intended to provide the sole basis of any evaluation of the instruments discussed herein. Anyreference to past performance should not be taken as an indication of future performance. To the fullest extent permitted by law, no BNP Paribas group company accepts any liability whatsoever (including in negligence) for any direct or consequential loss arising from any use of or reliance on materialcontained in this report. All estimates and opinions included in this report are made as of the date of this report. Unless otherwise indicated in this reportthere is no intention to update this report. BNP Paribas SA and its affiliates (collectively “BNP Paribas”) may make a market in, or may, as principal oragent, buy or sell securities of any issuer or person mentioned in this report or derivatives thereon. BNP Paribas may have a financial interest in anyissuer or person mentioned in this report, including a long or short position in their securities and/or options, futures or other derivative instruments based thereon, or vice versa. BNP Paribas, including its officers and employees may serve or have served as an officer, director or in an advisory capacity forany person mentioned in this report. BNP Paribas may, from time to time, solicit, perform or have performed investment banking, underwriting or otherservices (including acting as adviser, manager, underwriter or lender) within the last 12 months for any person referred to in this report. BNP Paribas maybe a party to an agreement with any person relating to the production of this report. BNP Paribas, may to the extent permitted by law, have acted upon orused the information contained herein, or the research or analysis on which it was based, before its publication. BNP Paribas may receive or intend to seek compensation for investment banking services in the next three months from or in relation to any person mentioned in this report. Any personmentioned in this report may have been provided with sections of this report prior to its publication in order to verify its factual accuracy.
BNP Paribas is incorporated in France with limited liability. Registered Office 16 Boulevard des Italiens, 75009 Paris. This report was produced by a BNP Paribas group company. This report is for the use of intended recipients and may not be reproduced (in whole or in part) or delivered or transmitted to anyother person without the prior written consent of BNP Paribas. By accepting this document you agree to be bound by the foregoing limitations.
Certain countries within the European Economic Area: This report is solely prepared for professional clients. It is not intended for retail clients and should not be passed on to any such persons.
This report has been approved for publication in the United Kingdom by BNP Paribas London Branch. BNP Paribas London Branch is authorised by CECEI and AMF and authorised and subject to limited regulation by the Financial Services Authority. Details of the extent of our authorisation andregulation by the Financial Services Authority are available from us on request.
This report has been approved for publication in France by BNP Paribas, a credit institution licensed as an investment services provider by the CECEIand the AMF, whose head office is 16, Boulevard des Italiens 75009 Paris, France.
This report is being distributed in Germany either by BNP Paribas London Branch or by BNP Paribas Niederlassung Frankfurt am Main, regulated by theBundesanstalt für Finanzdienstleistungsaufsicht (BaFin). United States: This report is being distributed to US persons by BNP Paribas Securities Corp., or by a subsidiary or affiliate of BNP Paribas that is notregistered as a US broker-dealer to US major institutional investors only. BNP Paribas Securities Corp., a subsidiary of BNP Paribas, is a broker-dealer registered with the Securities and Exchange Commission and a member of the National Association of Securities Dealers, the New York Stock Exchangeand other principal exchanges. BNP Paribas Securities Corp. accepts responsibility for the content of a report prepared by another non-US affiliate only when distributed to US persons by BNP Paribas Securities Corp.
Japan: This report is being distributed to Japanese based firms by BNP Paribas Securities (Japan) Limited, Tokyo Branch, or by a subsidiary or affiliate of BNP Paribas not registered as a financial instruments firm in Japan, to certain financial institutions defined by article 17-3, item 1 of the Financial Instruments and Exchange Law Enforcement Order. BNP Paribas Securities (Japan) Limited, Tokyo Branch, a subsidiary of BNP Paribas, is a financialinstruments firm registered according to the Financial Instruments and Exchange Law of Japan and a member of the Japan Securities DealersAssociation. BNP Paribas Securities (Japan) Limited, Tokyo Branch accepts responsibility for the content of a report prepared by another non-Japan affiliate only when distributed to Japanese based firms by BNP Paribas Securities (Japan) Limited, Tokyo Branch. Some of the foreign securities stated on this report are not disclosed according to the Financial Instruments and Exchange Law of Japan.
Hong Kong: This report is being distributed in Hong Kong by BNP Paribas Hong Kong Branch, a branch of BNP Paribas whose head office is in Paris, France. BNP Paribas Hong Kong Branch is regulated as a Registered Institution by Hong Kong Monetary Authority for the conduct of Advising onSecurities [Regulated Activity Type 4] under the Securities and Futures Ordinance. © BNP Paribas (2010). All rights reserved.