european biomass industry association eu biomass industry: targets & directives from the ec, on...
TRANSCRIPT
European Biomass Industry AssociationEuropean Biomass Industry Association
EU Biomass Industry: Targets & Directives from the EC, on R.E.
Technology, Business Opportunities and Market Challenges
Mr. Giuliano GrassiSecretary General,
European Biomass Industry Association (EUBIA)
27 April 2010 BIOMASS STAKEHOLDERS FORUM
European Biomass Industry AssociationEuropean Biomass Industry Association
Biomass process technologies business technologies
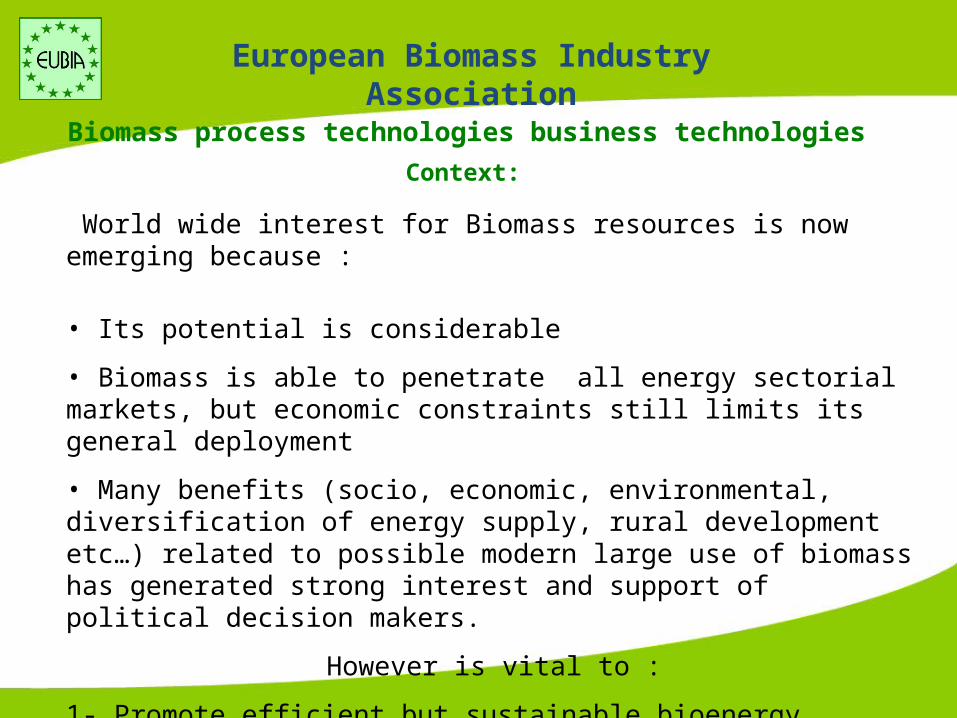
World wide interest for Biomass resources is now emerging because :
• Its potential is considerable
• Biomass is able to penetrate all energy sectorial markets, but economic constraints still limits its general deployment
• Many benefits (socio, economic, environmental, diversification of energy supply, rural development etc…) related to possible modern large use of biomass has generated strong interest and support of political decision makers.
However is vital to :
1- Promote efficient but sustainable bioenergy schemes
2. Plan Large Investments
Context:

European Biomass Industry AssociationEuropean Biomass Industry Association
Worldwide biomass resources
• World biomass production:- Terrestrial: ~ 80 B TOE/y- Acquatic: ~ 20 B TOE/y
• Worldwide biomass stock: ~ 370 B TOE/y
• Estimation of world biomass potential (year 2100): - Biomass potential: ~ 6.6 B TOE/y - Ultimate future potential (max): ~ 28.3 B TOE/y
• Total Energy consumption (2000): ~ 9.9 B TOE/a•Total electricity consumption (2040): ~ 37000 TWh
B TOE: Billion of Tonnes Oil Equivalent (1 TOE ~ 2,4 t dry biomass)
• Total nuclear energy supply in year 2000: 638 MTOE/y in year 2020: 690 MTOE/y

European Biomass Industry AssociationEuropean Biomass Industry Association
European biomass resources
• Biomass potential (2050)- UE-15 ~ 500 M TOE/y- UE-27 ~ 600 M TOE/y
• EU guideline regarding biomass use:- for 2010 ~ 135 M TOE/y- for 2020 ~ 220 M TOE/y•EEA (2030 estimated potential) ~ 300 MTO/y
• Current consumption (EU-15; 2001):- Primary energy: ~ 1486 M TOE/y- Biomass: ~ 57 M TOE/y
M TOE: Million of Tonnes Oil Equivalent (1 TOE ~ 2,4 t dry biomass)
(3.8%)

European Biomass Industry AssociationEuropean Biomass Industry Association
Conflicts and lands for food / bioenergy production
• From preliminary evaluations it seems that risk of conflicts for land use will arise in general only when the rate of contribution of bioenergy to the > 30%
• Total worldwide cropland is in fact ~ 2 billion ha. Present utilization is ~ 750 mio ha, but should increase to ~ 1 050 billion ha (in year 2025) for the population increase, living thus 0.95 billion ha for potential bioenergy production (~ 5 billion TOE/y) based on present knowledge and practice.
•However, modern molecular biotechnology could change this present limitations, modifying the metabolism of dedicated energy crops and increasing the photosynthetic efficiency of crops (rather modest now : 2-2.5 % for good crops : like sugar-cane, sweet-sorghum, etc …)
•Use of most agriculture residues (~ 80% of total) should be promoted because emerging technology for its stabilization & modern use is now appearing on the market (agro-pellets)

European Biomass Industry AssociationEuropean Biomass Industry Association
Water resources on the globeWater availability is an important constraint:
(1kg of dry biomass requires 200-1,000 kg of water!)105
2837
17 20
510
3 6 4
0
20
40
60
80
100
120
South America North America Africa Asia Europe
1950 2000
x 10
00 c
ubic
met
er /
per
son
European Biomass Industry AssociationEuropean Biomass Industry Association
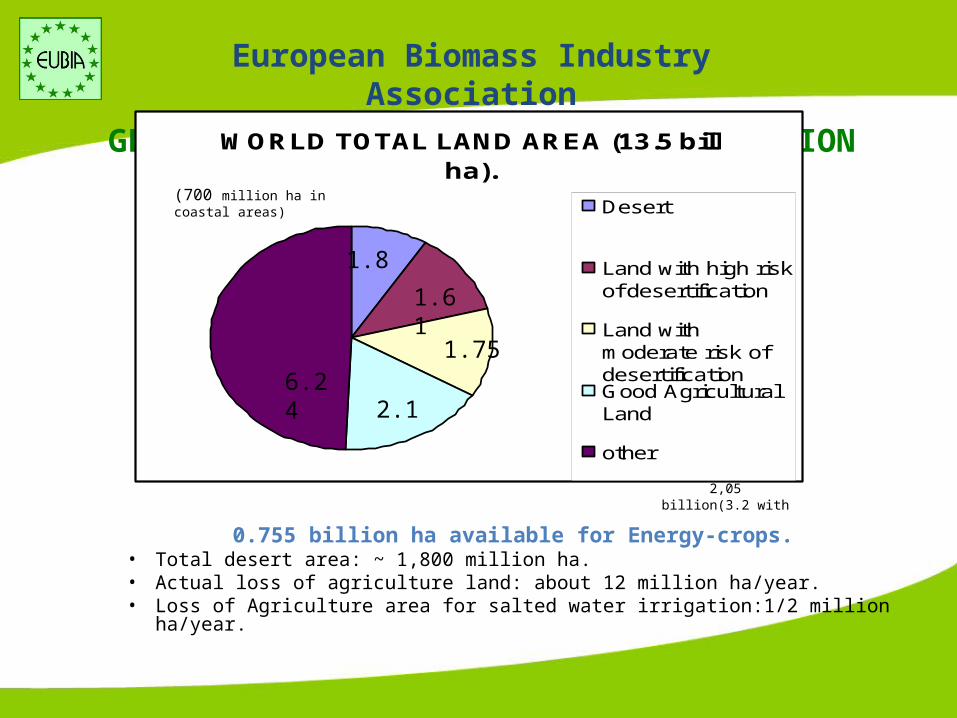
GLOBAL VULNERABILITY TO DESERTIFICATION
0.755 billion ha available for Energy-crops.• Total desert area: ~ 1,800 million ha.• Actual loss of agriculture land: about 12 million ha/year.• Loss of Agriculture area for salted water irrigation:1/2 million ha/year.
WORLD TOTAL LAND AREA (13.5 bill ha).
Desert
Land with high riskof desertification
Land withmoderate risk ofdesertificationGood AgriculturalLand
other
1.8
6.242.1
1.75
1.61
(700 million ha in coastal areas)
2,05 billion(3.2 with
European Biomass Industry AssociationEuropean Biomass Industry Association
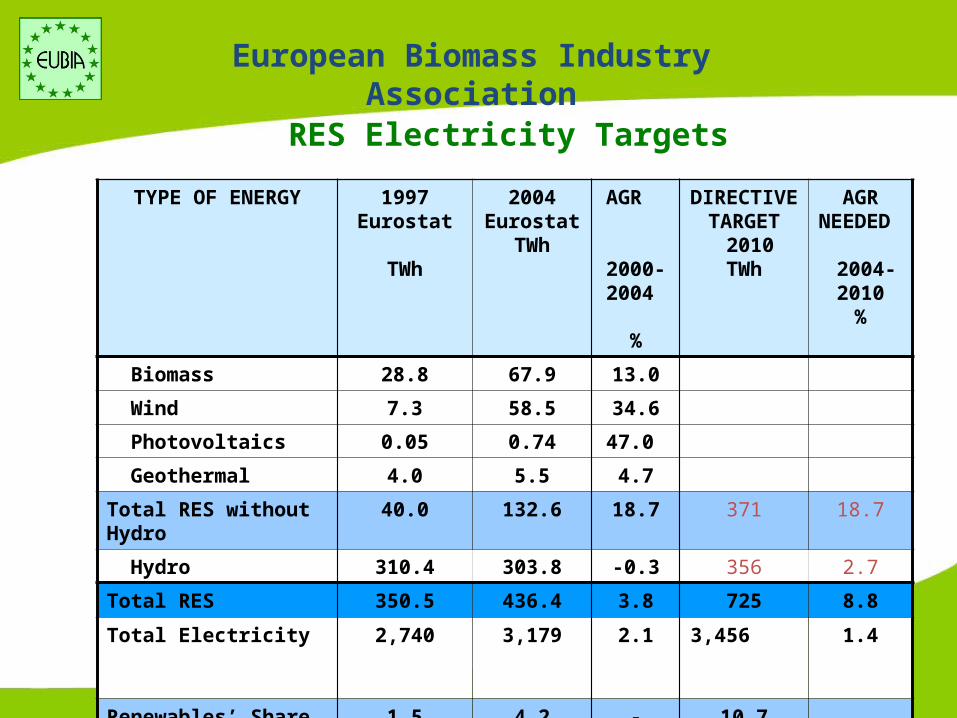
RES Electricity Targets
TYPE OF ENERGY 1997 Eurostat
TWh
2004Eurostat
TWh
AGR
2000-2004
%
DIRECTIVE TARGET
2010TWh
AGRNEEDED
2004-2010
%
Biomass 28.8 67.9 13.0
Wind 7.3 58.5 34.6
Photovoltaics 0.05 0.74 47.0
Geothermal 4.0 5.5 4.7
Total RES without Hydro 40.0 132.6 18.7 371 18.7
Hydro 310.4 303.8 -0.3 356 2.7
Total RES 350.5 436.4 3.8 725 8.8
Total Electricity 2,740 3,179 2.1 3,456
1.4
Renewables’ Share Without Hydro%
1.5 4.2 - 10.7
Renewables’ Share % 12.3 13.7 - 21

European Biomass Industry AssociationEuropean Biomass Industry Association
Biofuels Targets
2000 Eurostat
2004Eurostat
AGR2000-2004
DIRECTIVE TARGET
2010
AGRNEEDED
2004-2010
Mtoe Mtoe % Mtoe %
Biofuels 0.63 2.1 35.1 18.0 43.0
Gasoline and oil demand
277.3 290 1.1 313 1.3
Biofuels’ Share % 0.2 0.72 - 5.75

European Biomass Industry AssociationEuropean Biomass Industry Association
Contribution of Renewables to Heat Production (1995-2020)
2004Eurostat
Mtoe
2010Projections
Mtoe
2020Projections
Mtoe
Biomass 48.4 65 105
Solar thermal 0.68 2 12
Geothermal 1.5 4 8
TOTAL RES HEAT 50.6 81 125
Total Heat Generation (Trends to 2030) 440 467 488
Share of RES 11.5% 17.3% 25.6%

European Biomass Industry AssociationEuropean Biomass Industry Association
Contribution of Renewables to Transport Fuel Production
2000 Eurostat 2004Eurostat
Projection 2010
Projection 2020
Mtoe Mtoe Mtoe Mtoe
Biofuels 0.63 2.1 18.0 40.0
Gasoline and oil demand(Trends to 2030-Baseline)(Combined RES and EE)
277.3290 313
311.5332312
Biofuels’ Share % 0.2 0.72 5.75 12.0-12.8

European Biomass Industry AssociationEuropean Biomass Industry Association
Contribution of RES to Primary Energy Production Eurostat Convention (Mtoe)
2004 TARGETS 2010 TARGETS 2020
TYPE OF ENERGY Eurostat Convention
% of
Total
Eurostat Convention
% of Total
Eurostat Convention
%of total
Total Gross Inland Consumption
1,747 1,761(Combined
RES and EE)
1,633(Combined
RES and EE)
Wind 5.03 0.29 15.4 0.87 43.9 1.69
Hydro 26.13 1.50 30.6 1.74 33 2.02
Photovoltaics 0.06 0.8 0.05 5.3 0.32
Biomass 71.9 4.11 125 7.10 235 14.4
Geothermal 5.36 0.31 8.2 0.46 16.4 1.00
Solar Thermal 0.68 0.04 2 0.11 12 0.73
Solar Power 0 0.2 0.01 0.8 0.05
Ocean 0.25 0.01 1.3 0.08
Total Renewable Energies
109.16 6.25 182.4 10.4 348 21.3

European Biomass Industry AssociationEuropean Biomass Industry Association
EU-25 RE Contribution
Year 2002 Biomass 65 MToe
Hydro 25 MToe
Wind 4 MToe
Geothermal 4 MToe
TOTAL 98 MToe/y
White paper targets for EU-15 = 135 MTOE/y (in 2010)
Adjusted paper targets for EU-25 = 150 MTOE/y (in 2010)
Current Trend : 75-80 MTOE/y (in 2010)
Biomass is lagging behind other RE with risk of missing the 2010 targets

European Biomass Industry AssociationEuropean Biomass Industry Association
Renewable Energy Roadmap by the European Commission
• 20 % binding overall RES target for EU by 2020
• 20% of CO2 emission reduction
• 20% energy saving

European Biomass Industry AssociationEuropean Biomass Industry Association

European Biomass Industry AssociationEuropean Biomass Industry Association
Targets:
Horizon References EU RES TargetEU RES - E
Target EU RES - H Target EU RES - T Target
2010
White Paper (1997) RES E Directive (2001) RES T Directive (2003)
12% non binding (*)
21% non binding (**) - 5,75% (**)
2020 New RES Directive 200920% binding
(*)34% non binding
(***)18% non binding
(***)at least 10% in
each MS
Source: Tractebel / GDF Suez

European Biomass Industry AssociationEuropean Biomass Industry Association

European Biomass Industry AssociationEuropean Biomass Industry Association

European Biomass Industry AssociationEuropean Biomass Industry Association

European Biomass Industry AssociationEuropean Biomass Industry Association

European Biomass Industry AssociationEuropean Biomass Industry Association

European Biomass Industry AssociationEuropean Biomass Industry Association
European Biomass Industry AssociationEuropean Biomass Industry Association
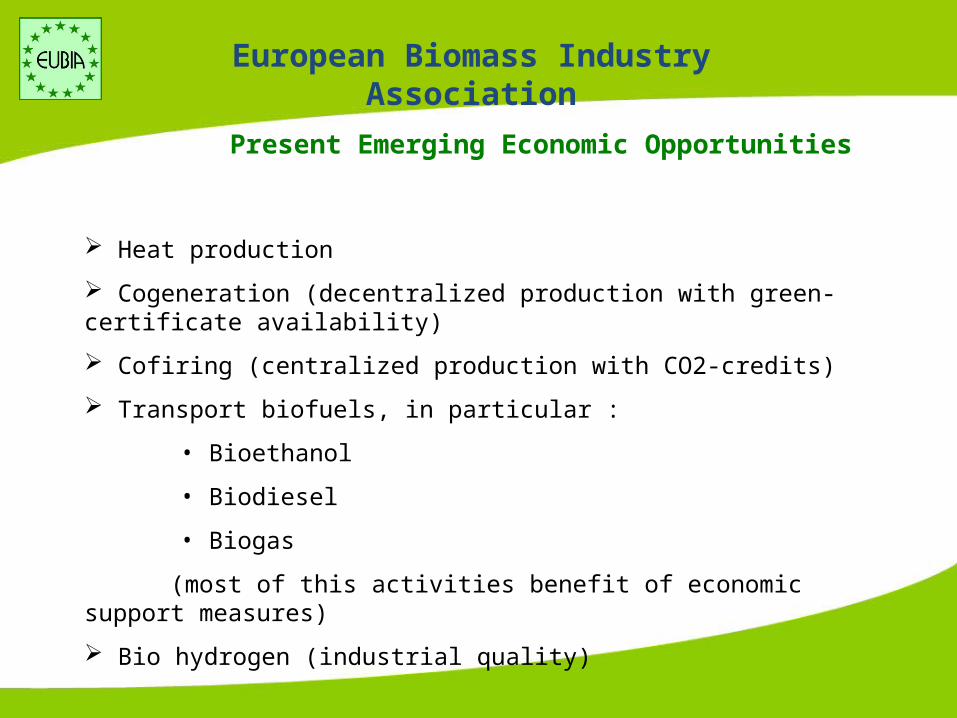
Present Emerging Economic Opportunities
Heat production
Cogeneration (decentralized production with green-certificate availability)
Cofiring (centralized production with CO2-credits)
Transport biofuels, in particular :
• Bioethanol
• Biodiesel
• Biogas
(most of this activities benefit of economic support measures)
Bio hydrogen (industrial quality)

European Biomass Industry AssociationEuropean Biomass Industry Association
Future Economic Opportunities for Bioenergy
Assuming an import price for :
• Oil = 70 $/bbl*
• Natural Gas = 250 €/ 1.000 m3 (300 €/TOE)
The level of competitiveness for biofuels is around :
~ 50 €/dryt (solid biomass)
~ 450 €/TOE (liquid biofuels for transport)
* A price of ~ 100 $/bbl could become a reality around the year 2030

European Biomass Industry AssociationEuropean Biomass Industry Association
World CO2 Emissions from different sectors (IEA).
TOTAL 2005 = ~ 22 Bill ton CO2/y. 2010 = ~ 30 Bill ton CO2/y. 2020 = ~ 38 Bill ton CO2/y. 2030 = ~ 44 Bill ton CO2/y.

European Biomass Industry AssociationEuropean Biomass Industry Association
Stationary Plants with high CO2 Emissions
• Cement Factories: ~ tCO2 /tCement (i bill t cement/y).
• Steel Factories:~ 3tCO2 /tsteel (1.2 bill steel/y).
• Power Plants (coal): ~ 1kg CO2 / KWhe (18000 bill Kwhe/y).
• Oil Refineries: ~ 0.5 tCO2/t oil (3.5 bill t/y).

European Biomass Industry AssociationEuropean Biomass Industry Association
Mitigation of CO2 EmissionsI. Efficiency Improvement: processing & use;
II. CO2 storage, but is an expensive solution :
(i.e. 100% increase of electricity production in conventional coal power-plants~ 17% of electricity loss).
(~ 300-400€/tCO2 avoided in transport).
III. Deployment of R.E.;
Solar-wind Hydro-Biomass.
Modern Biomass will play a crytical rôle: already is providing a good contribution having increased its acquatic-terrestrial carbon sink (due to the CO2 fertilisation effects) reducing thus ,its accumulation level into the atmosphere from ~ 22 Bill ton/y to ~ 12 Bill t/y.
In Future large-scale vegetation in marginal lands and surplus agric.lands for production & substitution of modern biofuels to fossil-fuels.
NOTE: An area of ~ 400 million ha of land cultivated by well selected C-4 crops could be able to
absorb the CO2 annual increase in the atmosphere .

European Biomass Industry AssociationEuropean Biomass Industry Association
Thank you for your attention!
EUBIARue d’Arlon, 63-65, B-1040 Brussels, Belgium
[email protected]; www.eubia.org
Mr. Giuliano Grassi - Secretary General
European Biomass Industry Association (EUBIA)