european custom procedure trays markets m16f-54€¦ · cardiology 2-1 cataract 2-1 ... sterile...
TRANSCRIPT

European Custom Procedure Trays Markets
M16F-54

#M16F-54 © 2007 Frost & Sullivan www.frost.com August 2007
Publications Division – Terms and Conditions of Business
1. Frost & Sullivan takes no responsibility for any incorrect information supplied by manufacturers or users.
Quantitative market information is based primarily on interviews and therefore is subject to fluctuation.
2. Frost & Sullivan reports are limited publications containing valuable market information provided to a select
group of customers in response to orders. Our customers acknowledge when ordering that Frost & Sullivan
reports are for our customers’ internal use and not for general publication or disclosure to third parties.
3. No part of any Frost & Sullivan report may be given, lent, resold, or disclosed to third parties without written
permission. Third parties include subsidiary companies, other legal entities, customers, suppliers or any other
organisation or associate of the purchasing company.
4. Furthermore, the report in full or in part may not be reproduced, stored in a retrieval system, or transmitted in
any form or by any means, electronic, mechanical, photocopying, recording, or otherwise, without the
permission of the publisher or where covered by a corporate licence agreement or where sold under the terms of
a Frost & Sullivan Online contract.
5. Payment is due upon receipt of invoice.
6. Prices quoted verbally or in writing are valid for thirty days. Invoices must be paid in the currency quoted and
shown on the invoice.
7. Standard delivery time is 14 days from date of receipt of an official purchase order.
8. Draft (pre-press) reports are sold prior to checking and editing and are therefore subject to later correction.
Orders for draft reports will be invoiced with delivery of the draft report. Draft reports must be returned to the
address below on receipt of the final copy.
9. Extra copies of a report are available for $500 if ordered together with the initial copy. Usage and distribution
of extra report copies are subject to the same terms and conditions as the initial report. Corporate and Online
licences which allow worldwide use of multiple copies of reports and unlimited distribution within one
organisation are available.
For further information, write to:
European Sales Manager
Frost & Sullivan Ltd
4 Grosvenor Gardens
London
SW1W 0AH

#M16F-54 © 2007 Frost & Sullivan www.frost.com August 2007 iii
Table of Contents
C h a p t e r 1
Executive Summary
Summary 1-1
Executive Summary of the European Custom Procedure Trays Market 1-1
C h a p t e r 2
Glossary of Terms
Definition of terms 2-1
Procedure Definition 2-1
Cardiology 2-1
Cataract 2-1
Coronary Angiography 2-1
Coronary Artery Bypass Graft (CABG) 2-1
Custom Procedure Tray (CPT) 2-2
Customer Adapted Set (CAS) 2-2
Diagnosis Related Groups (DRGs) 2-2
Minimally Invasive Surgery 2-2
Non-wovens 2-2
Obstetrics 2-2
Percutaneous Transluminal Coronary Angioplasty (PTCA) 2-3
Reusable Product 2-3
Single-use Product 2-3
Sterile Field 2-3
Sterilisation 2-3

#M16F-54 © 2007 Frost & Sullivan www.frost.com August 2007 iv
C h a p t e r 3
Industry Challenges
Identification of Challenges Facing the European Custom Procedure Trays Market 3-1
Industry Challenges 3-1
Issues on Effective Supply Chain Management 3-2
Increasing Product Awareness 3-2
Customized Sourcing 3-2
Dedicated Sales and Marketing Channel 3-3
C h a p t e r 4
European Custom Procedure Trays Market
European CPT Market 4-1
Market Overview 4-1
Market Engineering Measurements 4-3
Market Drivers 4-3
Increased Emphasis on Infection Control Measures 4-4
Reduction in Procurement Costs and Time 4-4
Product Bundling 4-5
Benefits of Customization 4-5
Improved Clinical and Staff Efficiency 4-5
Government Regulations to Advance Single Use Products 4-5
Constant Rise in the Number of Surgeries 4-6
Cost Control Model 4-6
Market Restraints 4-6
Pricing Pressure 4-7
Growth of New Procedures 4-7
Brand Allegiance 4-7
Lack of Standardization Amongst Geographical Regions 4-8
Customer Perception 4-8
Long-term Contracts for Medical Device Components 4-8
Market Forecasts 4-8
Pricing Trends 4-10

#M16F-54 © 2007 Frost & Sullivan www.frost.com August 2007 v
Trends by Geographic Region 4-11
Trends by Product Type 4-12
Competitive Structure 4-14
Angiography CPT Market for Europe 4-15
Market Overview 4-15
Market Engineering Measurements 4-16
Market Forecasts 4-16
Pricing Trends 4-18
Trends by Geographic Region 4-18
Market Share Analysis 4-19
Ophthalmic CPT Market for Europe 4-22
Market Overview 4-22
Market Engineering Measurements 4-22
Market Forecasts 4-23
Pricing Trends 4-25
Trends by Geographic Region 4-25
Market Share Analysis 4-26
Operating Room CPT Market for Europe 4-28
Market Overview 4-28
Market Engineering Measurements 4-29
Market Forecasts 4-30
Pricing Trends 4-32
Trends by Geographic Region 4-32
Market Share Analysis 4-34
Anaesthesia Room CPT Market for Europe 4-36
Market Overview 4-36

#M16F-54 © 2007 Frost & Sullivan www.frost.com August 2007 vi
Market Engineering Measurements 4-37
Market Forecasts 4-37
Pricing Trends 4-39
Trends by Geographic Region 4-39
Market Share Analysis 4-40
C h a p t e r 5
Market Engineering Research for German Custom Procedure Trays Market
German CPT Market Forecast 5-1
Market Overview 5-1
Market Engineering Measurements 5-2
Market Forecasts 5-2
Angiography CPT Market 5-4
Ophthalmic CPT Market 5-5
Operating Room CPT Market 5-7
Anaesthesia Room CPT Market 5-8
C h a p t e r 6
Market Engineering Research for the French Custom Procedure Tray Market
French CPT Market Forecast 6-1
Market Overview 6-1
Market Engineering Measurements 6-1
Market Forecasts 6-2
Angiography CPT Market 6-4
Ophthalmic CPT Market 6-5
Operating Room CPT Market 6-7
Anaesthesia Room CPT Market 6-8

#M16F-54 © 2007 Frost & Sullivan www.frost.com August 2007 vii
C h a p t e r 7
Market Engineering Research for The United Kingdom Custom Procedure Trays Market
The United Kingdom CPT Market Forecast 7-1
Market Overview 7-1
Market Engineering Measurements 7-2
Market Forecasts 7-3
Angiography CPT Market 7-4
Ophthalmic CPT Market 7-5
Operating Room CPT Market 7-7
Anaesthesia Room CPT Market 7-8
C h a p t e r 8
Market Engineering Research for Italian and Spanish Custom Procedure Trays Market
Italian and Spanish CPT Market Forecast 8-1
Market Overview 8-1
Market Engineering Measurements 8-2
Market Forecasts 8-2
Angiography CPT Market 8-4
Ophthalmic CPT Market 8-5
Operating Room CPT Market 8-7
Anaesthesia Room CPT Market 8-8

#M16F-54 © 2007 Frost & Sullivan www.frost.com August 2007 viii
C h a p t e r 9
Market Engineering Research for Benelux and Scandinavia Custom Procedure Trays Market
Benelux and Scandinavia CPT Market Forecast 9-1
Market Overview 9-1
Healthcare System in Belgium 9-1
Healthcare System in The Netherlands 9-1
Healthcare System in Denmark 9-2
Healthcare System in Sweden 9-2
Healthcare System in Finland 9-2
Healthcare System in Norway 9-2
Market Engineering Measurements 9-3
Market Forecasts 9-4
Angiography CPT Market 9-5
Ophthalmic CPT Market 9-7
Operating Room CPT Market 9-8
Anaesthesia Room CPT Market 9-10
C h a p t e r 1 0
Market Engineering Strategy
Strategic Recommendations for European Custom Procedure Trays Market 10-1
Strategic Recommendations 10-1
Effective Supply Chain Management 10-2
Competent Supplier Partnership 10-3
Continuous Customer Evaluation 10-3
Vendor-managed Inventory 10-4
Outsourcing Sterilization Facilities 10-4
Entrance of Single-use Surgical Product Manufacturers 10-4

#M16F-54 © 2007 Frost & Sullivan www.frost.com August 2007 ix
C h a p t e r 1 1
Database of Key Industry Participants
Key Industry Participants 11-1
Industry Participants 11-1
C h a p t e r 1 2
Decision Support Databases
Demographics 12-1
Total Population 12-1
Prevalence of Cardiovascular Diseases 12-3
Procedures 12-5
Number of Cataract Surgeries 12-5
Expenditure 12-8
Total Healthcare Expenditure 12-8
Government Healthcare Expenditure 12-10
Private Healthcare Expenditure 12-12

#M16F-54 © 2007 Frost & Sullivan www.frost.com August 2007 x
List of Figures
C h a p t e r 3
Industry Challenges
3-1 Custom Procedure Trays Market:
Impact of Top Four Industry Challenges (Europe), 2007-2013 3-1
C h a p t e r 4
European Custom Procedure Trays Market
4-1 Custom Procedure Trays Market:
Market Drivers Ranked in Order of Impact (Europe), 2007-2013 4-4
4-2 Custom Procedure Trays Market:
Market Restraints Ranked in Order of Impact (Europe), 2007-2013 4-6
4-3 Custom Procedure Trays Market:
Revenue Forecasts (Europe), 2003-2013 4-9
4-4 Custom Procedure Trays Market:
Pricing Trends (Europe), 2003-2013 4-10
4-5 Custom Procedure Trays Market:
Per cent of Revenues by Geographic Region (Europe), 2003-2013 4-11
4-6 Custom Procedure Trays Market:
Per cent of Revenues by Product Type (Europe), 2003-2013 4-13
4-7 Custom Procedure Trays Market:
Competitive Structure (Europe), 2006 4-14

#M16F-54 © 2007 Frost & Sullivan www.frost.com August 2007 xi
4-8 Angiography CPT Market:
Revenue Forecasts (Europe), 2003-2013 4-17
4-9 Angiography CPT Market:
Per cent of Revenues by Geographic Region (Europe), 2003-2013 4-18
4-10 Angiography CPT Market:
Company Market Share by Revenues (Europe), 2006 4-20
4-11 Ophthalmic CPT Market:
Revenue Forecasts (Europe), 2003-2013 4-24
4-12 Ophthalmic CPT Market:
Per cent of Revenues by Geographic Region (Europe), 2003-2013 4-25
4-13 Ophthalmic CPT Market:
Company Market Share by Revenues (Europe), 2006 4-27
4-14 Operating Room CPT Market:
Revenue Forecasts (Europe), 2003-2013 4-31
4-15 Operating Room CPT Market:
Per cent of Revenues by Geographic Region (Europe), 2003-2013 4-33
4-16 Operating Room CPT Market:
Company Market Share by Revenues (Europe), 2006 4-34
4-17 Anaesthesia Room CPT Market:
Revenue Forecasts (Europe), 2003-2013 4-38
4-18 Anaesthesia Room CPT Market:
Per cent of Revenues by Geographic Region (Europe), 2003-2013 4-39
4-19 Anaesthesia Room CPT Market:
Company Market Share by Revenues (Europe), 2006 4-40

#M16F-54 © 2007 Frost & Sullivan www.frost.com August 2007 xii
C h a p t e r 5
Market Engineering Research for German Custom Procedure Trays Market
5-1 Custom Procedure Trays Market:
Revenue Forecasts (Germany), 2003-2013 5-3
5-2 Angiography CPT Market:
Revenue Forecasts (Germany), 2003-2013 5-4
5-3 Ophthalmic CPT Market:
Revenue Forecasts (Germany), 2003-2013 5-6
5-4 Operating Room CPT Market:
Revenue Forecasts (Germany), 2003-2013 5-7
5-5 Anaesthesia Room CPT Market:
Revenue Forecasts (Germany), 2003-2013 5-9
C h a p t e r 6
Market Engineering Research for the French Custom Procedure Tray Market
6-1 Custom Procedure Trays Market:
Revenue Forecasts (France), 2003-2013 6-3
6-2 Angiography CPT Market:
Revenue Forecasts (France), 2003-2013 6-4
6-3 Ophthalmic CPT Market:
Revenue Forecasts (France), 2003-2013 6-6
6-4 Operating Room CPT Market:
Revenue Forecasts (France), 2003-2013 6-7
6-5 Anaesthesia Room CPT Market:
Revenue Forecasts (France), 2003-2013 6-9

#M16F-54 © 2007 Frost & Sullivan www.frost.com August 2007 xiii
C h a p t e r 7
Market Engineering Research for The United Kingdom Custom Procedure Trays Market
7-1 Custom Procedure Trays Market:
Revenue Forecasts (The United Kingdom), 2003-2013 7-3
7-2 Angiography CPT Market:
Revenue Forecasts (The United Kingdom), 2003-2013 7-4
7-3 Ophthalmic CPT Market:
Revenue Forecasts (The United Kingdom), 2003-2013 7-6
7-4 Operating Room CPT Market:
Revenue Forecasts (The United Kingdom), 2003-2013 7-7
7-5 Anaesthesia Room CPT Market:
Revenue Forecasts (The United Kingdom), 2003-2013 7-9
C h a p t e r 8
Market Engineering Research for Italian and Spanish Custom Procedure Trays Market
8-1 Custom Procedure Trays Market:
Revenue Forecasts (Italy and Spain), 2003-2013 8-3
8-2 Angiography CPT Market:
Revenue Forecasts (Italy and Spain), 2003-2013 8-4
8-3 Ophthalmic CPT Market:
Revenue Forecasts (Italy and Spain), 2003-2013 8-6
8-4 Operating Room CPT Market:
Revenue Forecasts (Italy and Spain), 2003-2013 8-7
8-5 Anaesthesia Room CPT Market:
Revenue Forecasts (Italy and Spain), 2003-2013 8-9

#M16F-54 © 2007 Frost & Sullivan www.frost.com August 2007 xiv
C h a p t e r 9
Market Engineering Research for Benelux and Scandinavia Custom Procedure Trays Market
9-1 Custom Procedure Trays Market:
Revenue Forecasts (Benelux and Scandinavia), 2003-2013 9-4
9-2 Angiography CPT Market:
Revenue Forecasts (Benelux and Scandinavia), 2003-2013 9-6
9-3 Ophthalmic CPT Market:
Revenue Forecasts (Benelux and Scandinavia), 2003-2013 9-7
9-4 Operating Room CPT Market:
Revenue Forecasts (Benelux and Scandinavia), 2003-2013 9-9
9-5 Anaesthesia Room CPT Market:
Revenue Forecasts (Benelux and Scandinavia), 2003-2013 9-10
C h a p t e r 1 2
Decision Support Databases
12-1 Decision Support Database:
Total Population in Million (World), 2002-2012 12-1
12-2 Decision Support Database:
Prevalence of Cardiovascular Diseases in Million (World), 2002-2012 12-3
12-3 Decision Support Database:
Number of Cataract Surgeries (World), 2002-2012 12-6
12-4 Decision Support Database:
Total Healthcare Expenditure in Billion USD (World), 2002-2012 12-8
12-5 Decision Support Database:
Government Healthcare Expenditure in Billion USD (World), 2002-2012 12-10
12-6 Decision Support Database:
Private Healthcare Expenditure in Billion USD (World), 2002-2012 12-12

#M16F-54 © 2007 Frost & Sullivan www.frost.com August 2007 xv
List of Charts
C h a p t e r 4
European Custom Procedure Trays Market
4.1 Custom Procedure Trays Market:
Market Engineering Measurements (Europe), 2006 4-3
4.2 Custom Procedure Trays Market:
Revenue Forecasts (Europe), 2003-2013 4-9
4.3 Custom Procedure Trays Market:
Per cent of Revenues by Geographic Region (Europe), 2003-2013 4-12
4.4 Custom Procedure Trays Market:
Per cent of Revenues by Product Type (Europe), 2003-2013 4-13
4.5 Angiography CPT Market:
Market Engineering Measurements (Europe), 2006 4-16
4.6 Angiography CPT Market:
Revenue Forecasts (Europe), 2003-2013 4-17
4.7 Angiography CPT Market:
Per cent of Revenues by Geographic Region (Europe), 2003-2013 4-19
4.8 Angiography CPT Market:
Company Market Share by Revenues (Europe), 2006 4-20
4.9 Ophthalmic CPT Market:
Market Engineering Measurements (Europe), 2006 4-23
4.10 Ophthalmic CPT Market:
Revenue Forecasts (Europe), 2003-2013 4-24

#M16F-54 © 2007 Frost & Sullivan www.frost.com August 2007 xvi
4.11 Ophthalmic CPT Market:
Per cent of Revenues by Geographic Region (Europe), 2003-2013 4-26
4.12 Ophthalmic CPT Market:
Company Market Share by Revenues (Europe), 2006 4-27
4.13 Operating Room CPT Market:
Market Engineering Measurements (Europe), 2006 4-30
4.14 Operating Room CPT Market:
Revenue Forecasts (Europe), 2003-2013 4-31
4.15 Operating Room CPT Market:
Per cent of Revenues by Geographic Region (Europe), 2003-2013 4-33
4.16 Operating Room CPT Market:
Company Market Share by Revenues (Europe), 2006 4-35
4.17 Anesthesia Room CPT Market:
Market Engineering Measurements (Europe), 2006 4-37
4.18 Anaesthesia Room CPT Market:
Revenue Forecasts (Europe), 2003-2013 4-38
4.19 Anaesthesia Room CPT Market:
Per cent of Revenues by Geographic Region (Europe), 2003-2013 4-40
4.20 Anaesthesia Room CPT Market:
Company Market Share by Revenues (Europe), 2006 4-41
C h a p t e r 5
Market Engineering Research for German Custom Procedure Trays Market
5.1 Custom Procedure Trays Market:
Market Engineering Measurements (Germany), 2006 5-2
5.2 Custom Procedure Trays Market:
Revenue Forecasts (Germany), 2003-2013 5-3

#M16F-54 © 2007 Frost & Sullivan www.frost.com August 2007 xvii
5.3 Angiography CPT Market:
Revenue Forecasts (Germany), 2003-2013 5-5
5.4 Ophthalmic CPT Market:
Revenue Forecasts (Germany), 2003-2013 5-6
5.5 Operating Room CPT Market:
Revenue Forecasts (Germany), 2003-2013 5-8
5.6 Anaesthesia Room CPT Market:
Revenue Forecasts (Germany), 2003-2013 5-9
C h a p t e r 6
Market Engineering Research for the French Custom Procedure Tray Market
6.1 Custom Procedure Trays Market:
Market Engineering Measurements (France), 2006 6-2
6.2 Custom Procedure Trays Market:
Revenue Forecasts (France), 2003-2013 6-3
6.3 Angiography CPT Market:
Revenue Forecasts (France), 2003-2013 6-5
6.4 Ophthalmic CPT Market:
Revenue Forecasts (France), 2003-2013 6-6
6.5 Operating Room CPT Market:
Revenue Forecasts (France), 2003-2013 6-8
6.6 Anaesthesia Room CPT Market:
Revenue Forecasts (France), 2003-2013 6-9

#M16F-54 © 2007 Frost & Sullivan www.frost.com August 2007 xviii
C h a p t e r 7
Market Engineering Research for The United Kingdom Custom Procedure Trays Market
7.1 Custom Procedure Trays Market:
Market Engineering Measurements (The United Kingdom), 2006 7-2
7.2 Custom Procedure Trays Market:
Revenue Forecasts (The United Kingdom), 2003-2013 7-3
7.3 Angiography CPT Market:
Revenue Forecasts (The United Kingdom), 2003-2013 7-5
7.4 Ophthalmic CPT Market:
Revenue Forecasts (The United Kingdom), 2003-2013 7-6
7.5 Operating Room CPT Market:
Revenue Forecasts (The United Kingdom), 2003-2013 7-8
7.6 Anaesthesia Room CPT Market:
Revenue Forecasts (The United Kingdom), 2003-2013 7-9
C h a p t e r 8
Market Engineering Research for Italian and Spanish Custom Procedure Trays Market
8.1 Custom Procedure Trays Market:
Market Engineering Measurements (Italy and Spain), 2006 8-2
8.2 Custom Procedure Trays Market:
Revenue Forecasts (Italy and Spain), 2003-2013 8-3
8.3 Angiography CPT Market:
Revenue Forecasts (Italy and Spain), 2003-2013 8-5
8.4 Ophthalmic CPT Market:
Revenue Forecasts (Italy and Spain), 2003-2013 8-6

#M16F-54 © 2007 Frost & Sullivan www.frost.com August 2007 xix
8.5 Operating Room CPT Market:
Revenue Forecasts (Italy and Spain), 2003-2013 8-8
8.6 Anaesthesia Room CPT Market:
Revenue Forecasts (Italy and Spain), 2003-2013 8-9
C h a p t e r 9
Market Engineering Research for Benelux and Scandinavia Custom Procedure Trays Market
9.1 Custom Procedure Trays Market:
Market Engineering Measurements (Benelux and Scandinavia), 2006 9-3
9.2 Custom Procedure Trays Market:
Revenue Forecasts (Benelux and Scandinavia), 2003-2013 9-5
9.3 Angiography CPT Market:
Revenue Forecasts (Benelux and Scandinavia), 2003-2013 9-6
9.4 Ophthalmic CPT Market:
Revenue Forecasts (Benelux and Scandinavia), 2003-2013 9-8
9.5 Operating Room CPT Market:
Revenue Forecasts (Benelux and Scandinavia), 2003-2013 9-9
9.6 Anaesthesia Room CPT Market:
Revenue Forecasts (Benelux and Scandinavia), 2003-2013 9-11
C h a p t e r 1 0
Market Engineering Strategy
10.1 Custom Procedure Trays Market:
Competitive Rivalry (Europe), 2006 10-2

#M16F-54 © 2007 Frost & Sullivan www.frost.com August 2007 1-1
1Executive Summary
S u m m a r y
Executive Summary of the European Custom Procedure Trays Market
Slides 1 to 8 provide an overview of the European custom procedure trays market from
2003 to 2013.
1
!"#$%&'()*"+,$-).#$/&0"#&)1#'2+)3'#4&,+
356789:
;"<"+,)=>>?
! "##$%&'()*%+%,-../0123%4..%'/56*)%'7)7'0783%96/)%8(:-;72*%:(2*1/2)%6/56.<%:(2=/872*/1.%/2=(';1*/(2%128%/)%*67%)(.7%>'(>7'*<%(=%&'()*%+%,-../0123%?(%>1'*%(=%/*%;1<%@7%:/':-.1*78A%B-(*78A%:(>/78%('%(*67'C/)7%'7>'(8-:78%C/*6(-*%*67%C'/**72%1>>'(01.%(=%&'()*%+%,-../0123

#M16F-54 © 2007 Frost & Sullivan www.frost.com August 2007 1-2
DEF&GHI !%"##$%&'()*%+%,-../012A%4..%'/56*)%'7)7'078%CC3='()*3:(; "
4%87*1/.78%=/212:/1.%121.<)/)%(=%*67%J-'(>712%%K-)*(;%L'(:78-'7%9'1<)%
D1'M7*)%/)%>'7)72*78%/2%*6/)%'7)71':6%)7'0/:73%967%121.<)/)%/)%@1)78%(2%=(-'%
M7<%=1:*(')N
43 &('7:1)*%;1'M7*%8<21;/:)
O3 D1'M7*%,61'7)
K3 ,75;72*%'7072-7)
P3%Q75/(21.%*'728)
3;@A!1 B*
C
;
J-'(>712%%K-)*(;%L'(:78-'7%9'1<)%D1'M7*)
DEF&GHI !%"##$%&'()*%+%,-../012A%4..%'/56*)%'7)7'078%CC3='()*3:(; R
D&$<#'%EF/'G)@&<F$(+H(F,&0)AF(<0$-)
D&#-'(2
7#'(/&
I,'G2)J)K%'F(
C&(&G"LMM)J)K/'(0F('NF'M)S%,:128/210/1%T%,C7872A%&/2.128A%?('C1<
128%P72;1'M
SS%O727.-U%T%O7.5/-;A%*67%?7*67'.128)%128%
V-U7;@(-'5
7$#&/'+,).&#F$0
C'+&)O&'#P)=>>6))
7$#&/'+,).&#F$0)F+)=>>?Q=>5R
@&+&'#/E)K/$%&
,*'1*75/:%421.<)/)%(=%*67%J-'(>712%%K-)*(;%L'(:78-'7%9'1<)%D1'M7*)
@&+&'#/E)3&,E$0$G$<2
! .#F-'#2)#&+&'#/E)SF,E)F(0"+,#2)%'#,F/F%'(,+
! 7#$+,)J)K"GGFN'()%"TGF+E&0)#&+&'#/E)+&#NF/&+
! B&/F+F$()+"%%$#,)0','T'+&+
! *$"(,#2)F(0"+,#2)U$#&/'+,+
! .#$%#F&,'#2)0','T'+&+
*"##&(/2*"##&(/2)UF<"#&+)'#&)F()HK)0$GG'#+!"#$P))))V5)!"#$)W)HKX5YR5
W4)%(2%E"*6 4>'/.A%"##$X

#M16F-54 © 2007 Frost & Sullivan www.frost.com August 2007 1-3
DEF&GHI !%"##$%&'()*%+%,-../012A%4..%'/56*)%'7)7'078%CC3='()*3:(; I
K&<-&(,',F$()T2).#$0"/,)12%&
*.1
;(<F$<#'%E2*.1
Z%E,E'G-$G$<2)*.1
Z%&#',F(<)@$$-)*.1
;('&+,E&+F')*.1
Y7<N%KL9%T%K-)*(;%L'(:78-'7%9'1<)%
DEF&GHI !%"##$%&'()*%+%,-../012A%4..%'/56*)%'7)7'078%CC3='()*3:(; H
I(0"+,#2)*E'GG&(<&+QZN&#NF&S)
" I++"&+)$()&UU&/,FN&)+"%%G2)/E'F()-'('<&-&(," I(/#&'+F(<)%#$0"/,)'S'#&(&++" *"+,$-F[&0)+$"#/F(<" B&0F/',&0)')+'G&+)'(0)-'#4&,F(<)/E'((&G))
!"#$%&'()*"+,$-).#$/&0"#&)1#'2+\3'#4&,)I(0"+,#2)/E'GG&(<&+

#M16F-54 © 2007 Frost & Sullivan www.frost.com August 2007 1-4
DEF&GHI !%"##$%&'()*%+%,-../012A%4..%'/56*)%'7)7'078%CC3='()*3:(; F
!"#$%&'()*"+,$-).#$/&0"#&)1#'2+)3'#4&,\3'#4&,)
B#FN&#+)'(0)@&+,#'F(,+
]'/4)$U)K,'(0'#0F[',F$()'-$(<+,)D&$<#'%EF/'G)
@&<F$(+
^ID^]Z_ 3!BIH3
@!K1@;I`1K
B@Ia!@K
D#$S,E)$U)`&S).#$/&0"#&+
*$(+,'(,)#F+&)F()
`"-T&#)$U)
K"#<&#F&+.#$0"/,)C"(0GF(<)
I(/#&'+&0)!-%E'+F+)
$()I(U&/,F$()*$(,#$G)
3&'+"#&+)
C&(&UF,+)$U)
*"+,$-F[',F$(
.#F/F(<).#&++"#&
I-%#$N&0)*GF(F/'G)
'(0)K,'UU)!UUF/F&(/2
@&0"/,F$()F()
.#$/"#&-&(,)*$+,+)
'(0)1F-&
D$N&#(-&(,)
@&<"G',F$(+),$)
;0N'(/&)KF(<G&)H+&)
.#$0"/,+Y)
C#'(0);GG&<F'(/&
*.18;)*$+,)*$(,#$G)
3$0&G
*"+,$-&#).&#/&%,F$(
]$(<)1&#-)*$(,#'/,+)U$#)3&0F/'G)B&NF/&)
*$-%$(&(,+
DEF&GHI !%"##$%&'()*%+%,-../012A%4..%'/56*)%'7)7'078%CC3='()*3:(; $
K,#',&<F/)@&/$--&(0',F$(+
a&(0$#8-'('<&0)
I(N&(,$#2
*$(,F("$"+)
*"+,$-&#)
!N'G"',F$(
*$-%&,&(,)
K"%%GF&#)
.'#,(&#+EF%
#!UU&/,FN&)K"%%G2)*E'F()3'('<&-&(,
KF(<G&)H+&)3'("U'/,"#&#+)
/$"G0).&(&,#',&)*.1)
3'#4&,
Z",+$"#/F(<)K,&#FGF[',F$()7'/FGF,F&+

#M16F-54 © 2007 Frost & Sullivan www.frost.com August 2007 1-5
DEF&GHI !%"##$%&'()*%+%,-../012A%4..%'/56*)%'7)7'078%CC3='()*3:(; Z
*$(/G"+F$(+
[ 967%KL9%:(2:7>*%/)%7U*'7;7.<%>(>-.1'%/2%*67%\2/*78%,*1*7)A%128%J-'(>7%/)%=('7:1)*%*(%7B-1.%*61*%/2%*67%:(;/25%<71')3%967'7%61)%@772%1%)-@)*12*/1.%5'(C*6A%>1'*/:-.1'.<%/2%:7'*1/2%:(-2*'/7)3%967%;1/2%>'(:78-'7)%C67'7%KL9%61)%@7:(;7%>(>-.1'%1'7%125/(5'1>6<%128%(>6*61.;/:%)-'57'<3%P'/0/25%KL9%/)%12%/2:'71)78%87)/'7%=('%:(2072/72:7A%)>778%128%'7./1@/./*<%/2%*7';)%(=%*67%;78/:1.%8/)>()[email protected])%-)78%=('%)-'57'<3%K(;>.7*7%:-)*(;/)1*/(2%128%(>*/;/)1*/(2%(=%'7)(-':7)%/)%*67%M7<%8'/07'%/2%=-*-'7
[ 96/)%'7)71':6%)7'0/:7%>'(0/87)%12%/2G87>*6%121.<)/)%(=%*67%J-'(>712%K-)*(;%L'(:78-'7%9'1<)%D1'M7*A%128%>'(0/87)%)*'1*75/:%'7:(;;7281*/(2)%*(%)-::778%/2%*67%/2:'71)/25.<%:(;>7*/*/07%720/'(2;72*

#M16F-54 © 2007 Frost & Sullivan www.frost.com August 2007 2-1
2Glossary of Terms
D e f i n i t i o n o f t e r m s
Procedure Definition
C a r d i o l o g y
The study of the heart and its functions. Invasive cardiology is the theory and practice of
diagnostic and therapeutic cardiac procedures such as cardiac catheterization, coronary angi-
oplasty or electrophysiologic studies that involve the entry into the heart or central
circulation.
C a t a r a c t
An opacity in the eye lens, which progressively reduces visual functioning. Cataract rates
increase significantly with age, with the large unmet need in elderly people. Cataract surgery
is a highly effective procedure, improving visual acuity and functioning in 80 to 95 per cent
of patients.
C o r o n a r y A n g i o g r a p h y
The diagnostic procedure that enables the radiographic visualisation of the coronary blood
vessels. It is used to diagnose coronary heart disease, and is therefore essential before coro-
nary angioplasty or coronary artery bypass surgery.
C o r o n a r y A r t e r y B y p a s s G r a f t ( C A B G )
This is a surgery in which the narrowing of a coronary artery is by-passed with a vein or
artery is removed from another part of the patient's body—typically the leg or the chest.

#M16F-54 © 2007 Frost & Sullivan www.frost.com August 2007 2-2
C u s t o m P r o c e d u r e T r a y ( C P T )
The bundling of medical disposables required for particular surgical procedures, supplied in
a sterile package, usually on some form of 'tray'. These medical devices typically include
drapes and gowns, swabs, sutures, knives, syringes, and so on. A CPT essentially includes at
least 90 per cent of the single-use products that are required for a particular procedure. It
excludes products for minor procedures such as basic anaesthesia and suturing kits. It also
excludes products in which non-woven components account for the majority of the contents
of the pack.
C u s t o m e r A d a p t e d S e t ( C A S )
Customer adapted sets essentially contain only drapes, gowns or certain standard items, and
are not assembled to suit particular customer requirements. CAS was developed by the
companies that supply drapes and gowns to hospitals. Occasionally, these companies have
also supplied certain low-value commodity items such as swabs. This supply has increasingly
developed in certain countries such as Germany and Italy.
D i a g n o s i s R e l a t e d G r o u p s ( D R G s )
DRGs shift the responsibility of financing healthcare from tax revenues to health insurance
funds, wherein healthcare costs are reimbursed on the basis of a fixed cost per procedure.
M i n i m a l l y I n v a s i v e S u r g e r y
An invasive procedure is any operation that pierces the skin or mucous membranes, or enters
a body cavity or organ. Minimally invasive surgery seeks to minimise the extent to which this
is necessary.
N o n - w o v e n s
Products made from the formation of fibres directly into a textile web, eliminating the
weaving process used in traditional textile manufacture. The most notable healthcare prod-
ucts made from this material are surgical drapes and gowns.
O b s t e t r i c s
The branch of medicine that deals with the management of pregnancy, labour and
puerperium.

#M16F-54 © 2007 Frost & Sullivan www.frost.com August 2007 2-3
P e r c u t a n e o u s T r a n s l u m i n a l C o r o n a r y A n g i o p l a s t y
( P T C A )
A procedure to treat coronary heart disease. A narrow tube (a cardiac catheter) is passed
through the skin of the groin or elbow into an artery and threaded into the coronary arteries.
When the tip of the catheter is in the narrowed section of the coronary artery, the small
balloon at the tip of the catheter is inflated, thus dilating the narrowed section of the coro-
nary artery. A stent is often inserted into the dilated artery to act as a scaffolding to help keep
it open.
R e u s a b l e P r o d u c t
A product intended to be reprocessed and reused. For example, some drapes and gowns are
made from cotton and poly cotton. Newer 'high tech' reusable products tend to be made of
chemically-modified poly cotton, with an additional membrane to provide an improved
barrier. For many of the single-use products used in procedure trays, there is no reusable
alternative.
S i n g l e - u s e P r o d u c t
A product that the manufacturer intends to be used only once.
S t e r i l e F i e l d
The area considered to be free of micro-organisms during a surgical procedure.
S t e r i l i s a t i o n
The process that eliminates micro-organisms (including bacterial endospores) from surgical
instruments, gowns, drapes and other items.

#M16F-54 © 2007 Frost & Sullivan www.frost.com August 2007 3-1
3Industry Challenges
I d e n t i f i c a t i o n o f C h a l l e n g e s F a c i n g t h e
E u r o p e a n C u s t o m P r o c e d u r e T r a y s M a r k e t
Industry Challenges
The first phase of the Market Engineering methodology is the identification of the key chal-
lenges facing the industry. These challenges have an impact on, and are integrated into, every
phase of the Market Engineering system. An industry challenge is an issue that can affect the
development of the market or the competitors in the marketplace. Challenges include
customer issues, regulatory programmes, economic trends, market measurement trends,
competitive strategies, new technologies, sales and marketing strategies, new market oppor-
tunities and market threats.
Figure 3-1 presents the impact of the top four industry challenges for the European custom
procedure trays market from 2007 to 2013.
Source: Frost & Sullivan
F i g u r e 3 - 1
Custom Procedure Trays Market: Impact of Top Four Industry Challenges (Europe),
2007-2013
Challenge 1-2 Years 3-4 Years 5-7 Years
Issues on effective supply chain management High Medium Low
Increasing product awareness Medium Medium Low
Customized sourcing Medium Medium Low
Dedicated sales and marketing channel Medium Medium Low

#M16F-54 © 2007 Frost & Sullivan www.frost.com August 2007 3-2
These challenges have been identified and ranked on the basis of their impact on the market.
I s s u e s o n E f f e c t i v e S u p p l y C h a i n M a n a g e m e n t
Effective and efficient management of the supply chain is essential in the CPT market. Hence,
it is very important for CPT companies to closely keep track of the hospitals and their needs.
It is critical to understand the importance of selecting the appropriate components for inclu-
sion within a procedure tray. End users such as surgeons are generally highly brand
conscious, and the failure to provide the desired brand may result in business failure. Hence,
adequate training should be provided to the theatre staff about the benefits and usage of a
company's products.
Stock out of raw materials and production parts would shut down an operation and prove
extremely costly in terms of lost production, escalation of operating costs due to fixed costs
and inability to satisfy delivery promises to customers. One way to ensure uninterrupted
material flow is to hold a large inventory. Nevertheless, inventory requires the capital, which
cannot be invested elsewhere; the cost of carrying inventory may reach 20 to 50 per cent of
the total value per year. Therefore, it is important for the supply department to keep inven-
tory investment and loss at a minimum.
I n c r e a s i n g P r o d u c t A w a r e n e s s
Since the CPT market is a complex mix of various components, it is essential to train and
brief end users and theatre staff on product benefits. CPT companies need to make end users
aware of the benefits of purchasing individual components against the cost of purchasing a
CPT. The best method for the same at present is to provide hospitals with on-line facilities for
stock ordering and management activities. Data repeated from the first sentence.New and
innovative methods need to be adopted for training purposes. Educational support tools,
product samples brochures and on-line training sessions could be adopted.
C u s t o m i z e d S o u r c i n g
The idea of 'customization' means offering customers whatever they want. Hospitals often
have special requirements for procedure kits. Choices vary with doctors and even amongst
theatre staff, posing a huge challenge for stock holding for a CPT company. Hence, it is crit-
ical for these companies to have the ability to source various products from a number of
suppliers. The challenge is to segment the products in a CPT into a range of categories and
develop distinct strategies for each type.

#M16F-54 © 2007 Frost & Sullivan www.frost.com August 2007 3-3
Constant customer research is vital to sustain the companies' position in the competitive
market. It helps in understanding the needs of the end user through a broader perspective.
This creates an interesting power play between end users, hospital procurement personnel,
CPT companies and suppliers. The surgeon may wish to use one type of sutures, while the
hospital procurement personnel might be supporting the idea of CPT, but want a competitive
price. CPT companies will want to win the business by supplying the required brands, but
will also wish to do so in a profitable way. A company such as Ethicon is therefore under
pressure to supply CPT companies. In order to manage these relationships effectively, it is
critical that CPT companies should fully understand the importance that customers attach to
brands for specific products.
D e d i c a t e d S a l e s a n d M a r k e t i n g C h a n n e l
Since customer needs have to be closely evaluated and observed, it becomes an important
challenge to employ a dedicated sales and distribution channel for CPT. The employees in
these channels would closely work with the theatre staff, who also contribute significantly to
the decision-making process of procedure packs in hospitals. Customizing kits based on their
suggestions regarding the packing pattern, packing material, product specifications and
delivery specifications is a major challenge. There also exists the need for CPT companies to
be able to communicate the intricate cost comparisons and provide methodologies for
customers to help them understand this process.

#M16F-54 © 2007 Frost & Sullivan www.frost.com August 2007 4-1
4European Custom Procedure Trays Market
E u r o p e a n C P T M a r k e t
Market Overview
Custom Procedure Tray (CPT) is a customized solution for specific hospital procedures. It
contains a bundle of disposable products, which would be required for a particular proce-
dure. Procedure trays meet the surgical user's needs for single-use components in one sterile
pack and provide a convenient way of managing surgical interventions. Since a number of
components are added to a pack, they are sourced from a wide and diverse supplier base,
tailored to meet individual needs including delivery options that will meet the users operating
requirements. The provision of all the single-use components in one pack helps save the time
involved in setting up, reduces packaging waste and benefits the environment, reducing
inventory and associated costs.
The kits consist of dressing material, operating room (OR) drapes and various disposable
products for the daily OR requirements like syringes, cannulae, suture material and others.
Disposable products such as patient drapes, surgical staff clothing and surgical dressings
account for approximately 20 to 30 per cent of the contents in a normal tray. The remaining
products include instruments, sutures, tubes, bowls and various other single-use products are
sourced from different suppliers.
The European CPT market is growing at a fast pace, though not as rapid as the United States.
Many regional participants have recently entered this market. Other single-use product firms
have also extended their product line and included procedure packs in their offering. Large
players in the United States are not able to penetrate this market, unlike other medical
devices.
This research service covers the following segments:
! Angiography custom procedure trays
! Ophthalmic custom procedure trays
! OR custom procedure trays
! Anaesthesia room custom procedure trays

#M16F-54 © 2007 Frost & Sullivan www.frost.com August 2007 4-2
The study period is from 2003 to 2013. The base year is 2006. The forecast period is from
2007 to 2013. Angiography and ophthalmic surgery are the segments that make the
maximum use of custom procedure trays at present. Hence, they have been analysed as
distinct segments. The OR segment combines all other surgical procedures, as the European
market has not yet developed substantially in this area. It excludes ophthalmic procedures
but includes areas such as cardiac surgery, orthopaedic surgery, obstetrics, ENT surgery and
neurosurgery. This segment clearly has the largest overall market potential. Anaesthesia CPT
is a relatively new market, which is still in its infancy stage, with a huge growth potential. It
is expected to experience high growth rates during the forecast period.
The European countries considered in this study comprise a total population of
349.3 million. Germany is the largest country, with almost 24 per cent of this population.
The United Kingdom, France and Italy are very similar in population size, each accounting
for approximately 17 per cent of the total population. Spain has a smaller population, with
the proportion being 11 per cent. Benelux and Scandinavia are similar in size, accounting for
8 and 7 per cent of the total population, respectively.
The elderly population is ever increasing in Europe, as life expectancy is increasing due to
medical advances. The proportion of the population aged above 65 is 16.0 per cent. This is
significant for two reasons. Firstly, the ratio of elderly people to working people (who pay
the taxes that fund healthcare) is increasing, thereby exerting strain on healthcare funding.
Secondly, elderly people are more likely to require surgical procedures, a factor that directly
influences the demand for the products in this market.
In 2006, the European CPT market was valued at $380.4 million, and the revenues are
growing at a very high rate. The potential of the market is greatly ahead of the current
market size. The market is highly fragmented, with a large number of participants in the CPT
business. The increased need for convenience, speed of operations and more efficient hospital
management are driving the customer demand. The market is propelled by the increasing
popularity of outsourcing and the realization of infection risks in hospitals and possible ways
to reduce this problem. A number of companies are expected to enter this market in the
future, with the likelihood of merger and acquisition activity over the next five years being
extremely high. Any company wishing to succeed in the European market must be fully
aware of the complexities of the various healthcare systems in Europe, and possess the neces-
sary sales, marketing, operational and supply chain management skills to succeed.

#M16F-54 © 2007 Frost & Sullivan www.frost.com August 2007 4-3
Market Engineering Measurements
Chart 4.1 presents the market engineering measurements for the European custom procedure
trays market in 2006.
C h a r t 4 . 1
Custom Procedure Trays Market: Market Engineering Measurements (Europe), 2006
Market Engineering Drives Market
Strategy and Planning
MarketEngineer
ChallengeIdentification
MarketResearch
MarketEngineering
System
Implementation
MarketPlanning
MarketStrategy
Note: All figures are rounded. Source: Frost & Sullivan
Market Drivers
Figure 4-1 presents the market drivers ranked in order of impact for the European custom
procedure trays market from 2007 to 2013.
Measurement Name Measurement Trend
Market age Growth stage ---
Revenues $380.4 million Increasing
Potential revenues (maximum future market size) $1,580.5 million Increasing
Base year market growth rate 17.5% Increasing
Compound annual growth rate 22.6% ---
Price sensitivity High Increasing
Average price $39 Increasing

#M16F-54 © 2007 Frost & Sullivan www.frost.com August 2007 4-4
Source: Frost & Sullivan
I n c r e a s e d E m p h a s i s o n I n f e c t i o n C o n t r o l M e a s u r e s
The Government of United Kingdom has formed a 'Trust infection control committee', which
has formulated specific standards for the degree of sterility to be adhered to inside an opera-
tion theatre. The committee has also laid down specifications to prevent infection in other
minimally invasive procedures like ophthalmic procedures, which would require minimum
downtime. Usage of prepacked, sterilized kits would greatly contribute to the reduction of
any nosocomial and iatrogenic infections.
Usage of procedure packs reduces linen and other operating room accessories handling,
thereby preventing chances of infection. Usage of disposable drapes and gowns, which
contribute a major portion of the procedure pack, also decreases the spread of contamination
and reduces lint in operating theatres.
R e d u c t i o n i n P r o c u r e m e n t C o s t s a n d T i m e
The growing diversity of operating procedures and surgical preferences requires the procure-
ment of a massive variety and volume of supporting clinical products. There is also the need
to reduce stockholding space, manage costs and meet emergency requirements. The time,
costs, inconvenience and stress of supplying single-use products to the operating team needs
to be minimized by the most effective purchasing departments. Usage of procedure packs
reduces administrative issues and minimizes the need to liaise with non-core suppliers.
It also enables inventory reduction, easier control on storage and simplified delivery sched-
ules. Procedure kits create an opportunity to standardize contract items and control costs.
F i g u r e 4 - 1
Custom Procedure Trays Market: Market Drivers Ranked in Order of Impact (Europe),
2007-2013
Rank Driver 1-2 Years 3-4 Years 5-7 Years
1 Increased emphasis on infection control measures High High High
2 Reduction in procurement costs and time High High Medium
3 Product bundling Medium High High
4 Benefits of customization Medium High High
5 Improved clinical and staff efficiency Medium Medium High
6 Government regulations to advance single use products Medium Medium Medium
7 Constant rise in the number of surgeries Medium Medium Medium
8 Cost control model Medium Medium Low

#M16F-54 © 2007 Frost & Sullivan www.frost.com August 2007 4-5
P r o d u c t B u n d l i n g
This driver pertains particularly to large companies that aim to become a single supplier fortheir customers. In addition to their specialized products, companies could also consider prepacking the components for a particular procedure. These companies could supply theircapital equipment along with other disposables used during a surgery. This enables compa-nies to overcome competition and build strong relationships with customers. This strategy ismostly used by companies in the ophthalmic and interventional cardiology market.
B e n e f i t s o f C u s t o m i z a t i o n
The foremost benefit of implementing custom procedure packs is the advantage of custom-izing according to the customers' needs, resulting in customer satisfaction. The end usershave the choice to design a component guideline that best suits the kind of procedure orsurgery performed. They also have the option of using products manufactured by a singlefirm or combine products of their choice. The end product, CPT, will only contain the prod-ucts that are specified by the user, from the specified suppliers, packed and deliveredaccording to the users' requirements.
I m p r o v e d C l i n i c a l a n d S t a f f E f f i c i e n c y
Usage of procedure packs improves efficiency by significantly reducing the clinical andadministrative workload, minimizing waste and associated costs, while supporting profes-sional choice. The delivery, selection, collection, checking and aseptic preparation ofnecessary single-use items is a major task. Procedure packs ensure easier aseptic transfer andquicker set-up time. They also enable the performance of additional procedures and reducesession time. The ordering and stock control of single-use products used in surgical interven-tions also require the attention of nursing staff, which are in increasingly short supply. Thebest-run operating department works to avoid unnecessary time, indirect costs, inconven-ience and stress involved in preparing for a procedure.
G o v e r n m e n t R e g u l a t i o n s t o A d v a n c e S i n g l e U s e
P r o d u c t s
The Medical Device Directive of 1993 has been a very important development in the Euro-pean healthcare sector. A series of standards are being developed, categorising medicaldevices according to their criticality in terms of patient protection, providing standard testsand criteria for products to be introduced in the European market with CE (ConformitéEuropéenne) marking. One of these standards is likely to stimulate the demand for single-useproducts, thereby increasing the need for custom procedure trays.
The European Standard prEN 13795-1 addresses surgical drapes and gowns. This standardcovers infection control aspects in the form of essential properties for reusable and single-usedrapes and clothing. The requirements of this standard have to be fulfilled when products areintroduced and, for reusable products, after each reprocessing. This acts as a major driver forCPT, since it has all components which are pre sterilized and packed which single use prod-ucts pertaining to that particular procedure or surgery.

#M16F-54 © 2007 Frost & Sullivan www.frost.com August 2007 4-6
C o n s t a n t R i s e i n t h e N u m b e r o f S u r g e r i e s
Europe has a higher share of aging population than any other continent. Almost 20 per cent
of Europe's population is aged above 55. The average life expectancy is also increasing in
Europe. Men at the age of 60 can expect to live for an additional 17 years and women can
expect another 22 years of life. Europe's aging profile has a significant impact on the number
of surgeries that could be performed, which acts as a market opportunity for custom proce-
dure trays. It is proven that the elderly account for a disproportionate amount of surgical
procedures. This impacts the operating and ophthalmic CPT market, since the number of
cataract surgeries have raised in Europe.
C o s t C o n t r o l M o d e l
Decision-making process becomes a lot easier through the implementation of CPT. It enables
in comparing component costs (linen and other operating room components), operating
theatre and clinical time costs (picking time/opening and preparation time), CSSD
(Central Sterile Supply Department) savings, procurement and inventory savings (order/
invoice processing/inventory holding/internal logistics), waste cost and potential revenue
increase due to operating room efficiency.
Market Restraints
Figure 4-2 show the market restraints ranked in order of impact for the European custom
procedure trays market from 2007 to 2013.
Source: Frost & Sullivan
F i g u r e 4 - 2
Custom Procedure Trays Market: Market Restraints Ranked in Order of Impact (Europe),
2007-2013
Rank Restraint 1-2 Years 3-4 Years 5-7 Years
1 Pricing pressure High Medium Low
2 Growth of new procedures Medium Medium High
3 Brand allegiance Medium Medium Medium
4 Lack of standardization amongst geographical regions Medium Medium Medium
5 Customer perception Medium Medium Low
6 Long-term contracts for medical device components Low Low Low

#M16F-54 © 2007 Frost & Sullivan www.frost.com August 2007 4-7
Frost & Sullivan expects the magnitude of these restraints to be outweighed by the drivers,
thus resulting in significant market growth.
P r i c i n g P r e s s u r e
Similar to other growing markets, the CPT market also faces intense price wars among
participants to increase market penetration and market share.The CPT market being highly
fragmented, many companies face pressure due to the presence and superior sales volumes of
leading companies. The market leaders have admirable bargaining powers, which pressurise
the smaller firms.
G r o w t h o f N e w P r o c e d u r e s
Most of the surgeries currently have an alternative less invasive treatment available for sake
of patients' convenience. Minimally invasive surgery is a new kind of surgery, which is
becoming increasingly common. In addition, most ophthalmic procedures are being done
using laser rays, which might potentially replace cataract surgeries. Henceforth, the usage of
procedure kits for such surgeries will be minimum, which poses a threat to the CPT market.
B r a n d A l l e g i a n c e
Convincing doctors to adapt new products or techniques. Usually, they are very particular
about the type and brand of product used for a procedure. CPT, which has a combination of
different components and of various brands.
Although it is rare, brand loyalty can even exist for very 'simple' products such as syringes
and swabs, wherein price is the usual barometer. For example, a few surgeons have even been
known to specify either a Terumo or Becton Dickinson syringe. This is a major barrier for
CPT companies in their attempt to attract hospitals.Hence, existing companies in this market
and potential entrants need to spend a lot of time and resources on the hospital and theatre
staff to exactly understand their needs and specifications to tailor make their product
accordingly.

#M16F-54 © 2007 Frost & Sullivan www.frost.com August 2007 4-8
L a c k o f S t a n d a r d i z a t i o n A m o n g s t G e o g r a p h i c a l R e g i o n s
Key differences exist in the healthcare budgets and purchasing patterns of medical compo-
nents among various countries within Europe. It is important for companies to understand
the peculiarities of the different healthcare systems with regard to all types of healthcare
products. However, this is a major issue to companies wishing to sell custom procedure trays,
as end users are involved in a complicated purchasing decision-making process.
C u s t o m e r P e r c e p t i o n
Very appropriately communicating the benefits of using a CPT becomes a big challenge for
companies who are in this market. Usually in hospitals, traditions are very deep rooted. So it
is only sufficient to brief the theatre staff and the doctors about the benefits of procedure
packs. The purchasing department also needs to be clearly elaborated upon the cost benefit
model upon uptake of CPT this is mainly because the purchasers and theatre staff have
different priorities. The purchasers are the cost controllers and very seldom understand the
workflow of the nurses in the operating theatres, which are constantly under intense time
pressure. It is crucial that the doctors, the nurse management and the administrative manage-
ment work closely with each other on the decision making process.
A detailed cost benefit model needs to be drawn up by the CPT company, explaining in detail
comparing the current costs involved in the hospital and cost saving after concept of Custom
Procedure Packs would be implemented. Currently hospitals work on a budget, and it also
becomes very essential for CPT companies to price the product competitively.
L o n g - t e r m C o n t r a c t s f o r M e d i c a l D e v i c e C o m p o n e n t s
The buying process of healthcare institutions in most European countries is tender based and
these contracts are usually meant for long terms. Particularly, supply of single-use products
are procured on a long-term tender basis, which acts as a restraint for new entrants that
prefer to bid amongst other competitors for tenders. In addition, since these single-use prod-
ucts are the key components of CPTs, it will result in the inability of hospitals to adopt the
benefits of CPT without a significant financial penalty.
Market Forecasts
Figure 4-3 and Chart 4.2 present the revenue forecasts for the European custom procedure
trays market from 2003 to 2013.

#M16F-54 © 2007 Frost & Sullivan www.frost.com August 2007 4-9
Note: All figures are rounded; the base year is 2006. Source: Frost & Sullivan
C h a r t 4 . 2
Custom Procedure Trays Market: Revenue Forecasts (Europe), 2003-2013
Note: All figures are rounded; the base year is 2006. Source: Frost & Sullivan
F i g u r e 4 - 3
Custom Procedure Trays Market: Revenue Forecasts (Europe), 2003-2013
Revenue
Revenues Growth Rate
Year ($ Million) (%)
2003 244.3 ---
2004 279.5 14.4
2005 323.6 15.8
2006 380.4 17.5
2007 452.2 18.9
2008 543.3 20.1
2009 660.1 21.5
2010 810.2 22.7
2011 1,003.2 23.8
2012 1,253.6 25.0
2013 1,580.5 26.1
Compound Annual Growth Rate (2006-2013): 22.6%
0
200
400
600
800
1000
1200
1400
1600
1800
2003 2004 2005 2006 2007 2008 2009 2010 2011 2012 2013
Year
Rev
enue
s ($
Mill
ion)
0
5
10
15
20
25
30
Gro
wth
Rat
e (%
)
Revenues ($ Million) Growth Rate (%)

#M16F-54 © 2007 Frost & Sullivan www.frost.com August 2007 4-10
The market amounted to $380.4 million in 2006. This has grown by 30.2 percent in
2006 experiencing a growth rate of 17.5 per cent over 2005. The largest markets at present
are Germany, Italy and Spain. However, most of the European countries have witnessed
significant growth since 2003, with further growth expected during the forecast period.
Pricing Trends
The total number of procedures in Europe, including angiographies, amounted to
44.7 million in 2006. The number of angiographies have reduced since 2004 due to the
advent of 64 slice CT scanning 64 slice CT is a radiological procedure that produces the 3D
image of the heart, and is less invasive as well.The number of total procedures per
100,000 people is significantly high in countries such as Germany, United Kingdom, Italy and
France, and is relatively lower in Spain and the Scandinavian countries.
Figure 4-4 shows the pricing trends of the European custom procedure trays market from
2003 to 2013.
Note: All figures are rounded; the base year is 2006. Source: Frost & Sullivan
F i g u r e 4 - 4
Custom Procedure Trays Market: Pricing Trends (Europe), 2003-2013
Average Price Price Change
Year ($) (%)
2003 39 ---
2004 40 2
2005 42 5
2006 43 2
2007 43 0
2008 44 2
2009 45 2
2010 46 2
2011 47 2
2012 46 (2)
2013 46 0

#M16F-54 © 2007 Frost & Sullivan www.frost.com August 2007 4-11
The average selling price in 2006 was $43, increasing from $39 in 2003. Prices are slightly
higher in certain countries. For example, prices in United Kingdom, the Netherlands and
Scandinavia are higher than Spain, Italy, France and Belgium. Overall, the average price has
remained relatively stable, despite slight reductions in the prices of angiography and
ophthalmic procedure trays. However, the overall average price is likely to strengthen slightly
over the coming years due to the increasing penetration of higher-valued OR CPTs and the
realisation by market participants that price competition cannot be stressed upon if a viable
business model is to be maintained.
Trends by Geographic Region
Figure 4-5 and Chart 4.3 provide the per cent of revenues by geographic region for the Euro-
pean custom procedure trays market from 2003 to 2013.
Key: Benelux = Belgium, the Netherlands and Luxembourg Scandinavia = Norway, Sweden, Finland and Denmark
Note: All figures are rounded; the base year is 2006. Source: Frost & Sullivan
F i g u r e 4 - 5
Custom Procedure Trays Market: Per cent of Revenues by Geographic Region (Europe),
2003-2013
Germany France United Kingdom Italy and Spain Benelux and Scandinavia
Year (%) (%) (%) (%) (%)
2003 32.5 15.9 23.2 14.5 13.8
2004 33.2 15.8 22.8 15.0 13.2
2005 34.1 15.5 22.4 15.6 12.4
2006 35.2 15.2 21.9 16.0 11.6
2007 36.5 14.9 21.4 16.4 10.8
2008 37.9 14.5 20.9 16.7 10.0
2009 39.5 14.0 20.3 16.9 9.3
2010 41.0 13.6 19.8 17.1 8.5
2011 42.5 13.2 19.2 17.3 7.8
2012 44.1 12.8 18.7 17.3 7.1
2013 45.7 12.4 18.1 17.3 6.5

#M16F-54 © 2007 Frost & Sullivan www.frost.com August 2007 4-12
C h a r t 4 . 3
Custom Procedure Trays Market: Per cent of Revenues by Geographic Region (Europe),
2003-2013
Note: All figures are rounded; the base year is 2006. Source: Frost & Sullivan
Germany represented the largest market, accounting for 35.2 per cent of the total European
revenues in 2006. This was due to two reasons. Firstly, it is the market with the largest
overall market potential, since it experiences the highest number of surgical procedures in
Europe. Secondly, it has a high CPT penetration rate. While this rate lags behind the
United Kingdom and Holland in the OR segment, it has increased exponentially in the anaes-
thesia and ophthalmic segments. The United Kingdom account for the second largest market
in Europe. This is because of the relatively high number of procedures and participants
existent in UK.
The proportion of the market accounted for by France is high due to the population, high
rate of surgery and sophistication of the healthcare system. The Benelux and Scandinavian
market accounted for 11.6 per cent of total European market revenues in 2006. This is rela-
tively high, given that the population of Belgium and Holland account for only 7.5 per cent
of Europe's population. CPT companies like Kimal increased their market potential in the
Netherlands due to home-town advantage.
Trends by Product Type
Figure 4-6 and Chart 4.4 show the per cent of revenues by product type for the European
custom procedure trays market from 2003 to 2013.
0%
20%
40%
60%
80%
100%
2003 2004 2005 2006 2007 2008 2009 2010 2011 2012 2013
Benelux and Scandinavia
Italy and Spain
United Kingdom
France
Germany

#M16F-54 © 2007 Frost & Sullivan www.frost.com August 2007 4-13
Key: OR = Operating Room includes Orthopedic surgery, Cardiac surgery, General surgery, Neurosurgery, ENT/Maxillo facial surgery, Obstetrics/Gynecology
Note: All figures are rounded; the base year is 2006. Source: Frost & Sullivan
C h a r t 4 . 4
Custom Procedure Trays Market: Per cent of Revenues by Product Type (Europe), 2003-2013
Note: All figures are rounded; the base year is 2006. Source: Frost & Sullivan
The OR segment accounted for the largest revenue, valuing at 46.8 per cent in 2006. This is
due to the fact that this segment includes all the different types of surgery.
F i g u r e 4 - 6
Custom Procedure Trays Market: Per cent of Revenues by Product Type (Europe), 2003-2013
Angiography Ophthalmology OR Anaesthesiology
Year (%) (%) (%) (%)
2003 32.1 31.8 33.3 2.8
2004 30.2 29.6 37.5 2.6
2005 28.2 27.4 42.0 2.4
2006 26.0 25.0 46.8 2.2
2007 23.8 22.6 51.7 2.0
2008 21.5 20.2 56.5 1.8
2009 19.3 17.9 61.2 1.6
2010 17.2 15.7 65.7 1.4
2011 15.1 13.7 70.0 1.2
2012 13.2 11.8 74.0 1.1
2013 11.4 10.0 77.6 0.9
0%
10%
20%
30%
40%
50%
60%
70%
80%
90%
100%
2003 2004 2005 2006 2007 2008 2009 2010 2011 2012 2013
Anaesthesiology
Operating Room
Ophthalmology
Angiography

#M16F-54 © 2007 Frost & Sullivan www.frost.com August 2007 4-14
The penetration of CPT is not as high in the angiography and ophthalmology segments due to
the lesser number of procedures. The angiography segment contributed 26.0 per cent and the
ophthalmology segment contributed 25.0 per cent to the total market during the base year.
Anaesthesia CPT, market is a relatively new concept of packaging which has been recently
introduced, accounted for 2.2 per cent of the total CPT market in 2006. The trends vary from
one region to another. For example, CPT trays have the maximum penetration in angiog-
raphy procedures in Germany since it has the highest number of cardiovascular cases,
whereas in countries such as the United Kingdom, the OR segment is more popular than
angiography and ophthalmology.
Competitive Structure
Figure 4-7 shows the competitive structure of the European custom procedure trays market
in 2006.
Source: Frost & Sullivan
F i g u r e 4 - 7
Custom Procedure Trays Market: Competitive Structure (Europe), 2006
Number of Companies in the Market 32
Tiers of Competition Tier 1: Alcon, Cardinal,KimalTier 2: Angiokard, PVB, Medex Medical, B BraunMedica Europe, Hartmann, Becton Dickinson, Bausch & Lomb, Rocialle, Pennine,Lohmann & RauscherTier 3: Domilens, Cordis, AMO, Sengewald, 3M, Kimberly Clark, Molnlycke, Meditalia, Deroyal, Medtronic, Caledonian Medical,Beldico, 3S Medical, Hydrex, JP Medical, Allergan, Ioltech, Interster
Notable Acquisitions, Mergers 2001—Molnlycke acquired J & J's Barrier brand2002—Sengewald acquired MSP Schmeiser2002—In Health Group took over Allegiance-name changed to Cardinal2002—In Health Group acquires Rocialle2003—Maxxim an independent European company2004—Name changed to Medica Europe
Key End-user Groups SurgeonsSurgical staffPurchasing department
Competitive Factors Effective supply chain management, customized packaging solutions

#M16F-54 © 2007 Frost & Sullivan www.frost.com August 2007 4-15
There were 32 active participants in the market in 2006. There were three tiers of competi-tion and Alcon, Cardinal and Kimal were the tier 1 participants.
Alcon is the leader in the supply of ophthalmic trays throughout Europe, having a consider-able lead over the other vendors. However, in the overall market, the share of Alcon is muchlower, as the potential of the ophthalmology segment is smaller than the other segments.Cardinal is the market leader in both angiography and OR trays. Kimal holds the secondposition in the angiography CPT market.
Tier 2 includes Angiokard, B Braun and Medex Medical in the angiography segment,
Paul Hartmann, Pennine and Lohmann & Rauscher in the OR segment, Becton Dickinson
and Bausch & Lomb in the ophthalmology segment and participants such as In health Group
and Medica Europe are present in more than one segment.
A n g i o g r a p h y C P T M a r k e t f o r E u r o p e
Market Overview
Cardiovascular (CV) diseases are a major source of morbidity and mortality in western Euro-
pean countries. There is no epidemiological information available on the impact of CV
morbidity and mortality at the entire European level, but in the United Kingdom for instance,
the mortality due to CV diseases in men under 65 is 42 per cent, compared to 32 per cent for
cancer (British Heart Foundation, www.dphpc.ox.ac.uk/bhfhprg/stats/). Hence, CV thera-
peutic classes represent approximately one quarter of the worldwide pharmaceutical sales.
Currently, coronary angiography is the gold standard to diagnose coronary artery disease and
the basis to perform percutaneous coronary intervention. Angioplasty, also known as balloon
angioplasty and Percutaneous Transluminal Angioplasty (PCTA), is a medical procedure used
to open narrowed or clogged blood vessels of the heart. A thin balloon is threaded through a
blood vessel in the groin or arm into a heart (coronary) artery. The balloon is inflated to
compress the blockage and stretch the artery open.
This segment is different from the other segments as this procedure is non-interventional. It
includes radiography procedures, which are also performed in the cathlab. The main compo-
nent in the CPT for angiography is the fluid management system, which is created by a
Boston Scientific company called North American Medical Instrument Corporation
(NAMIC). Various kit packing companies have tie-ups with NAMIC in different regions.
There exists a high level of standardisation in cardiac trays, allowing companies to produce a
few standard kits in addition to the customised kits. Specialist companies such as Cordis,
Kimal, BBraun and Medex Medical are quite strong in this market.

#M16F-54 © 2007 Frost & Sullivan www.frost.com August 2007 4-16
Market Engineering Measurements
Chart 4.5 presents the market engineering measurements for the European angiography CPT
market in 2006.
C h a r t 4 . 5
Angiography CPT Market: Market Engineering Measurements (Europe), 2006
Market Engineering Drives Market
Strategy and Planning
MarketEngineer
ChallengeIdentification
MarketResearch
MarketEngineering
System
Implementation
MarketPlanning
MarketStrategy
Note: All figures are rounded. Source: Frost & Sullivan
Market Forecasts
Figure 4-8 and Chart 4.6 provide the revenue forecasts for the European angiography CPT
market from 2003 to 2013.
Measurement Name Measurement Trend
Market age Growth stage ---
Market revenues $99.0 million Increasing
Potential revenues (maximum future market size) $180.3 million Increasing
Base year market growth rate 8.5% Increasing
Compound annual growth rate 8.9% ---
Active participants 19 Stable
Average price $50 Increasing

#M16F-54 © 2007 Frost & Sullivan www.frost.com August 2007 4-17
Note: All figures are rounded; the base year is 2006. Source: Frost & Sullivan
C h a r t 4 . 6
Angiography CPT Market: Revenue Forecasts (Europe), 2003-2013
Note: All figures are rounded; the base year is 2006. Source: Frost & Sullivan
The European angiography CPT market was worth $99.0 million in 2006. This segment,
which has grown by 15.6 per cent since 2003, is currently reaching maturity.
F i g u r e 4 - 8
Angiography CPT Market: Revenue Forecasts (Europe), 2003-2013
Revenue
Revenues Growth Rate
Year ($ Million) (%)
2003 78.5 ---
2004 84.5 7.6
2005 91.3 8.0
2006 99.0 8.5
2007 107.5 8.6
2008 117.0 8.8
2009 127.7 9.1
2010 139.5 9.2
2011 152.0 8.9
2012 165.5 8.9
2013 180.3 8.9
Compound Annual Growth Rate (2006-2013): 8.9%
0
20
40
60
80
100
120
140
160
180
200
2003 2004 2005 2006 2007 2008 2009 2010 2011 2012 2013
Year
Rev
enue
s ($
Mill
ion)
0
1
2
3
4
5
6
7
8
9
10
Gro
wth
Rat
e (%
)
Revenues ($ Million) Growth Rate (%)

#M16F-54 © 2007 Frost & Sullivan www.frost.com August 2007 4-18
The German market has an extremely high number of angiography procedures and highpenetration of angiography CPTs. Hence, the country accounts for almost half of the totalEuropean angiography CPT market revenues. It is the largest market in Europe, despiteprices being quite low due to the competition resulting from a large number of participants.Nevertheless, the market for angiographies is expected to decline due to technologicaladvances.
Pricing Trends
The average selling price in 2006 was $50. This has increased from $35.01 in 1998, andprices are likely to continue to increase, but at a lesser rate of approximately 2 per cent peryear. The high number of competitors in the European angiography CPT market creates asignificant degree of price competition. Although price per unit increases, the number ofangiographies are likely to reduce due to the advent of new technologies like 64 slice CTscan.
Trends by Geographic Region
Figure 4-9 and Chart 4.7 provide the per cent of revenues by geographic region for the Euro-pean angiography CPT market from 2003 to 2013.
Key: Benelux = Belgium, the Netherlands and Luxembourg Scandinavia = Norway, Sweden, Finland and Denmark
Note: All figures are rounded; the base year is 2006. Source: Frost & Sullivan
F i g u r e 4 - 9
Angiography CPT Market: Per cent of Revenues by Geographic Region (Europe), 2003-2013
Germany France United Kingdom Italy and Spain Benelux and Scandinavia
Year (%) (%) (%) (%) (%)
2003 35.7 22.8 28.0 2.5 10.7
2004 34.1 23.9 27.8 2.6 10.6
2005 34.2 24.9 27.6 2.7 10.4
2006 33.5 25.1 27.3 2.8 10.3
2007 32.8 27.0 27.0 2.9 10.1
2008 32.0 28.2 26.7 3.0 9.9
2009 31.3 29.3 26.4 3.1 9.7
2010 30.6 30.5 26.0 3.2 9.5
2011 29.8 31.7 25.7 3.3 9.4
2012 28.1 32.9 25.3 3.4 9.3
2013 28.1 34.2 24.8 3.5 9.2

#M16F-54 © 2007 Frost & Sullivan www.frost.com August 2007 4-19
C h a r t 4 . 7
Angiography CPT Market: Per cent of Revenues by Geographic Region (Europe), 2003-2013
Note: All figures are rounded; the base year is 2006. Source: Frost & Sullivan
Germany represents an extremely large proportion of the European revenues. In Germany
alone, the total number of angiographic procedures rose by 45 per cent from 1995 to 2000,
while the fraction of interventional procedures remained low at about 30 per cent.
[Z. Kardiol. 90 (2001) 665].
This country leads the way in terms of cardiology, creating future market potential. Further-
more, the penetration of CPT is also very high in the German market, creating a large market
size. This is despite the relatively low prices in Germany caused by a high level of
competition.
France is the country with the second largest potential market. However, the penetration of
CPT for angiography in France is slightly lower than the European average. This is the reason
for the country accounting for 25.96 per cent of the European revenues. Belgium and
Norway follow the same trend as that of Germany, witnessing an above average number of
procedures and a relatively high level of penetration.
Market Share Analysis
Figure 4-10 and Chart 4.8 show the company market share by revenues for the European
angiography CPT market during 2006.
0%
20%
40%
60%
80%
100%
2003 2004 2005 2006 2007 2008 2009 2010 2011 2012 2013
Benelux and Scandinavia
Italy and Spain
United Kingdom
France
Germany

#M16F-54 © 2007 Frost & Sullivan www.frost.com August 2007 4-20
Note: Others include Medtronic, Caledonian Medical, Beldico, 3S Medical, Hydrex and JP Medical
Note: All figures are rounded; the base year is 2006. Source: Frost & Sullivan
C h a r t 4 . 8
Angiography CPT Market: Company Market Share by Revenues (Europe), 2006
Note: All figures are rounded; the base year is 2006. Source: Frost & Sullivan
F i g u r e 4 - 1 0
Angiography CPT Market: Company Market Share by Revenues (Europe), 2006
Company Market Share (%)
Cardinal 24.4
Kimal 22.4
B Braun 16.8
Angiokard 10.2
Medica Europe 8.0
Vygon 5.0
In Health Group (Rocialle) 3.9
Deroyal 2.3
Others 7.0
TOTAL 100.0
B Braun16.8%
Kimal22.4%
Angiokard10.2%
Deroyal2.3%
Others7.0%
Medica Europe8.0%
Cardinal24.4%
Vygon5.0%
In Health Group (Rocialle)3.9%

#M16F-54 © 2007 Frost & Sullivan www.frost.com August 2007 4-21
There is no dominant market participant in the European angiography CPT market. Most
countries in Europe have domestic participants in this segment.
However, none of the companies have managed to create a strong foothold across all the
major European countries.
Cardinal is the key participant, with 24.4 per cent market share in 2006. The company has
its European production headquartered in France. The capacity of this production facility is
currently being expanded. The main competitive advantage for Cardinal is its very strong
brand name in drapes and gowns.
Kimal followed closely with a share of 22.4 per cent in 2006. Kimal is a UK company,
focusing mainly on the cardiology and radiology area, having angiography CPT sales in a
number of European countries. The company has been very successful in the
United Kingdom, wherein it is the market leader. It has also developed an extremely domi-
nant position in the Scandinavian countries and a good position in Italy. This company has
grown substantially since 2001 due to persistent campaigning and partnering. Kimal also has
a tie-up with Boston Scientific for its NAMIC fluid management systems in the
United Kingdom, Scandinavia, Portugal, Holland, Norway, Sweden, Denmark, Austria,
Hungary and a few eastern European countries.
B Braun had a market share of 16.8 per cent in 2006. It has a relatively strong position in the
German market, has achieved sales in Scandinavia and is building a market presence in the
United Kingdom.
Angiokard is also strong in Germany, but has not yet achieved significant sales outside its
home country.
Medica Europe had a market share of 8.0 per cent in 2006. Maxxim Medical, Europe had a
management buy-out in April 2003 and it became an independent European company head-
quartered in Holland. In May 2004, it acquired the name Medica Europe. Medica was the
former name of the company before it was bought by Maxxim, USA, in 1995. Maxxim has
plans of becoming a Pan European vendor and has its assembling unit located in the
Netherlands.
Vygon had a market share of 5.0 per cent and is the market leader in France.

#M16F-54 © 2007 Frost & Sullivan www.frost.com August 2007 4-22
O p h t h a l m i c C P T M a r k e t f o r E u r o p e
Market Overview
Cataract surgery is the most common type of eye surgery. It accounts for approximately
two-thirds of all the eye procedures. In many countries, it is the highest volume surgical
procedure performed, which makes it attractive for the sale of procedure trays. The following
three factors of the ophthalmic market are critical to the likely uptake of CPT:
! High volume of the number of procedures performed
! High standardisation (the procedure is subject to very little variation)
! High propensity to use single-use products (particularly true for eye surgery because of
the risk of infection)
The ophthalmic CPT segment has specific market participants that focus on ophthalmology,
offering a wide range of ophthalmology products. This is one of the reasons that it has been
examined as a distinct segment. Another reason is that it is significantly more penetrated by
CPT than other types of surgery.
Different types of eye surgery are in existence. Apart from cataract surgery, however, compa-
nies have not been successful in converting many of these to custom procedure trays. This is
because procedures such as posterior segment surgery, muscle surgery and lid surgery are
considerably more complicated than cataract surgery. Furthermore, their volumes are signifi-
cantly low. However, it is also true that ophthalmic companies have not been focusing on
CPT for other types of eye surgery. Hence, there is perhaps a supply side as well as demand
side restraint on the market. The increasing popularity of laser eye surgery is likely to
provide an attractive market niche due to the fact that it is a highly standardized procedure
and in the long term, is likely to be a high-volume procedure, as well. This segment is likely
to continue to be dominated by specialist market participants, the most significant of them
being Alcon, which is likely to continue its leadership despite increased competition.
Market Engineering Measurements
Chart 4.9 presents the market engineering measurements for the European ophthalmic CPT
market in 2006.

#M16F-54 © 2007 Frost & Sullivan www.frost.com August 2007 4-23
C h a r t 4 . 9
Ophthalmic CPT Market: Market Engineering Measurements (Europe), 2006
Market Engineering Drives Market
Strategy and Planning
MarketEngineer
ChallengeIdentification
MarketResearch
MarketEngineering
System
Implementation
MarketPlanning
MarketStrategy
Note: All figures are rounded. Source: Frost & Sullivan
Market Forecasts
Figure 4-11 and Chart 4.10 provide the revenue forecasts for the European ophthalmic CPT
market from 2003 to 2013.
Measurement Name Measurement Trend
Market age Growth stage ---
Revenues $95.0 million Increasing
Potential revenues (maximum future market size) $158.6 million Increasing
Base year market growth rate 7.2% Increasing
Compound annual growth rate 7.6% ---
Active participants 11 Stable
Average price $34 Stable

#M16F-54 © 2007 Frost & Sullivan www.frost.com August 2007 4-24
Note: All figures are rounded; the base year is 2006. Source: Frost & Sullivan
C h a r t 4 . 1 0
Ophthalmic CPT Market: Revenue Forecasts (Europe), 2003-2013
Note: All figures are rounded; the base year is 2006. Source: Frost & Sullivan
The European ophthalmology CPT market was worth $95.0 million in 2006. This segment
which has grown by 13.7 per cent since 2003 is slowly reaching maturity.
F i g u r e 4 - 1 1
Ophthalmic CPT Market: Revenue Forecasts (Europe), 2003-2013
Revenue
Revenues Growth Rate
Year ($ Million) (%)
2003 77.6 ---
2004 82.8 6.7
2005 88.6 7.0
2006 95.0 7.2
2007 102.0 7.4
2008 109.7 7.5
2009 118.1 7.7
2010 127.2 7.7
2011 137.0 7.7
2012 147.4 7.6
2013 158.6 7.6
Compound Annual Growth Rate (2006-2013): 7.6%
0
20
40
60
80
100
120
140
160
180
2003 2004 2005 2006 2007 2008 2009 2010 2011 2012 2013
Year
Rev
enue
s ($
Mill
ion)
0
1
2
3
4
5
6
7
8
9
Gro
wth
Rat
e (%
)
Revenues ($ Million) Growth Rate (%)

#M16F-54 © 2007 Frost & Sullivan www.frost.com August 2007 4-25
The French, Benelux and Scandinavian markets have a higher number of ophthalmology
procedure per capita and a high penetration of ophthalmic CPTs when compared to the
United Kingdom and Germany. However, due to its large population, Germany accounts for
almost 24.2 per cent of the European market revenues. It is the biggest market in Europe in
terms of revenues, despite prices being quite low.
Market growth is likely to remain stable until 2009 and then slow down in the future due to
the high saturation of the market. The growth will be driven by small increases in the number
of procedures such as laser surgery, since cataract surgery is reaching maturity.
Pricing Trends
The average selling price of ophthalmology trays has remained relatively stable from 2004 to
2006 at $34. This trend is expected to continue in the future.
Trends by Geographic Region
Figure 4-12 and Chart 4.11 provide the per cent of revenues by geographic region for the
European ophthalmic CPT market from 2003 to 2013.
Key: Benelux = Belgium, the Netherlands and Luxembourg Scandinavia = Norway, Sweden, Finland and Denmark
Note: All figures are rounded; the base year is 2006. Source: Frost & Sullivan
F i g u r e 4 - 1 2
Ophthalmic CPT Market: Per cent of Revenues by Geographic Region (Europe), 2003-2013
Germany France United Kingdom Italy & Spain Benelux and Scandinavia
Year (%) (%) (%) (%) (%)
2003 23.0 17.9 21.6 14.2 23.4
2004 23.4 17.1 21.4 14.2 23.0
2005 23.8 18.0 21.3 14.2 22.7
2006 24.2 18.2 21.1 14.2 22.2
2007 24.7 18.3 21.0 14.2 21.9
2008 25.0 18.4 20.1 14.2 21.4
2009 25.4 18.5 20.9 14.2 20.1
2010 25.8 18.6 20.8 14.2 20.6
2011 26.1 18.7 20.7 14.3 20.1
2012 26.6 18.8 20.6 14.3 19.8
2013 26.9 18.9 20.5 14.3 19.4

#M16F-54 © 2007 Frost & Sullivan www.frost.com August 2007 4-26
C h a r t 4 . 1 1
Ophthalmic CPT Market: Per cent of Revenues by Geographic Region (Europe), 2003-2013
Note: All figures are rounded; the base year is 2006. Source: Frost & Sullivan
There is no distinct leader among the regions analysed for the ophthalmic CPT market.
Germany generated the highest revenues in 2006, accounting for $24.2 million.The Benelux
and Scandinavian regions are currently the second largest in Europe because of the high
number of cataract surgeries.
The Italian and Spanish markets together are slightly larger than France in terms of units, but
value lesser than France in revenue because of the lower prices of ophthalmic trays in Italy.
The market share of France is low despite its relatively high population. This market is
mainly affected by the price wars among participants.
Market Share Analysis
Figure 4-13 and Chart 4.12 show the company market share by revenues for the European
ophthalmic CPT market in 2006.
0%
10%
20%
30%
40%
50%
60%
70%
80%
90%
100%
2003 2004 2005 2006 2007 2008 2009 2010 2011 2012 2013
Benelux and Scandinavia
Italy & Spain
United Kingdom
France
Germany

#M16F-54 © 2007 Frost & Sullivan www.frost.com August 2007 4-27
Note: Others include AMO (Advanced Medical Optics), Sengewald, Allergan, Ioltech and Medica
Note: All figures are rounded; the base year is 2006. Source: Frost & Sullivan
C h a r t 4 . 1 2
Ophthalmic CPT Market: Company Market Share by Revenues (Europe), 2006
Note: All figures are rounded; the base year is 2006. Source: Frost & Sullivan
Alcon dominated the European ophthalmic CPT market, with a share of 72.3 per cent during2006. Alcon was the pioneer in this field, launching the concept of CPT in 1996-97, estab-lishing a plant in Belgium and investing in education, software and an effective sales force.The company is the current undisputed market leader throughout Europe, having a consider-able lead over the other participants. However, in the total market, the share of Alcon ismuch lower, as the ophthalmology segment does not have as much market potential as theother segments. Alcon has experienced significant growth and driven the ophthalmicCPT market. The company has a competitive advantage over the other participants since itprovides additional benefits such as training to end users and has precisely specialised prod-ucts for ophthalmology. However, Alcon's market leadership does not appear to be under anyserious threat in the near future. It has a well-known brand name among French surgeonsand this is the main reason for its lead over the other participants.
F i g u r e 4 - 1 3
Ophthalmic CPT Market: Company Market Share by Revenues (Europe), 2006
Company Market Share (%)
Alcon 72.3
Becton Dickinson 12.0
Bausch & Lomb 6.0
In Health Group (Rocialle) 3.2
Domilens 2.8
Others 3.7
TOTAL 100.0
Bausch & Lomb6.0%
Becton Dickinson12.0%
Domilens2.8%
Alcon72.3%
Others3.7%
In Health Group (Rocialle)3.2%

#M16F-54 © 2007 Frost & Sullivan www.frost.com August 2007 4-28
Becton Dickinson is the company that holds the second position in the European market,
after the acquisition of Visitec in 1997. However, Becton Dickinson is not competing closely
with Alcon in any European market. The United Kingdom and France are the countries that
this company has been most successful in. Becton Dickinson is likely to increase its market
share in the forecast period. However, the company should strive harder to claim to be a
serious challenge for Alcon. None of the other companies have acquired a substantial share
of the European market. Bausch & Lomb is another key ophthalmology company, but its
strategies are different from those of Alcon. It is likely to be able to increase its market share,
however, CPT is not expected to be a means to complement the sales of its other ophthalmic
products. The other companies in the market are either local ophthalmology companies such
as Advanced Medical Optics (AMO), Allergan, Domilens and Ioltech, or general CPT
vendors such as Cardinal, Medica Europe (formerly Maxxim Medical), Sengewald and
Rocialle. AMO is likely to witness a decline in its share, since it was recently asked to recall
its liquid solution.
O p e r a t i n g R o o m C P T M a r k e t f o r E u r o p e
Market Overview
The prevention of intra- and post-operative wound infections remains an essential require-
ment despite asepsis and antisepsis compliance during surgery. Nosocomial infections can
extend a hospital stay by several days, even in the most favourable scenarios, and constitute
an additional cost factor for insurance companies. CPTs are kits which are prepackaged and
sterile assortments of surgical products.These assembled packages contain complete sets of
sterile single-use surgical products customized to meet the hospitals' and surgeons' needs for
specific surgical procedures. The largest component by value in a typical CPT, is drapes and
gowns constituting around half the value of the CPT market. Other components include
swabs, syringes and suction tubes, but a large number of surgical products may be included
in CPTs. In view of the lack of demand side substitutability, various sub-segments of CPTs
may constitute relevant product markets depending on the surgery they are intended for
(general surgery, heart surgery, orthopaedics, and so on). The OR market covers all surgical
procedures performed in the operating room, excluding ophthalmic procedures.

#M16F-54 © 2007 Frost & Sullivan www.frost.com August 2007 4-29
The main categories under this segment are as follows:
! Orthopaedic surgery
! Cardiac surgery
! General surgery
! Neurosurgery
! ENT/Maxillo facial surgery
! Obstetrics/Gynaecology
There are three main factors that influence the likelihood of customers adopting CPT. Firstly,
the volumes of procedures performed, if a procedure is performed in high volumes, CPT
becomes more attractive due to the potential cost savings. This is certainly the case for ENT
procedures such as tonsillectomies and myringotomies. However, volumes will vary,
depending on the focus of a particular hospital. The second factor is the standardization of
the procedure and the agreement among surgeons on the items required to perform the proce-
dure. The third factor is the extent of disposable use and focus on infection control. This is
the reason for the growth of the orthopaedic field in a developed market such as the
United Kingdom. The risk of infection can be very high for procedures such as hip replace-
ments and arthroscopy procedures. The volumes of cardiac and neurosurgery procedures
tend to be lower. However, the average price of these CPTs can be much higher than the
average. For example, it is not unusual for a tray used for cardiac surgery to cost as much as
$250. Caesarean section procedures are a very attractive area for CPT companies to focus on,
due to the minimal time available for the preparation of the surgery. As a result, the benefits
of CPT, in terms of speed, are most welcome. The current growth rate of this segment is low
in Europe,with only 5.0 per cent of surgical procedures penetrated by CPT, In comparison
with the 50.0 per cent penetration in the United States. Hence, there is scope for significant
growth in this segment. However, CPT will not be viable for certain low-volume procedures
and a few hospitals, leading to the market penetration of not more than 60.0 to
70.0 per cent. Hence, companies should focus their effort and work with specific customers
to identify the areas wherein CPT will prove most advantageous for them.
Market Engineering Measurements
Chart 4.13 presents the market engineering measurements for the European operating room
CPT market in 2006.

#M16F-54 © 2007 Frost & Sullivan www.frost.com August 2007 4-30
C h a r t 4 . 1 3
Operating Room CPT Market: Market Engineering Measurements (Europe), 2006
Market Engineering Drives Market
Strategy and Planning
MarketEngineer
ChallengeIdentification
MarketResearch
MarketEngineering
System
Implementation
MarketPlanning
MarketStrategy
Note: All figures are rounded. Source: Frost & Sullivan
Market Forecasts
Figure 4-14 and Chart 4.14 show the revenue forecasts for the European operating room CPT
market from 2003 to 2013.
Measurement Name Measurement Trend
Market age Growth stage ---
Revenues $178.0 million Increasing
Potential revenues (maximum future market size) $1,227.2 million Increasing
Base year market growth rate 30.9% Increasing
Compound annual growth rate 31.8% ---
Active participants 14 Stable
Average price $58 Growing

#M16F-54 © 2007 Frost & Sullivan www.frost.com August 2007 4-31
Note: All figures are rounded; the base year is 2006. Source: Frost & Sullivan
C h a r t 4 . 1 4
Operating Room CPT Market: Revenue Forecasts (Europe), 2003-2013
Note: All figures are rounded; the base year is 2006. Source: Frost & Sullivan
F i g u r e 4 - 1 4
Operating Room CPT Market: Revenue Forecasts (Europe), 2003-2013
Revenue
Revenues Growth Rate
Year ($ Million) (%)
2003 81.4 ---
2004 104.9 28.9
2005 135.9 29.6
2006 178.0 30.9
2007 233.7 31.3
2008 306.9 31.3
2009 403.8 31.6
2010 532.2 31.8
2011 702.1 31.9
2012 927.4 32.1
2013 1,227.2 32.3
Compound Annual Growth Rate (2006-2013): 31.8%
0
200
400
600
800
1000
1200
1400
2003 2004 2005 2006 2007 2008 2009 2010 2011 2012 2013
Year
Rev
enue
s ($
Mill
ion)
0
5
10
15
20
25
30
35
Gro
wth
Rat
e (%
)
Revenues ($ Million) Growth Rate (%)

#M16F-54 © 2007 Frost & Sullivan www.frost.com August 2007 4-32
The European OR CPT market was worth $178.0 million in 2006. This segment has grown
by 58.5 per cent since 2003. It is the least penetrated and has tremendous scope for growth
due to its high potential.
The OR segment includes different types of surgeries. Orthopaedic procedures display the
maximum usage of CPTs. This is due to the fact that orthopaedic surgeries require many
components to be assembled. Factors such as the high number of orthopaedic procedures and
the need for speed and a sterile environment has helped in CPT penetration. Obstetrics and
gynaecology closely follow orthopaedics with the usage of Section packs for Caesarian
section, as it saves time in emergencies. General surgery and cardiovascular surgery have
18.0 per cent and 13.0 per cent market share, respectively. These types of surgery have a very
high potential and general surgery and cardiovascular surgery are considered to be the major
growth areas in this segment.
By 2013, the European OR CPT market is forecast to be worth $1,227.2 million, with the
CAGR for the period 2006 to 2013 estimated to be 31.8 per cent.
Pricing Trends
The average selling price of an OR CPT was $58 in 2006. This has increased since 2003, and
is expected to continue increasing at a low rate, as more complex procedures shift to CPT
and end users become increasingly aware of product benefits. A few countries have higher
prices than the average (For example, Holland, the United Kingdom and Scandinavia), while
some have lower prices (For example, France, Spain and Belgium). This is related to the cost
of the component prices in those countries.
Trends by Geographic Region
Figure 4-15 and Chart 4.15 provide the per cent of revenues by geographic region for the
European operating room CPT market from 2003 to 2013.

#M16F-54 © 2007 Frost & Sullivan www.frost.com August 2007 4-33
Key: Benelux = Belgium, the Netherlands and Luxembourg Scandinavia = Norway, Sweden, Finland and Denmark
Note: All figures are rounded; the base year is 2006. Source: Frost & Sullivan
C h a r t 4 . 1 5
Operating Room CPT Market: Per cent of Revenues by Geographic Region (Europe),
2003-2013
Note: All figures are rounded; the base year is 2006. Source: Frost & Sullivan
F i g u r e 4 - 1 5
Operating Room CPT Market: Per cent of Revenues by Geographic Region (Europe),
2003-2013
Germany France United Kingdom Italy and Spain Benelux and Scandinavia
Year (%) (%) (%) (%) (%)
2003 38.7 7.3 19.9 25.3 8.9
2004 39.6 7.4 19.8 24.9 8.3
2005 40.7 7.5 19.5 24.4 7.8
2006 42.1 7.6 19.2 23.8 7.3
2007 43.5 7.7 18.9 23.1 6.9
2008 44.8 7.7 18.5 22.6 6.3
2009 46.2 7.8 18.1 21.9 5.1
2010 47.4 7.1 17.9 21.3 5.5
2011 48.6 8.0 17.5 20.8 5.1
2012 49.7 8.2 17.1 20.2 4.8
2013 50.8 8.3 16.9 19.7 4.5
0%
20%
40%
60%
80%
100%
2003 2004 2005 2006 2007 2008 2009 2010 2011 2012 2013
Benelux and Scandinavia
Italy and Spain
United Kingdom
France
Germany

#M16F-54 © 2007 Frost & Sullivan www.frost.com August 2007 4-34
Germany represents the largest share, accounting for 42.1 per cent of the European market,
due to its higher population when compared to the other European countries. The reason for
this is that Germany is a well developed market for surgery and a number of advanced proce-
dures are performed using CPT.
The proportion of the market accounted for by France is also considerably low if one takes
into account its population despite its population. This market is mainly affected by the price
war that is prevalent since 2000. The Italian and Spanish markets together were higher than
France in terms of revenue in 2006.
The Benelux and Scandinavian markets together accounted for 7.3 per cent of the European
market revenues in 2006. This is relatively high, given that the population of Benelux and
Scandinavia accounts for only 7.5 per cent of Europe's population.The reason for this market
share is the occurrence of advanced surgical procedures in Belgium.
Market Share Analysis
Figure 4-16 and Chart 4.16 show the company market share by revenues for the European
operating room CPT market for 2006.
Note: Others include 3M, Kimberly Clark, Medex Medical and Interster
Note: All figures are rounded; the base year is 2006. Source: Frost & Sullivan
F i g u r e 4 - 1 6
Operating Room CPT Market: Company Market Share by Revenues (Europe), 2006
Company Market Share (%)
Cardinal 36.0
Molnlycke 24.1
Medica Europe 15.1
In Health Group (Rocialle) 8.1
Lohmann & Rauscher 4.2
Paul Hartmann 3.1
Pennine Healthcare 2.2
Others 7.2
TOTAL 100.0

#M16F-54 © 2007 Frost & Sullivan www.frost.com August 2007 4-35
C h a r t 4 . 1 6
Operating Room CPT Market: Company Market Share by Revenues (Europe), 2006
Note: All figures are rounded; the base year is 2006. Source: Frost & Sullivan
Cardinal is currently the market leader in this segment, with a share of 36.0 per cent.
However, at this stage of development, market shares are prone to instability and likely to
rapidly evolve. However, Cardinal has been the most successful participant, mainly due to its
wide coverage of all the major European countries.
Mölnlycke had a market share of 24.1 per cent in 2006, following Cardinal in the second
position. This is because of its well-known brand name in surgical drapes and gowns and
other non-woven products. Medica Europe was one of the first companies to achieve success
in Europe, and it had a market share of 15.1 per cent in 2006. Maxxim Medical, Europe had
a management buy-out in April 2003 and it became an independent European company head-
quartered in Holland. In May 2004, it acquired the name Medica Europe. Medica was the
former name of the company before it was bought by Maxxim, USA in 1995. Maxxim has
plans of becoming a Pan European player and has an advantage over other participants as
their assembling unit is located in OS, Netherlands.
In health Group (Rocialle) is the market leader in the United Kingdom, and holds the fourth
position in the European market. The strength of Rocialle in the United Kingdom, combined
with the well-developed nature of that market has led to the company accounting for
8.1 per cent share of the European market in 2006. Lohmann & Rauscher and Pennine are
two other companies with a significant market share. These companies are successful in
Germany and the United Kingdom, respectively, with market shares of 4.2 per cent and
2.2 per cent, respectively. Paul Hartmann had a market share of 3.1 per cent.
Most other participants are regional companies such as Caledonian Medical in Scotland, JP
Medical and Interster in the Netherlands, Meditalia in Italy and Sengewald in Germany.
A number of other major medical device companies such as Kimberly Clark and 3M are also
monitoring this business with interest and considering market entry.
Molnlycke24.1%
Medica Europe15.1%
Pennine Healthcare2.2%
Others7.2%
Lohmann & Rauscher4.2%
Cardinal36.0%
Paul Hartmann3.1%
In Health Group (Rocialle)8.1%

#M16F-54 © 2007 Frost & Sullivan www.frost.com August 2007 4-36
A n a e s t h e s i a R o o m C P T M a r k e t f o r E u r o p e
Market Overview
The use of customized kits for hospital-based procedures is growing in Europe. This trend is
being driven by a number of factors, including the need to reduce nursing hours spent in
procedure set-up, decrease cross-contamination, track individual procedure costs more effi-
ciently and cater to varying clinician preferences or requirements. Companies that are able to
offer these additional benefits, alongside a lead offer of high-quality regional anaesthesia
products, are experiencing market expansion. This is likely to continue as customization
becomes increasingly common. Anaesthesia trays are usually standard and custom regional
anaesthesia trays serving all purposes like spinal, epidural, combined spinal and epidural,
peripheral block and pain management procedures.
The practice of regional anaesthesia, particularly peripheral anaesthesia, is on the rise. This
is driven by the interplay of many factors including the rising numbers of surgical procedures
in Europe and a growing body of clinical evidence purporting its advantages over general
anaesthesia. Other reasons are an expanding number of applications for these procedures and
the drive to speed up patient turnover in hospitals, since recovery time after regional anaes-
thesia is usually shorter than general anaesthesia. These features make the regional
anaesthesia market increasingly interesting. The popularity of anaesthesia kits varies among
regional anaesthesia procedure types. Components such as syringes and catheters may be
purchased separately according to end-user preference.
The increasing average age of the European population is having widespread effects on the
provision of healthcare in Europe. One of the effects is an increasing number of surgical
procedures Correspondingly, the total number of anaesthetic procedures—local, regional and
general—is also increasing. Another effect of increasingly strained healthcare budgets is a
contitnent-wide trend towards the relocation of the patient from the hospital to alternative
sites (for example, home) in the shortest time possible. Reducing in-patient stay times reduces
the cost per patient to hospitals and allows a higher patient throughput. These conditions
favour regional over general anaesthesia, since the use of regional anaesthesia often means a
shorter post-surgery recovery period and therefore, an earlier discharge.

#M16F-54 © 2007 Frost & Sullivan www.frost.com August 2007 4-37
Market Engineering Measurements
Chart 4.17 presents the market engineering measurements for the European anaesthesia room
CPT market in 2006.
C h a r t 4 . 1 7
Anesthesia Room CPT Market: Market Engineering Measurements (Europe), 2006
Market Engineering Drives Market
Strategy and Planning
MarketEngineer
ChallengeIdentification
MarketResearch
MarketEngineering
System
Implementation
MarketPlanning
MarketStrategy
Note: All figures are rounded. Source: Frost & Sullivan
Market Forecasts
Figure 4-17 and Chart 4.18 provide the revenue forecasts for the European anaesthesia room
CPT market from 2003 to 2013.
Measurement Name Measurement Trend
Market age Growth stage ---
Revenues $8.4 million Increasing
Potential revenues (maximum future market size) $14.4 million Increasing
Base year market growth rate 7.3% Increasing
Compound annual growth rate 8.0% ---
Active participants 7 Growing
Average price $30 Growing

#M16F-54 © 2007 Frost & Sullivan www.frost.com August 2007 4-38
Note: All figures are rounded; the base year is 2006. Source: Frost & Sullivan
C h a r t 4 . 1 8
Anaesthesia Room CPT Market: Revenue Forecasts (Europe), 2003-2013
Note: All figures are rounded; the base year is 2006. Source: Frost & Sullivan
The European anaesthesia room CPT market was worth $8.4 million in 2006. This segment
has grown by 13.9 per cent since 2003. It is still in its infancy stages and has tremendous
scope for growth due to the high market potential.
F i g u r e 4 - 1 7
Anaesthesia Room CPT Market: Revenue Forecasts (Europe), 2003-2013
Revenue
Revenues Growth Rate
Year ($ Million) (%)
2003 6.8 ---
2004 7.3 6.8
2005 7.8 7.2
2006 8.4 7.3
2007 9.0 7.5
2008 9.7 7.6
2009 10.5 7.9
2010 11.3 7.9
2011 12.2 8.0
2012 13.2 8.2
2013 14.4 8.5
Compound Annual Growth Rate (2006-2013): 8.0%
0
2
4
6
8
10
12
14
16
2003 2004 2005 2006 2007 2008 2009 2010 2011 2012 2013
Year
Rev
enue
s ($
Mill
ion)
0
1
2
3
4
5
6
7
8
9
Gro
wth
Rat
e (%
)
Revenues ($ Million) Growth Rate (%)

#M16F-54 © 2007 Frost & Sullivan www.frost.com August 2007 4-39
A strong customer base and high requirement for anaesthesia in Europe clearly explains the
growth of anaesthesia CPT kits. The practice of regional anaesthesia, and in particular,
peripheral anaesthesia, is on the rise. This use is driven by the interplay of many factors
including rising numbers of surgical procedures in Europe and a growing body of clinical
evidence purporting its advantages over general anaesthesia.
Pricing Trends
The average selling price was $30 in 2006. This has increased since 2003, and is expected to
continue to increase, as more surgical procedures transition to CPT and end users become
increasingly aware of product benefits.
Trends by Geographic Region
Figure 4-18 and Chart 4.19 provide the per cent of revenues by geographic region for the
European anaesthesia room CPT market from 2003 to 2013.
Key: Benelux = Belgium, the Netherlands and Luxembourg Scandinavia = Norway, Sweden, Finland and Denmark
Note: All figures are rounded; the base year is 2006. Source: Frost & Sullivan
F i g u r e 4 - 1 8
Anaesthesia Room CPT Market: Per cent of Revenues by Geographic Region (Europe),
2003-2013
Germany France United Kingdom Italy and Spain Benelux and Scandinavia
Year (%) (%) (%) (%) (%)
2003 30.9 16.7 24.7 27.6 0.0
2004 31.6 16.7 24.4 27.1 0.0
2005 32.4 16.6 24.1 26.7 0.0
2006 33.3 16.6 23.8 26.1 0.0
2007 34.1 16.6 23.5 25.6 0.0
2008 35.0 16.6 23.2 25.0 0.0
2009 35.8 16.6 22.9 24.5 0.0
2010 36.6 16.5 22.6 24.0 0.0
2011 37.4 16.5 22.4 23.6 0.0
2012 38.2 16.5 22.1 23.1 0.0
2013 39.0 16.4 21.8 22.6 0.0

#M16F-54 © 2007 Frost & Sullivan www.frost.com August 2007 4-40
C h a r t 4 . 1 9
Anaesthesia Room CPT Market: Per cent of Revenues by Geographic Region (Europe),
2003-2013
Note: All figures are rounded; the base year is 2006. Source: Frost & Sullivan
Anaesthesia room procedure kit, being a relatively new market segment, has not gained any
specific country market. However, due to its tremendous potential and growth aspects, a
widespread acceptance across various geographical regions is expected within the forecast
period.
Market Share Analysis
Figure 4-19 and Chart 4.20 show the company market share by revenues for the European
anaesthesia room CPT market for 2006.
Note: All figures are rounded; the base year is 2006. Source: Frost & Sullivan
F i g u r e 4 - 1 9
Anaesthesia Room CPT Market: Company Market Share by Revenues (Europe), 2006
Company Market Share (%)
Becton Dickinson 89.2
B Braun 8.1
Smiths Medical 2.7
TOTAL 100.0
0%
20%
40%
60%
80%
100%
2003 2004 2005 2006 2007 2008 2009 2010 2011 2012 2013
Benelux and Scandinavia
Italy and Spain
United Kingdom
France
Germany

#M16F-54 © 2007 Frost & Sullivan www.frost.com August 2007 4-41
C h a r t 4 . 2 0
Anaesthesia Room CPT Market: Company Market Share by Revenues (Europe), 2006
Note: All figures are rounded; the base year is 2006. Source: Frost & Sullivan
Becton Dickinson is the market leader, holding 89.2 per cent share in the anaesthesia room
CPT market in 2006. BD Medical is among the world's leading suppliers of medical devices.
BD built its first manufacturing facility in the United States to produce syringes and needles
in 1906 and has been the leading innovator in injection and infusion-based drug delivery ever
since. The company offers a wide range of standard and custom regional anaesthesia trays
for spinal, epidural, combined spinal and epidural, peripheral block and pain management
procedures.
B Braun is a leading medical supplier of products for anaesthesia, intensive medicine, cardi-
ology, extra corporeal blood treatment and surgery, as well as services for hospitals, general
practitioners and the homecare sector. The company had a market share of 8.1 per cent in
2006. It provides a wide range of continuous epidural anaesthesia sets, combined spinal/
epidural anaesthesia sets and the unique over-the-needle system for continuous spinal
anaesthesia.
B Braun8.1%
Smiths Medical2.7%
Becton Dickinson89.2%

#M16F-54 © 2007 Frost & Sullivan www.frost.com August 2007 5-1
5Market Engineering Research for German
Custom Procedure Trays Market
G e r m a n C P T M a r k e t F o r e c a s t
Market Overview
The Federal Republic of Germany is situated in central Europe and it shares its borders with
France, Luxembourg, Belgium and the Netherlands. Germany had approximately 83 million
inhabitants in 2006, with 42.2 million women and 41.3 million men. The country's popula-
tion is decreasing as a result of low birth rate. Nevertheless, the average life expectancy is on
the rise, and is currently at 78.8 years. The aging population has a high impact on the health-
care needs and costs. Germany's healthcare expenditure in 2006 accounted for 11 per cent of
its GDP according to national accounting figures. However, with regard to the market for
cosmetic surgery, the Government does not reimburse costs incurred by patients despite the
increase in procedure numbers. Approximately 88 per cent of the population is covered by
Gesetzliche Krankenversicherung-GKV, the state statutory health care provider, and
9 per cent of the population is covered by private health insurance. Germany offers quality
healthcare to its citizens.
Diagnosis related groups (DRGs) were introduced on January 1, 2003 and have been made
mandatory from the beginning of 2004. Under this scheme, all treatments will be billed
according to the procedures listed in DRG, while hospital purchases of devices as well as
general spending will remain budgetary based.
Germany is the largest market for medical equipment, with a share of approximately
30 per cent of the European medical device market.

#M16F-54 © 2007 Frost & Sullivan www.frost.com August 2007 5-2
Market Engineering Measurements
Chart 5.1 presents the market engineering measurements for the German custom procedure
trays market for 2006.
C h a r t 5 . 1
Custom Procedure Trays Market: Market Engineering Measurements (Germany), 2006
Market Engineering Drives Market
Strategy and Planning
MarketEngineer
ChallengeIdentification
MarketResearch
MarketEngineering
System
Implementation
MarketPlanning
MarketStrategy
Note: All figures are rounded. Source: Frost & Sullivan
Market Forecasts
Figure 5-1 and Chart 5.2 show the revenue forecasts for the German custom procedure trays
market for the period 2003 to 2013.
Measurement Name Measurement Trend
Market age Growth stage ---
Revenues $134.0 million Increasing
Potential revenues (maximum future market size) $722.0 million Increasing
Base year market growth rate 21.5% Increasing
Compound annual growth rate 27.2% ---
Competitors (active market competitors in base year) 18 Stable
Average price $39 Increasing

#M16F-54 © 2007 Frost & Sullivan www.frost.com August 2007 5-3
Note: All figures are rounded; the base year is 2006. Source: Frost & Sullivan
C h a r t 5 . 2
Custom Procedure Trays Market: Revenue Forecasts (Germany), 2003-2013
Note: All figures are rounded; the base year is 2006. Source: Frost & Sullivan
F i g u r e 5 - 1
Custom Procedure Trays Market: Revenue Forecasts (Germany), 2003-2013
Revenue
Revenues Growth Rate
Year ($ Million) (%)
2003 79.5 ---
2004 92.8 16.8
2005 110.3 18.7
2006 134.0 21.5
2007 165.2 23.3
2008 206.1 24.8
2009 260.5 26.4
2010 332.0 27.4
2011 426.8 28.5
2012 553.3 29.6
2013 722.0 30.5
Compound Annual Growth Rate (2006-2013): 27.2%
0
100
200
300
400
500
600
700
800
2003 2004 2005 2006 2007 2008 2009 2010 2011 2012 2013
Year
Rev
enue
s ($
Mill
ion)
0
5
10
15
20
25
30
35
Gro
wth
Rat
e (%
)
Revenues ($ Million) Growth Rate (%)

#M16F-54 © 2007 Frost & Sullivan www.frost.com August 2007 5-4
The market has grown by 35.5 per cent since 2003.
The German custom procedure tray (CPT) market amounted to $134.0 million in 2006 and is
expected to reach $722.0 million by 2013, growing at a compound annual growth rate
(CAGR) of 27.2 per cent from 2006 to 2013. Due to the high population, the number of
surgeries performed is also high, contributing to the huge revenues in the operating room
(OR) CPT segment in Germany.
Angiography CPT Market
Figure 5-2 and Chart 5.3 show the revenue forecasts for the German Angiography CPT
market for the period 2003 to 2013.
Note: All figures are rounded; the base year is 2006. Source: Frost & Sullivan
F i g u r e 5 - 2
Angiography CPT Market: Revenue Forecasts (Germany), 2003-2013
Revenue
Revenues Growth Rate
Year ($ Million) (%)
2003 28.1 ---
2004 29.6 5.4
2005 31.3 5.7
2006 33.2 6.2
2007 35.3 6.2
2008 37.5 6.4
2009 40.0 6.7
2010 42.6 6.5
2011 45.3 6.2
2012 47.9 5.9
2013 50.8 5.9
Compound Annual Growth Rate (2006-2013): 6.3%

#M16F-54 © 2007 Frost & Sullivan www.frost.com August 2007 5-5
C h a r t 5 . 3
Angiography CPT Market: Revenue Forecasts (Germany), 2003-2013
Note: All figures are rounded; the base year is 2006. Source: Frost & Sullivan
The market was worth $33.2 million in 2006 and had grown by 11.1 per cent since 2003.
The largest number of angiography procedures take place in Germany and it is the most
extensively penetrated market. Hence, it is the largest market for angiography CPT in Europe
and has almost reached maturity. Despite this, the number of cardiovascular cases are
increasing and hospitals are integrating additional products into the angiography kit.
Ophthalmic CPT Market
Figure 5-3 and Chart 5.4 show the revenue forecasts for the German ophthalmic CPT market
from 2003 to 2013.
0
10
20
30
40
50
60
2003 2004 2005 2006 2007 2008 2009 2010 2011 2012 2013
Year
Rev
enue
s ($
Mill
ion)
0
1
2
3
4
5
6
7
8
Gro
wth
Rat
e (%
)
Revenues ($ Million) Growth Rate (%)

#M16F-54 © 2007 Frost & Sullivan www.frost.com August 2007 5-6
Note: All figures are rounded; the base year is 2006. Source: Frost & Sullivan
C h a r t 5 . 4
Ophthalmic CPT Market: Revenue Forecasts (Germany), 2003-2013
Note: All figures are rounded; the base year is 2006. Source: Frost & Sullivan
F i g u r e 5 - 3
Ophthalmic CPT Market: Revenue Forecasts (Germany), 2003-2013
Revenue
Revenues Growth Rate
Year ($ Million) (%)
2003 17.9 ---
2004 19.4 8.5
2005 21.1 8.7
2006 23.0 9.2
2007 25.1 9.2
2008 27.5 9.4
2009 30.0 9.3
2010 32.8 9.2
2011 35.8 9.3
2012 39.1 9.2
2013 42.7 9.0
Compound Annual Growth Rate (2006-2013): 9.2%
0
5
10
15
20
25
30
35
40
45
2003 2004 2005 2006 2007 2008 2009 2010 2011 2012 2013
Year
Rev
enue
s ($
Mill
ion)
0
1
2
3
4
5
6
7
8
9
10
Gro
wth
Rat
e (%
)
Revenues ($ Million) Growth Rate (%)

#M16F-54 © 2007 Frost & Sullivan www.frost.com August 2007 5-7
The market was worth $23.0 million in 2006 and has grown by 17.2 per cent since 2003. The
majority of this revenue was accounted by cataract surgeries. The pioneer in this field was
Alcon, which started assembling trays for ophthalmology since 1996-97 and is the undis-
puted market leader at present.
From 2003 to 2006, the share of eye surgeries performed using CPTs has increased from
40 per cent to 60 per cent. The cataract market is likely to reach maturity in the near future
and growth is expected in new techniques in eye surgery, particularly LASER surgeries.
The market is forecast to be worth $42.7 million in 2013, with a CAGR of 9.2 per cent from
2006 to 2013. The annual growth is likely to be around 9.2 per cent. The average selling
price was $37 in 2006, and it is likely to increase with DRGs in place.
Operating Room CPT Market
Figure 5-4 and Chart 5.5 show the revenue forecasts for the German operating room CPT
market from 2003 to 2013.
Note: All figures are rounded; the base year is 2006. Source: Frost & Sullivan
F i g u r e 5 - 4
Operating Room CPT Market: Revenue Forecasts (Germany), 2003-2013
Revenue
Revenues Growth Rate
Year ($ Million) (%)
2003 31.5 ---
2004 41.6 32.1
2005 55.4 33.2
2006 75.0 35.4
2007 101.7 35.6
2008 137.7 35.4
2009 186.7 35.6
2010 252.5 35.2
2011 341.1 35.1
2012 461.1 35.2
2013 623.0 35.1
Compound Annual Growth Rate (2006-2013): 35.3%

#M16F-54 © 2007 Frost & Sullivan www.frost.com August 2007 5-8
C h a r t 5 . 5
Operating Room CPT Market: Revenue Forecasts (Germany), 2003-2013
Note: All figures are rounded; the base year is 2006. Source: Frost & Sullivan
The market was worth $75.0 million in 2006 and has grown by 65.3 per cent since 2003.
This is mainly because of the small market size, underpenetration and the presence of a
number of CPT companies in Germany.
Significant growth and a marked increase in penetration are expected since hospitals are
switching over from draping sets to complete CPTs as part of optimizing the surgical
workflow.
The market is forecast to be worth $623.0 million in 2013, growing at a CAGR of
35.3 per cent for the period 2006 to 2013. The annual growth rate is likely to decrease as
penetration increases. The average selling price in 2006 was $55, which was the highest in
Europe, because of less penetration and therefore, less competition in Germany.
Anaesthesia Room CPT Market
Figure 5-5 and Chart 5.6 show the revenue forecasts for the German anaesthesia room CPT
market from 2003 to 2013.
0
100
200
300
400
500
600
700
2003 2004 2005 2006 2007 2008 2009 2010 2011 2012 2013
Year
Rev
enue
s ($
Mill
ion)
0
5
10
15
20
25
30
35
40
Gro
wth
Rat
e (%
)
Revenues ($ Million) Growth Rate (%)

#M16F-54 © 2007 Frost & Sullivan www.frost.com August 2007 5-9
Note: All figures are rounded; the base year is 2006. Source: Frost & Sullivan
C h a r t 5 . 6
Anaesthesia Room CPT Market: Revenue Forecasts (Germany), 2003-2013
Note: All figures are rounded; the base year is 2006. Source: Frost & Sullivan
The market was worth $2.8 million in 2006 and has grown by 19.3 per cent since 2003.
Though the growth potential for this market is huge, it is yet to tapped.
The anaesthesia room market in Germany is likely to reach $5.6 million by 2013, growing at
a steady CAGR of 10.4 per cent.
F i g u r e 5 - 5
Anaesthesia Room CPT Market: Revenue Forecasts (Germany), 2003-2013
Revenue
Revenues Growth Rate
Year ($ Million) (%)
2003 2.1 ---
2004 2.3 9.3
2005 2.5 10.0
2006 2.8 10.1
2007 3.1 10.2
2008 3.4 10.4
2009 3.8 10.5
2010 4.1 10.2
2011 4.6 10.3
2012 5.1 10.5
2013 5.6 10.9
Compound Annual Growth Rate (2006-2013): 10.4%
0
1
2
3
4
5
6
2003 2004 2005 2006 2007 2008 2009 2010 2011 2012 2013
Year
Rev
enue
s ($
Mill
ion)
0
2
4
6
8
10
12
Gro
wth
Rat
e (%
)Revenues ($ Million) Growth Rate (%)

#M16F-54 © 2007 Frost & Sullivan www.frost.com August 2007 6-1
6Market Engineering Research for the French
Custom Procedure Tray Market
F r e n c h C P T M a r k e t F o r e c a s t
Market Overview
France had a population of 62.7 million in 2006. The country's urbanisation process was
slower than the other European nations. However, since the 1950s, there has been a rapid
improvement. As a result of the decreasing fertility rates and increasing life expectancy, the
French population is aging. At present, French women have the second highest life expect-
ancy rate in the world. One in six French people is over 64 years of age. The aging
population is set to continue to rise, as 'baby boomers' are reaching old age, increasing the
demand for life style modifications.
The French healthcare system can be considered the 'best health system in the world', since
for approximately more than 95 per cent of the population, medical attention is either
entirely free of cost or reimbursed 100 per cent. The health insurance system is a branch of
the Social Security system and it provides less reimbursement to medical care providers in
France when compared to the other European countries. Nevertheless, 80 per cent of the
population has supplemental insurance, which is often provided by their employers.
Market Engineering Measurements
Chart 6.1 presents the market engineering measurements for the French custom procedure
trays market in 2006.

#M16F-54 © 2007 Frost & Sullivan www.frost.com August 2007 6-2
C h a r t 6 . 1
Custom Procedure Trays Market: Market Engineering Measurements (France), 2006
Market Engineering Drives Market
Strategy and Planning
MarketEngineer
ChallengeIdentification
MarketResearch
MarketEngineering
System
Implementation
MarketPlanning
MarketStrategy
Note: All figures are rounded. Source: Frost & Sullivan
Market Forecasts
Figure 6-1 and Chart 6.2 show the revenue forecasts for the French custom procedure trays
market for the period 2003 to 2013.
Measurement Name Measurement Trend
Market age Growth stage ---
Revenues $57.9 million Increasing
Potential revenues (maximum future market size) $195.7 million Increasing
Base year market growth rate 15.2% Increasing
Compound annual growth rate 19.0% ---
Competitors (active market competitors in base year) 18 Stable
Average price $37.35 Increasing

#M16F-54 © 2007 Frost & Sullivan www.frost.com August 2007 6-3
Note: All figures are rounded; the base year is 2006. Source: Frost & Sullivan
C h a r t 6 . 2
Custom Procedure Trays Market: Revenue Forecasts (France), 2003-2013
Note: All figures are rounded; the base year is 2006. Source: Frost & Sullivan
F i g u r e 6 - 1
Custom Procedure Trays Market: Revenue Forecasts (France), 2003-2013
Revenue
Revenues Growth Rate
Year ($ Million) (%)
2003 39.0 ---
2004 44.1 13.1
2005 50.3 14.0
2006 57.9 15.2
2007 67.2 16.1
2008 78.6 17.0
2009 92.7 18.0
2010 110.4 19.1
2011 132.4 19.9
2012 160.2 21.0
2013 195.7 22.1
Compound Annual Growth Rate (2006-2013): 19.0%
0
50
100
150
200
250
2003 2004 2005 2006 2007 2008 2009 2010 2011 2012 2013
Year
Rev
enue
s ($
Mill
ion)
0
5
10
15
20
25
Gro
wth
Rat
e (%
)
Revenues ($ Million) Growth Rate (%)

#M16F-54 © 2007 Frost & Sullivan www.frost.com August 2007 6-4
The French custom procedure trays market valued at $57.9 million in 2006. It has grown at
27.1 per cent since 2003. The angiography and ophthalmic CPT segments are well pene-
trated, and therefore, are estimated to witness slow growth in the future.
The OR segment, which was not penetrated in the past, has shown a growth of 60.2 per cent
since 2003. This is mainly because of the increase in the number of surgeries and the
increased acceptance of the benefits of using CPT for OR procedures. The market is esti-
mated to grow at a rapid pace and reach $195.7 million by 2013. The CAGR from 2006 to
2013 is expected to be 19.0 per cent.
Angiography CPT Market
Figure 6-2 and Chart 6.3 show the revenue forecasts for the French angiography CPT market
for the period 2003 to 2013.
Note: All figures are rounded; the base year is 2006. Source: Frost & Sullivan
F i g u r e 6 - 2
Angiography CPT Market: Revenue Forecasts (France), 2003-2013
Revenue
Revenues Growth Rate
Year ($ Million) (%)
2003 17.9 ---
2004 20.2 12.4
2005 22.7 12.7
2006 25.7 13.1
2007 29.1 13.3
2008 33.0 13.5
2009 37.5 13.6
2010 42.6 13.6
2011 48.2 13.1
2012 54.6 13.2
2013 61.7 13.0
Compound Annual Growth Rate (2006-2013): 13.3%

#M16F-54 © 2007 Frost & Sullivan www.frost.com August 2007 6-5
C h a r t 6 . 3
Angiography CPT Market: Revenue Forecasts (France), 2003-2013
Note: All figures are rounded; the base year is 2006. Source: Frost & Sullivan
The market was worth $25.7 million in 2006 and has grown by 25.1 per cent since 2003. The
French angiography CPT market is reaching maturity, but not as quickly as the German and
the UK markets. The number of cathlab procedures is increasing and this is the reason for the
growth in the number of CPT units. The annual growth is likely to slow down as penetration
increases. The market is forecast to be worth $61.7 million in 2013, with a CAGR of
13.3 per cent from 2006 to 2013.
Ophthalmic CPT Market
Figure 6-3 and Chart 6.4 show the revenue forecasts for the French ophthalmic CPT market
for the period 2003 to 2013.
0
10
20
30
40
50
60
70
2003 2004 2005 2006 2007 2008 2009 2010 2011 2012 2013
Year
Rev
enue
s ($
Mill
ion)
0
2
4
6
8
10
12
14
16
Gro
wth
Rat
e (%
)
Revenues ($ Million) Growth Rate (%)

#M16F-54 © 2007 Frost & Sullivan www.frost.com August 2007 6-6
Note: All figures are rounded; the base year is 2006. Source: Frost & Sullivan
C h a r t 6 . 4
Ophthalmic CPT Market: Revenue Forecasts (France), 2003-2013
Note: All figures are rounded; the base year is 2006. Source: Frost & Sullivan
F i g u r e 6 - 3
Ophthalmic CPT Market: Revenue Forecasts (France), 2003-2013
Revenue
Revenues Growth Rate
Year ($ Million) (%)
2003 13.9 ---
2004 14.9 7.2
2005 16.0 7.7
2006 17.3 8.0
2007 18.7 8.0
2008 20.2 8.1
2009 21.9 8.2
2010 23.7 8.3
2011 25.7 8.4
2012 27.8 8.3
2013 30.1 8.2
Compound Annual Growth Rate (2006-2013): 8.2%
0
5
10
15
20
25
30
35
2003 2004 2005 2006 2007 2008 2009 2010 2011 2012 2013
Year
Rev
enue
s ($
Mill
ion)
0
1
2
3
4
5
6
7
8
9
Gro
wth
Rat
e (%
)
Revenues ($ Million) Growth Rate (%)

#M16F-54 © 2007 Frost & Sullivan www.frost.com August 2007 6-7
The market was worth $17.3 million in 2006 and has grown by 14.9 per cent since 2003. The
majority of this revenue was accounted by cataract surgeries. The pioneer in this field was
Alcon, which started assembling trays for ophthalmology since 1996-97 and is the undis-
puted market leader at present.
From 2003 to 2006, the number of eye surgeries performed using CPTs has increased in
France by 8 per cent. The cataract market is likely to reach maturity in the near future and
growth is expected in new techniques in eye surgery, particularly LASER surgeries. The
market is forecast to be worth $30.1 million in 2013, with a CAGR of 8.2 per cent from
2006 to 2013.
Operating Room CPT Market
Figure 6-4 and Chart 6.5 show the revenue forecasts for the French operating room CPT
market from 2003 to 2013.
Note: All figures are rounded; the base year is 2006. Source: Frost & Sullivan
F i g u r e 6 - 4
Operating Room CPT Market: Revenue Forecasts (France), 2003-2013
Revenue
Revenues Growth Rate
Year ($ Million) (%)
2003 6.0 ---
2004 7.8 30.2
2005 10.2 30.7
2006 13.5 32.3
2007 17.9 32.6
2008 23.8 32.7
2009 31.6 33.0
2010 42.2 33.7
2011 56.5 33.8
2012 75.7 33.9
2013 101.6 34.2
Compound Annual Growth Rate (2006-2013): 33.4%

#M16F-54 © 2007 Frost & Sullivan www.frost.com August 2007 6-8
C h a r t 6 . 5
Operating Room CPT Market: Revenue Forecasts (France), 2003-2013
Note: All figures are rounded; the base year is 2006. Source: Frost & Sullivan
The market was worth $13.5 million in 2006 and has grown by 60.9 per cent since 2003.
This enormous growth was mainly due to the small size of the market,its high potential and
under penetrated state. Significant market growth and a marked increase in penetration are
expected in the future.In France, the OR CPT market is dominated by Cardinal, which is
driving the move towards CPT.
The market is forecast to be worth $101.6 million in 2013, growing at a CAGR of
33.4 per cent from 2006 to 2013.
Anaesthesia Room CPT Market
Figure 6-5 and Chart 6.6 show the revenue forecasts for the French anaesthesia room CPT
market from 2003 to 2013.
0
20
40
60
80
100
120
2003 2004 2005 2006 2007 2008 2009 2010 2011 2012 2013
Year
Rev
enue
s ($
Mill
ion)
0
5
10
15
20
25
30
35
40
Gro
wth
Rat
e (%
)
Revenues ($ Million) Growth Rate (%)

#M16F-54 © 2007 Frost & Sullivan www.frost.com August 2007 6-9
Note: All figures are rounded; the base year is 2006. Source: Frost & Sullivan
C h a r t 6 . 6
Anaesthesia Room CPT Market: Revenue Forecasts (France), 2003-2013
Note: All figures are rounded; the base year is 2006. Source: Frost & Sullivan
The market was worth $1.4 million in 2006 and has grown by 13.7 per cent since 2003.
The anaesthesia room market in France is likely to reach $2.4 million by 2013, growing at asteady CAGR of 7.7 per cent from 2006 to 2013.
F i g u r e 6 - 5
Anaesthesia Room CPT Market: Revenue Forecasts (France), 2003-2013
Revenue
Revenues Growth Rate
Year ($ Million) (%)
2003 1.1 ---
2004 1.2 6.8
2005 1.3 6.9
2006 1.4 7.3
2007 1.5 7.5
2008 1.6 7.5
2009 1.7 7.9
2010 1.9 7.5
2011 2.0 7.8
2012 2.2 7.9
2013 2.4 7.9
Compound Annual Growth Rate (2006-2013): 7.7%
0.0
0.5
1.0
1.5
2.0
2.5
3.0
2003 2004 2005 2006 2007 2008 2009 2010 2011 2012 2013
Year
Rev
enue
s ($
Mill
ion)
0.0
1.0
2.0
3.0
4.0
5.0
6.0
7.0
8.0
9.0
Gro
wth
Rat
e (%
)
Revenues ($ Million) Growth Rate (%)

#M16F-54 © 2007 Frost & Sullivan www.frost.com August 2007 7-1
7Market Engineering Research for The
United Kingdom Custom Procedure Trays
Market
T h e U n i t e d K i n g d o m C P T M a r k e t F o r e c a s t
Market Overview
The United Kingdom consists of England, Scotland, Wales and northern Ireland. The country
had a population of 60,609,153 in 2006. It had one of the largest medical device markets in
the world, valued at $7.6 billion in 2006. The domestic market is the third largest in Europe,
after Germany and France. Its healthcare expenditure as a per cent of GDP was about
8.4 per cent in 2006.
The United Kingdom has a high life expectancy ratio; women continue to have a higher life
expectancy (80.5 years) than men (75.8 years). As the length of life increases, older people
respond to lifestyle changes that can increase healthy years of life.
Within each county, the responsibility for purchasing health services is being devolved to
local bodies (Primary Care Trusts in England, Health Boards in Scotland, local health groups
in Wales and Primary Care Partnerships in Northern Ireland). Primary care services are
mainly provided by general practitioners and multi-professional teams in health centres
(under a capitated budget). Hospitals are mostly publicly owned, with independent trust
status. Private hospitals mainly provide services to privately insured patients or those who
are willing to pay out of their pockets. The National Health Service (NHS) principally
provides healthcare facilities to the entire United Kingdom.
About 11.5 per cent of the United Kingdom's population has supplementary private medical
insurance (according to Laing and Buisson 2001 Research). Those most likely to possess
private medical insurance are in the higher income groups, hence, even though most cosmetic
procedures are not reimbursed, they can afford to have a procedure done.

#M16F-54 © 2007 Frost & Sullivan www.frost.com August 2007 7-2
The healthcare sector in the United Kingdom has been underfunded than most of the other
western European countries for the last two decades. Long waiting lists for hospital appoint-
ments and poor quality hospital buildings are two manifestations of this situation.
A Modernisation Board has been set up to drive these changes through resolve these issues.
A Commission for Health Improvement has been set up to monitor and improve perform-
ance. Despite these initiatives, many people remain concerned whether the improvements are
achievable in the time set by the Government.
Market Engineering Measurements
Chart 7.1 presents the market engineering measurements for the United Kingdom custom
procedure trays market for 2006.
C h a r t 7 . 1
Custom Procedure Trays Market: Market Engineering Measurements (The United Kingdom),
2006
Market Engineering Drives Market
Strategy and Planning
MarketEngineer
ChallengeIdentification
MarketResearch
MarketEngineering
System
Implementation
MarketPlanning
MarketStrategy
Note: All figures are rounded. Source: Frost & Sullivan
Measurement Name Measurement Trend
Market age Growth stage ---
Revenues $60.8 million Increasing
Potential revenues (maximum future market size) $273.8 million Increasing
Base year market growth rate 20.8% Increasing
Compound annual growth rate 24.0% ---
Competitors (active market competitors in base year) 16 Stable
Average price $35.23 Increasing

#M16F-54 © 2007 Frost & Sullivan www.frost.com August 2007 7-3
Market Forecasts
Figure 7-1 and Chart 7.2 show the revenue forecasts for the United Kingdom custom proce-
dure trays market for the period 2003 to 2013.
Note: All figures are rounded; the base year is 2006. Source: Frost & Sullivan
C h a r t 7 . 2
Custom Procedure Trays Market: Revenue Forecasts (The United Kingdom), 2003-2013
Note: All figures are rounded; the base year is 2006. Source: Frost & Sullivan
F i g u r e 7 - 1
Custom Procedure Trays Market: Revenue Forecasts (The United Kingdom), 2003-2013
Revenue
Revenues Growth Rate
Year ($ Million) (%)
2003 35.4 ---
2004 42.1 18.7
2005 50.3 19.7
2006 60.8 20.8
2007 74.0 21.7
2008 90.6 22.5
2009 111.7 23.2
2010 138.7 24.1
2011 173.2 24.9
2012 217.1 25.4
2013 273.8 26.1
Compound Annual Growth Rate (2006-2013): 24.0%
0
50
100
150
200
250
300
2003 2004 2005 2006 2007 2008 2009 2010 2011 2012 2013
Year
Rev
enue
s ($
Mill
ion)
0
5
10
15
20
25
30
Gro
wth
Rat
e (%
)
Revenues ($ Million) Growth Rate (%)

#M16F-54 © 2007 Frost & Sullivan www.frost.com August 2007 7-4
The United Kingdom custom procedure tray market amounted to $60.8 million in 2006. It
has grown by 38.4 per cent since 2003. The United Kingdom angiography market has devel-
oped rapidly since 2001. It is estimated to witness good growth until 2009, but eventually
slow down towards the end of the forecast period. The ophthalmology market, though not as
well penetrated as the angiography market, displays a stable and slow growth because the
United Kingdom market is relatively less developed than France and Spain in terms of
ophthalmic procedures. The OR market is the least penetrated. The potential for the
OR segment is very high, and therefore, this segment is estimated to experience maximum
growth.
Angiography CPT Market
Figure 7-2 and Chart 7.3 show the revenue forecasts for the United Kingdom angiography
CPT market for the period 2003 to 2013.
Note: All figures are rounded; the base year is 2006. Source: Frost & Sullivan
F i g u r e 7 - 2
Angiography CPT Market: Revenue Forecasts (The United Kingdom), 2003-2013
Revenue
Revenues Growth Rate
Year ($ Million) (%)
2003 2.0 ---
2004 2.2 12.0
2005 2.5 12.1
2006 2.8 12.1
2007 3.1 12.3
2008 3.5 12.3
2009 4.0 12.5
2010 4.5 12.6
2011 5.0 12.7
2012 5.7 12.3
2013 6.3 12.1
Compound Annual Growth Rate (2006-2013): 12.4%

#M16F-54 © 2007 Frost & Sullivan www.frost.com August 2007 7-5
C h a r t 7 . 3
Angiography CPT Market: Revenue Forecasts (The United Kingdom), 2003-2013
Note: All figures are rounded; the base year is 2006. Source: Frost & Sullivan
The market was worth $2.8 million in 2006 and has grown by 24.1 per cent since 2003.
The angiography market in the United Kingdom is not as well developed as Germany but haswitnessed a very rapid growth since 2001.
Ophthalmic CPT Market
Figure 7-3 and Chart 7.4 show the revenue forecasts for the United Kingdom ophthalmic
CPT market from 2003 to 2013.
0
1
2
3
4
5
6
7
2003 2004 2005 2006 2007 2008 2009 2010 2011 2012 2013
Year
Rev
enue
s ($
Mill
ion)
0
2
4
6
8
10
12
14
Gro
wth
Rat
e (%
)
Revenues ($ Million) Growth Rate (%)

#M16F-54 © 2007 Frost & Sullivan www.frost.com August 2007 7-6
Note: All figures are rounded; the base year is 2006. Source: Frost & Sullivan
C h a r t 7 . 4
Ophthalmic CPT Market: Revenue Forecasts (The United Kingdom), 2003-2013
Note: All figures are rounded; the base year is 2006. Source: Frost & Sullivan
F i g u r e 7 - 3
Ophthalmic CPT Market: Revenue Forecasts (The United Kingdom), 2003-2013
Revenue
Revenues Growth Rate
Year ($ Million) (%)
2003 11.0 ---
2004 11.8 7.0
2005 12.6 7.1
2006 13.5 7.2
2007 14.5 7.4
2008 15.6 7.5
2009 16.8 7.8
2010 18.1 7.8
2011 19.5 7.9
2012 21.1 7.8
2013 22.7 7.9
Compound Annual Growth Rate (2006-2013): 7.7%
0
5
10
15
20
25
2003 2004 2005 2006 2007 2008 2009 2010 2011 2012 2013
Year
Rev
enue
s ($
Mill
ion)
0
1
2
3
4
5
6
7
8
9
Gro
wth
Rat
e (%
)
Revenues ($ Million) Growth Rate (%)

#M16F-54 © 2007 Frost & Sullivan www.frost.com August 2007 7-7
The market was worth $13.5 million in 2006 and has grown by 14.1 per cent since 2003. The
majority of this revenue was held by cataract surgeries. The pioneer in the field was Alcon,
which started assembling trays for ophthalmology since 1996-97 and is the current dominant
participant.
From 2003 to 2006, the number of eye surgeries performed using CPTs has increased in the
United Kingdom by 15.6 per cent. The cataract market is likely to reach maturity in the near
future and hence, growth will primarily result from new techniques in eye surgery, particu-
larly LASER surgeries.
The market is forecast to be worth $22.7 million in 2013, with a CAGR of 7.7 per cent from
2006 to 2013.
Operating Room CPT Market
Figure 7-4 and Chart 7.5 show the revenue forecasts for the United Kingdom operating room
CPT market from 2003 to 2013.
Note: All figures are rounded; the base year is 2006. Source: Frost & Sullivan
F i g u r e 7 - 4
Operating Room CPT Market: Revenue Forecasts (The United Kingdom), 2003-2013
Revenue
Revenues Growth Rate
Year ($ Million) (%)
2003 20.6 ---
2004 26.1 26.9
2005 33.2 27.1
2006 42.3 27.6
2007 54.1 27.8
2008 69.1 27.8
2009 88.4 27.9
2010 113.4 28.3
2011 145.7 28.5
2012 187.3 28.6
2013 241.5 28.9
Compound Annual Growth Rate (2006-2013): 28.3%

#M16F-54 © 2007 Frost & Sullivan www.frost.com August 2007 7-8
C h a r t 7 . 5
Operating Room CPT Market: Revenue Forecasts (The United Kingdom), 2003-2013
Note: All figures are rounded; the base year is 2006. Source: Frost & Sullivan
The market was worth $42.3 million in 2006 and has grown by 54.0 per cent since 2003. The
OR CPT market in the United Kingdom developed the most since 2003 displaying a stable
growth rate. The United Kingdom is also highly developed in general surgery and was among
the early few to start using CPTs for OR procedures.
The market is forecast to be worth $241.5 million in 2013, with a CAGR of 28.3 per cent
from 2006 to 2013.
Anaesthesia Room CPT Market
Figure 7-5 and Chart 7.6 show the revenue forecasts for the United Kingdom anaesthesia
room CPT market from 2003 to 2013.
0
50
100
150
200
250
300
2003 2004 2005 2006 2007 2008 2009 2010 2011 2012 2013
Year
Rev
enue
s ($
Mill
ion)
0
5
10
15
20
25
30
35
Gro
wth
Rat
e (%
)
Revenues ($ Million) Growth Rate (%)

#M16F-54 © 2007 Frost & Sullivan www.frost.com August 2007 7-9
Note: All figures are rounded; the base year is 2006. Source: Frost & Sullivan
C h a r t 7 . 6
Anaesthesia Room CPT Market: Revenue Forecasts (The United Kingdom), 2003-2013
Note: All figures are rounded; the base year is 2006. Source: Frost & Sullivan
The market was worth $2.2 million in 2006 and has grown by 10.4 per cent since 2003.
Though the growth potential for this market is huge, it is yet to tapped.
The anaesthesia room CPT market in the United Kingdom is likely to reach $3.3 million by
2013, growing at a CAGR of 5.8 per cent.
F i g u r e 7 - 5
Anaesthesia Room CPT Market: Revenue Forecasts (The United Kingdom), 2003-2013
Revenue
Revenues Growth Rate
Year ($ Million) (%)
2003 1.9 ---
2004 2.0 5.1
2005 2.1 5.3
2006 2.2 5.2
2007 2.3 5.2
2008 2.4 5.3
2009 2.6 5.7
2010 2.7 5.8
2011 2.9 5.9
2012 3.1 6.2
2013 3.3 6.3
Compound Annual Growth Rate (2006-2013): 5.8%
0.0
0.5
1.0
1.5
2.0
2.5
3.0
3.5
2003 2004 2005 2006 2007 2008 2009 2010 2011 2012 2013
Year
Rev
enue
s ($
Mill
ion)
0.0
1.0
2.0
3.0
4.0
5.0
6.0
7.0
Gro
wth
Rat
e (%
)Revenues ($ Million) Growth Rate (%)

#M16F-54 © 2007 Frost & Sullivan www.frost.com August 2007 8-1
8Market Engineering Research for Italian and
Spanish Custom Procedure Trays Market
I t a l i a n a n d S p a n i s h C P T M a r k e t F o r e c a s t
Market Overview
Italy has a population of 58.1 million, about 20 per cent of which is above the age of 65. The
country has the highest elderly population in the world. The average life expectancy is more
for females (82 years), with males live up to the age of 76 years. All the senior citizens in
Italy have high disposable incomes to spend for elective cosmetic procedures. The Italian
healthcare system is a regionally based National Health Service (NHS) that provides
universal coverage free of charge.
Spain had a population of 40.3 million in 2006. The younger population is slightly higher in
this country than in other countries in the European Union (EU). However, there is a signifi-
cant reduction in birth rates, together with the trend of an increasing aging population. Spain
is presently one among the countries that have a decreasing population range. Similar to a
few European nations, Spain has a public (national) health system, which provides free or
low-cost healthcare for those contributing to the Spanish social security systems.
Italy and Spain have certain common factors that restrain the growth of CPT, like the govern-
mental regulations towards reusing surgical products. Due to budgetary constraints, the
governments do not insist much on single-use products, resulting in a negative impact on the
CPT market, which is a combination of single-use products for a particular type of
procedure.

#M16F-54 © 2007 Frost & Sullivan www.frost.com August 2007 8-2
Market Engineering Measurements
Chart 8.1 presents the market engineering measurements for the Italian and Spanish custom
procedure trays market for 2006.
C h a r t 8 . 1
Custom Procedure Trays Market: Market Engineering Measurements (Italy and Spain), 2006
Market Engineering Drives Market
Strategy and Planning
MarketEngineer
ChallengeIdentification
MarketResearch
MarketEngineering
System
Implementation
MarketPlanning
MarketStrategy
Note: All figures are rounded. Source: Frost & Sullivan
Market Forecasts
Figure 8-1 and Chart 8.2 show the revenue forecasts for the Italian and Spanish custom
procedure trays market for the period 2003 to 2013.
Measurement Name Measurement Trend
Market age Growth ---
Market revenues (2006) $83.4 million Increasing
Potential revenues (2013) $286.8 million Increasing
Base year market growth rate (2006) 15.0% Increasing
Compound annual growth rate (2006-2013) 19.3% ---
Active competitors 12 Stable
Average price $37.43 Increasing

#M16F-54 © 2007 Frost & Sullivan www.frost.com August 2007 8-3
Note: All figures are rounded; the base year is 2006. Source: Frost & Sullivan
C h a r t 8 . 2
Custom Procedure Trays Market: Revenue Forecasts (Italy and Spain), 2003-2013
Note: All figures are rounded; the base year is 2006. Source: Frost & Sullivan
F i g u r e 8 - 1
Custom Procedure Trays Market: Revenue Forecasts (Italy and Spain), 2003-2013
Revenue
Revenues Growth Rate
Year ($ Million) (%)
2003 56.6 ---
2004 63.8 12.6
2005 72.5 13.7
2006 83.4 15.0
2007 96.8 16.1
2008 113.4 17.1
2009 134.0 18.2
2010 160.2 19.5
2011 192.9 20.4
2012 234.0 21.3
2013 286.8 22.6
Compound Annual Growth Rate (2006-2013): 19.3%
0
50
100
150
200
250
300
350
2003 2004 2005 2006 2007 2008 2009 2010 2011 2012 2013
Year
Rev
enue
s ($
Mill
ion)
0
5
10
15
20
25
Gro
wth
Rat
e (%
)
Revenues ($ Million) Growth Rate (%)

#M16F-54 © 2007 Frost & Sullivan www.frost.com August 2007 8-4
The Italian and Spanish custom procedure trays market valued at $83.4 million in 2006. It
has grown by 26.3 per cent since 2003.
The angiography and ophthalmic CPT markets have developed relatively well. They are esti-
mated to show a small growth until 2009, but are eventually likely to slow down towards the
end of the forecast period. The ophthalmic CPT market is the most developed in Italy, and
therefore, displays maximum penetration. The OR market is the least penetrated. The poten-
tial for the OR segment is very high, and therefore, this segment is estimated to experience
maximum growth.
Angiography CPT Market
Figure 8-2 and Chart 8.3 show the revenue forecasts for the Italian and Spanish angiography
CPT market from 2003 to 2013.
Note: All figures are rounded; the base year is 2006. Source: Frost & Sullivan
F i g u r e 8 - 2
Angiography CPT Market: Revenue Forecasts (Italy and Spain), 2003-2013
Revenue
Revenues Growth Rate
Year ($ Million) (%)
2003 22.1 ---
2004 23.6 6.8
2005 25.2 7.1
2006 27.1 7.4
2007 29.1 7.4
2008 31.3 7.5
2009 33.7 7.8
2010 36.4 7.9
2011 39.1 7.4
2012 41.9 7.2
2013 44.9 7.1
Compound Annual Growth Rate (2006-2013): 7.5%

#M16F-54 © 2007 Frost & Sullivan www.frost.com August 2007 8-5
C h a r t 8 . 3
Angiography CPT Market: Revenue Forecasts (Italy and Spain), 2003-2013
Note: All figures are rounded; the base year is 2006. Source: Frost & Sullivan
The market was worth $27.1 million in 2006 and has grown by 13.9 per cent since 2003. The
angiography market in Italy and Spain is not as well developed as the other countries in
Europe but has experienced some growth since 2000.
The annual growth is likely to slow down and the only driver for further penetration would
be an increase in the number of procedures, which has not been substantial in the past. The
market is forecast to be worth $44.9 million in 2013, with a CAGR of 7.5 per cent from
2006 to 2013.
Ophthalmic CPT Market
Figure 8-3 and Chart 8.4 show the revenue forecasts for the Italian and Spanish ophthalmic
CPT market from 2003 to 2013.
0
5
10
15
20
25
30
35
40
45
50
2003 2004 2005 2006 2007 2008 2009 2010 2011 2012 2013
Year
Rev
enue
s ($
Mill
ion)
0
1
2
3
4
5
6
7
8
9
Gro
wth
Rat
e (%
)
Revenues ($ Million) Growth Rate (%)

#M16F-54 © 2007 Frost & Sullivan www.frost.com August 2007 8-6
Note: All figures are rounded; the base year is 2006. Source: Frost & Sullivan
C h a r t 8 . 4
Ophthalmic CPT Market: Revenue Forecasts (Italy and Spain), 2003-2013
Note: All figures are rounded; the base year is 2006. Source: Frost & Sullivan
F i g u r e 8 - 3
Ophthalmic CPT Market: Revenue Forecasts (Italy and Spain), 2003-2013
Revenue
Revenues Growth Rate
Year ($ Million) (%)
2003 16.7 ---
2004 17.8 6.1
2005 18.9 6.3
2006 20.1 6.5
2007 21.5 6.9
2008 23.0 7.0
2009 24.6 7.2
2010 26.4 7.3
2011 28.3 7.1
2012 30.3 7.0
2013 32.5 7.1
Compound Annual Growth Rate (2006-2013): 7.1%
0
5
10
15
20
25
30
35
2003 2004 2005 2006 2007 2008 2009 2010 2011 2012 2013
Year
Rev
enue
s ($
Mill
ion)
0
1
2
3
4
5
6
7
8
Gro
wth
Rat
e (%
)
Revenues ($ Million) Growth Rate (%)

#M16F-54 © 2007 Frost & Sullivan www.frost.com August 2007 8-7
The market was worth $20.1 million in 2006 and has grown by 12.4 per cent since 2003. The
majority of this revenue was accounted by cataract surgeries. The pioneer in the field was
Alcon, which started assembling trays for ophthalmology since 1996-97 and is undoubtedly
the market leader today.
From 2001 to 2003, the number of eye surgeries has increased, especially in Spain, but not as
much as France and Germany. The cataract market is not as penetrated as in the
United Kingdom, France and Germany and is the main driver for CPT. The market is forecast
to be worth $32.5 million in 2013, growing at a CAGR of 7.1 per cent from 2006 to 2013.
Operating Room CPT Market
Figure 8-4 and Chart 8.5 show the revenue forecasts for the Italian and Spanish operating
room CPT market for the period 2003 to 2013.
Note: All figures are rounded; the base year is 2006. Source: Frost & Sullivan
F i g u r e 8 - 4
Operating Room CPT Market: Revenue Forecasts (Italy and Spain), 2003-2013
Revenue
Revenues Growth Rate
Year ($ Million) (%)
2003 16.2 ---
2004 20.7 28.1
2005 26.6 28.3
2006 34.2 28.8
2007 44.1 28.9
2008 56.8 28.9
2009 73.2 28.9
2010 94.8 29.4
2011 122.7 29.5
2012 158.8 29.4
2013 206.3 29.9
Compound Annual Growth Rate (2006-2013): 29.3%

#M16F-54 © 2007 Frost & Sullivan www.frost.com August 2007 8-8
C h a r t 8 . 5
Operating Room CPT Market: Revenue Forecasts (Italy and Spain), 2003-2013
Note: All figures are rounded; the base year is 2006. Source: Frost & Sullivan
The market was worth $34.2 million in 2006 and has grown by 56.3 per cent since 2003. The
OR CPT market in Italy and Spain is highly underpenetrated, with price being the main
restraint. Though the market has shown considerable growth since 2000, focussed
campaigning for the usage of CPT is required. The market is forecast to be worth
$206.3 million in 2013, with a CAGR of 29.3 per cent from 2006 to 2013.
Anaesthesia Room CPT Market
Figure 8-5 and Chart 8.6 show the revenue forecasts for the Italian and Spanish anaesthesia
room CPT market from 2003 to 2013.
0
50
100
150
200
250
2003 2004 2005 2006 2007 2008 2009 2010 2011 2012 2013
Year
Rev
enue
s ($
Mill
ion)
0
5
10
15
20
25
30
35
Gro
wth
Rat
e (%
)
Revenues ($ Million) Growth Rate (%)

#M16F-54 © 2007 Frost & Sullivan www.frost.com August 2007 8-9
Note: All figures are rounded; the base year is 2006. Source: Frost & Sullivan
C h a r t 8 . 6
Anaesthesia Room CPT Market: Revenue Forecasts (Italy and Spain), 2003-2013
Note: All figures are rounded; the base year is 2006. Source: Frost & Sullivan
The market was worth $2.0 million in 2006 and has grown by 11.2 per cent since 2003.
Though the growth potential for this market is huge, it is yet to tapped.
The anaesthesia room CPT market in Italy and Spain is likely to reach $3.1 million by 2013,
growing at a steady CAGR of 6.7 per cent from 2006 to 2013.
F i g u r e 8 - 5
Anaesthesia Room CPT Market: Revenue Forecasts (Italy and Spain), 2003-2013
Revenue
Revenues Growth Rate
Year ($ Million) (%)
2003 1.7 ---
2004 1.8 5.4
2005 1.9 5.8
2006 2.0 5.9
2007 2.1 6.2
2008 2.3 6.3
2009 2.4 6.5
2010 2.6 6.7
2011 2.7 6.8
2012 2.9 6.9
2013 3.1 7.2
Compound Annual Growth Rate (2006-2013): 6.7%
0.0
0.5
1.0
1.5
2.0
2.5
3.0
3.5
2003 2004 2005 2006 2007 2008 2009 2010 2011 2012 2013
Year
Rev
enue
s ($
Mill
ion)
0.0
1.0
2.0
3.0
4.0
5.0
6.0
7.0
8.0G
row
th R
ate
(%)
Revenues ($ Million) Growth Rate (%)

#M16F-54 © 2007 Frost & Sullivan www.frost.com August 2007 9-1
9Market Engineering Research for Benelux and
Scandinavia Custom Procedure Trays Market
B e n e l u x a n d S c a n d i n a v i a C P T M a r k e t
F o r e c a s t
Market Overview
Benelux includes the countries of Belgium, the Netherlands and Luxembourg. This studyincludes only Belgium and the Netherlands, since the CPT market is not very significant inLuxembourg. The population of Benelux was 27.34 million in 2006.
H e a l t h c a r e S y s t e m i n B e l g i u m
Belgium is a federal state wherein healthcare is mainly managed and delivered by privatenon-profit organisations, but funded by the public sector. Belgium has the highest number ofprivate hospitals, reflecting the independent status of the private health sector. The revenuesand profit generated are invested for the development of new equipment and technology.Unlike Germany and the Netherlands, Belgium does not have a referral system of healthcare.Patients are allowed to choose any practitioner of their choice. Similar to the other Europeancountries, Belgium also has an increasing aging population, which puts more/exerts addi-tional pressure on the social security and healthcare systems. Belgium ranked first in the listof best countries for heart treatment in Europe according to a European Heart Journal anal-ysis of 24 European nations. Hygiene and post-operative care is first rate in Belgium. Thecountry has been proven to be free of MRSA (Methicillin Resistent Staphylococcus Aureus),which is a major source of secondary infections. Reimbursement rates are higher than othercountries and most people have additional insurance covering the reminder of the costs.
H e a l t h c a r e S y s t e m i n T h e N e t h e r l a n d s
Private health care currently plays a minor role in the Dutch healthcare system, but issteadily growing. Even the existing facilities have been strictly regulated by the Governmentwith regard to their functioning and pricing. Healthcare is funded through public and privateinsurance schemes.

#M16F-54 © 2007 Frost & Sullivan www.frost.com August 2007 9-2
In the Netherlands, the Health Insurance Act came into force on 1 January 2006. This reform
requires all residents to join a private insurance scheme to cover basic healthcare expenses.
This new system is strictly monitored by the State to safeguard the social nature of insurance.
Insurers have to provide all residents with an insurance coverage regardless of their age,
gender or physical conditions.
Scandinavia includes the countries of Norway, Sweden, Finland and Denmark. This region
had a population of 24.3 million in 2006.
H e a l t h c a r e S y s t e m i n D e n m a r k
The public sector is responsible for most of the healthcare spending in Denmark. The Danish
healthcare delivery system is shared between three parties: Private (self employed) practi-
tioners, hospitals and municipal services. Primary healthcare is essentially provided by
private practitioners and municipal health services. Unlike other countries the quality of
healthcare delivery is good, resulting in an increased average life expectancy of the people.
The Danish healthcare system has undergone a number of significant improvements since
1997. A gradual change can be witnessed in the way healthcare is delivered within the overall
framework of a tax financed, decentralised healthcare system. The focus, at present, is more
on increasing efficiency, reducing waiting times and improving quality.
H e a l t h c a r e S y s t e m i n S w e d e n
In Sweden, the healthcare system runs mostly through public funds, which are quite compre-
hensive. Physicians and hospitals charge a minimum fee, and their services are funded
through a taxation scheme of the County Councils of Sweden.
H e a l t h c a r e S y s t e m i n F i n l a n d
In Finland, healthcare services are being provided by the public sector. Municipalities are
responsible for arranging all the basic services. The Ministry of Social Affairs and Health
directs and guides social and health services at the national level. It defines general social and
health policy, prepares major reforms and proposals for legislation, monitors their implemen-
tation and assists the government in decision making.
H e a l t h c a r e S y s t e m i n N o r w a y
The Norwegian healthcare system is publicly funded. The healthcare network is divided into
three levels, namely national, county and municipal. The primary role of the state is to devise
the national health policy, prepare and oversee legislation and allocate funding, while the
counties and municipalities provide the health services. The organisation of the health system
has been a subject of debate in recent years, with the Government proposing the nationalisa-
tion of public hospitals in order to improve services.

#M16F-54 © 2007 Frost & Sullivan www.frost.com August 2007 9-3
Benelux and Scandinavia are less developed than the other European countries in terms of
surgical procedures. Moreover, Scandinavia does not have many participants in the market,
which acts as a driver for potential CPT entrants, since there would not be much pricing
pressure.
Market Engineering Measurements
Chart 9.1 presents the market engineering measurements for the Benelux and Scandinavian
custom procedure trays market for 2006.
C h a r t 9 . 1
Custom Procedure Trays Market: Market Engineering Measurements (Benelux and
Scandinavia), 2006
Market Engineering Drives Market
Strategy and Planning
MarketEngineer
ChallengeIdentification
MarketResearch
MarketEngineering
System
Implementation
MarketPlanning
MarketStrategy
Note: All figures are rounded. Source: Frost & Sullivan
Measurement Name Measurement Trend
Market age Growth stage ---
Revenues $44.3 million Increasing
Potential revenues (maximum future market size) $102.2 million Increasing
Base year market growth rate 10.1% Increasing
Compound annual growth rate 12.7% ---
Competitors (active market competitors in base year) 16 Stable
Average price $38 Increasing
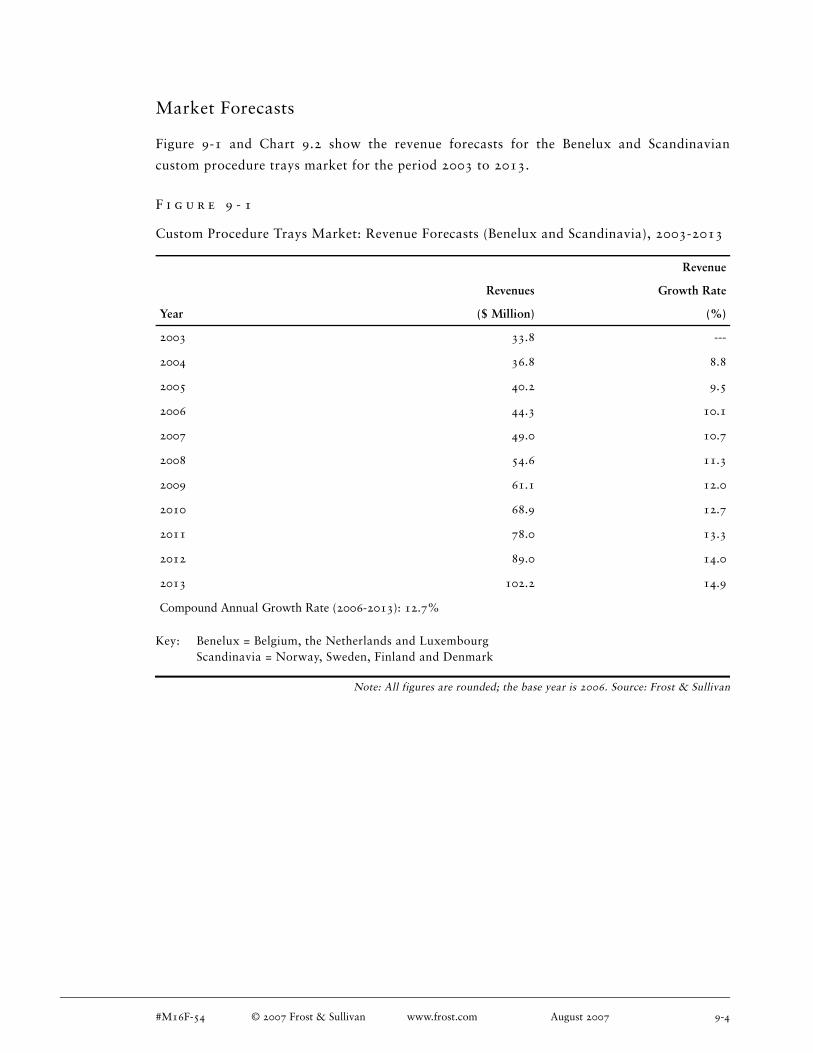
#M16F-54 © 2007 Frost & Sullivan www.frost.com August 2007 9-4
Market Forecasts
Figure 9-1 and Chart 9.2 show the revenue forecasts for the Benelux and Scandinavian
custom procedure trays market for the period 2003 to 2013.
Key: Benelux = Belgium, the Netherlands and Luxembourg Scandinavia = Norway, Sweden, Finland and Denmark
Note: All figures are rounded; the base year is 2006. Source: Frost & Sullivan
F i g u r e 9 - 1
Custom Procedure Trays Market: Revenue Forecasts (Benelux and Scandinavia), 2003-2013
Revenue
Revenues Growth Rate
Year ($ Million) (%)
2003 33.8 ---
2004 36.8 8.8
2005 40.2 9.5
2006 44.3 10.1
2007 49.0 10.7
2008 54.6 11.3
2009 61.1 12.0
2010 68.9 12.7
2011 78.0 13.3
2012 89.0 14.0
2013 102.2 14.9
Compound Annual Growth Rate (2006-2013): 12.7%

#M16F-54 © 2007 Frost & Sullivan www.frost.com August 2007 9-5
C h a r t 9 . 2
Custom Procedure Trays Market: Revenue Forecasts (Benelux and Scandinavia), 2003-2013
Note: All figures are rounded; the base year is 2006. Source: Frost & Sullivan
The Benelux and Scandinavian CPT market amounted to $44.3 million in 2006. It has grown
by 18.3 per cent since 2003.
The Benelux and Scandinavian angiography market is relatively well-developed and is esti-
mated to experience a relatively stable growth until 2009. The number of angiographies
performed are high and the degree of reusability is extremely low. The ophthalmic CPT
market has grown since 2003 and stabilised at an annual growth rate of approximately
5.5 per cent. The OR market is the least penetrated in Benelux and Scandinavia. The number
of surgeries in Scandinavia is lower than that of Benelux.
The CAGR for the period 2006 to 2013 is estimated to be 12.7 per cent and the CPT market
is forecast to be worth $102.2 million by 2013.
Angiography CPT Market
Figure 9-2 and Chart 9.3 show the revenue forecasts for the Benelux and Scandinavian angi-
ography CPT market for the period 2003 to 2013.
0
20
40
60
80
100
120
2003 2004 2005 2006 2007 2008 2009 2010 2011 2012 2013
Year
Rev
enue
s ($
Mill
ion)
0
2
4
6
8
10
12
14
16
Gro
wth
Rat
e (%
)
Revenues ($ Million) Growth Rate

#M16F-54 © 2007 Frost & Sullivan www.frost.com August 2007 9-6
Key: Benelux = Belgium, the Netherlands and Luxembourg Scandinavia = Norway, Sweden, Finland and Denmark
Note: All figures are rounded; the base year is 2006. Source: Frost & Sullivan
C h a r t 9 . 3
Angiography CPT Market: Revenue Forecasts (Benelux and Scandinavia), 2003-2013
Note: All figures are rounded; the base year is 2006. Source: Frost & Sullivan
F i g u r e 9 - 2
Angiography CPT Market: Revenue Forecasts (Benelux and Scandinavia), 2003-2013
Revenue
Revenues Growth Rate
Year ($ Million) (%)
2003 8.5 ---
2004 9.0 6.1
2005 9.6 6.3
2006 10.2 6.7
2007 10.9 6.8
2008 11.6 6.9
2009 12.4 6.9
2010 13.3 7.2
2011 14.3 7.3
2012 15.4 7.5
2013 16.6 7.8
Compound Annual Growth Rate (2006-2013): 7.2%
0
2
4
6
8
10
12
14
16
18
2003 2004 2005 2006 2007 2008 2009 2010 2011 2012 2013
Year
Rev
enue
s ($
Mill
ion)
0
1
2
3
4
5
6
7
8
9
Gro
wth
Rat
e (%
)
Revenues ($ Million) Growth Rate (%)

#M16F-54 © 2007 Frost & Sullivan www.frost.com August 2007 9-7
The market was worth $10.2 million in 2006 and has grown by 12.4 per cent since 2003. The
angiography market in Benelux and Scandinavia is very well developed and is comparable to
France and the United Kingdom.
The Benelux and Scandinavian region is very vast, covering seven countries. The market is
not uniform across all the seven countries. Belgium, Finland, Norway and the Netherlands,
to a marked extent, witness better growth than the other countries. The market is forecast to
be worth $16.6 million in 2013, with a CAGR of 7.2 per cent from 2006 to 2013.
Ophthalmic CPT Market
Figure 9-3 and Chart 9.4 show the revenue forecasts for the Benelux and Scandinavian
ophthalmic CPT market for the period 2003 to 2013.
Key: Benelux = Belgium, the Netherlands and Luxembourg Scandinavia = Norway, Sweden, Finland and Denmark
Note: All figures are rounded; the base year is 2006. Source: Frost & Sullivan
F i g u r e 9 - 3
Ophthalmic CPT Market: Revenue Forecasts (Benelux and Scandinavia), 2003-2013
Revenue
Revenues Growth Rate
Year ($ Million) (%)
2003 18.1 ---
2004 19.0 5.0
2005 20.0 5.2
2006 21.1 5.3
2007 22.2 5.3
2008 23.4 5.5
2009 24.8 5.7
2010 26.2 5.6
2011 27.6 5.5
2012 29.1 5.4
2013 30.7 5.6
Compound Annual Growth Rate (2006-2013): 5.5%

#M16F-54 © 2007 Frost & Sullivan www.frost.com August 2007 9-8
C h a r t 9 . 4
Ophthalmic CPT Market: Revenue Forecasts (Benelux and Scandinavia), 2003-2013
Note: All figures are rounded; the base year is 2006. Source: Frost & Sullivan
The market was worth $21.1 million in 2006 and has grown by 10.2 per cent since 2003. The
majority of revenue was accounted by cataract surgeries.The pioneer in the field was Alcon,
which started assembling trays for ophthalmology since 1996-97 and is undoubtedly the
market leader today. The number of eye surgeries had increased from 2003 to 2006, espe-
cially in Sweden, Norway and Belgium. The cataract market is not as penetrated as in the
United Kingdom, France and Germany, and is the main driver for CPT. The market is forecast
to be worth $30.7 million in 2013, growing at a CAGR of 5.5 per cent from 2006 to 2013.
Operating Room CPT Market
Figure 9-4 and Chart 9.5 show the revenue forecasts for the Benelux and Scandinavian oper-
ating room CPT market for the period 2003 to 2013.
0
5
10
15
20
25
30
35
2003 2004 2005 2006 2007 2008 2009 2010 2011 2012 2013
Year
Rev
enue
s ($
Mill
ion)
0
1
2
3
4
5
6
Gro
wth
Rat
e (%
)
Revenues ($ Million) Growth Rate (%)

#M16F-54 © 2007 Frost & Sullivan www.frost.com August 2007 9-9
Key: Benelux = Belgium, the Netherlands and Luxembourg Scandinavia = Norway, Sweden, Finland and Denmark
Note: All figures are rounded; the base year is 2006. Source: Frost & Sullivan
C h a r t 9 . 5
Operating Room CPT Market: Revenue Forecasts (Benelux and Scandinavia), 2003-2013
Note: All figures are rounded; the base year is 2006. Source: Frost & Sullivan
F i g u r e 9 - 4
Operating Room CPT Market: Revenue Forecasts (Benelux and Scandinavia), 2003-2013
Revenue
Revenues Growth Rate
Year ($ Million) (%)
2003 7.2 ---
2004 8.7 21.7
2005 10.6 22.0
2006 13.0 22.1
2007 15.9 22.4
2008 19.5 22.5
2009 23.9 22.6
2010 29.3 22.8
2011 36.1 23.0
2012 44.5 23.2
2013 54.9 23.5
Compound Annual Growth Rate (2006-2013): 22.9%
0
10
20
30
40
50
60
2003 2004 2005 2006 2007 2008 2009 2010 2011 2012 2013
Year
Rev
enue
s ($
Mill
ion)
0
5
10
15
20
25
Gro
wth
Rat
e (%
)
Revenues ($ Million) Growth Rate (%)

#M16F-54 © 2007 Frost & Sullivan www.frost.com August 2007 9-10
The market was worth $13.0 million in 2006 and has grown by 43.7 per cent since 2003. The
OR CPT market in Benelux and Scandinavia is largely underpenetrated. Though the market
has shown considerable growth since 2000, focussed campaigning for the usage of CPT is
required.
The market is forecast to be worth $54.9 million in 2013, with a CAGR of 22.9 per cent for
the period 2006 to 2013. The annual growth rate is likely to increase towards the end of the
forecast period.
Anaesthesia Room CPT Market
Figure 9-5 and Chart 9.6 show the revenue forecasts for the Benelux and Scandinavian anaes-
thesia room CPT market from 2003 to 2013.
Key: Benelux = Belgium, the Netherlands and Luxembourg Scandinavia = Norway, Sweden, Finland and Denmark
Note: All figures are rounded; the base year is 2006. Source: Frost & Sullivan
F i g u r e 9 - 5
Anaesthesia Room CPT Market: Revenue Forecasts (Benelux and Scandinavia), 2003-2013
Revenue
Revenues Growth Rate
Year ($ Million) (%)
2003 1.0 ---
2004 1.0 3.9
2005 1.0 3.9
2006 1.0 4.3
2007 1.0 4.2
2008 1.0 4.1
2009 1.0 4.5
2010 1.0 4.6
2011 1.0 4.3
2012 1.0 4.7
2013 1.0 4.9
Compound Annual Growth Rate (2006-2013): 4.5%

#M16F-54 © 2007 Frost & Sullivan www.frost.com August 2007 9-11
C h a r t 9 . 6
Anaesthesia Room CPT Market: Revenue Forecasts (Benelux and Scandinavia), 2003-2013
Note: All figures are rounded; the base year is 2006. Source: Frost & Sullivan
The market was worth $1.0 million in 2006 and has grown by 7.8 per cent since 2003.
Though the growth potential for this market is huge, it is yet to tapped.
The anaesthesia room market in Benelux and Scandinavia is likely to reach $1.0 million by
2013, growing at a CAGR of 4.5 per cent from 2006 to 2013.
0.0
0.2
0.4
0.6
0.8
1.0
1.2
2003 2004 2005 2006 2007 2008 2009 2010 2011 2012 2013
Year
Rev
enue
s ($
Mill
ion)
0.0
1.0
2.0
3.0
4.0
5.0
6.0
Gro
wth
Rat
e (%
)
Revenues ($ Million) Growth Rate (%)

#M16F-54 © 2007 Frost & Sullivan www.frost.com August 2007 10-1
10Market Engineering Strategy
S t r a t e g i c R e c o m m e n d a t i o n s f o r E u r o p e a n
C u s t o m P r o c e d u r e T r a y s M a r k e t
Strategic Recommendations
Unlike the other markets, supply chain, logistics and customization play a vital role in the
CPT market and hence, it is very essential for every market participant to continue analysing
the key challenges and issues in the industry and device suitable strategies. The complex
nature of the CPT market makes companies self evaluate their capabilities to effectively
sustain themselves in this market. Many single-use product companies, which are already
well established with their brand name in the industry, act as potential threats to new market
entrants.
Chart 10.1 presents the competitive rivalry for the European custom procedure trays market
in 2006.

#M16F-54 © 2007 Frost & Sullivan www.frost.com August 2007 10-2
C h a r t 1 0 . 1
Custom Procedure Trays Market: Competitive Rivalry (Europe), 2006
Source: Frost & Sullivan
E f f e c t i v e S u p p l y C h a i n M a n a g e m e n t
To manage the supply chain effectively and efficiently, either using traditional methods or
e-business, it is essential to identify the existing issues or challenges. This can be achieved by
focusing on the general goals of supply management. Stockouts of raw materials and produc-
tion parts would shut down an operation and be extremely costly in terms of lost production,
escalation of operating costs due to fixed costs and inability to satisfy delivery promises to
customers. Therefore, it is important for the supply department to keep inventory investment
and loss at a minimum. To tighten inventory control, a cycle count program could be imple-
mented to help identify and clear non-selling stock. Warehouse racking could be reconfigured
to accommodate new products and overflow inventory.
!"#$%&'&'(%)*'(+,-.)
'/)&0%
!12)3+-4%&
!"#$%&'()&'*
56',7)869&"#%-)8"/:'7%/8%
!-%+&%)+)96$$,.)80+'/)
#+/+;%#%/&);"+,
<&-"/;)96$$,'%-)7+&+=+9%
!"#$%&'&'(%)9&-+&%;.
+,--./"(*
>;/"-%)&0%)!12)#+-4%&
?/&%-)&0%)!12)#+-4%&
1+-&/%-)@'&0)!12)8"#$+/'%9
<6$$,.)!12)8"#$+/'%9)"/)
+/)+7)0"8)=+9'9
%0/*'/&1$+,--./"(*$
<&-"/;)96$$,.)80+'/)#+/+;%#%/&
!,'%/&)9%-('8'/;)9&-+&%;.
!"#$%&%/&)96$$,'%-)$+-&/%-90'$
!"/&'/6"69)869&"#%-)%(+,6+&'"/
%&2$3*"(*A"@%-)"(%-0%+7)8"9&9
*%768%7)&-+/9+8&'"/)8"9&9
B6'84%-)96-;'8+,)9%&)6$
>#$-"(%7)'/:%8&'"/)8"/&-",

#M16F-54 © 2007 Frost & Sullivan www.frost.com August 2007 10-3
Besides efficient inventory management, it is also advantageous to obtain low product costs
naturally. The purchasers should strive to obtain the needed items and services at the lowest
possible cost after considering the quality, delivery and service requirements. The lowest total
cost would give any organization a competitive edge over the others. Many existing partici-
pants tend to import certain components of the procedure pack from low-cost production
countries like China. Surgical drapes and gowns are being imported and sterilised before
packaging, reducing the total cost of the pack by at least 33 per cent, which is a form of cost
saving for the CPT company.
C o m p e t e n t S u p p l i e r P a r t n e r s h i p
End users such as surgeons and operating room (OR) staff are highly brand conscious, and
the inability of CPT vendors to provide a desired brand may result in loss of business and
inability to maintain healthy customer relations. Market participants have to dedicate signif-
icant attention to purchasing and supply chain management at both strategic and operational
levels. It is very important in a supply chain market to source an efficient supplier for effec-
tively running the supply chain without hindering the cycle. It is also essential to find and
develop suppliers that are competent and interested in helping their customers save costs as
well. Thus, the success of the purchaser also depends on his/her skill in locating or devel-
oping suppliers, analysing supplier capabilities, selecting the appropriate supplier and
collaborating with the supplier to obtain continuous process improvement to result in a
win-win situation for both the purchaser and the supplier.
C o n t i n u o u s C u s t o m e r E v a l u a t i o n
It is very essential to stay focused on continually identifying and introducing highly profit-
able unique products that meet customer needs. In order to stay abreast of customer needs, it
is important to collect suggestions from hospital personnel using the company's products.
Suggestions for new products and product improvements may be provided by engineers, sales
personnel, physicians and technicians who perform the clinical procedures.
When a product suggestion is determined it demonstrates sustainable competitive advantage
is attained, customer needs are met, which leas to a good potential financial return. A project
team comprised of individuals from our marketing, nursing, medical, manufacturing and
quality assurance departments. This team could identify the customer requirements, inte-
grates the kit content n, compile all necessary documentation and then strategically prepare
the product for market introduction.

#M16F-54 © 2007 Frost & Sullivan www.frost.com August 2007 10-4
V e n d o r - m a n a g e d I n v e n t o r y
Inventory management is a very important aspect of CPT delivery and usage. Companies
could work closely with hospitals, understand their needs and implement innovative strate-
gies. Distributor representatives can visit the stockrooms of hospitals and determine the
products to be replenished.They can then write purchase orders for these products.
O u t s o u r c i n g S t e r i l i z a t i o n F a c i l i t i e s
Companies willing to enter the CPT market could also choose to outsource sterilization serv-
ices, just remain with providing only kit assembling and packing services. Many vendors are
already following this strategy for increased time saving and cost savings, since setting up a
sterilization plant would involve a capital investment. To complement their existing reusable
medical instruments, these companies are considering the introduction of single-use CPTs to
enhance their product ranges.
E n t r a n c e o f S i n g l e - u s e S u r g i c a l P r o d u c t
M a n u f a c t u r e r s
Large companies or existent market participants in medical devices manufacturing also stand
a chance to enter the CPT market, taking advantage of their brand name to sell the product.
Hospital staff and surgeons usually are more brand conscious and will prefer to use the same
product that has won their confidence. Hence, it becomes a value-added advantage for
single-use surgical product companies to consider entering the CPT market as well. More-
over, companies should focus on product differentiation, offering supplementary value to
clients and enhancing service. Strong strategic leadership, combined with good market intelli-
gence, will be vital to develop growth options and achieve success.

#M16F-54 © 2007 Frost & Sullivan www.frost.com August 2007 11-1
11Database of Key Industry Participants
K e y I n d u s t r y P a r t i c i p a n t s
Industry Participants
3M www.mmm.com
Alcon www.alconlabs.com
Allergan www.allergan.com
Angiokard www.angiokard.de
B Braun www.bbraun.com
Bausch & Lomb www.bausch.com
Becton Dickinson www.bd.com
Beldico www.beldico.be
Caledonian Medical www.calmed.co.uk
Cardinal Health www.cardinal.com
Cemed www.cemed.de
Cordis www.jnjgateway.com
Corneal www.corneal.com
DeRoyal www.deroyal.com
Domilens www.domilens.de
Kimal www.kimal.co.uk
Kimberly Clark www.kcc.com
Lohmann & Rauscher www.de.LRmed.com

#M16F-54 © 2007 Frost & Sullivan www.frost.com August 2007 11-2
Medex Medical www.medexmedical.de
Medica Europe www.medica-europe.nl
Medtronic www.medtronic.com
Mölnlycke www.molnlycke.net
Paul Hartmann www.hartmann.info
Pennine Healthcare www.penninehealthcare.co.uk
PVB www.smiths-medical.de
Rocialle www.rocialle.co.uk
Sengewald www.sengewald.de
Vygon www.vygon.com

#M16F-54 © 2007 Frost & Sullivan www.frost.com August 2007 12-1
12Decision Support Databases
D e m o g r a p h i c s
Total Population
Figure 12-1 presents the total world population from 2002 to 2012.
F i g u r e 1 2 - 1
Decision Support Database: Total Population in Million (World), 2002-2012
Region/Country 2002 2003 2004 2005 2006 2007 2008 2009 2010 2011 2012CAGR %
(2005-2012)
North America
Canada 31.9 32.2 32.5 32.8 33.1 33.4 33.7 34.0 34.3 34.5 34.8 0.85
United States 287.7 290.3 293.0 295.7 298.4 301.1 303.8 306.5 309.2 311.8 314.5 0.88
TOTAL 319.6 322.6 325.5 328.5 331.5 334.5 337.5 340.5 343.4 346.4 349.3 0.88
Latin America
Argentina 38.3 38.7 39.1 39.5 39.9 40.3 40.7 41.1 41.4 41.8 42.1 0.89
Brazil 179.9 182.0 184.1 186.1 188.1 190.0 191.9 193.8 195.6 197.4 199.1 0.95
Chile 15.5 15.7 15.8 16.0 16.1 16.3 16.4 16.6 16.7 16.9 17.0 0.88
Mexico 102.5 103.7 105.0 106.2 107.5 108.7 110.0 111.2 112.5 113.7 115.0 1.14
Peru 26.8 27.2 27.5 27.9 28.3 28.7 29.0 29.4 29.8 30.1 30.5 1.23
Venezuela 24.3 24.7 25.0 25.4 25.7 26.1 26.4 26.8 27.1 27.5 27.8 1.31
TOTAL 387.3 392.0 396.6 401.1 405.6 410.0 414.5 418.8 423.1 427.3 431.4 1.03
Asia-Pacific
Australia 19.6 19.7 19.9 20.1 20.3 20.4 20.6 20.8 20.9 21.1 21.2 0.79
China 1,284.3 1,291.5 1,298.9 1,306.3 1,314.0 1,321.9 1,330.0 1,338.6 1,347.6 1,356.8 1,366.2 0.65
Hong Kong 6.8 6.8 6.9 6.9 6.9 7.0 7.0 7.1 7.1 7.1 7.2 0.50
India 1,034.2 1,049.7 1,065.1 1,080.3 1,095.4 1,110.4 1,125.4 1,140.3 1,155.0 1,169.7 1,184.3 1.31
Indonesia 231.3 234.9 238.5 242.0 245.5 248.9 252.3 255.6 258.8 262.0 265.2 1.30
Japan 127.1 127.2 127.3 127.4 127.5 127.5 127.4 127.3 127.2 127.0 126.8 (0.09)

#M16F-54 © 2007 Frost & Sullivan www.frost.com August 2007 12-2
Malaysia 22.7 23.1 23.5 24.0 24.4 24.8 25.3 25.7 26.1 26.6 27.0 1.73
New Zealand 3.9 4.0 4.0 4.0 4.1 4.1 4.2 4.2 4.2 4.3 4.3 0.88
Philippines 83.0 84.6 86.2 87.9 89.5 91.1 92.7 94.3 95.9 97.5 99.0 1.71
Singapore 4.2 4.3 4.4 4.4 4.5 4.6 4.6 4.7 4.7 4.7 4.8 1.05
South Korea 48.0 48.2 48.4 48.6 48.9 49.0 49.2 49.4 49.6 49.7 49.8 0.33
Taiwan 22.5 22.6 22.8 22.9 23.0 23.2 23.3 23.4 23.6 23.7 23.8 0.54
Thailand 62.8 63.3 63.7 64.2 64.6 65.1 65.5 65.9 66.3 66.7 67.1 0.61
TOTAL 2,950.2 2,979.9 3,009.5 3,039.0 3,068.4 3,097.9 3,127.5 3,157.2 3,187.0 3,216.9 3,246.7 0.95
Western Europe
Austria 8.2 8.2 8.2 8.2 8.2 8.2 8.2 8.2 8.2 8.2 8.2 0.06
Belgium 10.3 10.3 10.4 10.4 10.4 10.4 10.4 10.4 10.4 10.4 10.4 0.10
Denmark 5.4 5.4 5.4 5.4 5.5 5.5 5.5 5.5 5.5 5.5 5.5 0.27
Finland 5.2 5.2 5.2 5.2 5.2 5.2 5.2 5.3 5.3 5.3 5.3 0.10
France 59.9 60.2 60.4 60.7 60.9 61.1 61.3 61.5 61.6 61.8 62.0 0.29
Germany 82.4 82.4 82.4 82.4 82.4 82.4 82.4 82.3 82.3 82.2 82.2 (0.05)
Greece 10.6 10.6 10.7 10.7 10.7 10.7 10.7 10.7 10.8 10.8 10.8 0.12
Iceland 0.3 0.3 0.3 0.3 0.3 0.3 0.3 0.3 0.3 0.3 0.3 0.55
Ireland 3.9 3.9 4.0 4.0 4.1 4.1 4.2 4.2 4.3 4.3 4.3 1.12
Italy 57.9 58.0 58.1 58.1 58.1 58.2 58.2 58.1 58.1 58.0 58.0 (0.05)
Luxembourg 0.5 0.5 0.5 0.5 0.5 0.5 0.5 0.5 0.5 0.5 0.5 1.37
Netherlands 16.1 16.2 16.3 16.4 16.5 16.6 16.7 16.7 16.8 16.9 16.9 0.42
Norway 4.5 4.6 4.6 4.6 4.6 4.6 4.6 4.7 4.7 4.7 4.7 0.36
Portugal 10.4 10.5 10.5 10.6 10.6 10.6 10.7 10.7 10.7 10.8 10.8 0.27
Spain 40.2 40.2 40.3 40.3 40.4 40.5 40.5 40.5 40.6 40.6 40.6 0.07
Sweden 9.0 9.0 9.0 9.0 9.0 9.0 9.1 9.1 9.1 9.1 9.1 0.15
Switzerland 7.4 7.4 7.5 7.5 7.5 7.6 7.6 7.6 7.6 7.6 7.7 0.31
United Kingdom 59.9 60.1 60.3 60.4 60.6 60.8 60.9 61.1 61.3 61.5 61.6 0.28
TOTAL 391.9 392.9 393.8 394.7 395.5 396.2 396.8 397.4 398.0 398.4 398.8 0.14
Eastern Europe
Czech Republic 10.3 10.3 10.3 10.2 10.2 10.2 10.2 10.2 10.2 10.2 10.2 (0.10)
Hungary 10.1 10.1 10.0 10.0 10.0 10.0 9.9 9.9 9.9 9.9 9.8 (0.25)
Poland 38.6 38.6 38.6 38.6 38.5 38.5 38.5 38.5 38.5 38.4 38.4 (0.05)
Russia 145.3 144.6 144.0 143.4 142.9 142.4 141.8 141.3 140.8 140.2 139.6 (0.38)
Turkey 67.3 68.1 68.9 69.7 70.4 71.2 71.9 72.6 73.3 74.0 74.7 0.99
TOTAL 271.6 271.6 271.7 271.9 272.1 272.2 272.4 272.5 272.6 272.7 272.8 0.04
F i g u r e 1 2 - 1 ( C o n t i n u e d )
Decision Support Database: Total Population in Million (World), 2002-2012
Region/Country 2002 2003 2004 2005 2006 2007 2008 2009 2010 2011 2012CAGR %
(2005-2012)

#M16F-54 © 2007 Frost & Sullivan www.frost.com August 2007 12-3
Definition: The above figures represent total midyear population
Note: All figures are rounded; the base year is 2005. Source: Frost & Sullivan
Prevalence of Cardiovascular Diseases
Figure 12-2 presents the prevalence of cardiovascular diseases in the world from 2002 to
2012.
Middle East & Africa
Egypt 73.3 74.7 76.1 77.5 78.9 80.3 81.6 83.0 84.4 85.7 87.0 1.65
Israel 6.0 6.1 6.2 6.3 6.4 6.4 6.5 6.6 6.7 6.7 6.8 1.12
Saudi Arabia 24.5 25.2 25.8 26.4 27.0 27.6 28.2 28.7 29.2 29.7 30.2 1.88
South Africa 44.4 44.5 44.5 44.3 44.2 44.0 43.8 43.6 43.3 43.1 42.9 (0.50)
TOTAL 148.3 150.5 152.6 154.6 156.5 158.3 160.1 161.8 163.6 165.2 166.9 1.08
WORLD TOTAL 4,468.8 4,509.4 4,549.7 4,589.8 4,629.5 4,669.1 4,708.7 4,748.2 4,787.6 4,826.9 4,865.9 0.83
F i g u r e 1 2 - 2
Decision Support Database: Prevalence of Cardiovascular Diseases in Million (World),
2002-2012
Region/Country 2002 2003 2004 2005 2006 2007 2008 2009 2010 2011 2012CAGR %
(2005-2012)
North America
Canada 7.1 7.3 7.4 7.6 7.8 8.0 8.2 8.4 8.7 8.9 9.1 2.55
United States 68.8 71.3 74.0 76.8 79.7 82.8 86.1 89.5 93.2 97.0 101.2 4.02
TOTAL 75.8 78.6 81.4 84.4 87.5 90.8 94.3 98.0 101.8 105.9 110.3 3.89
Latin America
Argentina - - - - - - - - - - - -
Brazil - - - - - - - - - - - -
Chile - - - - - - - - - - - -
Mexico - - - - - - - - - - - -
Peru - - - - - - - - - - - -
Venezuela - - - - - - - - - - - -
TOTAL - - - - - - - - - - - -
F i g u r e 1 2 - 1 ( C o n t i n u e d )
Decision Support Database: Total Population in Million (World), 2002-2012
Region/Country 2002 2003 2004 2005 2006 2007 2008 2009 2010 2011 2012CAGR %
(2005-2012)

#M16F-54 © 2007 Frost & Sullivan www.frost.com August 2007 12-4
Asia-Pacific
Australia 3.5 3.6 3.7 3.8 3.9 4.0 4.1 4.2 4.3 4.4 4.6 2.76
China - - - - - - - - - - - -
Hong Kong - - - - - - - - - - - -
India 42.6 44.0 45.5 47.0 48.6 50.3 52.1 54.0 56.0 58.2 60.5 3.68
Indonesia - - - - - - - - - - - -
Japan - - - - - - - - - - - -
Malaysia - - - - - - - - - - - -
New Zealand - - - - - - - - - - - -
Philippines - - - - - - - - - - - -
Singapore - - - - - - - - - - - -
South Korea - - - - - - - - - - - -
Taiwan - - - - - - - - - - - -
Thailand - - - - - - - - - - - -
TOTAL 46.1 47.6 49.1 50.7 52.4 54.3 56.2 58.2 60.3 62.6 65.1 3.62
Western Europe
Austria 2.4 2.4 2.5 2.5 2.6 2.6 2.7 2.7 2.8 2.9 3.0 2.39
Belgium 1.4 1.4 1.4 1.4 1.4 1.4 1.4 1.5 1.5 1.5 1.5 1.09
Denmark 1.4 1.5 1.5 1.5 1.6 1.6 1.6 1.7 1.7 1.8 1.8 2.51
Finland 0.4 0.4 0.4 0.4 0.4 0.4 0.4 0.4 0.4 0.4 0.4 2.17
France - - - - - - - - - - - -
Germany 24.1 24.5 24.9 25.3 25.7 26.1 26.6 27.0 27.4 27.9 28.3 1.62
Greece 3.6 3.6 3.7 3.7 3.7 3.8 3.8 3.9 3.9 4.0 4.0 1.23
Iceland 0.0 0.0 0.0 0.0 0.0 0.0 0.0 0.0 0.0 0.0 0.0 2.19
Ireland 0.2 0.2 0.2 0.2 0.2 0.2 0.2 0.2 0.3 0.3 0.3 2.42
Italy 11.6 11.7 11.8 12.0 12.1 12.3 12.4 12.6 12.8 13.0 13.2 1.38
Luxembourg - - - - - - - - - - - -
Netherlands 4.1 4.1 4.2 4.3 4.4 4.5 4.6 4.8 4.9 5.0 5.1 2.43
Norway 0.6 0.6 0.6 0.6 0.6 0.6 0.6 0.6 0.7 0.7 0.7 1.83
Portugal 0.6 0.6 0.6 0.7 0.7 0.7 0.7 0.7 0.7 0.7 0.7 1.47
Spain 14.4 14.5 14.7 14.8 15.0 15.1 15.3 15.5 15.6 15.8 16.0 1.13
Sweden 0.4 0.4 0.4 0.4 0.4 0.4 0.4 0.5 0.5 0.5 0.5 2.28
Switzerland - - - - - - - - - - - -
United Kingdom 2.4 2.7 2.7 2.7 2.8 2.8 2.8 2.9 2.9 3.0 3.0 1.30
TOTAL 67.4 68.5 69.5 70.5 71.5 72.6 73.7 74.8 76.0 77.2 78.5 1.54
F i g u r e 1 2 - 2 ( C o n t i n u e d )
Decision Support Database: Prevalence of Cardiovascular Diseases in Million (World),
2002-2012
Region/Country 2002 2003 2004 2005 2006 2007 2008 2009 2010 2011 2012CAGR %
(2005-2012)

#M16F-54 © 2007 Frost & Sullivan www.frost.com August 2007 12-5
Definition: The above figures indicate number of people living with Cardiovascular Diseases
Note: 1. Hyphen indicates non availability of data 2. Figures for 2003, 2004 and 2005 are Frost & Sullivan estimates 3. Assumption—It has been assumed that the number of people living with Cardiovascular
diseases would grow at a higher rate than that of the Ageing 65 + Population
Note: All figures are rounded; the base year is 2005. Source: Frost & Sullivan
P r o c e d u r e s
Number of Cataract Surgeries
Figure 12-3 shows the number of cataract surgeries performed around the world from
2002 to 2012.
Eastern Europe
Czech Republic - - - - - - - - - - - -
Hungary - - - - - - - - - - - -
Poland - - - - - - - - - - - -
Russia - - - - - - - - - - - -
Turkey - - - - - - - - - - - -
TOTAL - - - - - - - - - - - -
Middle East & Africa
Egypt - - - - - - - - - - - -
Israel - - - - - - - - - - - -
Saudi Arabia - - - - - - - - - - - -
South Africa - - - - - - - - - - - -
TOTAL - - - - - - - - - - - -
WORLD TOTAL 189.3 194.7 200.0 205.7 211.5 217.7 224.2 231.0 238.1 245.7 253.8 3.05
F i g u r e 1 2 - 2 ( C o n t i n u e d )
Decision Support Database: Prevalence of Cardiovascular Diseases in Million (World),
2002-2012
Region/Country 2002 2003 2004 2005 2006 2007 2008 2009 2010 2011 2012CAGR %
(2005-2012)
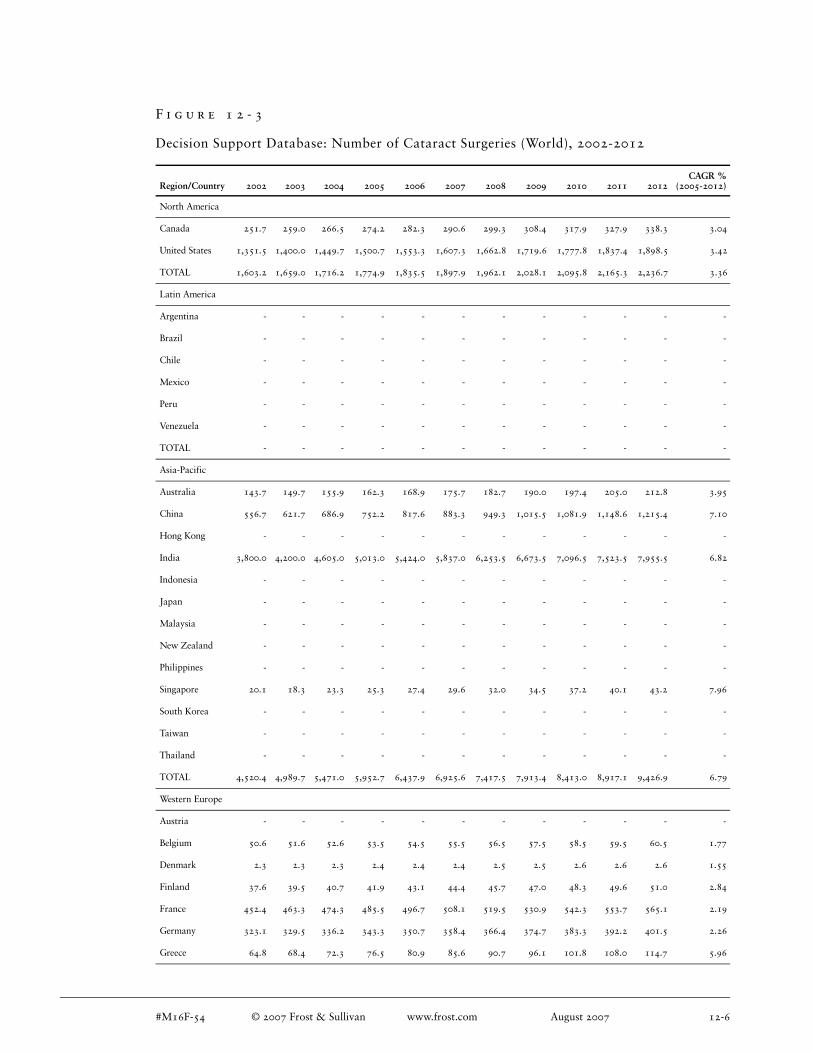
#M16F-54 © 2007 Frost & Sullivan www.frost.com August 2007 12-6
F i g u r e 1 2 - 3
Decision Support Database: Number of Cataract Surgeries (World), 2002-2012
Region/Country 2002 2003 2004 2005 2006 2007 2008 2009 2010 2011 2012CAGR %
(2005-2012)
North America
Canada 251.7 259.0 266.5 274.2 282.3 290.6 299.3 308.4 317.9 327.9 338.3 3.04
United States 1,351.5 1,400.0 1,449.7 1,500.7 1,553.3 1,607.3 1,662.8 1,719.6 1,777.8 1,837.4 1,898.5 3.42
TOTAL 1,603.2 1,659.0 1,716.2 1,774.9 1,835.5 1,897.9 1,962.1 2,028.1 2,095.8 2,165.3 2,236.7 3.36
Latin America
Argentina - - - - - - - - - - - -
Brazil - - - - - - - - - - - -
Chile - - - - - - - - - - - -
Mexico - - - - - - - - - - - -
Peru - - - - - - - - - - - -
Venezuela - - - - - - - - - - - -
TOTAL - - - - - - - - - - - -
Asia-Pacific
Australia 143.7 149.7 155.9 162.3 168.9 175.7 182.7 190.0 197.4 205.0 212.8 3.95
China 556.7 621.7 686.9 752.2 817.6 883.3 949.3 1,015.5 1,081.9 1,148.6 1,215.4 7.10
Hong Kong - - - - - - - - - - - -
India 3,800.0 4,200.0 4,605.0 5,013.0 5,424.0 5,837.0 6,253.5 6,673.5 7,096.5 7,523.5 7,955.5 6.82
Indonesia - - - - - - - - - - - -
Japan - - - - - - - - - - - -
Malaysia - - - - - - - - - - - -
New Zealand - - - - - - - - - - - -
Philippines - - - - - - - - - - - -
Singapore 20.1 18.3 23.3 25.3 27.4 29.6 32.0 34.5 37.2 40.1 43.2 7.96
South Korea - - - - - - - - - - - -
Taiwan - - - - - - - - - - - -
Thailand - - - - - - - - - - - -
TOTAL 4,520.4 4,989.7 5,471.0 5,952.7 6,437.9 6,925.6 7,417.5 7,913.4 8,413.0 8,917.1 9,426.9 6.79
Western Europe
Austria - - - - - - - - - - - -
Belgium 50.6 51.6 52.6 53.5 54.5 55.5 56.5 57.5 58.5 59.5 60.5 1.77
Denmark 2.3 2.3 2.3 2.4 2.4 2.4 2.5 2.5 2.6 2.6 2.6 1.55
Finland 37.6 39.5 40.7 41.9 43.1 44.4 45.7 47.0 48.3 49.6 51.0 2.84
France 452.4 463.3 474.3 485.5 496.7 508.1 519.5 530.9 542.3 553.7 565.1 2.19
Germany 323.1 329.5 336.2 343.3 350.7 358.4 366.4 374.7 383.3 392.2 401.5 2.26
Greece 64.8 68.4 72.3 76.5 80.9 85.6 90.7 96.1 101.8 108.0 114.7 5.96

#M16F-54 © 2007 Frost & Sullivan www.frost.com August 2007 12-7
Definition: Cataract surgery is a procedure performed to remove a cloudy lens from the eye; usually an intraocular lens is implanted at the same time. The above figures indicate number of cataract surgeries performed
Note: 1. Hyphen indicates non availability of data 2. Figures for 2005 are Frost & Sullivan estimates
Note: All figures are rounded; the base year is 2005. Source: Frost & Sullivan
Iceland 1.6 1.5 1.5 1.5 1.6 1.6 1.6 1.6 1.6 1.6 1.6 0.55
Ireland 18.7 19.0 19.2 19.5 19.8 20.1 20.4 20.8 21.1 21.5 21.8 1.62
Italy 462.0 482.0 502.2 522.5 542.9 563.4 584.1 604.9 626.1 647.6 669.2 3.60
Luxembourg 3.5 3.5 3.6 3.7 3.8 3.8 3.9 4.0 4.1 4.2 4.3 2.12
Netherlands 101.3 103.9 106.8 109.8 113.0 116.5 120.3 124.2 128.4 132.9 137.8 3.29
Norway 22.8 23.1 23.5 23.9 24.4 25.1 25.7 26.5 27.2 28.1 28.9 2.76
Portugal 22.4 26.9 28.7 30.6 32.7 34.9 37.1 39.5 42.0 44.6 47.3 6.41
Spain 102.2 92.9 93.1 93.3 93.5 93.7 94.0 94.3 94.6 94.9 95.3 0.31
Sweden 2.3 1.9 1.9 2.0 2.0 2.0 2.0 2.0 2.0 2.0 2.0 0.58
Switzerland 16.6 14.5 14.7 14.8 15.0 15.2 15.3 15.5 15.7 15.9 16.1 1.22
United Kingdom 331.6 363.2 381.4 400.3 420.0 440.5 461.8 484.0 506.9 530.7 555.2 4.78
TOTAL 2,015.6 2,087.0 2,154.9 2,224.9 2,297.0 2,371.2 2,447.4 2,525.7 2,606.5 2,689.5 2,775.0 3.21
Eastern Europe
Czech Republic 57.3 60.6 63.8 67.1 70.5 74.1 77.6 81.2 84.9 88.8 92.7 4.72
Hungary 38.9 40.1 41.2 42.4 43.6 44.8 46.0 47.3 48.5 49.7 51.0 2.66
Poland 59.9 60.7 61.5 62.4 63.2 64.1 65.0 65.9 66.9 67.9 68.9 1.44
Russia - - - - - - - - - - - -
Turkey - - - - - - - - - - - -
TOTAL 156.2 161.4 166.6 171.9 177.3 182.9 188.6 194.4 200.3 206.4 212.6 3.08
Middle East & Africa
Egypt - - - - - - - - - - - -
Israel - - - - - - - - - - - -
Saudi Arabia - - - - - - - - - - - -
South Africa 28.2 30.0 31.9 33.7 35.7 37.7 39.8 42.0 44.1 46.3 48.5 5.33
TOTAL 28.2 30.0 31.9 33.7 35.7 37.7 39.8 42.0 44.1 46.3 48.5 5.33
WORLD TOTAL 8,323.6 8,927.1 9,540.5 10,158.1 10,783.4 11,415.4 12,055.4 12,703.6 13,359.6 14,024.6 14,699.6 5.42
F i g u r e 1 2 - 3 ( C o n t i n u e d )
Decision Support Database: Number of Cataract Surgeries (World), 2002-2012
Region/Country 2002 2003 2004 2005 2006 2007 2008 2009 2010 2011 2012CAGR %
(2005-2012)

#M16F-54 © 2007 Frost & Sullivan www.frost.com August 2007 12-8
E x p e n d i t u r e
Total Healthcare Expenditure
Figure 12-4 provides the total world healthcare expenditure from 2002 to 2012.
F i g u r e 1 2 - 4
Decision Support Database: Total Healthcare Expenditure in Billion USD (World),
2002-2012
Region/Country 2002 2003 2004 2005 2006 2007 2008 2009 2010 2011 2012CAGR %
(2005-2012)
North America
Canada 73.0 87.8 101.2 116.9 129.5 138.3 147.0 155.2 163.0 169.8 175.9 6.00
United States 1,559.0 1,678.9 1,804.7 1,936.6 2,077.5 2,232.9 2,399.2 2,573.3 2,753.9 2,944.2 3,146.3 7.18
TOTAL 1,632.0 1,766.6 1,905.9 2,053.5 2,207.0 2,371.2 2,546.3 2,728.6 2,916.8 3,114.0 3,322.1 7.11
Latin America
Argentina 11.5 14.7 17.3 20.9 23.3 25.7 27.8 29.9 31.8 33.7 35.5 7.85
Brazil 40.7 45.8 55.6 74.0 78.8 83.8 90.0 97.0 104.9 113.7 123.6 7.60
Chile 3.8 4.4 5.8 7.0 8.0 9.0 9.9 10.8 11.8 12.8 13.8 10.17
Mexico 59.6 58.5 62.2 72.3 78.8 84.7 91.0 97.5 104.0 110.4 116.7 7.08
Peru 2.4 2.7 3.1 3.6 3.9 4.2 4.5 4.9 5.2 5.6 5.9 7.46
Venezuela 4.7 4.7 6.2 7.2 8.2 9.3 10.5 11.8 13.4 15.3 17.7 13.82
TOTAL 122.7 130.8 150.2 185.0 200.9 216.7 233.8 251.8 271.1 291.5 313.2 7.81
Asia-Pacific
Australia 39.4 51.0 62.4 69.9 74.7 79.9 85.1 90.4 95.9 101.4 107.1 6.29
China 71.9 84.3 98.7 116.0 134.3 152.9 172.5 193.7 217.0 242.5 270.7 12.87
Hong Kong 9.4 9.5 10.0 10.9 11.9 13.0 14.1 15.5 16.9 18.5 20.3 9.25
India 27.5 36.1 41.9 48.5 54.0 59.8 66.1 72.8 80.0 87.5 95.5 10.16
Indonesia 6.4 8.0 8.8 9.3 10.6 12.0 13.5 15.3 17.3 19.6 22.2 13.15
Japan 315.4 339.5 374.9 379.7 394.0 406.6 414.7 424.9 437.0 451.7 467.5 3.02
Malaysia 3.6 4.0 4.6 5.2 5.9 6.7 7.6 8.6 9.6 10.8 11.9 12.66
New Zealand 5.1 6.7 8.5 9.4 10.4 11.4 12.3 13.1 13.8 14.4 14.9 6.77
Philippines 2.3 2.3 2.5 2.8 3.2 3.6 4.0 4.4 4.9 5.5 6.0 11.45
Singapore 3.7 4.0 4.3 4.6 5.0 5.3 5.7 6.2 6.6 7.1 7.6 7.46
South Korea 25.3 30.1 33.9 39.3 43.3 47.7 52.2 56.7 61.2 66.0 70.9 8.81
Taiwan 16.9 17.8 19.2 21.0 22.8 24.7 26.5 28.2 30.0 31.8 33.6 6.92
Thailand 7.8 8.5 9.6 10.7 11.9 13.3 14.8 16.6 18.7 21.1 23.8 12.18
TOTAL 534.6 601.6 679.2 727.3 781.9 836.8 889.1 946.3 1,008.8 1,077.7 1,152.0 6.79

#M16F-54 © 2007 Frost & Sullivan www.frost.com August 2007 12-9
Western Europe
Austria 15.3 19.2 22.1 23.1 24.0 24.8 25.7 26.5 27.2 27.9 28.5 3.04
Belgium 22.6 29.3 34.0 35.8 37.4 38.9 40.3 41.6 42.9 44.1 45.3 3.40
Denmark 15.2 19.2 22.2 23.4 24.4 25.4 26.4 27.4 28.3 29.3 30.3 3.78
Finland 9.5 11.8 13.6 14.4 15.1 16.0 16.9 17.7 18.5 19.3 20.1 4.90
France 139.0 176.8 205.6 217.9 228.6 239.0 249.3 259.1 268.4 277.8 286.6 3.99
Germany 211.1 258.9 294.6 305.9 314.9 323.7 332.6 341.2 349.3 358.1 366.6 2.62
Greece 13.0 17.2 19.6 22.3 23.9 25.4 27.0 28.6 30.2 31.8 33.4 5.99
Iceland 0.8 1.1 1.3 1.6 1.8 2.0 2.1 2.3 2.4 2.6 2.7 7.80
Ireland 9.7 12.8 15.4 16.3 17.9 19.3 20.8 22.3 23.8 25.3 26.8 7.43
Italy 99.6 122.3 139.7 143.4 149.1 154.0 159.0 163.8 168.1 172.0 175.4 2.92
Luxembourg 1.5 1.9 2.3 2.5 2.7 2.8 2.9 3.0 3.2 3.3 3.4 4.14
Netherlands 39.0 50.4 58.1 60.6 63.8 66.2 68.7 71.1 73.3 75.5 77.6 3.59
Norway 18.3 22.7 26.1 30.4 32.5 34.7 36.9 39.3 41.4 43.4 45.5 5.94
Portugal 11.3 14.3 16.5 17.3 18.2 19.1 20.0 20.9 21.9 22.8 23.8 4.60
Spain 49.7 65.0 77.1 88.4 94.4 100.2 106.1 112.1 117.6 123.2 128.1 5.45
Sweden 22.2 28.4 33.5 34.1 35.6 37.1 39.2 41.4 43.9 46.6 49.7 5.53
Switzerland 29.7 37.0 41.5 43.1 45.7 48.4 51.1 53.8 56.5 59.3 62.2 5.39
United Kingdom 121.0 141.5 170.0 180.7 191.9 203.3 214.8 227.0 238.7 250.4 262.6 5.49
TOTAL 828.6 1,029.6 1,193.2 1,261.1 1,321.7 1,380.3 1,439.8 1,499.0 1,555.5 1,612.8 1,668.5 4.08
Eastern Europe
Czech Republic 5.0 6.8 7.5 9.0 9.9 10.8 11.7 12.7 13.6 14.5 15.5 8.03
Hungary 4.9 6.9 8.6 9.6 10.8 11.8 12.9 13.9 14.9 15.9 16.8 8.23
Poland 12.5 13.6 15.2 17.9 19.7 21.2 22.9 24.7 26.5 28.2 29.8 7.59
Russia 21.3 26.2 32.6 38.2 43.7 48.8 53.9 58.7 63.4 67.9 72.2 9.51
Turkey 11.6 15.8 19.7 26.0 28.6 31.5 34.0 36.4 39.0 41.2 43.3 7.55
TOTAL 55.4 69.3 83.6 100.8 112.6 124.1 135.3 146.4 157.3 167.7 177.6 8.43
F i g u r e 1 2 - 4 ( C o n t i n u e d )
Decision Support Database: Total Healthcare Expenditure in Billion USD (World),
2002-2012
Region/Country 2002 2003 2004 2005 2006 2007 2008 2009 2010 2011 2012CAGR %
(2005-2012)

#M16F-54 © 2007 Frost & Sullivan www.frost.com August 2007 12-10
Definition: The above figures indicate health care expenditure
Note: 1. Figures for 2005 are Frost & Sullivan estimates
Note: All figures are rounded; the base year is 2005. Source: Frost & Sullivan
Government Healthcare Expenditure
Figure 12-5 provides the government healthcare expenditure in the world from 2002 to 2012.
Middle East & Africa
Egypt 4.0 3.5 3.7 4.4 5.5 6.5 7.5 8.5 9.7 11.0 12.4 16.03
Israel 9.0 9.7 10.4 11.0 11.8 12.5 13.2 14.2 15.3 16.5 17.8 7.05
Saudi Arabia 7.9 8.8 9.6 10.4 11.2 11.8 12.4 13.0 13.6 14.2 14.8 5.13
South Africa 9.1 13.6 20.0 19.6 20.5 21.6 22.7 23.9 25.2 26.7 28.4 5.50
TOTAL 30.0 35.5 43.6 45.4 49.0 52.4 55.8 59.6 63.7 68.3 73.4 7.11
WORLD TOTAL 3,203.3 3,633.5 4,055.6 4,373.0 4,673.2 4,981.4 5,300.0 5,631.6 5,973.3 6,331.9 6,706.8 6.30
F i g u r e 1 2 - 5
Decision Support Database: Government Healthcare Expenditure in Billion USD (World),
2002-2012
Region/Country 2002 2003 2004 2005 2006 2007 2008 2009 2010 2011 2012CAGR %
(2005-2012)
North America
Canada 50.8 61.6 70.7 81.4 89.8 95.7 101.5 107.0 112.1 116.7 120.7 5.79
United States 718.0 765.7 824.2 891.3 999.5 1,077.2 1,158.4 1,243.4 1,332.9 1,426.8 1,531.8 8.04
TOTAL 768.8 827.3 895.0 972.7 1,089.3 1,172.9 1,259.9 1,350.3 1,445.0 1,543.5 1,652.5 7.87
Latin America
Argentina 5.8 7.4 8.8 10.4 11.2 12.0 12.8 13.6 14.3 14.9 15.5 5.77
Brazil 18.7 21.1 25.6 34.2 36.5 39.0 42.0 45.5 49.5 54.0 59.1 8.12
Chile 1.7 2.0 2.6 3.2 3.7 4.2 4.7 5.3 5.8 6.4 6.9 11.58
Mexico 26.8 25.9 27.4 31.6 34.1 36.6 39.3 42.0 44.8 47.5 50.2 6.83
Peru 1.2 1.3 1.5 1.8 1.9 2.0 2.2 2.3 2.5 2.6 2.8 6.58
Venezuela 2.2 2.2 2.8 3.3 3.7 4.2 4.7 5.2 5.9 6.6 7.6 12.69
TOTAL 56.3 59.8 68.8 84.5 91.1 98.1 105.8 113.9 122.7 132.0 141.9 7.69
F i g u r e 1 2 - 4 ( C o n t i n u e d )
Decision Support Database: Total Healthcare Expenditure in Billion USD (World),
2002-2012
Region/Country 2002 2003 2004 2005 2006 2007 2008 2009 2010 2011 2012CAGR %
(2005-2012)

#M16F-54 © 2007 Frost & Sullivan www.frost.com August 2007 12-11
Asia-Pacific
Australia 27.1 34.7 42.5 47.4 50.4 53.4 56.3 59.0 61.8 64.4 66.9 5.05
China 24.2 27.7 32.3 37.7 43.0 48.4 54.0 59.9 66.3 73.2 81.3 11.62
Hong Kong 5.4 5.6 5.9 6.5 7.1 7.8 8.6 9.6 10.6 11.7 12.9 10.34
India 5.9 7.6 8.7 10.0 11.1 12.0 13.1 14.3 15.6 16.8 18.1 8.82
Indonesia 2.3 2.9 3.2 3.5 4.0 4.6 5.2 6.0 6.9 7.9 9.1 14.83
Japan 257.7 278.5 306.1 305.5 315.6 327.0 336.8 348.5 361.9 376.0 390.9 3.59
Malaysia 1.9 2.2 2.5 2.8 3.2 3.7 4.2 4.8 5.4 6.0 6.7 13.13
New Zealand 4.0 5.3 6.7 7.5 8.3 9.2 9.9 10.5 11.1 11.7 12.1 7.11
Philippines 0.9 0.9 1.0 1.1 1.2 1.4 1.5 1.6 1.8 2.0 2.2 10.70
Singapore 1.2 1.2 1.3 1.4 1.5 1.6 1.7 1.8 1.9 1.9 2.0 5.45
South Korea 13.4 16.0 18.2 21.4 24.0 27.0 30.2 33.6 37.3 41.4 45.8 11.52
Taiwan 11.0 11.5 12.4 14.1 15.2 16.1 17.2 18.7 19.9 21.1 22.1 6.61
Thailand 2.6 3.0 3.4 3.8 4.3 4.8 5.4 6.0 6.9 8.1 9.3 13.80
TOTAL 357.5 396.9 444.1 462.4 488.8 516.7 543.9 574.3 607.3 642.0 679.4 5.65
Western Europe
Austria 10.7 13.5 15.5 16.2 16.9 17.5 18.1 18.7 19.2 19.7 20.2 3.15
Belgium 16.1 20.9 24.3 25.7 26.8 28.0 29.1 30.1 31.1 32.1 33.1 3.68
Denmark 1.7 2.1 2.5 2.6 2.7 2.9 3.0 3.2 3.3 3.5 3.6 4.76
Finland 7.2 9.0 10.3 10.9 11.6 12.2 12.9 13.6 14.2 14.9 15.5 5.13
France 105.7 134.6 156.6 166.3 174.8 182.9 191.3 199.0 206.4 213.9 221.0 4.14
Germany 165.7 203.3 231.6 240.6 247.9 255.1 262.2 269.1 276.3 283.6 290.7 2.74
Greece 6.9 9.1 10.4 11.9 12.8 13.7 14.5 15.4 16.3 17.2 18.2 6.32
Iceland 0.7 0.9 1.1 1.4 1.5 1.7 1.8 1.9 2.1 2.2 2.3 7.95
Ireland 7.3 9.6 11.6 12.2 13.4 14.5 15.5 16.6 17.7 18.8 19.9 7.29
Italy 75.3 92.4 105.6 108.5 112.9 116.7 120.5 124.3 127.6 130.7 133.3 2.98
Luxembourg 1.3 1.6 1.9 2.1 2.3 2.4 2.4 2.5 2.6 2.7 2.7 3.59
Netherlands 25.6 31.3 35.7 36.2 39.8 40.7 41.8 42.9 44.4 45.9 47.3 3.88
Norway 15.3 18.9 21.6 25.1 26.8 28.5 30.3 32.2 33.8 35.4 37.0 5.67
Portugal 8.0 10.1 11.6 12.3 12.9 13.6 14.3 14.9 15.6 16.3 17.0 4.76
Spain 35.4 46.4 55.0 63.2 67.6 71.8 76.1 80.5 84.5 88.6 92.3 5.57
Sweden 18.9 24.2 28.6 29.1 30.4 31.7 33.5 35.5 37.6 39.9 42.6 5.60
Switzerland 17.2 21.5 24.2 25.2 26.9 28.7 30.5 32.3 34.2 36.1 38.1 6.07
United Kingdom 100.9 118.3 142.6 152.3 162.6 173.0 183.5 194.7 206.0 217.1 229.0 6.00
TOTAL 619.8 767.6 890.9 941.8 990.3 1,035.3 1,081.3 1,127.3 1,172.8 1,218.6 1,263.7 4.29
F i g u r e 1 2 - 5 ( C o n t i n u e d )
Decision Support Database: Government Healthcare Expenditure in Billion USD (World),
2002-2012
Region/Country 2002 2003 2004 2005 2006 2007 2008 2009 2010 2011 2012CAGR %
(2005-2012)

#M16F-54 © 2007 Frost & Sullivan www.frost.com August 2007 12-12
Definition: The above figures indicate health care expenditure by government
Note: All figures are rounded; the base year is 2005. Source: Frost & Sullivan
Private Healthcare Expenditure
Figure 12-6 provides the private healthcare expenditure in the world from 2002 to 2012.
Eastern Europe
Czech Republic 4.6 6.2 6.9 8.1 9.1 9.9 10.7 11.5 12.4 13.3 14.1 8.25
Hungary 3.4 4.8 6.0 6.7 7.5 8.2 8.9 9.6 10.3 10.9 11.6 8.05
Poland 9.1 9.9 11.0 13.0 14.3 15.4 16.6 18.0 19.3 20.6 21.9 7.79
Russia 11.9 14.6 18.2 21.3 24.3 27.2 29.9 32.6 35.1 37.6 39.8 9.34
Turkey 7.7 10.4 12.9 16.9 18.5 20.3 21.8 23.3 24.8 26.1 27.3 7.08
TOTAL 36.6 45.9 54.9 66.0 73.7 80.9 88.0 95.1 102.0 108.5 114.7 8.21
Middle East & Africa
Egypt 1.3 1.2 1.1 1.3 1.5 1.7 1.9 2.2 2.4 2.7 3.0 12.39
Israel 5.7 6.2 6.3 6.4 6.7 7.1 7.4 7.9 8.5 9.1 9.7 6.06
Saudi Arabia 6.1 6.8 7.4 8.0 8.7 9.1 9.6 10.0 10.5 11.0 11.4 5.15
South Africa 3.0 4.7 6.8 6.5 6.8 7.2 7.6 8.0 8.3 8.7 9.2 5.14
TOTAL 16.0 18.8 21.6 22.3 23.7 25.1 26.5 28.1 29.7 31.5 33.3 5.93
WORLD TOTAL 1,855.1 2,116.2 2,375.2 2,549.6 2,756.9 2,929.0 3,105.3 3,288.9 3,479.5 3,676.2 3,885.5 6.20
F i g u r e 1 2 - 6
Decision Support Database: Private Healthcare Expenditure in Billion USD (World),
2002-2012
Region/Country 2002 2003 2004 2005 2006 2007 2008 2009 2010 2011 2012CAGR %
(2005-2012)
North America
Canada 22.2 26.2 30.5 35.6 39.7 42.6 45.5 48.3 50.8 53.1 55.2 6.48
United States 841.0 913.2 980.5 1,045.3 1,078.0 1,155.7 1,240.9 1,330.0 1,421.0 1,517.4 1,614.5 6.41
TOTAL 863.2 939.4 1,011.0 1,080.8 1,117.7 1,198.3 1,286.4 1,378.2 1,471.9 1,570.5 1,669.7 6.41
F i g u r e 1 2 - 5 ( C o n t i n u e d )
Decision Support Database: Government Healthcare Expenditure in Billion USD (World),
2002-2012
Region/Country 2002 2003 2004 2005 2006 2007 2008 2009 2010 2011 2012CAGR %
(2005-2012)

#M16F-54 © 2007 Frost & Sullivan www.frost.com August 2007 12-13
Latin America
Argentina 5.7 7.3 8.5 10.5 12.1 13.6 15.0 16.3 17.5 18.8 20.0 9.71
Brazil 22.0 24.7 30.0 39.8 42.3 44.8 48.0 51.5 55.4 59.7 64.6 7.14
Chile 2.1 2.4 3.1 3.8 4.3 4.8 5.2 5.6 6.0 6.4 6.9 8.89
Mexico 32.8 32.7 34.9 40.7 44.7 48.1 51.7 55.4 59.2 62.9 66.5 7.26
Peru 1.2 1.4 1.6 1.8 2.0 2.2 2.4 2.5 2.7 3.0 3.2 8.26
Venezuela 2.5 2.5 3.3 3.9 4.5 5.1 5.8 6.6 7.6 8.7 10.2 14.72
TOTAL 66.4 71.0 81.4 100.5 109.8 118.6 128.0 137.9 148.4 159.5 171.3 7.92
Asia-Pacific
Australia 12.3 16.3 20.0 22.5 24.4 26.5 28.8 31.4 34.1 37.0 40.2 8.65
China 47.7 56.6 66.4 78.4 91.3 104.5 118.5 133.8 150.7 169.4 189.4 13.44
Hong Kong 4.0 4.0 4.1 4.4 4.8 5.1 5.5 5.9 6.3 6.8 7.4 7.54
India 21.6 28.5 33.1 38.5 42.9 47.8 53.0 58.5 64.4 70.7 77.4 10.49
Indonesia 4.1 5.1 5.6 5.9 6.6 7.4 8.3 9.3 10.4 11.7 13.1 12.10
Japan 57.7 61.0 68.8 74.2 78.4 79.6 77.9 76.4 75.0 75.7 76.6 0.45
Malaysia 1.7 1.8 2.1 2.4 2.7 3.0 3.4 3.8 4.3 4.7 5.2 12.07
New Zealand 1.1 1.5 1.8 2.0 2.1 2.3 2.4 2.6 2.7 2.8 2.8 5.39
Philippines 1.4 1.4 1.5 1.7 2.0 2.3 2.5 2.8 3.1 3.5 3.8 11.89
Singapore 2.6 2.8 3.0 3.2 3.5 3.8 4.1 4.4 4.8 5.2 5.6 8.27
South Korea 11.9 14.1 15.7 17.9 19.3 20.7 22.0 23.0 23.9 24.6 25.1 4.95
Taiwan 5.9 6.3 6.8 6.9 7.7 8.7 9.3 9.6 10.1 10.7 11.5 7.55
Thailand 5.1 5.5 6.2 6.9 7.6 8.5 9.4 10.6 11.7 13.0 14.5 11.23
TOTAL 177.0 204.7 235.1 264.9 293.2 320.2 345.1 372.0 401.5 435.7 472.6 8.62
Western Europe
Austria 4.6 5.7 6.6 6.9 7.1 7.4 7.6 7.8 8.0 8.2 8.4 2.78
Belgium 6.5 8.4 9.7 10.2 10.6 10.9 11.2 11.5 11.8 12.0 12.2 2.66
Denmark 13.5 17.1 19.7 20.8 21.6 22.5 23.4 24.2 25.0 25.9 26.7 3.65
Finland 2.3 2.9 3.3 3.4 3.6 3.8 3.9 4.1 4.3 4.4 4.6 4.16
France 33.4 42.2 49.0 51.6 53.9 56.1 58.0 60.1 62.1 64.0 65.7 3.50
Germany 45.4 55.7 63.1 65.4 67.1 68.6 70.4 72.0 73.0 74.5 75.9 2.16
Greece 6.1 8.1 9.2 10.4 11.1 11.8 12.5 13.2 13.9 14.6 15.2 5.60
Iceland 0.1 0.2 0.2 0.3 0.3 0.3 0.3 0.4 0.4 0.4 0.4 6.94
Ireland 2.4 3.2 3.9 4.1 4.5 4.9 5.3 5.7 6.1 6.5 6.9 7.84
Italy 24.3 29.8 34.0 34.9 36.2 37.3 38.5 39.6 40.5 41.4 42.1 2.72
Luxembourg 0.2 0.3 0.4 0.4 0.4 0.5 0.5 0.5 0.6 0.6 0.6 6.85
F i g u r e 1 2 - 6 ( C o n t i n u e d )
Decision Support Database: Private Healthcare Expenditure in Billion USD (World),
2002-2012
Region/Country 2002 2003 2004 2005 2006 2007 2008 2009 2010 2011 2012CAGR %
(2005-2012)

#M16F-54 © 2007 Frost & Sullivan www.frost.com August 2007 12-14
Definition: Figures in the table represents private health expenditure
Note: 1. Figures for 2005 are Frost & Sullivan estimates
Note: All figures are rounded; the base year is 2005. Source: Frost & Sullivan
Netherlands 13.4 19.0 22.5 24.4 24.0 25.6 27.0 28.2 28.9 29.7 30.3 3.14
Norway 3.0 3.9 4.5 5.2 5.7 6.1 6.6 7.1 7.6 8.0 8.5 7.18
Portugal 3.4 4.2 4.8 5.1 5.3 5.5 5.8 6.0 6.3 6.5 6.8 4.22
Spain 14.3 18.6 22.1 25.2 26.8 28.4 30.0 31.6 33.1 34.5 35.8 5.13
Sweden 3.3 4.2 4.9 5.0 5.2 5.4 5.7 6.0 6.3 6.6 7.1 5.14
Switzerland 12.5 15.5 17.3 17.9 18.8 19.7 20.6 21.5 22.3 23.2 24.1 4.38
United Kingdom 20.1 23.2 27.4 28.4 29.4 30.3 31.4 32.2 32.7 33.3 33.6 2.46
TOTAL 208.8 262.0 302.3 319.3 331.4 345.0 358.5 371.7 382.7 394.2 404.7 3.45
Eastern Europe
Czech Republic 0.4 0.6 0.6 0.9 0.9 0.9 1.0 1.1 1.2 1.3 1.4 5.91
Hungary 1.5 2.1 2.6 2.9 3.3 3.6 4.0 4.3 4.6 4.9 5.2 8.65
Poland 3.5 3.8 4.2 4.9 5.4 5.8 6.3 6.7 7.1 7.5 7.9 7.05
Russia 9.4 11.6 14.4 16.9 19.3 21.7 23.9 26.1 28.3 30.4 32.4 9.73
Turkey 4.0 5.5 6.8 9.1 10.1 11.2 12.2 13.2 14.1 15.1 16.0 8.39
TOTAL 18.8 23.5 28.7 34.8 39.0 43.2 47.4 51.4 55.4 59.2 62.9 8.84
Middle East & Africa
Egypt 2.7 2.3 2.6 3.1 4.0 4.8 5.6 6.4 7.3 8.3 9.4 17.41
Israel 3.4 3.5 4.1 4.6 5.0 5.4 5.8 6.3 6.8 7.4 8.1 8.34
Saudi Arabia 1.8 2.0 2.2 2.4 2.6 2.7 2.8 3.0 3.1 3.2 3.4 5.05
South Africa 6.1 8.9 13.1 13.1 13.7 14.3 15.1 15.9 16.9 18.0 19.2 5.68
TOTAL 14.0 16.7 22.0 23.1 25.2 27.3 29.3 31.6 34.1 36.9 40.0 8.17
WORLD TOTAL 1,348.2 1,517.3 1,680.4 1,823.3 1,916.3 2,052.5 2,194.7 2,342.7 2,493.8 2,655.8 2,821.2 6.43
F i g u r e 1 2 - 6 ( C o n t i n u e d )
Decision Support Database: Private Healthcare Expenditure in Billion USD (World),
2002-2012
Region/Country 2002 2003 2004 2005 2006 2007 2008 2009 2010 2011 2012CAGR %
(2005-2012)