european influenza surveillance...
TRANSCRIPT

ANNUAL REPORT 2001-2002 INFLUENZA SEASON
European Influenza Surveillance Scheme
European Influenza Surveillance Scheme
Annual Report
2001-2002 influenza season Utrecht, December 2002 NIVEL, Netherlands Institute for Health Services Research Postbus 1568, 3500 BN Utrecht, the Netherlands Drieharingstraat 6, Utrecht, the Netherlands

Annual Report: 2001-2002 Influenza Season, EISS, 2002 2
The European Influenza Surveillance Scheme Annual Report: 2001-2002 influenza season was prepared by the EISS co-ordination staff, with the collaboration of the members of EISS. EISS co-ordination staff (NIVEL): Tamara Meerhoff, John Paget, Koos van der Velden, Jouke van der Zee Members of EISS: Alexandrescu V (Romania), Aymard M (France), Bartelds AIM (the Netherlands), Brydak L (Poland), Buchholz U (Germany), Christie P (United Kingdom), Cohen JM (France), Domegan L (Ireland), Falcao I (Portugal), Fleming DM (United Kingdom), Grauballe P (Denmark), Havlickova M (Czech Republic), Heckler R (Germany), Heijnen M-L (the Netherlands), Hungnes O (Norway), Iversen B (Norway), de Jong JC (the Netherlands), Kramer M (Germany), Kristufkova Z (Slovak Republic), Lina B (France), Linde A (Sweden), Lupulescu E (Romania), Machala M (Poland), Meerhoff TJ (the Netherlands), Manuguerra J-C (France), de Mateo S (Spain), Mosnier A (France), Müller D (Switzerland), Nolan D (Ireland), O’Flanagan D (Ireland), Paget WJ (the Netherlands), Penttinen P (Sweden), Perez-Brena P (Spain), Pierquin F (Belgium), Pregliasco F (Italy), Prosenc K (Slovenia), Rebelo de Andrade H (Portugal), Samuelsson S (Denmark), Schweiger B (Germany), Socan M (Slovenia), Thomas D (United Kingdom), Thomas Y (Switzerland), Tumova B (Czech Republic), Uphoff H (Germany), Valette M (France), Vega T (Spain), van der Velden K (the Netherlands), van der Werf S (France), Watson J (United Kingdom), Yane F (Belgium) and Zambon M (United Kingdom).
Acknowledgement: We are grateful to Dr Alan Hay (WHO Influenza Centre, Mill Hill, United Kingdom) for providing the haemagglutination inhibition tables for characterized viruses in Europe (see Appendix 5.3). EISS is funded by the European Commission (DG-Health and Consumer Protection). EISS also receives funding from GlaxoSmithKline and Roche. Neither the European Commission, GlaxoSmithKline nor Roche, nor any person acting on their behalf is liable for any use made of the information in this report.
Suggested citation: European Influenza Surveillance Scheme. Annual report: 2001-2002 influenza season. Utrecht, the Netherlands: NIVEL, 2002.
The report is accessible via the EISS website: www.eiss.org ISBN 90-6905-587-2

Annual Report: 2001-2002 Influenza Season, EISS, 2002 3
Table of contents European Influenza Surveillance Scheme: participating countries and institutions 5 Abbreviations 6 Netherlands Institute for Health Services Research (NIVEL) 6 Summary 7
1 Background 8 1.1 Introduction 8 1.2 The surveillance of communicable diseases in Europe 8 1.3 EISS Project 9 1.3.1 Objectives 9 1.3.2 Membership 10 1.3.3 Methods 10 1.3.4 EISS website 10 1.3.5 EISS co-ordination centre 11 1.3.6 Funding 11
2 Influenza activity: 2001-2002 season 12
2.1 Introduction 12 2.2 Methods 12 2.3 Results 12 2.3.1 Clinical data 12 2.3.2 Virological data 16 2.4 Conclusions 18
3 EISS developments during the 2001-2002 season 20 3.1 Objectives 20 3.2 Activities 20 3.3 Conclusions 22
4 References 23
5 Appendices 24
5.1 Partners 24 5.2 Levels of influenza activity 24 5.3 Haemagglutination inhibition (HI) assays from Europe and the UK 26 5.4 EISS Publications 30 5.5 Members 31

Annual Report: 2001-2002 Influenza Season, EISS, 2002 4
Annual Report: 2001-2002 Influenza Season, EISS, 2002 5
European Influenza Surveillance Scheme: participating countries and institutions Belgium Scientific Institute of Public Health Brussels Czech Republic National Institute of Public Health Prague Denmark Statens Serum Institut Copenhagen France Open Rome Paris Institut Pasteur Paris Université Claude Bernard Lyon I Lyon Germany ArbeitsGemeinschaft Influenza Marburg Niedersächsisches Landesgesundheitsamt Hanover Robert Koch-Institut Berlin Ireland National Disease Surveillance Centre Dublin Irish College of General Practitioners Dublin Italy Università degli Studi di Milano Milan Istituto Superiore di Sanità Rome Università di Genova Genoa Netherlands Erasmus University Rotterdam National Institute for Public Health and the Environment Bilthoven Netherlands Institute for Health Services Research Utrecht Norway National Institute of Public Health Oslo Poland National Influenza Center Warsaw National Institute of Hygiene Portugal Instituto Nacional de Saude Lisboa Romania Cantacuzino Insitute Bucharest Slovak Republic State Health Institute Bratislava Slovenia Institute of Public Health Ljubljana Spain Instituto de Salud Carlos III Madrid Sweden Swedish Institute for Infections Disease Control Solna Switzerland Swiss Federal Office of Public Health Geneva University Hospital of Geneva United Kingdom Public Health Laboratory Service London Royal College of General Practitioners Birmingham Scottish Centre for Infection and Environmental Health Glasgow Public Health Laboratory Service Cardiff
See Appendix 5.5 for further details
Annual Report: 2001-2002 Influenza Season, EISS, 2002 6
Abbreviations ARI Acute respiratory infection EISS European Influenza Surveillance Scheme EC European Commission EPIET European Programme for Intervention Epidemiology Training EU European Union EuroGROG European Groupe Régional d’Observation de la Grippe FluNet Global WHO surveillance system of influenza GPs General practitioners GROG Groupes Régionaux d’Observation de la Grippe ILI Influenza-like illness NIVEL Netherlands Institute for Health Services Research PHLS Public Health Laboratory Service UK United Kingdom WHO World Health Organization
Netherlands Institute for Health Services Research (NIVEL) The EISS co-ordination centre is based at NIVEL in Utrecht, the Netherlands. NIVEL is an independent, non-profit research foundation. In 2001 NIVEL had approximately 160 employees and a gross annual turnover of about 12 million Euros. NIVEL has been in charge of the Dutch sentinel surveillance system since 1970. It is a WHO Collaborating Centre for Primary Health Care and it received full ISO-9001 accreditation for its research activities in December 2001.
Annual Report: 2001-2002 Influenza Season, EISS, 2002 7
Summary This report consists of three chapters: background information on the European Influenza Surveillance Scheme (EISS), an epidemiological and virological description of influenza activity during the 2001-2002 influenza season and EISS project developments during the 2001-2002 season. The 2000-2001 Annual Report had a special focus on clinical morbidity over time, the present report has a special focus on sentinel and non-sentinel virological data collected during the 2001-2002 season. EISS has gradually grown over the years and had 18 member countries covering 20 influenza surveillance networks during the 2001-2002 influenza season. Four new members joined the scheme during the 2001-2002 influenza season: Norway, Poland, the Slovak Republic and Romania. During the 2001-2002 season, the EISS project included 26 national reference laboratories, at least 10,500 sentinel physicians and covered a total population of 438 million inhabitants. The surveillance of influenza by the EISS members is based on an integrated clinical and virological surveillance model. Sentinel primary care physicians report cases of ILI or ARI to a data collection centre and take nose and/or throat swabs from patients for laboratory testing. All laboratory tests are performed by a national reference laboratory. The integration of clinical and virological information allows the presentation of influenza morbidity rates and virological data in the same population. Influenza activity in Europe during the 2001-2002 influenza season was mild to moderate. Compared to historical data, the intensity was low in eight countries, medium in eleven and high in one country (Spain). Influenza activity was largely due to the influenza A(H3N2) virus. Influenza A(H1N1) viruses were isolated sporadically. Two novel influenza virus strains were isolated during the 2001-2002 influenza season: influenza A(H1N2) viruses (mainly isolated in the United Kingdom and Ireland, but also in Belgium, France, Germany, the Netherlands, Portugal, Sweden, Switzerland and Romania) and influenza B viruses belonging to the B/Victoria/2/87 lineage (mainly isolated in Germany, but also sporadically in France, Italy, the Netherlands, Norway and Switzerland). With the exception of influenza A(H1N2) detections in England and Ireland and the influenza B belonging to the B/Victoria/2/87 lineage in Germany, these two viruses did not circulate widely in Europe and did not play an important role in influenza activity during the 2001-2002 influenza season. An influenza B virus belonging to the B/Victoria/2/87 lineage will be included in the 2002-2003 influenza vaccine. The new influenza A(H1N2) subtype is covered by the 2002-2003 vaccine, as the haemagglutinin and neuraminidase components of the H1N2 viruses are antigenically similar to the vaccine components (H1N1 and H3N2). EISS implemented a number of projects during the 2001-2002 influenza season, including: the creation of a new EuroGROG website, two clinical reporting quality control assessments (in Belgium and Spain); and an active participation in pandemic planning activities at a European level. EISS collaborates with other EC-funded communicable disease surveillance networks in Europe and actively supports the global WHO FluNet influenza surveillance system.

Annual Report: 2001-2002 Influenza Season, EISS, 2002 8
1 Background
1.1 Introduction Influenza is an important public health problem in the industrialised world. It is associated with increased general practice consultation rates, hospital admissions (Fleming, 2000) and excess deaths (Simonsen et al., 1997; Fleming, 2000). It must also be considered in terms of increased days lost to absence from work and school, health care planning and influenza pandemic planning. The WHO established an international network for the surveillance of influenza in 1949 (WHO, 2000). This global surveillance system comprises over 110 national influenza centres, and influenza activity is published every week on the Internet (Flahault et al., 1998). National influenza centres in Europe have participated in this surveillance system since its creation. The surveillance of influenza morbidity in the general population began in the 1960s in western Europe (in England and Wales) and was based on sentinel physicians reporting clinical cases of influenza to a central registry. In the early 1990s, the integration of virological information was achieved by the collection of nose and/or throat swabs from patients diagnosed with influenza (Fleming et al, 1995). The swabs were sent to national influenza reference laboratories for testing and subtyping. The integration of clinical and virological data collected in the same population is the basis of the EISS project (Fleming and Cohen, 1996; Snacken et al., 1998; Manuguerra et al., 2001). Efforts to create a European surveillance project have been ongoing since the 1980s. The first project was the Eurosentinel scheme (1987-1991). This was followed by the ENS-CARE Influenza Early Warning Scheme (1991-1994) (Snacken et al., 1995; Fleming and Cohen, 1996), the European Influenza Early Warning and Surveillance Scheme (1995) and EISS (1996-) (Snacken et al., 1998). EISS began with the participation of seven countries: Belgium, France, Germany, the Netherlands, Portugal, Spain and the United Kingdom. There are many reasons why influenza surveillance networks in Europe have got together to share information. Influenza is a communicable disease that spreads rapidly and efficiently; this means that it is very beneficial for countries to be informed about influenza activity in neighbouring countries (clinical morbidity and the types and strains of influenza virus that are in circulation). Other benefits of working together are that surveillance systems can learn from each other and therefore improve their current surveillance activities. Collaboration also helps the creation and development of influenza surveillance networks across the whole of Europe.
1.2 The surveillance of communicable diseases in Europe The European Union’s competence in public health has steadily increased over time. While some mention of health was present in the early treaties, going back as far as the European Coal and Steel Community (ECSC) Treaty of 1951, its first substantive appearance was in the Single European Act of 1987 (McKee & Maclehose, 2000/2001). This Act enabled the development of the Europe Against Cancer and Europe Against AIDS programmes (McKee & Maclehose, 2000/2001).
Annual Report: 2001-2002 Influenza Season, EISS, 2002 9
It was only in 1992, in Article 129 of the Maastricht Treaty, that a competence in the field of communicable disease was actually defined (McKee & Maclehose, 2000/2001). The Amsterdam Treaty of 1997 (Article 152) reinforced this competency and emphasised that “a high level of health protection should be ensured in the definition and implementation of all Community policies and activities” (McKee & Maclehose, 2000/2001). The provisions of the different Treaties have enabled the development of a range of policies on communicable disease prevention and control (McKee & Maclehose, 2000/2001). In 1998, the European Parliament and the Council decided that a network for the epidemiological surveillance and control of communicable diseases should be established in the Community (2119/98/EC, 24 September 1998). On 22 December 1999, two Commission Decisions were adopted which further defined this framework. The first Decision (2000/57/EC) concerned the terms of action for an early warning and response system: events that are potential public health threats are to be monitored and reported. The Decision describes procedures for the exchange of information, and stipulates the action to be undertaken in case of potential threats and in the case of confirmed threats to public health. The second Decision (2000/96/EC) identifies the communicable diseases and special health issues that have to be covered by epidemiological surveillance in the “Community network”. Influenza is one of the communicable diseases listed in this Decision. As a result of these two Decisions, a new European early warning and response system for communicable diseases was officially launched on 1 January 2000. EISS is one of the epidemiological surveillance networks that the EC funds to monitor communicable diseases in Europe. EISS is a member of the EC Network Forum, which groups together the different community surveillance projects in Europe (e.g. EuroTB, EPIET, Eurosurveillance).
1.3 The EISS project
1.3.1 Objectives The EISS project has the following objectives: - To collect and exchange timely information on influenza activity in Europe; - To combine clinical and virological data in the same population; - To identify causal viruses in the population and recognise virological changes; - To provide standardised information of high quality; - To strengthen, and harmonise where appropriate, epidemiological and virological
methods for assessing influenza activity in Europe
1.3.2 Membership All countries in Europe are welcome to join EISS. Full members must meet the following criteria: - The network is nationally or regionally representative; - The authority of the network is recognised by the national or regional health authority in
the country or region; - Clinical surveillance and virological surveillance are integrated in the same population
(community); - The network has functioned successfully for two years; - The network can deliver data on a weekly basis.
Annual Report: 2001-2002 Influenza Season, EISS, 2002 10
A total of 11 EU (Belgium, Denmark, France, Germany, Ireland, Italy, the Netherlands, Portugal, Spain, Sweden and the United Kingdom) and 7 non-EU states (the Czech Republic, Norway, Poland, Romania, Slovenia, the Slovak Republic and Switzerland) were members of EISS during the 2001-2002 influenza season. Since Scotland and Wales have their own influenza surveillance networks, there were 20 networks in EISS during this season. With the exception of the Spanish network, all networks are national; the Spanish influenza surveillance network is made up of 6 regional networks that cover 53% of the total population. Six networks were “associate” members of EISS during the 2001-2002 season (Ireland, Norway, Poland, Romania, the Slovak Republic and Sweden), as they did not completely fit the membership criteria (Ireland because it hadn’t been in operation for two years and Norway, Poland, Romania, the Slovak Republic and Sweden because they do not yet combine clinical and virological data in the same population). The associate members report clinical and virological data on influenza to the EISS database and are included in the presentation of results where possible.
1.3.3 Methods The clinical surveillance of influenza by the EISS networks is generally based on reports made by sentinel general practitioners. Some of the sentinel surveillance systems also include paediatricians (the Czech Republic, France, Germany, Italy, Romania, Slovenia, Slovak Republic, Spain, Switzerland) and physicians with other specialisations (Slovenia and Switzerland). The physicians usually represent 1-5% of physicians working in the country, community or region. For the virological surveillance of influenza, the sentinel physicians are asked to take nose and/or throat swabs from patients with influenza-like illness or acute respiratory infection (depending on the sentinel surveillance system). The swabs are sent to a national reference laboratory and tested for influenza viruses (if positive, subtypes are determined). Laboratory tests are based on rapid diagnostic tests (immuno-enzymological or immunofluorescence) and cell cultures with specific identification. Certain laboratories also use reverse transcription polymerase chain reaction (RT-PCR) routinely as a rapid test. In addition to the respiratory specimens obtained from sentinel practitioners, the laboratories also collect and report results on specimens obtained from other sources (e.g. from hospitals, non-sentinel physicians or institutional homes). This data is collected to better describe influenza activity across Europe, as a range of indices is used to monitor influenza activity in different countries. It also allows the validation of the virological data obtained from sentinel sources. The clinical and virological data are collected from week 40 to week 20 of the following year. After processing and analysis by national centres, the weekly data are entered into the EISS database (see below) by Thursday of the following week.
1.3.4 EISS website The EISS project involves different partners in each country: sentinel surveillance systems, national influenza reference laboratories and national communicable disease surveillance centres. These various partners are connected via Internet (www.eiss.org) (Snacken et al., 1995), which allows members to enter their data into the EISS database, to view influenza activity in the other networks and to launch detailed clinical and virological queries.

Annual Report: 2001-2002 Influenza Season, EISS, 2002 11
During the influenza season, a Weekly Electronic Bulletin is published on the EISS website. This Bulletin is written by four experts from the EISS group and is based on data entered into the EISS database. It provides a weekly overview of influenza activity in Europe in the form of a written commentary, a table, and graphs for each country.
1.3.5 EISS co-ordination centre The co-ordination of the EISS project is based at the Netherlands Institute for Health Services Research (NIVEL) in Utrecht, the Netherlands. The role of the co-ordination centre is to: - Manage the EISS website; - Manage the EISS database; - Co-ordinate EISS projects (e.g. harmonisation projects); - Initiate new projects (e.g. mapping); - Present results (e.g. write scientific articles); - Encourage the exchange of information between EISS members; - Exchange information with key-partners (e.g. EC and WHO); - Represent EISS at meetings (e.g. EC meetings); - Manage contracts (with the EC and industry); - Organise EISS meetings twice a year; - Write an Annual Report.
1.3.6 Funding EISS began receiving funding from the European Commission (EC) in November 1999. It has received funding from industry since September 2000 (GlaxoSmithKline and Roche). The EISS project uses the following formula to separate EC and industry funding: EC projects: All projects that concern the ongoing running of the surveillance system,
the EISS website, the two regular annual meetings of EISS, the harmonisation and standardisation projects (e.g. the quality control studies), and the extension of EISS to other countries in Europe, particularly Member States and applicant countries
Industry projects: All other projects (e.g. the EISS Weekly Electronic Bulletin) In 2001 and 2002, 70-75% of the total EISS budget was funded by the EC and 25-30% by industry.
EISS has a strict “code-of-conduct” concerning the influence of industry on its activities and publications, including those on its website. Industry is not involved in the management structure of EISS (industry has an observer status at its two annual meetings) or in the preparation of EISS documents, reports and publications.
Annual Report: 2001-2002 Influenza Season, EISS, 2002 12
2 Influenza activity: 2001-2002 season
2.1 Introduction During the 2001-2002 influenza season, the EISS project included 26 national influenza reference laboratories, at least 10,500 sentinel physicians and covered a total population of 438 million inhabitants. This chapter provides an overview of influenza activity during the 2001-2002 season and is largely based on an article published in Eurosurveillance (Paget et al., 2002).
2.2 Methods Clinical and virological data on influenza are presented for week 40/2001 to week 15/2002. Table 1 presents the general characteristics of the different sentinel surveillance systems during the 2001-2002 influenza season. With the exception of Norway, all EISS networks reported cases of ILI or ARI per 100,000 population. The EISS methods are described in section 1.3.3.
2.3 Results
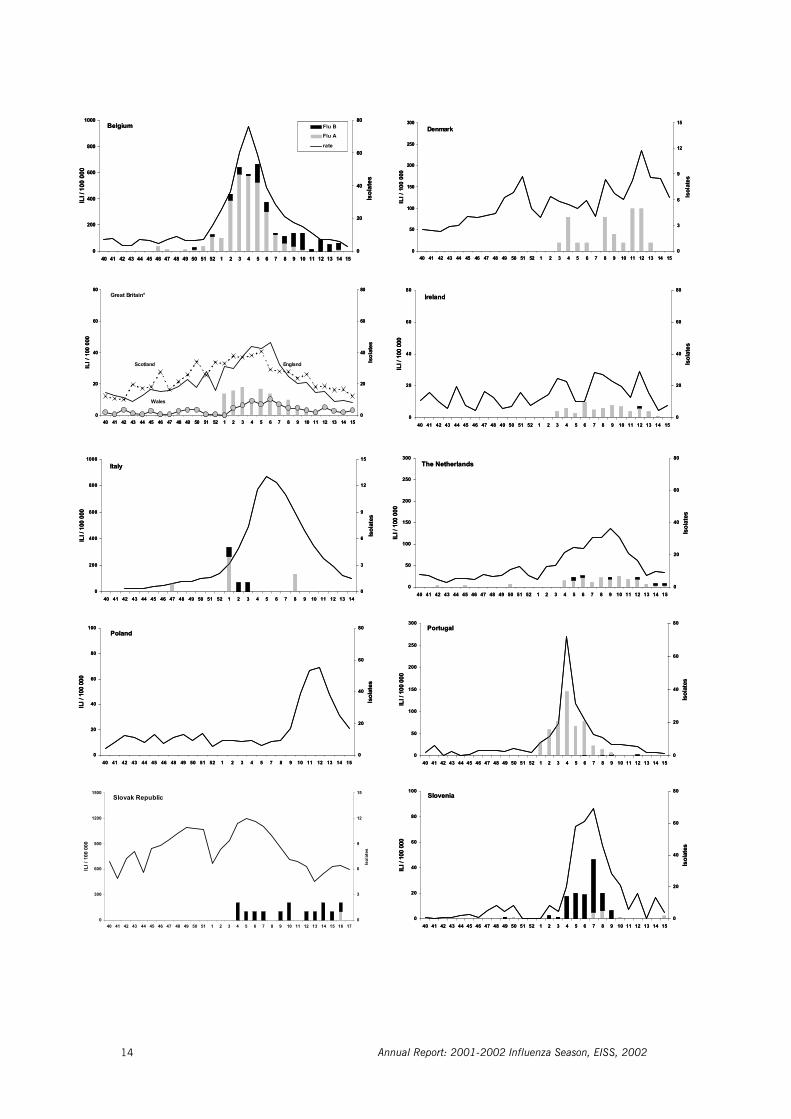
2.3.1 Clinical data An overview of the influenza activity in the EISS networks during the 2001-2002 winter season can be found in Figure 1 and Table 2. Peak clinical morbidity rates were generally reached around week 04/2002-06/2002, with some networks in the north and east of Europe reaching these levels later in the winter (around week 11/2002). The peak levels of clinical morbidity varied considerably from one network to another, with networks reporting ILI rates ranging from 9 per 100,00 population in Wales to 1,201 per 100,000 population in the Slovak Republic. Clinical morbidity rates of ARI were generally higher and also varied considerably, from 375 per 100,000 population in Romania to 3,320 per 100,000 population in France. The geographical spread of influenza ranged from sporadic (in six networks) to widespread (in eleven networks), whilst the intensity of the activity ranged from low (eight networks) to high (in Spain). Widespread activity of medium or high intensity was reported in Belgium, France, Germany, Italy, the Netherlands, Portugal, Romania, Spain, Sweden and Switzerland. Sporadic influenza activity of low intensity was reported in the Czech Republic, Denmark, Ireland, Scotland, Slovak Republic and Wales.

Table 1: Summary characteristics of the sentinel surveillance systems in EISS (Aguilera et al., 2001) Country / network
Year network was started
Year network joined EISS1
General practitioners2
Paedia-tricians2
Others2
Numerator (ILI – ARI)3
Case definition (yes - no)
Belgium 1985 1996 98 0 0 ILI yes Czech Republic 1968 1998 2230 1240 0 ARI yes Denmark 1995 1999 150 0 0 ILI yes England 1964 1996 360 0 0 ILI no France 1984 1996 378 74 0 ARI yes Germany 1992 1996 450 100 0 ARI yes Italy 1996 1998 500 40 0 ILI yes The Netherlands 1970 1996 67 0 0 ILI yes Portugal 1989 1996 170 0 0 ILI yes Scotland 1971 1996 90 0 0 ILI yes Slovenia 1999 2000 11 14 194 ILI yes Spain 1994 1996 200 60 0 ILI yes Switzerland 1986 1997 154 43 685 ILI yes Wales 1986 1996 30 0 0 ILI yes
Associate members Ireland 2000 2000 32 0 0 ILI yes Norway 1975 2001 201 practices* 0 0 ILI yes Poland 1946 2001 Not known 0 0 ILI yes Romania 1992 2001 240 102 0 ARI yes Slovak Republic 1960 2001 2121 1202 0 ILI yes Sweden 1999 2000 118 0 0 ILI no
1 Many of the networks were members of pre-EISS surveillance projects in Europe – the Eurosentinel (1987-91) and
ENS-CARE Influenza Early Warning System (1992-95) projects 2 Number of physicians during the 2001-2002 influenza season 3 ARI: acute respiratory infection; ILI: influenza-like illness 4 Physicians working in community schools (children) and youth health services 5 Physicians specialised in internal medicine * One or more GP(s) per practice Table 2: Overview of influenza activity in the EISS networks during the 2001-2002 season
Country / network
Peak clinical morbidity rate (per 100,000 population)
Week of peakclinical
morbidity
Geographical spread1
(peak weekly level)
Intensity2 (peak weekly
level)
Dominant virus type/subtype
(sentinel data)
Influenza-like illness: Belgium 951 4 Widespread Medium A(H3N2) Denmark 235 12 Sporadic Low A(H3N2) England 45 6 Regional Low A(H3N2) Ireland 29 12 Sporadic Low A(H3N2) Italy 688 5 Widespread Medium A(H3N2) The Netherlands 136 9 Widespread Medium A(H3N2) Norway n.a. 9 Widespread Low A(H3N2) Poland 69 11 Local Medium n.a. Portugal 271 4 Widespread Medium A(H3N2) Scotland 38 5 Sporadic Low A Slovak Republic3 1201 5 Sporadic Low B Slovenia 86 7 Local Medium B Spain 399 4 Widespread High A(H3N2) Sweden 38 11 Widespread Medium n.a. Switzerland 400 5 Widespread Medium B Wales 9 6 Sporadic Low A Acute respiratory infections: Czech Republic 1692 51 Sporadic Low A(H3N2) France 3320 5 Widespread Medium A(H3N2) Germany 2284 10 Widespread Medium A(H3N2) & B Romania 375 11 Widespread Medium A(H3N2)
1 Geographical spread: See appendix 5.2 2 Intensity: See appendix 5.2 3 The peak clinical morbidity rate may be biased upwards as sentinel physicians in the Slovak Republic began
reporting cases of ILI instead of ARI during the 2001-2002 season, some of the sentinel physicians may have continued reporting cases of ARI
n.a: not applicable as no sentinel data is available
Annual Report: 2001-2002 Influenza Season, EISS, 2002 14
0
200
400
600
800
1000
40 41 42 43 44 45 46 47 48 49 50 51 52 1 2 3 4 5 6 7 8 9 10 11 12 13 14 15
ILI /
100
000
0
20
40
60
80
Isol
ates
Flu BFlu A
rate
Belgium
0
50
100
150
200
250
300
40 41 42 43 44 45 46 47 48 49 50 51 52 1 2 3 4 5 6 7 8 9 10 11 12 13 14 15
ILI /
100
000
0
3
6
9
12
15
Isol
ates
Denmark
0
20
40
60
80
40 41 42 43 44 45 46 47 48 49 50 51 52 1 2 3 4 5 6 7 8 9 10 11 12 13 14 15
ILI /
100
000
0
20
40
60
80
Isol
ates
Great Britain*
EnglandScotland
Wales
0
20
40
60
80
40 41 42 43 44 45 46 47 48 49 50 51 52 1 2 3 4 5 6 7 8 9 10 11 12 13 14 15
ILI /
100
000
0
20
40
60
80
Isol
ates
Ireland
0
200
400
600
800
1000
40 41 42 43 44 45 46 47 48 49 50 51 52 1 2 3 4 5 6 7 8 9 10 11 12 13 14
ILI /
100
000
0
3
6
9
12
15
Isol
ates
Italy
0
50
100
150
200
250
300
40 41 42 43 44 45 46 47 48 49 50 51 52 1 2 3 4 5 6 7 8 9 10 11 12 13 14 15
ILI /
100
000
0
20
40
60
80
Isol
ates
The Netherlands
0
20
40
60
80
100
40 41 42 43 44 45 46 48 49 50 51 52 1 2 3 4 5 7 8 9 10 11 12 13 14 15
ILI /
100
000
0
20
40
60
80
Isol
ates
Poland
0
50
100
150
200
250
300
40 41 42 43 44 45 46 47 48 49 50 51 52 1 2 3 4 5 6 7 8 9 10 11 12 13 14 15
ILI /
100
000
0
20
40
60
80
Isol
ates
Portugal
0
20
40
60
80
100
40 41 42 43 44 45 46 47 48 49 50 51 52 1 2 3 4 5 6 7 8 9 10 11 12 13 14 15
ILI /
100
000
0
20
40
60
80
Isol
ates
Slovenia
0
300
600
900
1200
1500
40 41 42 43 44 45 46 47 48 49 50 51 1 2 3 4 5 6 7 8 9 10 11 12 13 14 15 16 17
ILI /
100
000
0
2
4
6
8
10
Isol
ates
/ Iso
lats
Slovak Republic / Rép. Slovaque
0
300
600
900
1200
1500
40 41 42 43 44 45 46 47 48 49 50 51 1 2 3 4 5 6 7 8 9 10 11 12 13 14 15 16 17
ILI /
100
000
0
3
6
9
12
15
Isol
ates
Slovak Republic
0
200
400
600
800
1000
40 41 42 43 44 45 46 47 48 49 50 51 52 1 2 3 4 5 6 7 8 9 10 11 12 13 14 15
ILI /
100
000
0
20
40
60
80
Isol
ates
Flu BFlu A
rate
Belgium
0
50
100
150
200
250
300
40 41 42 43 44 45 46 47 48 49 50 51 52 1 2 3 4 5 6 7 8 9 10 11 12 13 14 15
ILI /
100
000
0
3
6
9
12
15
Isol
ates
Denmark
0
20
40
60
80
40 41 42 43 44 45 46 47 48 49 50 51 52 1 2 3 4 5 6 7 8 9 10 11 12 13 14 15
ILI /
100
000
0
20
40
60
80
Isol
ates
Great Britain*
EnglandScotland
Wales
0
20
40
60
80
40 41 42 43 44 45 46 47 48 49 50 51 52 1 2 3 4 5 6 7 8 9 10 11 12 13 14 15
ILI /
100
000
0
20
40
60
80
Isol
ates
Ireland
0
200
400
600
800
1000
40 41 42 43 44 45 46 47 48 49 50 51 52 1 2 3 4 5 6 7 8 9 10 11 12 13 14
ILI /
100
000
0
3
6
9
12
15
Isol
ates
Italy
0
50
100
150
200
250
300
40 41 42 43 44 45 46 47 48 49 50 51 52 1 2 3 4 5 6 7 8 9 10 11 12 13 14 15
ILI /
100
000
0
20
40
60
80
Isol
ates
The Netherlands
0
20
40
60
80
100
40 41 42 43 44 45 46 48 49 50 51 52 1 2 3 4 5 7 8 9 10 11 12 13 14 15
ILI /
100
000
0
20
40
60
80
Isol
ates
Poland
0
50
100
150
200
250
300
40 41 42 43 44 45 46 47 48 49 50 51 52 1 2 3 4 5 6 7 8 9 10 11 12 13 14 15
ILI /
100
000
0
20
40
60
80
Isol
ates
Portugal
0
20
40
60
80
100
40 41 42 43 44 45 46 47 48 49 50 51 52 1 2 3 4 5 6 7 8 9 10 11 12 13 14 15
ILI /
100
000
0
20
40
60
80
Isol
ates
Slovenia
0
300
600
900
1200
1500
40 41 42 43 44 45 46 47 48 49 50 51 1 2 3 4 5 6 7 8 9 10 11 12 13 14 15 16 17
ILI /
100
000
0
2
4
6
8
10
Isol
ates
/ Iso
lats
Slovak Republic / Rép. Slovaque
0
300
600
900
1200
1500
40 41 42 43 44 45 46 47 48 49 50 51 1 2 3 4 5 6 7 8 9 10 11 12 13 14 15 16 17
ILI /
100
000
0
3
6
9
12
15
Isol
ates
Slovak Republic

Annual Report: 2001-2002 Influenza Season, EISS, 2002 15
0
100
200
300
400
500
40 41 42 43 44 45 46 47 48 49 50 51 52 1 2 3 4 5 6 7 8 9 10 11 12 13 14 15
ILI /
100
000
0
50
100
150
200
250
300
Isol
ates
Spain
0
20
40
60
80
100
40 41 42 43 44 45 46 47 48 49 50 51 52 1 2 3 4 5 6 7 8 9 10 11 12 13 14 15
ILI /
100
000
0
20
40
60
80
Isol
ates
Sweden
0
100
200
300
400
500
40 41 42 43 44 45 46 47 48 49 50 51 52 1 2 3 4 5 6 7 8 9 10 11 12 13 14 15
ILI /
100
000
0
20
40
60
80
Isol
ates
Switzerland
0,0
1,0
2,0
3,0
4,0
5,0
40 41 42 43 44 45 46 47 48 49 50 51 52 1 2 3 4 5 6 7 8 9 10 11 12 13 14 15
ILI %
0
3
6
9
12
15
Isol
ates
Norway
0
1000
2000
3000
4000
5000
40 41 42 43 44 45 46 47 48 49 50 51 52 1 2 3 4 5 6 7 8 9 10 11 12 13 14
AR
I / 10
0 00
0
0
20
40
60
80
Isol
ates
Czech Republic
0
1000
2000
3000
4000
5000
40 41 42 43 44 45 46 47 48 49 50 51 52 1 2 3 4 5 6 7 8 9 10 11 12 13 14 15
ARI /
100
000
0
50
100
150
200
250
300
Isol
ates
France
0
100
200
300
400
500
40 41 42 43 44 45 46 47 48 49 50 51 52 1 2 3 4 5 6 7 8 9 10 11 12 13 14 15
ARI /
100
000
0
20
40
60
80
Isol
ates
Romania
0
50 0
100 0
150 0
2 00 0
2 50 0
3 00 0
4 0 4 1 4 2 4 3 4 4 4 5 4 6 4 7 4 8 4 9 50 51 52 1 2 3 4 5 6 7 8 9 10 11 12 13 14 15
AR
I / 1
00 0
00
0
50
10 0
150
2 0 0
2 50
3 0 0
Isol
ates
Germany
ILI per 100 consultations
ARI per 100,000 population
0
100
200
300
400
500
40 41 42 43 44 45 46 47 48 49 50 51 52 1 2 3 4 5 6 7 8 9 10 11 12 13 14 15
ILI /
100
000
0
50
100
150
200
250
300
Isol
ates
Spain
0
20
40
60
80
100
40 41 42 43 44 45 46 47 48 49 50 51 52 1 2 3 4 5 6 7 8 9 10 11 12 13 14 15
ILI /
100
000
0
20
40
60
80
Isol
ates
Sweden
0
100
200
300
400
500
40 41 42 43 44 45 46 47 48 49 50 51 52 1 2 3 4 5 6 7 8 9 10 11 12 13 14 15
ILI /
100
000
0
20
40
60
80
Isol
ates
Switzerland
0,0
1,0
2,0
3,0
4,0
5,0
40 41 42 43 44 45 46 47 48 49 50 51 52 1 2 3 4 5 6 7 8 9 10 11 12 13 14 15
ILI %
0
3
6
9
12
15
Isol
ates
Norway
0
1000
2000
3000
4000
5000
40 41 42 43 44 45 46 47 48 49 50 51 52 1 2 3 4 5 6 7 8 9 10 11 12 13 14
AR
I / 10
0 00
0
0
20
40
60
80
Isol
ates
Czech Republic
0
1000
2000
3000
4000
5000
40 41 42 43 44 45 46 47 48 49 50 51 52 1 2 3 4 5 6 7 8 9 10 11 12 13 14 15
ARI /
100
000
0
50
100
150
200
250
300
Isol
ates
France
0
100
200
300
400
500
40 41 42 43 44 45 46 47 48 49 50 51 52 1 2 3 4 5 6 7 8 9 10 11 12 13 14 15
ARI /
100
000
0
20
40
60
80
Isol
ates
Romania
0
50 0
100 0
150 0
2 00 0
2 50 0
3 00 0
4 0 4 1 4 2 4 3 4 4 4 5 4 6 4 7 4 8 4 9 50 51 52 1 2 3 4 5 6 7 8 9 10 11 12 13 14 15
AR
I / 1
00 0
00
0
50
10 0
150
2 0 0
2 50
3 0 0
Isol
ates
Germany
ILI per 100 consultations
ARI per 100,000 population
Figure 1. Clinical and virological sentinel monitoring of influenza in European member countries duringthe 2001-2002 influenza seasonMorbidity rates for influenza-like illness (ILI: Belgium, Denmark, Great Britain, Ireland, Italy, The Netherlands, Poland, Portugal, Slovak Republic, Slovenia, Spain, Sweden, Switzerland and Norway) or acute respiratory infections (ARI: Czech Republic, France, Germany and Romania) are indicated for week 40 (2001) to week 15 (2002). Isolation/detection of cases of influenza infection are indicated in the bar chart. For Great Britain, morbidity indicator graphs are provided separately for each of the British networks: England, Scotland and Wales, whereas the bar charts on detection of influenza in primary care correspond to the English network. For Norway, the morbidity data is shown by 100 consultations, as for the 2001-2002 influenza season no population denominator was available.
* The number of isolates correspond to the English sentinel network
Annual Report: 2001-2002 Influenza Season, EISS, 2002 16
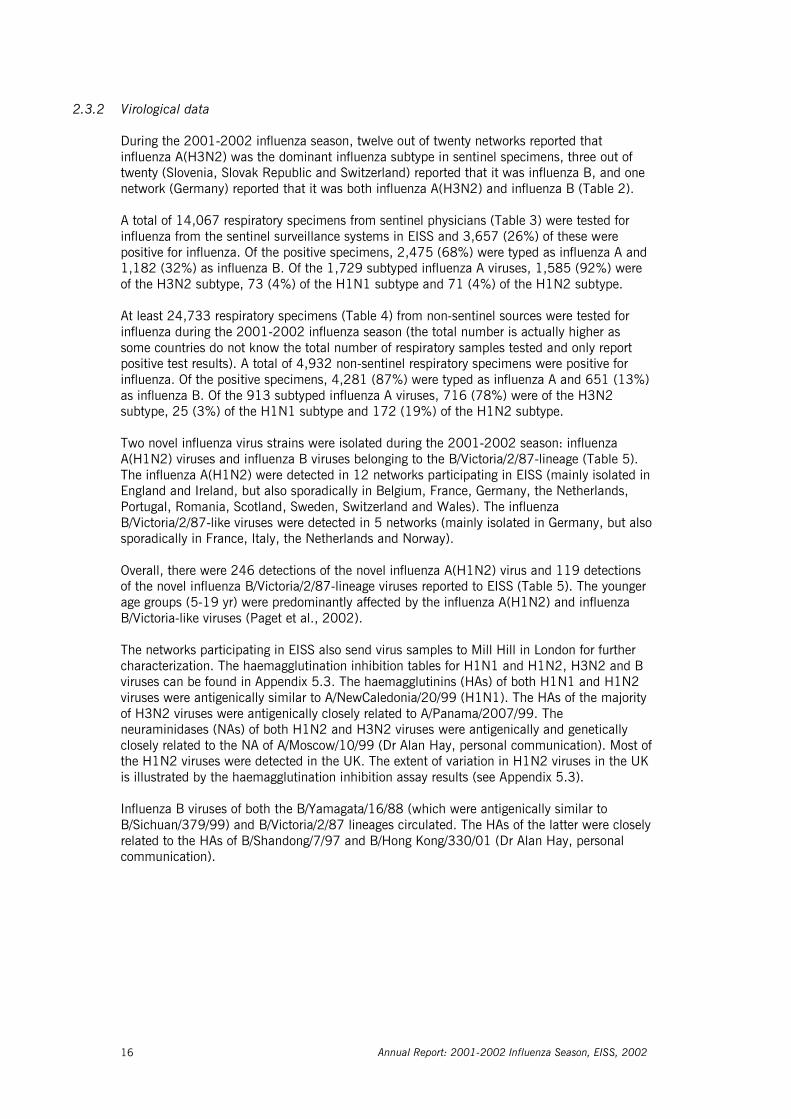
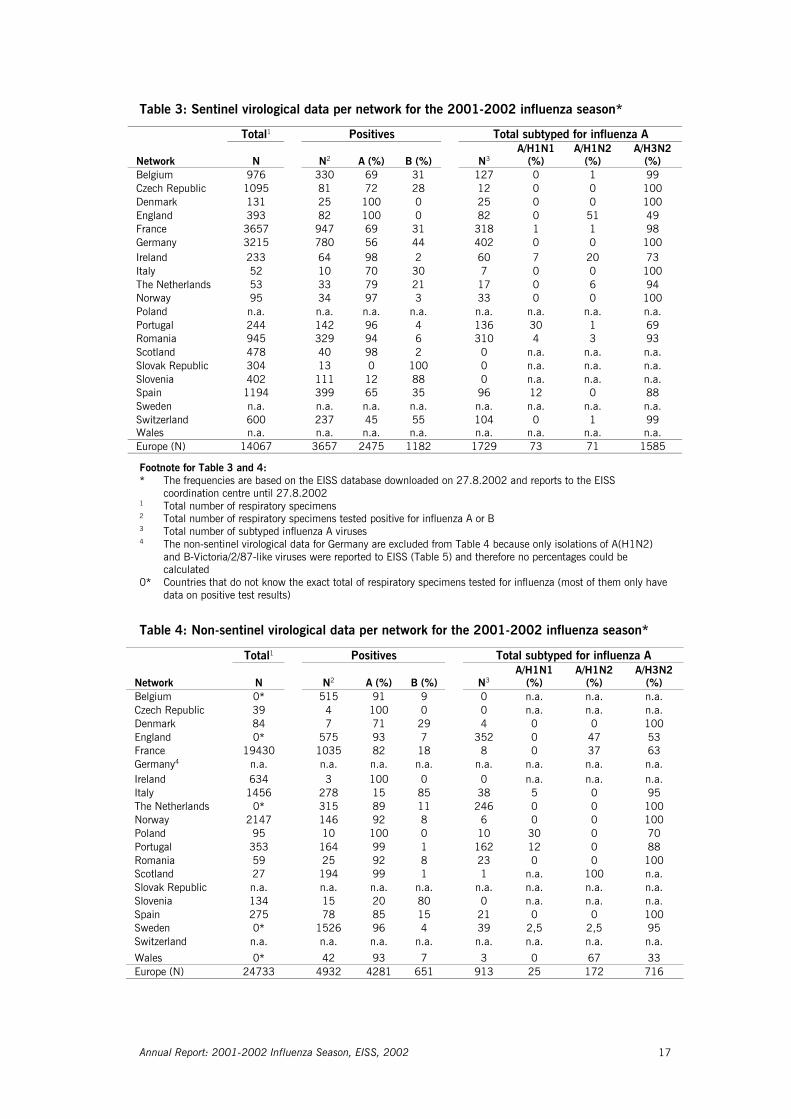
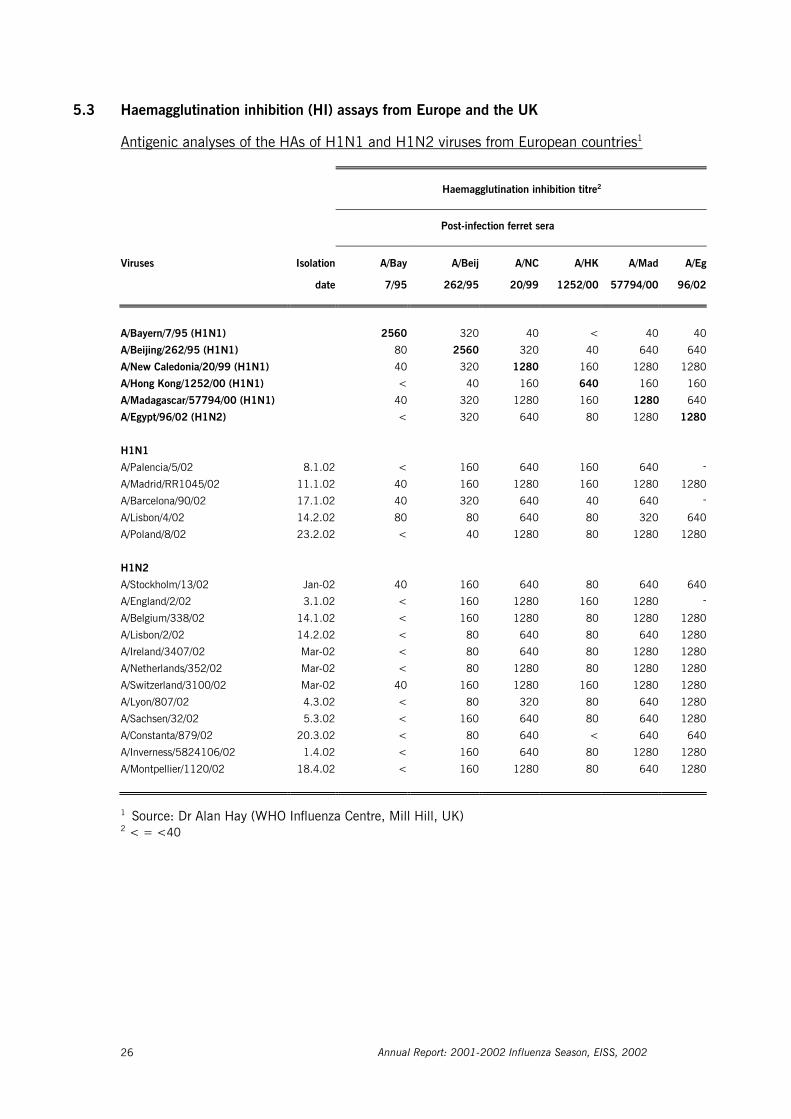
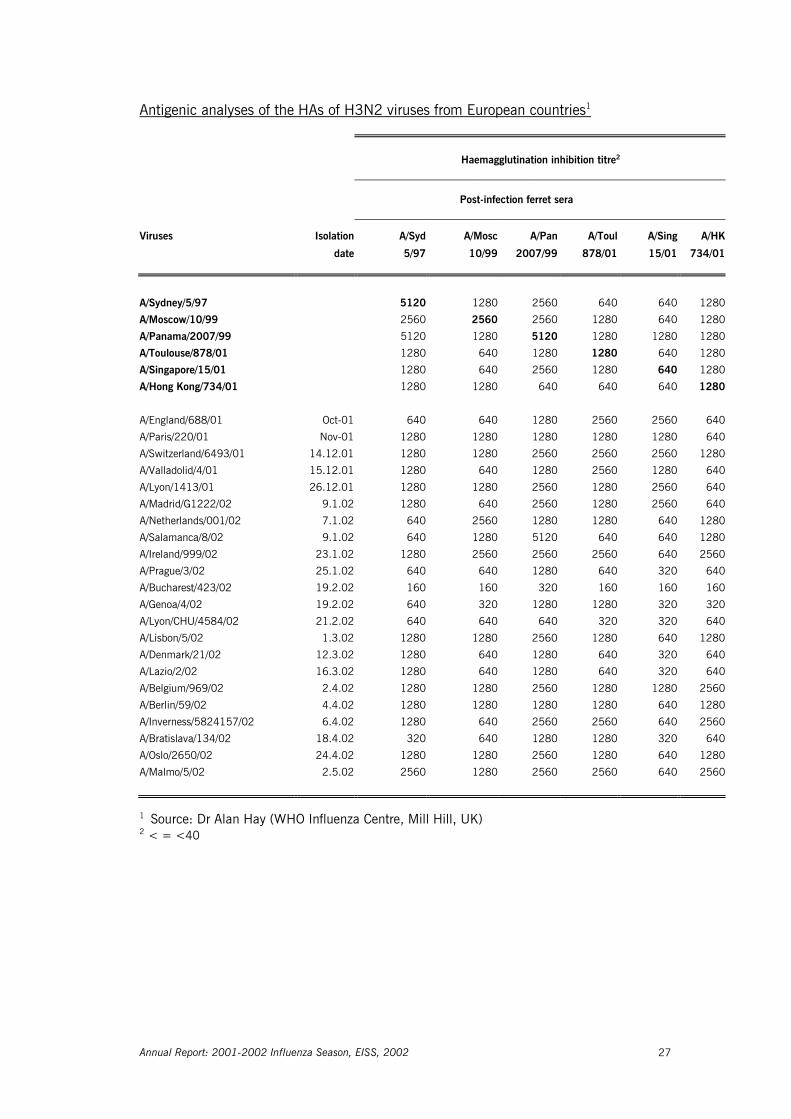
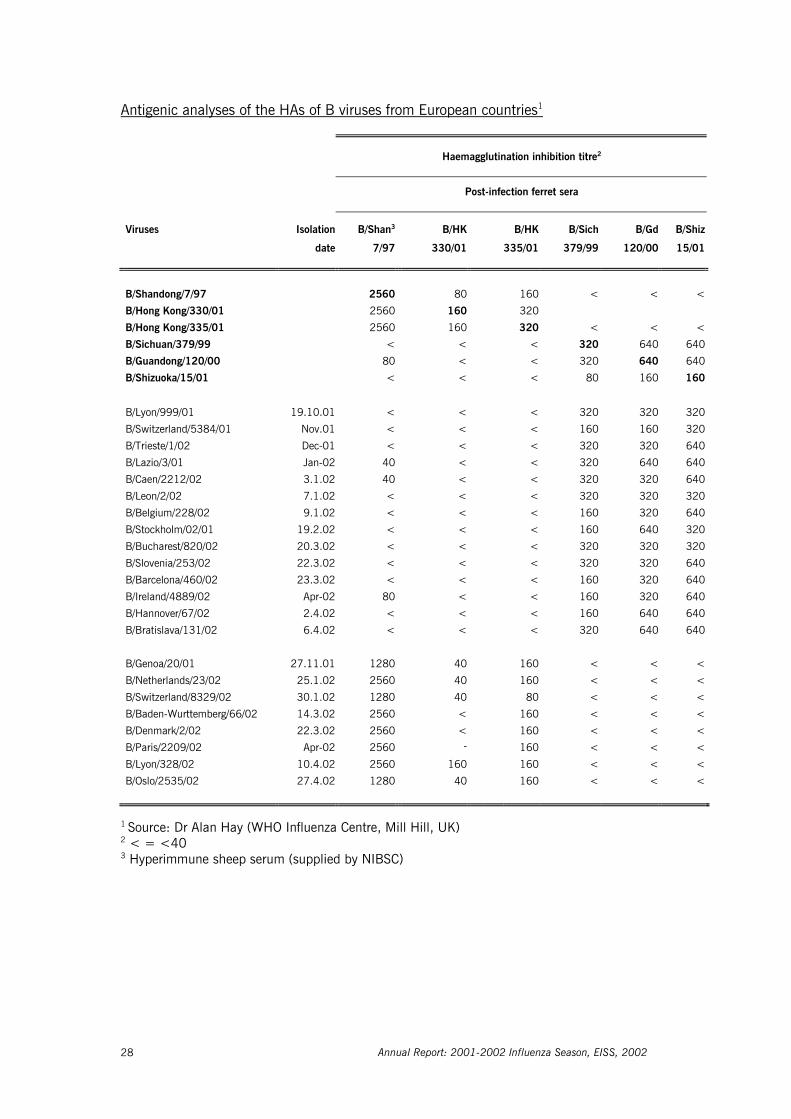
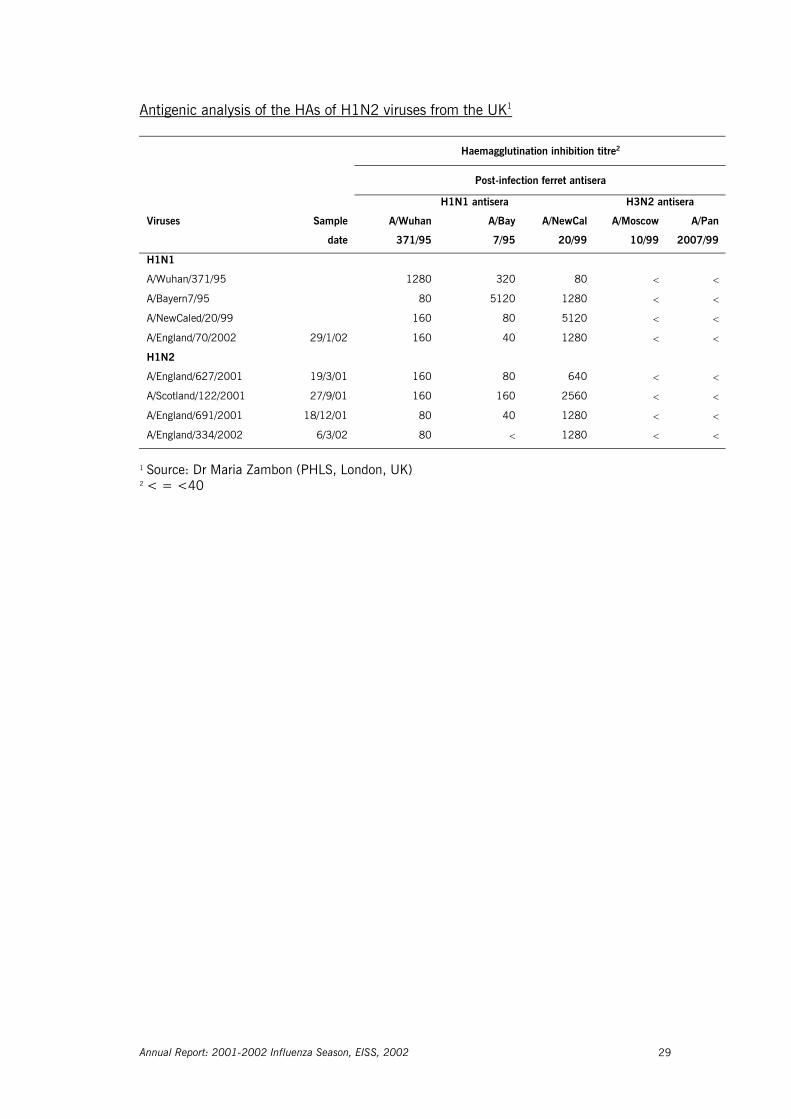
2.3.2 Virological data During the 2001-2002 influenza season, twelve out of twenty networks reported that influenza A(H3N2) was the dominant influenza subtype in sentinel specimens, three out of twenty (Slovenia, Slovak Republic and Switzerland) reported that it was influenza B, and one network (Germany) reported that it was both influenza A(H3N2) and influenza B (Table 2). A total of 14,067 respiratory specimens from sentinel physicians (Table 3) were tested for influenza from the sentinel surveillance systems in EISS and 3,657 (26%) of these were positive for influenza. Of the positive specimens, 2,475 (68%) were typed as influenza A and 1,182 (32%) as influenza B. Of the 1,729 subtyped influenza A viruses, 1,585 (92%) were of the H3N2 subtype, 73 (4%) of the H1N1 subtype and 71 (4%) of the H1N2 subtype. At least 24,733 respiratory specimens (Table 4) from non-sentinel sources were tested for influenza during the 2001-2002 influenza season (the total number is actually higher as some countries do not know the total number of respiratory samples tested and only report positive test results). A total of 4,932 non-sentinel respiratory specimens were positive for influenza. Of the positive specimens, 4,281 (87%) were typed as influenza A and 651 (13%) as influenza B. Of the 913 subtyped influenza A viruses, 716 (78%) were of the H3N2 subtype, 25 (3%) of the H1N1 subtype and 172 (19%) of the H1N2 subtype. Two novel influenza virus strains were isolated during the 2001-2002 season: influenza A(H1N2) viruses and influenza B viruses belonging to the B/Victoria/2/87-lineage (Table 5). The influenza A(H1N2) were detected in 12 networks participating in EISS (mainly isolated in England and Ireland, but also sporadically in Belgium, France, Germany, the Netherlands, Portugal, Romania, Scotland, Sweden, Switzerland and Wales). The influenza B/Victoria/2/87-like viruses were detected in 5 networks (mainly isolated in Germany, but also sporadically in France, Italy, the Netherlands and Norway). Overall, there were 246 detections of the novel influenza A(H1N2) virus and 119 detections of the novel influenza B/Victoria/2/87-lineage viruses reported to EISS (Table 5). The younger age groups (5-19 yr) were predominantly affected by the influenza A(H1N2) and influenza B/Victoria-like viruses (Paget et al., 2002). The networks participating in EISS also send virus samples to Mill Hill in London for further characterization. The haemagglutination inhibition tables for H1N1 and H1N2, H3N2 and B viruses can be found in Appendix 5.3. The haemagglutinins (HAs) of both H1N1 and H1N2 viruses were antigenically similar to A/NewCaledonia/20/99 (H1N1). The HAs of the majority of H3N2 viruses were antigenically closely related to A/Panama/2007/99. The neuraminidases (NAs) of both H1N2 and H3N2 viruses were antigenically and genetically closely related to the NA of A/Moscow/10/99 (Dr Alan Hay, personal communication). Most of the H1N2 viruses were detected in the UK. The extent of variation in H1N2 viruses in the UK is illustrated by the haemagglutination inhibition assay results (see Appendix 5.3). Influenza B viruses of both the B/Yamagata/16/88 (which were antigenically similar to B/Sichuan/379/99) and B/Victoria/2/87 lineages circulated. The HAs of the latter were closely related to the HAs of B/Shandong/7/97 and B/Hong Kong/330/01 (Dr Alan Hay, personal communication).
Annual Report: 2001-2002 Influenza Season, EISS, 2002 17
Table 3: Sentinel virological data per network for the 2001-2002 influenza season*
Total1 Positives Total subtyped for influenza A
Network N N2 A (%) B (%) N3 A/H1N1
(%) A/H1N2
(%) A/H3N2
(%) Belgium 976 330 69 31 127 0 1 99 Czech Republic 1095 81 72 28 12 0 0 100 Denmark 131 25 100 0 25 0 0 100 England 393 82 100 0 82 0 51 49 France 3657 947 69 31 318 1 1 98 Germany 3215 780 56 44 402 0 0 100 Ireland 233 64 98 2 60 7 20 73 Italy 52 10 70 30 7 0 0 100 The Netherlands 53 33 79 21 17 0 6 94 Norway 95 34 97 3 33 0 0 100 Poland n.a. n.a. n.a. n.a. n.a. n.a. n.a. n.a. Portugal 244 142 96 4 136 30 1 69 Romania 945 329 94 6 310 4 3 93 Scotland 478 40 98 2 0 n.a. n.a. n.a. Slovak Republic 304 13 0 100 0 n.a. n.a. n.a. Slovenia 402 111 12 88 0 n.a. n.a. n.a. Spain 1194 399 65 35 96 12 0 88 Sweden n.a. n.a. n.a. n.a. n.a. n.a. n.a. n.a. Switzerland 600 237 45 55 104 0 1 99 Wales n.a. n.a. n.a. n.a. n.a. n.a. n.a. n.a. Europe (N) 14067 3657 2475 1182 1729 73 71 1585
Footnote for Table 3 and 4: * The frequencies are based on the EISS database downloaded on 27.8.2002 and reports to the EISS
coordination centre until 27.8.2002 1 Total number of respiratory specimens 2 Total number of respiratory specimens tested positive for influenza A or B 3 Total number of subtyped influenza A viruses 4 The non-sentinel virological data for Germany are excluded from Table 4 because only isolations of A(H1N2)
and B-Victoria/2/87-like viruses were reported to EISS (Table 5) and therefore no percentages could be calculated
0* Countries that do not know the exact total of respiratory specimens tested for influenza (most of them only have data on positive test results)
Table 4: Non-sentinel virological data per network for the 2001-2002 influenza season*
Total1 Positives Total subtyped for influenza A
Network
N N2 A (%) B (%) N3 A/H1N1
(%) A/H1N2
(%) A/H3N2
(%) Belgium 0* 515 91 9 0 n.a. n.a. n.a. Czech Republic 39 4 100 0 0 n.a. n.a. n.a. Denmark 84 7 71 29 4 0 0 100 England 0* 575 93 7 352 0 47 53 France 19430 1035 82 18 8 0 37 63 Germany4 n.a. n.a. n.a. n.a. n.a. n.a. n.a. n.a. Ireland 634 3 100 0 0 n.a. n.a. n.a. Italy 1456 278 15 85 38 5 0 95 The Netherlands 0* 315 89 11 246 0 0 100 Norway 2147 146 92 8 6 0 0 100 Poland 95 10 100 0 10 30 0 70 Portugal 353 164 99 1 162 12 0 88 Romania 59 25 92 8 23 0 0 100 Scotland 27 194 99 1 1 n.a. 100 n.a. Slovak Republic n.a. n.a. n.a. n.a. n.a. n.a. n.a. n.a. Slovenia 134 15 20 80 0 n.a. n.a. n.a. Spain 275 78 85 15 21 0 0 100 Sweden 0* 1526 96 4 39 2,5 2,5 95 Switzerland n.a. n.a. n.a. n.a. n.a. n.a. n.a. n.a.
Wales 0* 42 93 7 3 0 67 33 Europe (N) 24733 4932 4281 651 913 25 172 716
Annual Report: 2001-2002 Influenza Season, EISS, 2002 18
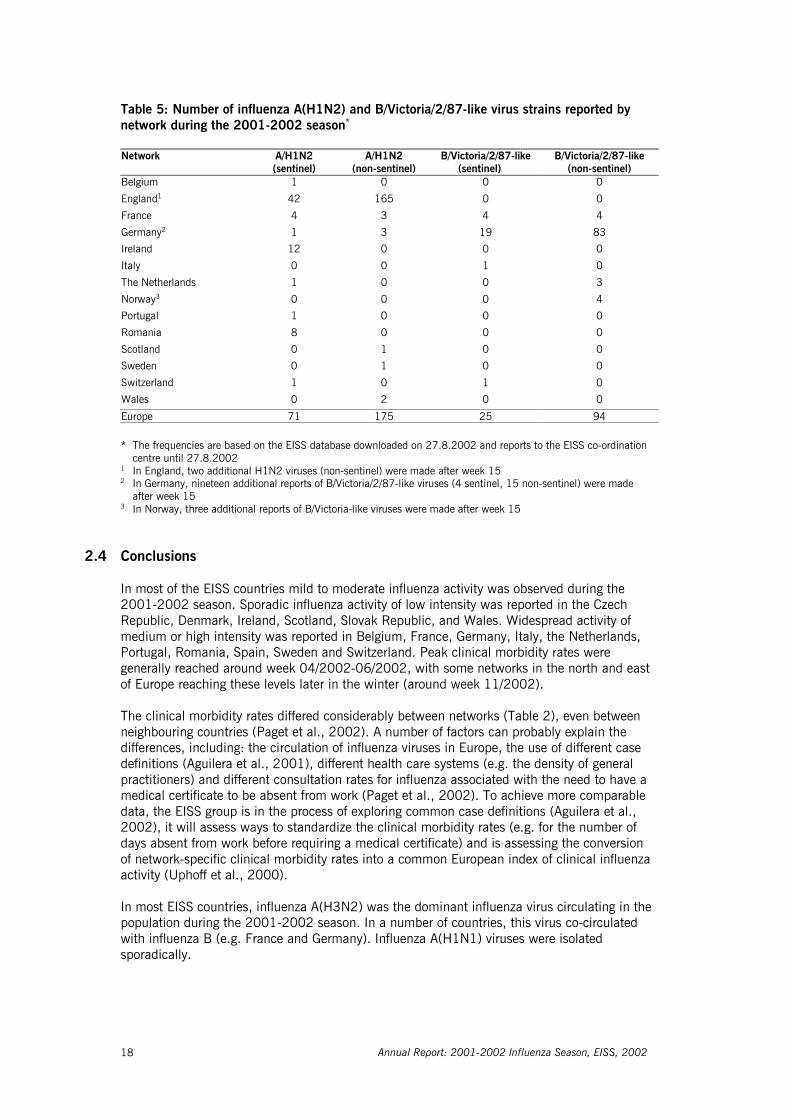
Table 5: Number of influenza A(H1N2) and B/Victoria/2/87-like virus strains reported by network during the 2001-2002 season*
Network A/H1N2
(sentinel) A/H1N2
(non-sentinel) B/Victoria/2/87-like
(sentinel) B/Victoria/2/87-like
(non-sentinel) Belgium 1 0 0 0
England1 42 165 0 0
France 4 3 4 4
Germany2 1 3 19 83
Ireland 12 0 0 0
Italy 0 0 1 0
The Netherlands 1 0 0 3
Norway3 0 0 0 4
Portugal 1 0 0 0
Romania 8 0 0 0
Scotland 0 1 0 0
Sweden 0 1 0 0
Switzerland 1 0 1 0
Wales 0 2 0 0
Europe 71 175 25 94 * The frequencies are based on the EISS database downloaded on 27.8.2002 and reports to the EISS co-ordination
centre until 27.8.2002 1 In England, two additional H1N2 viruses (non-sentinel) were made after week 15 2 In Germany, nineteen additional reports of B/Victoria/2/87-like viruses (4 sentinel, 15 non-sentinel) were made
after week 15 3 In Norway, three additional reports of B/Victoria-like viruses were made after week 15
2.4 Conclusions In most of the EISS countries mild to moderate influenza activity was observed during the 2001-2002 season. Sporadic influenza activity of low intensity was reported in the Czech Republic, Denmark, Ireland, Scotland, Slovak Republic, and Wales. Widespread activity of medium or high intensity was reported in Belgium, France, Germany, Italy, the Netherlands, Portugal, Romania, Spain, Sweden and Switzerland. Peak clinical morbidity rates were generally reached around week 04/2002-06/2002, with some networks in the north and east of Europe reaching these levels later in the winter (around week 11/2002). The clinical morbidity rates differed considerably between networks (Table 2), even between neighbouring countries (Paget et al., 2002). A number of factors can probably explain the differences, including: the circulation of influenza viruses in Europe, the use of different case definitions (Aguilera et al., 2001), different health care systems (e.g. the density of general practitioners) and different consultation rates for influenza associated with the need to have a medical certificate to be absent from work (Paget et al., 2002). To achieve more comparable data, the EISS group is in the process of exploring common case definitions (Aguilera et al., 2002), it will assess ways to standardize the clinical morbidity rates (e.g. for the number of days absent from work before requiring a medical certificate) and is assessing the conversion of network-specific clinical morbidity rates into a common European index of clinical influenza activity (Uphoff et al., 2000). In most EISS countries, influenza A(H3N2) was the dominant influenza virus circulating in the population during the 2001-2002 season. In a number of countries, this virus co-circulated with influenza B (e.g. France and Germany). Influenza A(H1N1) viruses were isolated sporadically.

Annual Report: 2001-2002 Influenza Season, EISS, 2002 19
The virological results from sentinel sources (Table 3) revealed that there are large variations in the total number of sentinel samples collected by the networks each season. In terms of sentinel specimens collected per 100,000 population, Slovenia, Belgium, Switzerland and the Czech Republic collected the most sentinel specimens during the 2001-2002 season (data not shown). The EISS group does not have a recommendation on the number of sentinel specimens that each network should collect each week. An inventory carried out in October 2000 found that there was no common sentinel specimen collection protocol in Europe: these ranged from the existence of no protocol to recommendations on the total number of specimens each sentinel physician should collect each week (Aguilera et al., 2001). Two novel viruses were isolated during the 2001-2002 influenza season: influenza A(H1N2) and influenza B viruses belonging to the B/Victoria/2/87 lineage. With the exception of H1N2 virus detections in England and Ireland and the influenza B viruses belonging to the B/Victoria/2/87 lineage in Germany, these two viruses did not circulate widely in Europe and did not play an important role in influenza activity during the 2001-2002 season (Paget et al., 2002). The new A(H1N2) strain appears to have arisen by reassortment of the two currently circulating human viruses (H1N1 and H3N2) (Zambon, 2002). Because the new strain is a combination of the two influenza A components contained in the 2001-2002 and 2002-2003 season’s vaccine (H1N1 and H3N2), people who received the vaccine should have developed a good level of immunity to the new strain. As a result of the novel detections of influenza A(H1N2) and influenza B viruses belonging to the B/Victoria/2/87 lineage, the EISS group has decided that it should collect more detailed virological information during the 2002-2003. Data on the virological strains (e.g. A/New Caledonia/2/99) circulating in Europe will be collected. This new initiative should allow a better comparison of the circulating viruses with the season’s influenza vaccine. An influenza B virus belonging to the B/Victoria/2/87 lineage will be included in the 2002-2003 influenza vaccine. The composition of the influenza vaccine for the 2002-2003 season (Northern Hemisphere winter) was announced by the World Health Organisation in Geneva (WHO, 2002). The vaccine will contain:
- an A/New Caledonia/20/99 (H1N1)-like virus - an A/Moscow/10/99 (H3N2)-like virus (the widely used vaccine strain is
A/Panama/2007/99) - a B/HongKong/330/2001-like virus
Annual Report: 2001-2002 Influenza Season, EISS, 2002 20
3 EISS developments during the 2001-2002 season
3.1 Objectives The following specific objectives were established for the 2001-2002 influenza season. - Integrate four new influenza surveillance networks into EISS: Norway, Poland, Romania
and the Slovak Republic; - Implement a new indicator of influenza activity; - Publish the EISS Weekly Electronic Bulletin; - Launch the EuroGROG website; - Establish an automatic data transfer between the EISS and WHO FluNet; - Implement the Denominator Project (objective: all EISS networks present influenza rates
based on a population denominator); - Implement the Clinical Reporting Quality Control Project in Belgium and Spain; - Collaborate with the EC to prepare for a possible influenza pandemic; - Organise EISS meetings before and after the 2001-2002 influenza season; - Prepare a manuscript for Eurosurveillance on the epidemiology and virology of influenza
activity during the 2001-2002 influenza season; - Write an Annual Report for the 2001-2002 influenza season.
3.2 Activities New members The four new influenza surveillance networks (Norway, Poland, Romania, Slovak Republic) were successfully integrated into the EISS project. All four members were accepted as “associate” members and actively participated in the project during the 2001-2002 influenza season. Implement a new indicator of influenza activity A new indicator of influenza activity was introduced during the 2001-2002 influenza season. EISS now assesses influenza activity according to the geographical spread (a WHO indicator) and the intensity of activity (the new indicator). The new indicator compares the weekly clinical morbidity rate to historical data and indicates whether the rate is low, medium, high or very high (see Appendix 5.2 for further details). The Weekly Electronic Bulletin The Weekly Electronic Bulletin was modified and improved for the 2001-2002 influenza season. For example, the map was enlarged and more graphical information was provided (e.g. graphs of weekly age-specific clinical morbidity rates). Twenty-six Bulletins were published during the 2001-2002 season (from week 42/2001 to week 15/2002). EuroGROG website EuroGROG is the complementary influenza surveillance scheme that is based at the Institute Pasteur in Paris and covers 29-30 countries in Europe. The difference between EISS and EuroGROG is that whilst EuroGROG collects (limited) descriptive information on influenza activity from a large number of European countries, it does not collect standardised clinical and virological data derived from the same population. The new EuroGROG website and data
Annual Report: 2001-2002 Influenza Season, EISS, 2002 21
collection procedure is similar to EISS. When EuroGROG countries meet the EISS entrance criteria, they will be transferred from EuroGROG to EISS. Automatic data transfer between EISS and FluNet European networks participating in EISS enter their data into the EISS database every week during the influenza season (from week 40 to week 20 of the following year). Most of the networks also enter their virological data into the WHO-FluNet database. EISS would like to establish an automatic data transfer from the EISS database to FluNet, so that its members only have to enter their virological data into one database. The EISS co-ordination centre visited WHO Geneva to initiate this data transfer and then had a meeting in Paris with the FluNet group. A data transfer procedure was agreed upon and its implementation is scheduled for the 2002-2003 season. Denominator Project Five networks in the EISS project (Belgium, Denmark, France, Germany and Switzerland) presented influenza rates per 100 consultations during the 2000-2001 season, as they do not know the population covered by their sentinel physicians (in many countries this data is available in the form of patient lists as persons must be registered with a physician) (Schlaud, 1999). A methodology was agreed upon by the EISS group to estimate population denominators in these countries. The method is based on the percentage of network physicians compared to all physicians in the country. For example, if 1% of GPs in the country participate in the sentinel surveillance system, the population denominator is 1% of the total population. Performing this calculation by geographic region is recommended. The five networks used the proposed methodology, or adapted versions of it, to estimate their weekly population denominators during the 2001-2002 influenza season. This meant that all of the EISS networks, except Norway which was a new EISS member, reported the number of cases of ILI or ARI per 100,000 population during the 2001-2002 season. The implementation of the EISS denominator project means that it is now much easier to compare the clinical morbidity rates (see Chapter 2). Implement the Clinical Reporting Quality Control Project in Belgium and Spain The aim of this project was to develop an evaluation protocol to help standardise and harmonise clinical reporting systems in EISS. Jean-Francois Aguilera, based at PHLS in London, in collaboration with the EISS co-ordination centre, developed an evaluation protocol based on WHO and CDC guidelines. The protocol was pre-tested in England and the Netherlands during the 2000-2001 influenza season. A field evaluation of the Belgian (1 week, February 2002) and three regional surveillance systems in Spain (2 weeks, April 2002) was organised during the 2001-2002 influenza season. Evaluation reports, based on a standardised format, have been written and will be posted to the EISS website when finalised. Influenza pandemic planning The EISS group has been involved in an EU initiative to prepare for a possible influenza pandemic. In the light of these developments, EISS is preparing an enhanced influenza surveillance project which includes the creation of a Network of National Reference Laboratories for Human Influenza. It is also working on improving its integration into EC surveillance and activities. EISS Steering Committee The co-ordination centre organised the first meeting of the EISS Steering Committee in June 2002. The first meeting included Koos van der Velden (Chairman, EISS co-ordination centre), Jean-Claude Manuguerra (Institut Pasteur, Paris), John Watson (PHLS, London) and John Paget (EISS co-ordination centre). The objective is to organise regular Steering Committee
Annual Report: 2001-2002 Influenza Season, EISS, 2002 22
meetings, with increased members, and to professionalise the management of the EISS project. EISS meetings Two meetings are organised each year to co-ordinate the activities of EISS, one before the influenza season (September/October) and the second at the end of the season (April/May). The meetings have been organised on a regular basis since 1996 and represent an important moment to exchange information, research findings and initiate new projects. In October 2001 the meeting was held in Utrecht, the Netherlands, and in April 2002 it was held in Dublin, Ireland.
3.3 Conclusions The EISS project reached most of the objectives it set itself for the 2001-2002 influenza season. The successful launch of the EuroGROG website meant that more general information on influenza activity in 30 countries in Europe was available during the season. A first Steering Committee meeting was held and the foundations of a more solid surveillance structure are being established. This should allow the EISS project to better deal and manage issues like: the budget, technical questions, the project’s objectives, membership, funding, pandemic planning, links with the EC, WHO and industry, links with other EC-funded surveillance projects, EISS publications and reports.

Annual Report: 2001-2002 Influenza Season, EISS, 2002 23
4 References Aguilera J-F, Paget WJ, Manuguerra J-C on behalf of EISS (European Influenza Surveillance Scheme) and EuroGROG.
Survey of influenza surveillance systems in Europe – Report. December 2001. Aguilera J-F, Paget WJ, van der Velden J. Development of a protocol to evaluate the quality of clinical data collected
by sentinel practitioners in Europe. Eurosurveillance 2002; 7: 158-160. European Influenza Surveillance Scheme. Annual report: 2000-2001 influenza season. Utrecht, the Netherlands:
NIVEL, December 2001 [can be downloaded from the EISS website]. Flahault A, Dias-Ferrao V, Chaberty P. Esteves K, Valleron A-J, Lavanchy D. FluNet as a tool for global monitoring of
influenza on the web. JAMA 1998;280(15):1330-1332. Fleming DM, Chakraverty P, Sadler C, Litton P. Combined clinical and virological surveillance of influenza in winters
of 1992 and 1993-4. British Medical Journal 1995; 311: 290-291. Fleming DM and Cohen J-M. Experience of European Collaboration in Influenza surveillance in the winter 1993-
1994. J. Public Health Medicine 1996;18:133-142. Fleming DM. The contribution of influenza to combined acute respiratory infections, hospital admissions, and death
in winter. Communicable Disease and Public Health 2000; 3: 32-38. Manuguerra J-C, Mosnier A, Paget WJ on behalf of EISS. Monitoring of influenza in the EISS. European network
member countries from October 2000 to February 2001. Eurosurveillance 2001; 6:127-135. McKee M & Maclehose L. Enlarging the European Union: implications for communicable disease control? Eurohealth
2000/2001; 6(5):6-8. Paget WJ, Meerhoff TJ, Goddard NL on behalf of EISS. Mild to moderate influenza activity in Europe and the
detection of novel A(H1N2) and B viruses during the winter of 2001-2002. Eurosurveillance 2002; 7:147-157.
Schlaud M, editor. Comparison and harmonisation of denominator data for primary care health care research in
countries of the European Community: the European Denominator Project. Amsterdam, the Netherlands: IOS Press, 1999.
Simonsen L, Clarke MJ, Williamson GD, Stroup DF, Arden NH, Schonberger LB. The impact of influenza epidemics
on mortality: introducing a severity index. American Journal of Public Health 1997; 87: 1944-1950. Snacken R, Bensadon M, Strauss A. The CARE Telematics Network for the surveillance of influenza in Europe.
Methods of Information in Medicine 1995; 34:518-522. Snacken R, Manuguerra J-C, Taylor P. European Influenza Surveillance Scheme on the Internet. Methods of
Information in Medicine 1998; 37:266-270. Uphoff H, Cohen J-M, Fleming D, Noone A. Reporting of influenza surveillance morbidity data from an international
European surveillance scheme: a simple index. Options for the control of influenza IV conference, Hersonissos, Crete, Greece, 23-28 September 2000; Abstract P1-24.
WHO. Communicable diseases 2000/ WHO/CDS 2000.1: 36-37.
WHO. Recommended composition of influenza virus vaccines for use in the 2002-2003 influenza season. Weekly Epidemiological Record 2002; Vol. 8: 62-68.
Zambon, MC. Shifty drifter up to no good. Lancet Infectious Diseases 2002; Vol. 2: 269-270.

Annual Report: 2001-2002 Influenza Season, EISS, 2002 24
5 Appendices
5.1 Partners European Commission Health & Consumer Protection Directorate-General Luxembourg Industry GlaxoSmithKline Roche Pharma United Kingdom Switzerland Web Service Quad Logic France EISS would like to thank the National Disease Surveillance Centre in Ireland for partly funding the April 2002 EISS meeting in Dublin, Ireland.
5.2 Levels of influenza activity Indicators of influenza activity used in the 2001-2002 influenza season:
The levels of influenza activity in European countries reported by EISS members during the 2001-2002 influenza season are based on two assessments of influenza activity: 1. An indicator of the geographical spread of influenza in that country; 2. An indicator of the overall intensity of influenza activity in that country. Each of these assessments is described below.
1. Indicators of the geographical spread of influenza:
Each network defines the geographical spread of influenza according to the definitions outlined below. The definitions are based on those used by the WHO global influenza surveillance system - FluNet ILI: influenza-like illness ARI: acute respiratory infection Country: countries may be made of one (e.g. the Netherlands) or more regions (e.g.
France (North and France South) Region: the population under surveillance in a defined geographical area. Countries
may be made up of one or more regions for these purposes No report: no report received
Annual Report: 2001-2002 Influenza Season, EISS, 2002 25
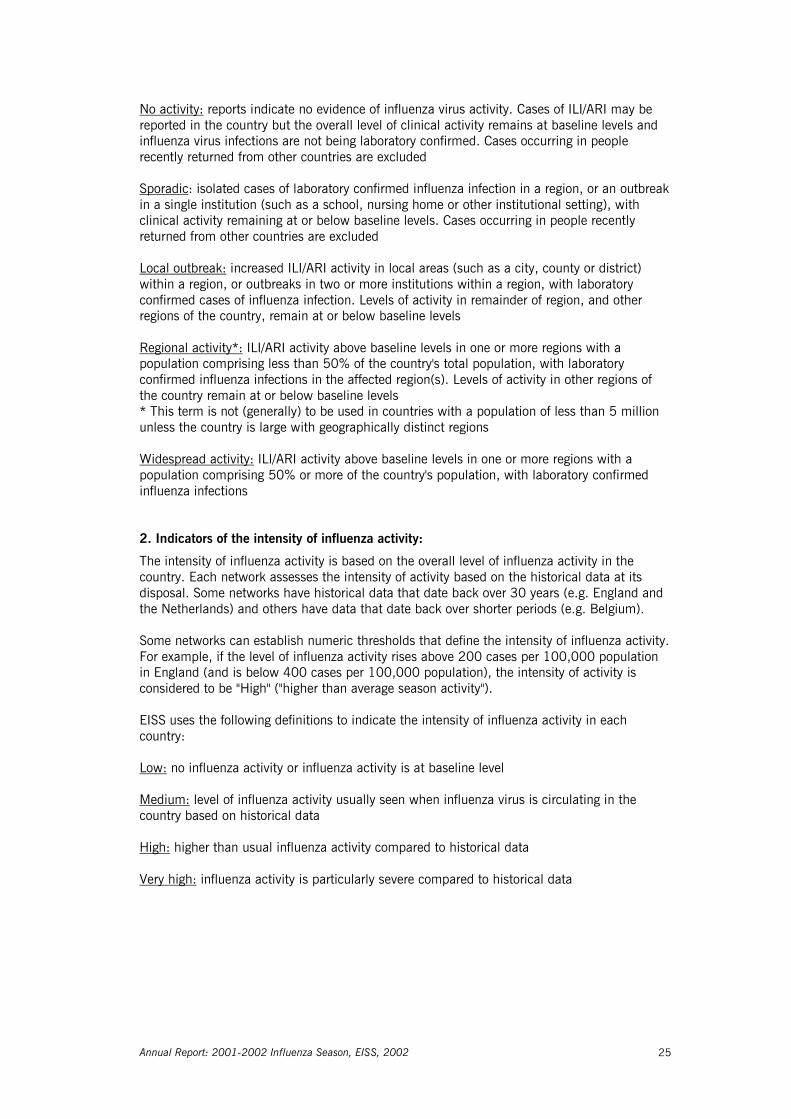
No activity: reports indicate no evidence of influenza virus activity. Cases of ILI/ARI may be reported in the country but the overall level of clinical activity remains at baseline levels and influenza virus infections are not being laboratory confirmed. Cases occurring in people recently returned from other countries are excluded Sporadic: isolated cases of laboratory confirmed influenza infection in a region, or an outbreak in a single institution (such as a school, nursing home or other institutional setting), with clinical activity remaining at or below baseline levels. Cases occurring in people recently returned from other countries are excluded Local outbreak: increased ILI/ARI activity in local areas (such as a city, county or district) within a region, or outbreaks in two or more institutions within a region, with laboratory confirmed cases of influenza infection. Levels of activity in remainder of region, and other regions of the country, remain at or below baseline levels Regional activity*: ILI/ARI activity above baseline levels in one or more regions with a population comprising less than 50% of the country's total population, with laboratory confirmed influenza infections in the affected region(s). Levels of activity in other regions of the country remain at or below baseline levels * This term is not (generally) to be used in countries with a population of less than 5 million unless the country is large with geographically distinct regions Widespread activity: ILI/ARI activity above baseline levels in one or more regions with a population comprising 50% or more of the country's population, with laboratory confirmed influenza infections 2. Indicators of the intensity of influenza activity:
The intensity of influenza activity is based on the overall level of influenza activity in the country. Each network assesses the intensity of activity based on the historical data at its disposal. Some networks have historical data that date back over 30 years (e.g. England and the Netherlands) and others have data that date back over shorter periods (e.g. Belgium). Some networks can establish numeric thresholds that define the intensity of influenza activity. For example, if the level of influenza activity rises above 200 cases per 100,000 population in England (and is below 400 cases per 100,000 population), the intensity of activity is considered to be "High" ("higher than average season activity"). EISS uses the following definitions to indicate the intensity of influenza activity in each country: Low: no influenza activity or influenza activity is at baseline level Medium: level of influenza activity usually seen when influenza virus is circulating in the country based on historical data High: higher than usual influenza activity compared to historical data Very high: influenza activity is particularly severe compared to historical data
Annual Report: 2001-2002 Influenza Season, EISS, 2002 26
5.3 Haemagglutination inhibition (HI) assays from Europe and the UK
Antigenic analyses of the HAs of H1N1 and H1N2 viruses from European countries1
Haemagglutination inhibition titre2
Post-infection ferret sera
Viruses Isolation A/Bay A/Beij A/NC A/HK A/Mad A/Eg
date 7/95 262/95 20/99 1252/00 57794/00 96/02
A/Bayern/7/95 (H1N1) 2560 320 40 < 40 40
A/Beijing/262/95 (H1N1) 80 2560 320 40 640 640
A/New Caledonia/20/99 (H1N1) 40 320 1280 160 1280 1280
A/Hong Kong/1252/00 (H1N1) < 40 160 640 160 160
A/Madagascar/57794/00 (H1N1) 40 320 1280 160 1280 640
A/Egypt/96/02 (H1N2) < 320 640 80 1280 1280
H1N1
A/Palencia/5/02 8.1.02 < 160 640 160 640 -
A/Madrid/RR1045/02 11.1.02 40 160 1280 160 1280 1280
A/Barcelona/90/02 17.1.02 40 320 640 40 640 -
A/Lisbon/4/02 14.2.02 80 80 640 80 320 640
A/Poland/8/02 23.2.02 < 40 1280 80 1280 1280
H1N2
A/Stockholm/13/02 Jan-02 40 160 640 80 640 640
A/England/2/02 3.1.02 < 160 1280 160 1280 -
A/Belgium/338/02 14.1.02 < 160 1280 80 1280 1280
A/Lisbon/2/02 14.2.02 < 80 640 80 640 1280
A/Ireland/3407/02 Mar-02 < 80 640 80 1280 1280
A/Netherlands/352/02 Mar-02 < 80 1280 80 1280 1280
A/Switzerland/3100/02 Mar-02 40 160 1280 160 1280 1280
A/Lyon/807/02 4.3.02 < 80 320 80 640 1280
A/Sachsen/32/02 5.3.02 < 160 640 80 640 1280
A/Constanta/879/02 20.3.02 < 80 640 < 640 640
A/Inverness/5824106/02 1.4.02 < 160 640 80 1280 1280
A/Montpellier/1120/02 18.4.02 < 160 1280 80 640 1280
1 Source: Dr Alan Hay (WHO Influenza Centre, Mill Hill, UK) 2 < = <40
Annual Report: 2001-2002 Influenza Season, EISS, 2002 27
Antigenic analyses of the HAs of H3N2 viruses from European countries1
Haemagglutination inhibition titre2
Post-infection ferret sera
Viruses Isolation A/Syd A/Mosc A/Pan A/Toul A/Sing A/HK
date 5/97 10/99 2007/99 878/01 15/01 734/01
A/Sydney/5/97 5120 1280 2560 640 640 1280
A/Moscow/10/99 2560 2560 2560 1280 640 1280
A/Panama/2007/99 5120 1280 5120 1280 1280 1280
A/Toulouse/878/01 1280 640 1280 1280 640 1280
A/Singapore/15/01 1280 640 2560 1280 640 1280
A/Hong Kong/734/01 1280 1280 640 640 640 1280
A/England/688/01 Oct-01 640 640 1280 2560 2560 640
A/Paris/220/01 Nov-01 1280 1280 1280 1280 1280 640
A/Switzerland/6493/01 14.12.01 1280 1280 2560 2560 2560 1280
A/Valladolid/4/01 15.12.01 1280 640 1280 2560 1280 640
A/Lyon/1413/01 26.12.01 1280 1280 2560 1280 2560 640
A/Madrid/G1222/02 9.1.02 1280 640 2560 1280 2560 640
A/Netherlands/001/02 7.1.02 640 2560 1280 1280 640 1280
A/Salamanca/8/02 9.1.02 640 1280 5120 640 640 1280
A/Ireland/999/02 23.1.02 1280 2560 2560 2560 640 2560
A/Prague/3/02 25.1.02 640 640 1280 640 320 640
A/Bucharest/423/02 19.2.02 160 160 320 160 160 160
A/Genoa/4/02 19.2.02 640 320 1280 1280 320 320
A/Lyon/CHU/4584/02 21.2.02 640 640 640 320 320 640
A/Lisbon/5/02 1.3.02 1280 1280 2560 1280 640 1280
A/Denmark/21/02 12.3.02 1280 640 1280 640 320 640
A/Lazio/2/02 16.3.02 1280 640 1280 640 320 640
A/Belgium/969/02 2.4.02 1280 1280 2560 1280 1280 2560
A/Berlin/59/02 4.4.02 1280 1280 1280 1280 640 1280
A/Inverness/5824157/02 6.4.02 1280 640 2560 2560 640 2560
A/Bratislava/134/02 18.4.02 320 640 1280 1280 320 640
A/Oslo/2650/02 24.4.02 1280 1280 2560 1280 640 1280
A/Malmo/5/02 2.5.02 2560 1280 2560 2560 640 2560
1 Source: Dr Alan Hay (WHO Influenza Centre, Mill Hill, UK) 2 < = <40
Annual Report: 2001-2002 Influenza Season, EISS, 2002 28
Antigenic analyses of the HAs of B viruses from European countries1
Haemagglutination inhibition titre2
Post-infection ferret sera
Viruses Isolation B/Shan3 B/HK B/HK B/Sich B/Gd B/Shiz
date 7/97 330/01 335/01 379/99 120/00 15/01
B/Shandong/7/97 2560 80 160 < < <
B/Hong Kong/330/01 2560 160 320
B/Hong Kong/335/01 2560 160 320 < < <
B/Sichuan/379/99 < < < 320 640 640
B/Guandong/120/00 80 < < 320 640 640
B/Shizuoka/15/01 < < < 80 160 160
B/Lyon/999/01 19.10.01 < < < 320 320 320
B/Switzerland/5384/01 Nov.01 < < < 160 160 320
B/Trieste/1/02 Dec-01 < < < 320 320 640
B/Lazio/3/01 Jan-02 40 < < 320 640 640
B/Caen/2212/02 3.1.02 40 < < 320 320 640
B/Leon/2/02 7.1.02 < < < 320 320 320
B/Belgium/228/02 9.1.02 < < < 160 320 640
B/Stockholm/02/01 19.2.02 < < < 160 640 320
B/Bucharest/820/02 20.3.02 < < < 320 320 320
B/Slovenia/253/02 22.3.02 < < < 320 320 640
B/Barcelona/460/02 23.3.02 < < < 160 320 640
B/Ireland/4889/02 Apr-02 80 < < 160 320 640
B/Hannover/67/02 2.4.02 < < < 160 640 640
B/Bratislava/131/02 6.4.02 < < < 320 640 640
B/Genoa/20/01 27.11.01 1280 40 160 < < <
B/Netherlands/23/02 25.1.02 2560 40 160 < < <
B/Switzerland/8329/02 30.1.02 1280 40 80 < < <
B/Baden-Wurttemberg/66/02 14.3.02 2560 < 160 < < <
B/Denmark/2/02 22.3.02 2560 < 160 < < <
B/Paris/2209/02 Apr-02 2560 - 160 < < <
B/Lyon/328/02 10.4.02 2560 160 160 < < <
B/Oslo/2535/02 27.4.02 1280 40 160 < < <
1 Source: Dr Alan Hay (WHO Influenza Centre, Mill Hill, UK) 2 < = <40 3 Hyperimmune sheep serum (supplied by NIBSC)
Annual Report: 2001-2002 Influenza Season, EISS, 2002 29
Antigenic analysis of the HAs of H1N2 viruses from the UK1
Haemagglutination inhibition titre2
Post-infection ferret antisera
H1N1 antisera H3N2 antisera
Viruses Sample
date
A/Wuhan
371/95
A/Bay
7/95
A/NewCal
20/99
A/Moscow
10/99
A/Pan
2007/99
H1N1
A/Wuhan/371/95 1280 320 80 � �
A/Bayern7/95 80 5120 1280 � �
A/NewCaled/20/99 160 80 5120 � �
A/England/70/2002 29/1/02 160 40 1280 � �
H1N2
A/England/627/2001 19/3/01 160 80 640 � �
A/Scotland/122/2001 27/9/01 160 160 2560 � �
A/England/691/2001 18/12/01 80 40 1280 � �
A/England/334/2002 6/3/02 80 � 1280 � �
1 Source: Dr Maria Zambon (PHLS, London, UK) 2 < = <40
Annual Report: 2001-2002 Influenza Season, EISS, 2002 30
5.4 EISS Publications Peer-reviewed articles (until June 2002) Manuguerra J-C, Mosnier A, Paget WJ au nom du programme European Influenza Surveillance Scheme (EISS). Surveillance de la grippe dans les pays members du réseau européan "European Influenza Surveillance Scheme" d'octobre 2000 à avril 2001. Bulletin Epidémiologique Hebdomadaire 2002; 7: 27-31. Manuguerra J-C, Mosnier A, Paget WJ (on behalf of EISS). Monitoring of influenza in the EISS European network member countries from October 2000 to April 2001. Eurosurveillance 2001; 6: 127-135. Paget WJ, Aguilera J-F (on behalf of EISS). Influenza Pandemic Planning in Europe. Eurosurveillance 2001; 6: 136-140. Manuguerra J-C, Mosnier A (on behalf of EISS). Surveillance of influenza in Europe from October 1999 to February 2000. Eurosurveillance 2000; 5: 63-68. Aymard M, Valette M, Lina B, Thouvenot D, the members of GROG and EISS. Surveillance and impact of influenza in Europe. Vaccine 1999; 17: S30-S41. Zambon M (on behalf of EISS). Sentinel surveillance of influenza in Europe, 1997/1998. Eurosurveillance 1998; 3(3): 29-31. Snacken R, Manuguerra J-C, Taylor P. European Influenza Surveillance Scheme on the Internet. Methods of Information in Medicine 1998; 37: 266-270. Fleming DM, Cohen J-M (on behalf of the Collaborating Group, ENS Care Influenza). Experience of European Collaboration in Influenza surveillance in the winter 1993-1994. J. Public Health Medicine 1996; 18: 133-142. Snacken R, Bensadon M, Strauss A. The CARE Telematics Network for the surveillance of influenza in Europe. Methods of Information in Medicine 1995; 34: 518-522. EISS reports (until June 2002): European Influenza Surveillance Scheme. Annual report: 2000-2001 influenza season. Utrecht, the Netherlands: NIVEL, December 2001. Aguilera J-F, Paget WJ, Manuguerra J-C on behalf of EISS (European Influenza Surveillance Scheme) and EuroGROG. Survey of influenza surveillance systems in Europe. Report, December 2001.
Annual Report: 2001-2002 Influenza Season, EISS, 2002 31
5.5 Members EISS co-ordination centre Institution: Netherlands Institute for Health Services Research (NIVEL) PO Box 1568 3500 BN Utrecht The Netherlands Tel.: +31 30 2729 700 Fax: +31 30 2729 729 Individuals: Tamara Meerhoff John Paget Koos van der Velden Jouke van der Zee Belgium Institution: Scientific Institute of Public Health 14, rue Juliette Wytsman B-1050 Brussels Individuals: Fernande Yane Frederic Pierquin Czech Republic Institution: National Institute of Public Health National Influenza Centre Šrobárova 48 100 42 Prague 10 Tel.: +42 2 6708 2402 Fax. +42 2 7173 0695 Individuals: Martina Havlickova Bela Tumova Denmark Institution: Statens Serum Institut Department of Epidemiology Artillerivej 5 DK 2300 Copenhagen Tel.: +45 32 68 3268 Fax: +45 32 68 3874
Individuals: Per Grauballe Susanne Samuelsson France Institution: OPEN ROME - Groupes Régioneax d’Observation de la Grippe (GROG) 39, rue du Poteau 75018 Paris Tel. +33 1 56 55 51 51 Fax. +33 1 56 55 51 52 Centre National de Référence de la Grippe (France Nord) 25, rue du Docteur Roux 75724 Paris Cedex 15 Tel.: +33 1 4568 8722 / 25 Fax: +33 1 4061 3241 Universitaire Claude Bernard Lyon I Centre National de Référence de la Grippe (France Sud) 8 Avenue Rockefeller 69373 Lyon Cedex 08 Tel.: +33 4 7877 7029 Fax: +33 4 7801 4887 Individuals: Michèle Aymard Jean-Marie Cohen Bruno Lina Jean-Claude Manuguerra Anne Mosnier Martine Valette Sylvie van der Werf Germany Institution: ArbeitsGemeinschaft Influenza (AGI) Schuhmarkt 4 35037 Marburg Tel.: +49 6421 29320 Fax: +49 6421 25730 National Reference Centre for Influenza Niedersächsisches Landesgesundheitsamt Roesebeckstraße 4
Annual Report: 2001-2002 Influenza Season, EISS, 2002 32
30449 Hannover Tel.: +49 511 4505 201 Fax: +49 511 4505-140 Individuals: Udo Buchholz Rolf Heckler Bunhilde Schweiger Helmut Uphoff Ireland Institution: Irish College of General Practitioners 4-5 Lincoln Place Dublin 2 Tel.: +353 1 676 3705 Fax: +353 1 676 5850 National Disease Surveillance Center 25-27 Middle Gardiner Street Dublin 1 Tel.: +353 1 661 7346 Fax: +353 1 661 7347 Individuals: Lisa Domegan Dermot Nolan Darina O'Flanagan Italy Institution: Istituto de Virologia - Università degli Studi di Milano Via Pascal 38 20133 Milano Tel.: +39 0223 67494 Fax: +39 0226 680713 Dipartimento di Scienze della Salute Università de Genova Via Pastore 2 16132 Genova Tel.: +39 01035 38571 Fax: +39 01035 38572 Istituto Superiore de Sanità (ISS) Viale Regina Margherita 00161 Roma Tel.: +39 06 4990 1 Fax: +39 06 4938 7118
Laboratorio virus respiratori (ISS) Tel.: +39 0649 903243 Fax: +39 0649 902082 Laboratorio Epidemiologie (ISS) Tel.: +39 0649 902273 Individuals: Fabrizio Pregliasco The Netherlands Institution: Erasmus University Rotterdam Faculty of Medicine Department of Virology PO Box 1738 3000 DR Rotterdam Tel.: +31 10 408 8067 Fax: +31 10 408 9485 National Institute for Public Health and the Environment (RIVM) PO Box 1, 3720 BA Bilthoven Tel.: +31 30 274 2115 Fax: +31 30 274 4409 Netherlands Institute for Health Services Research (NIVEL) PO Box 1568 3500 BN Utrecht Tel.: +31 30 2729 700 Fax: +31 30 2729 729 Individuals: JC de Jong Marie-Louise Heijnen Aad Bartelds Norway Institution: National Institute of Public Health P.O. Box 4404 Nydalen N-0403 Oslo Tel.: +47 22 04 22 00 Fax.: +47 22 35 36 05 Individuals: Bjorn Iversen Olav Hungnes
Annual Report: 2001-2002 Influenza Season, EISS, 2002 33
Portugal Institution: Instiuto Nacional de Saude Av Padre Cruz 1699 Lisboa Codex Tel.: +351 21 751 9200 Fax: +351 21 759 0441 Individuals: Isabel Marinho Falcão Helena Rebelo de Andrade Poland Institution: National Influenza Centre National Institute of Hygiene Ul. Chocimska 24 00-791 Warsaw Tel.: +48 22 646 18 60 Fax.: +48 22 646 18 60 Individuals: Lydia Brydak Magdalena Machala Romania Institution: National Reference Centre for Influenza Cantazucino Institute Splaiul Independentei 103 Sector 5 Bucharest 70100 Tel.: +41 1 411.38.00 Fax: +41 1 411.56.72 Individuals: Viorel Alexandrescu Emilia Lupulescu Slovak Republic Institution: National Reference Centre for Influenza Trnavská 52 SK- 845 26 Bratislava Tel.: +421 7 443 73 866 Fax: +421 7 443 72 641
Individuals: Zuzana Kristufkova Slovenia Institution: Institute of Public Health (IPH) Trubarjeva 2 01 Ljubljana Tel.: +386 1 4323245 Fax: +386 1 2323940 Laboratory for Virology (IPH) Bohori eva 15 01 Ljubljana Individuals: Katarina Prosenc Maja Socan Spain Institution: Instituto de Salud Carlos III Centro Nacional de Epidemiología Servicio de Vigilancia Epidemiológica C/Sinesio Delgado, 6 28029 Madrid Tel: +34 91 3877802 Fax: +34 91 3877816 Individuals: Salvador de Mateo Pilar Perez-Brena Tomás Vega Alonso Sweden Institution: Swedish Institute for Infectious Disease Control SE-171 82 Solna Tel.: +46 8 457 23 00 Fax: +46 8 32 83 30 Individuals: Annika Linde Pasi Penttinen

Annual Report: 2001-2002 Influenza Season, EISS, 2002 34
Switzerland Institution: Swiss Federal Office of Public Health Division of Epidemiology and Infectious Diseases 3003 Bern Tel. +41 31 323 87 06 Fax +41 31 323 87 95 National Influenza Centre Laboratoire Central de Virologie Division des Maladies Infectieuses Hôpital Cantonal Universitaire de Genève rue Micheli du Crest, 24 CH-1211 Geneva 14 Tel. +41 22 372 40 81 Fax +41 22 372 40 88 Individuals: Daniela Müller Yves Thomas United Kingdom Institution: England Public Health Laboratory Service Central Public Health Laboratory Communicable Disease Surveillance Centre 61 Colindale Avenue London NW9 5EQ Tel.: +44 20 8200 6868 Fax: +44 20 8200 7868 Royal College of General Practitioners(RCGP) Research Unit 54 Lordswood Road Birmingham B17 9DB Tel.: +44 121 426 1125 Fax: +44 121 428 2084 Scotland Scottish Centre for Infection and Environmental Health Clifton House, Clifton Place Glasgow G3 7LN Tel.: +44 141 300 1151 Fax: +44 141 300 1170
Wales PHLS Communicable Disease Surveillance Centre Abton House Cardiff CF4 3QX Tel.: +44 2920 521997 Fax: +44 2920 521987 Individuals: England Douglas Fleming John Watson Maria Zambon Scotland Peter Christie Wales Daniel Thomas

This report was produced by a contractor for Health & Consumer Protection Directorate General and represents the views of thecontractor or author. These views have not been adopted or in any way approved by the Commission and do not necessarilyrepresent the view of the Commission or the Directorate General for Health and Consumer Protection. The EuropeanCommission does not guarantee the accuracy of the data included in this study, nor does it accept responsibility for any use madethereof.