european winter sports facts - freeremi.forsans.free.fr/european snowboard market survey...
TRANSCRIPT


b
European Winter Sports Facts :
A BOARDSPORTS SOURCE JOB

Weather facts :
Average European temperatures December 2010

Weather facts :
Average European temperatures March 2011

Hottest temp 2005
2010
Weather facts :
Coldest temp 2000
2011
Average 2000-2010
World temperature evolution from 2000 to 2011

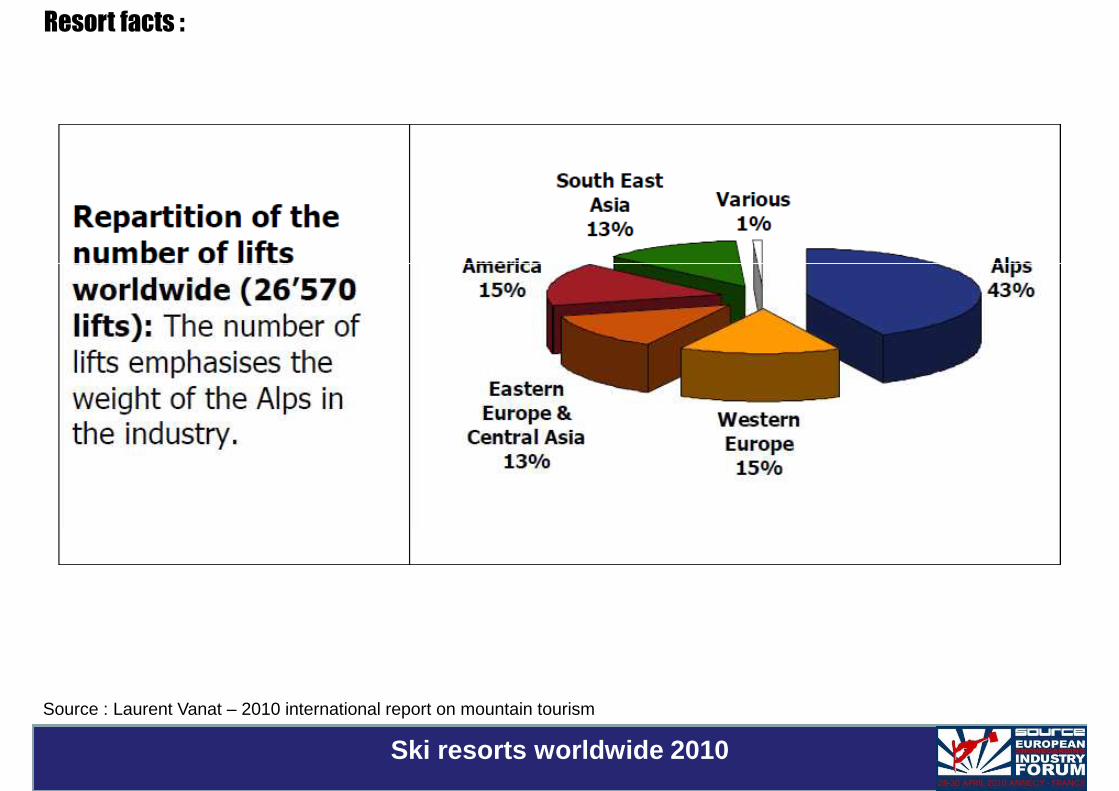
Resort facts :
Ski resorts worldwide 2010
Source : Laurent Vanat – 2010 international report on mountain tourism
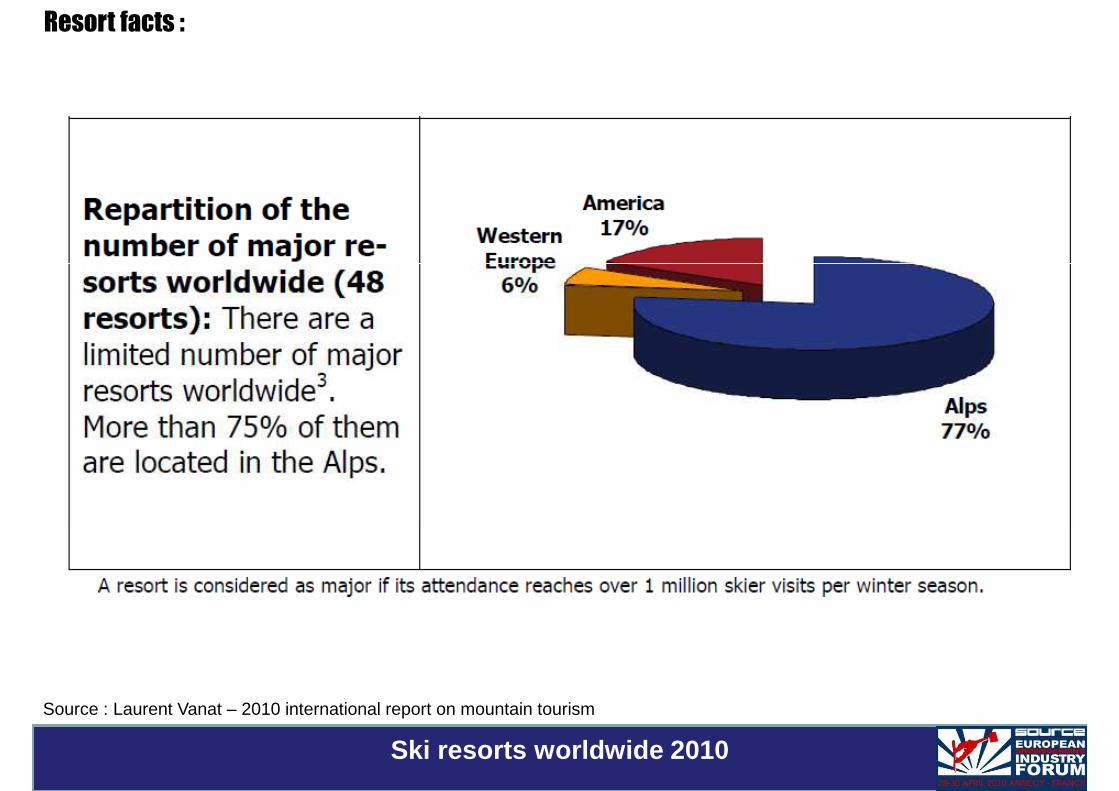
Resort facts :
Source : Laurent Vanat – 2010 international report on mountain tourism
Ski resorts worldwide 2010
Resort facts :
Source : Laurent Vanat – 2010 international report on mountain tourism
Ski resorts worldwide 2010

Resort facts :
Source : Laurent Vanat –2010 international report
on mountain tourism
Top world resorts in millions of skier visits

Resort facts :
Evolution of skier visits in millions
Source : Laurent Vanat – 2010 international report on mountain tourism
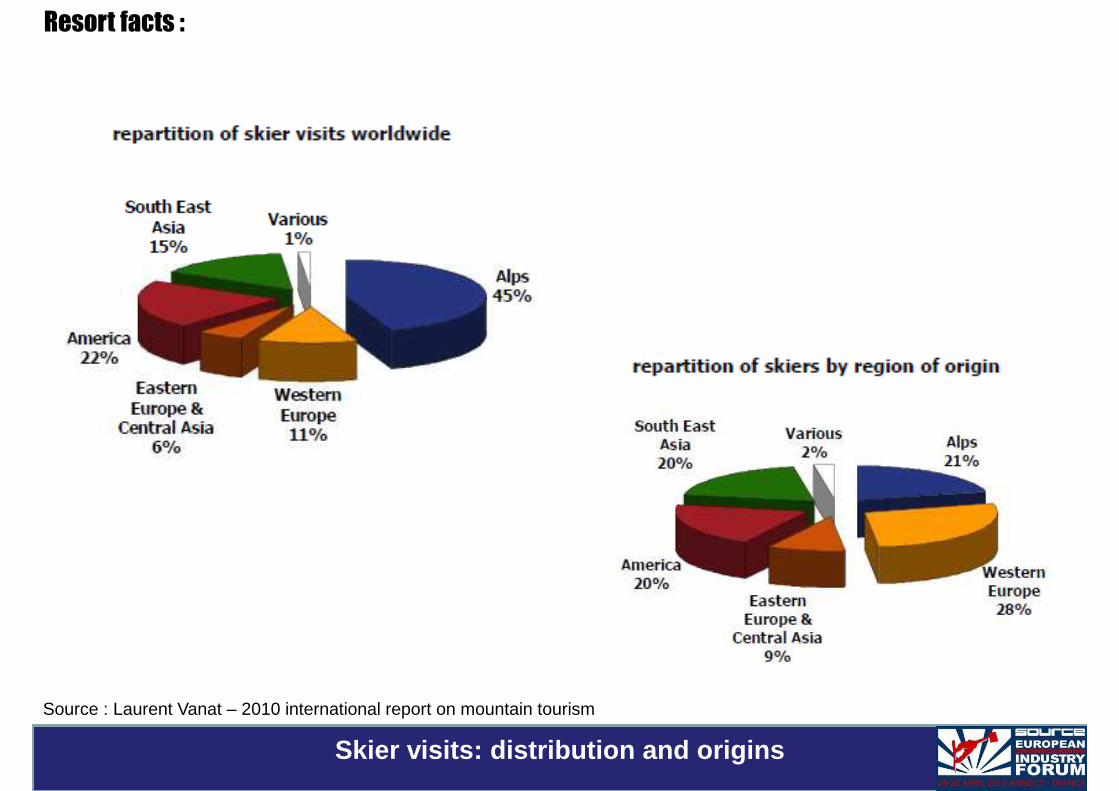
Resort facts :
Skier visits: distribution and origins
Source : Laurent Vanat – 2010 international report on mountain tourism

Economic facts:
Board sports market by country

Economic facts:
Snowboard Global Sport Market - 2008

Primary snowboard industry concerns:
The industry forgets kids and “older generation”Price dumping through online salesPoor snow conditions in central Europe from mid JanuaryShop InventoriesShop InventoriesHardcore discounts from large sporting goods stores.Production capacity AsiaEconomies in EuropeExchange rate fluctuations Raw materials increasing Less participation in winter sportsCostWars and catastrophes influencing the world economy
Negative market influencies Winter 0910

Current snowboard distribution concerns :
Discounts start too early
Less room for small brands
Late deliveries
Limited credit lines from banks
Distributors in Eastern Europe still have trouble financing products
Concentration of retailers
Online sales
Hard goods only for image
Negative market influences Winter 09-10

European Market Survey
2010/2011
A BOARDSPORTS SOURCE JOB
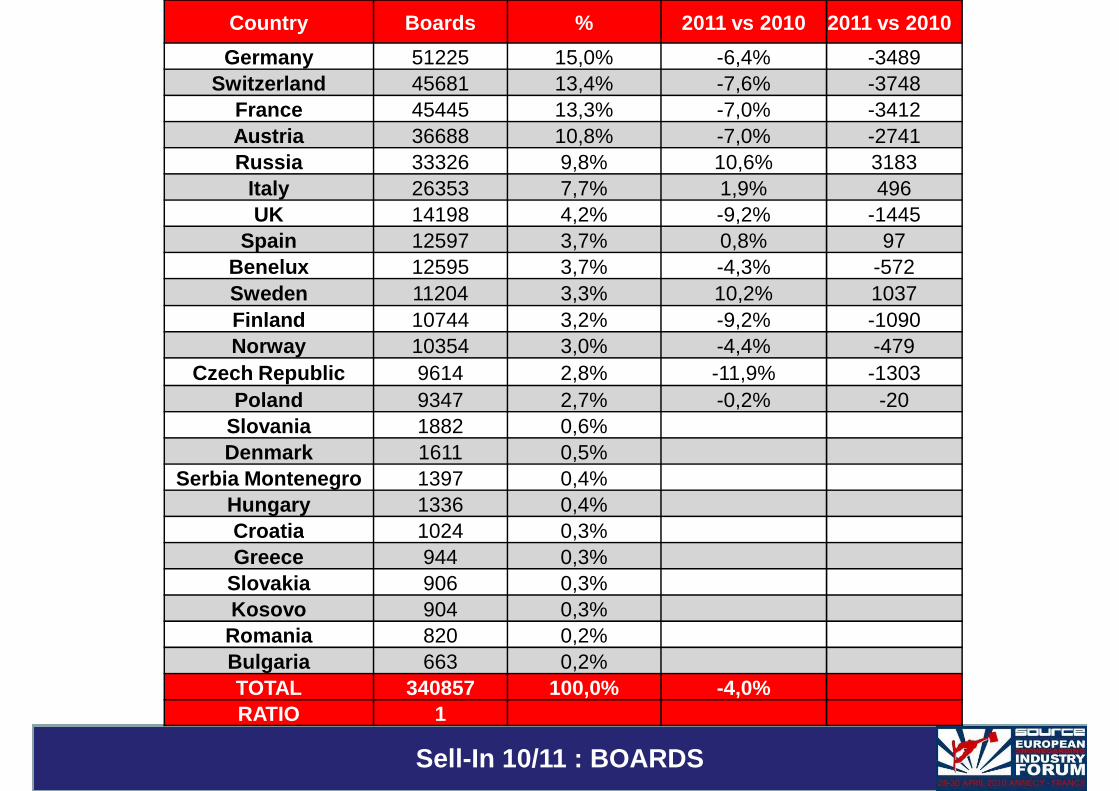
Country Boards % 2011 vs 2010 2011 vs 2010
Germany 51225 15,0% -6,4% -3489Switzerland 45681 13,4% -7,6% -3748
France 45445 13,3% -7,0% -3412Austria 36688 10,8% -7,0% -2741Russia 33326 9,8% 10,6% 3183
Italy 26353 7,7% 1,9% 496UK 14198 4,2% -9,2% -1445
Spain 12597 3,7% 0,8% 97Benelux 12595 3,7% -4,3% -572Benelux 12595 3,7% -4,3% -572Sweden 11204 3,3% 10,2% 1037Finland 10744 3,2% -9,2% -1090Norway 10354 3,0% -4,4% -479
Czech Republic 9614 2,8% -11,9% -1303Poland 9347 2,7% -0,2% -20
Slovania 1882 0,6%Denmark 1611 0,5%
Serbia Montenegro 1397 0,4%Hungary 1336 0,4%Croatia 1024 0,3%
Sell-In 10/11 : BOARDS
Croatia 1024 0,3%Greece 944 0,3%
Slovakia 906 0,3%Kosovo 904 0,3%
Romania 820 0,2%Bulgaria 663 0,2%TOTAL 340857 100,0% -4,0%RATIO 1
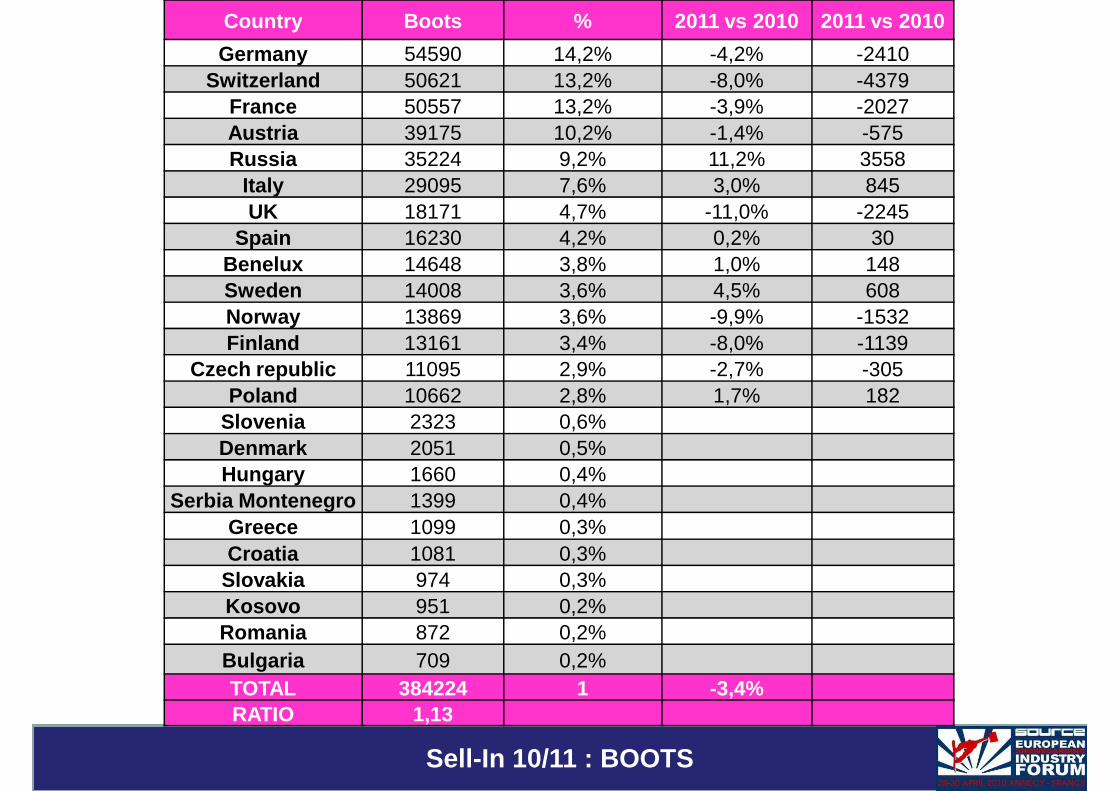
Country Boots % 2011 vs 2010 2011 vs 2010
Germany 54590 14,2% -4,2% -2410Switzerland 50621 13,2% -8,0% -4379
France 50557 13,2% -3,9% -2027Austria 39175 10,2% -1,4% -575Russia 35224 9,2% 11,2% 3558
Italy 29095 7,6% 3,0% 845UK 18171 4,7% -11,0% -2245
Spain 16230 4,2% 0,2% 30Benelux 14648 3,8% 1,0% 148Benelux 14648 3,8% 1,0% 148Sweden 14008 3,6% 4,5% 608Norway 13869 3,6% -9,9% -1532Finland 13161 3,4% -8,0% -1139
Czech republic 11095 2,9% -2,7% -305Poland 10662 2,8% 1,7% 182
Slovenia 2323 0,6%Denmark 2051 0,5%Hungary 1660 0,4%
Serbia Montenegro 1399 0,4%Greece 1099 0,3%
Sell-In 10/11 : BOOTS
Greece 1099 0,3%Croatia 1081 0,3%
Slovakia 974 0,3%Kosovo 951 0,2%
Romania 872 0,2%Bulgaria 709 0,2%TOTAL 384224 1 -3,4%RATIO 1,13
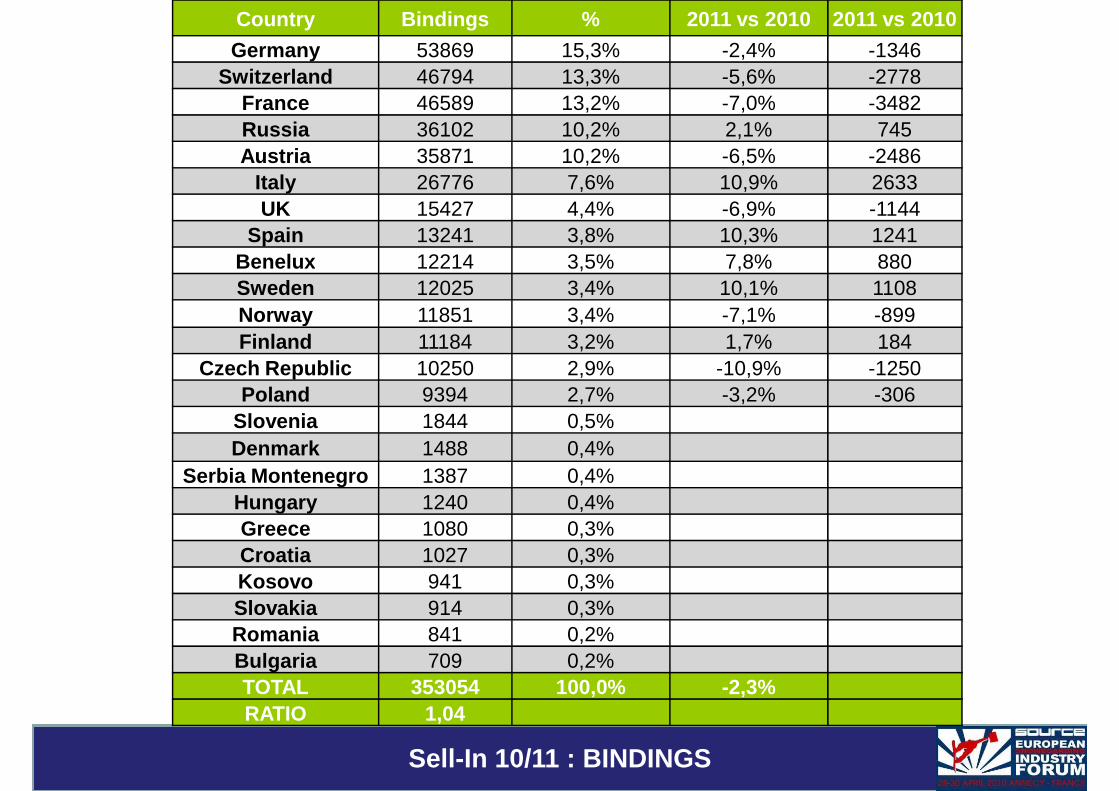
Country Bindings % 2011 vs 2010 2011 vs 2010
Germany 53869 15,3% -2,4% -1346Switzerland 46794 13,3% -5,6% -2778
France 46589 13,2% -7,0% -3482Russia 36102 10,2% 2,1% 745Austria 35871 10,2% -6,5% -2486
Italy 26776 7,6% 10,9% 2633UK 15427 4,4% -6,9% -1144
Spain 13241 3,8% 10,3% 1241Benelux 12214 3,5% 7,8% 880Benelux 12214 3,5% 7,8% 880Sweden 12025 3,4% 10,1% 1108Norway 11851 3,4% -7,1% -899Finland 11184 3,2% 1,7% 184
Czech Republic 10250 2,9% -10,9% -1250Poland 9394 2,7% -3,2% -306
Slovenia 1844 0,5%Denmark 1488 0,4%
Serbia Montenegro 1387 0,4%Hungary 1240 0,4%Greece 1080 0,3%
Sell-In 10/11 : BINDINGS
Greece 1080 0,3%Croatia 1027 0,3%Kosovo 941 0,3%Slovakia 914 0,3%Romania 841 0,2%Bulgaria 709 0,2%TOTAL 353054 100,0% -2,3%RATIO 1,04

Losers 2010/2011 :UK / Switzerland / Norway
Winners 2010/2011 :Russia / Italy / Sweden
Sell-In 10/11 : winners and losers

500000
600000
Evolution of Global European snowboard sales (Sell- In)
Boards
Boots
Bindings45
3480
4122
51
3952
25
3627
93
3551
48
3408
57
5068
28
4641
59
4415
51
4186
00
3977
82
3842
244746
59
4340
44
4123
70
3822
71
3612
49
3530
54200000
300000
400000
Sales evolution over last 6 years
0
100000
2005/2006 2006/2007 2007/2008 2008/2009 2009/2010 2010/2011
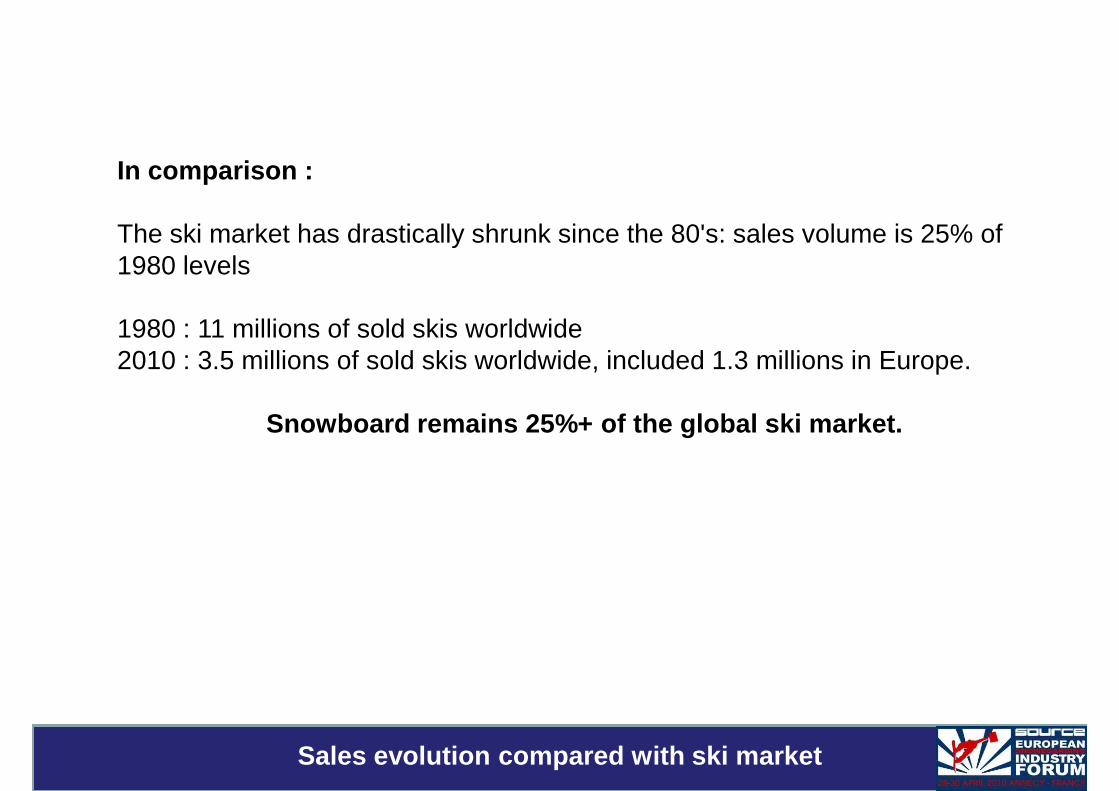
In comparison :
The ski market has drastically shrunk since the 80's: sales volume is 25% of 1980 levels1980 levels
1980 : 11 millions of sold skis worldwide2010 : 3.5 millions of sold skis worldwide, included 1.3 millions in Europe.
Snowboard remains 25%+ of the global ski market.
Sales evolution compared with ski market

Men Women Kids
Snowboards 90.3 M€ 27.2 M€ 3.7 M€Boots 54.1 M€ 17 M€ 4.2 M€
Bindings 47.3 M€ 13.5 M€ 2 M€
European Market in Euros
Bindings 47.3 M€ 13.5 M€ 2 M€TOTAL 191.7 M€ 57.8 M€ 9.9 M€
% 74% 22% 4%
Snowboards 121 M€ (-4%)
Boots 75 M€ (-6%)
24%snowboards
Euro 10/11 turnover ESTIMATE based on retail prices
Boots 75 M€ (-6%)
Bindings 63 M€ (-4.5%)
TOTAL 259.5 M€ (-4.5%)
47%
29%
boots
bindings
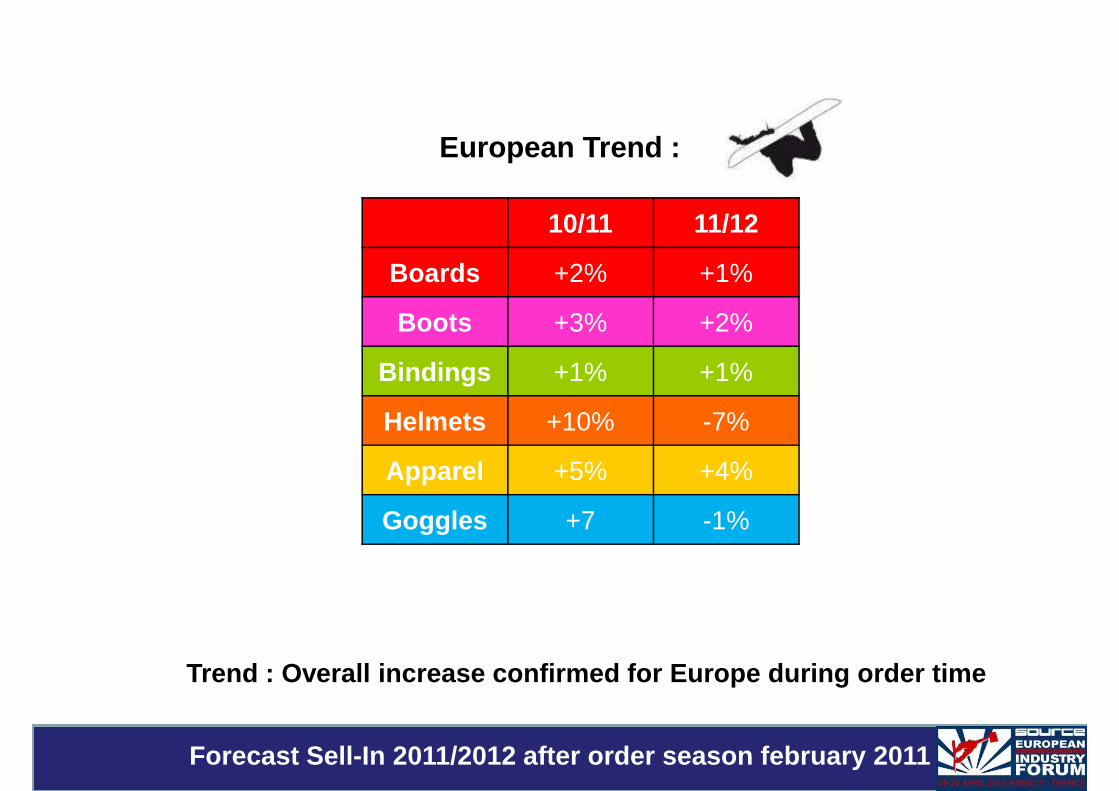
European Trend :
10/11 11/12
Boards +2% +1%Boards +2% +1%
Boots +3% +2%
Bindings +1% +1%
Helmets +10% -7%
Apparel +5% +4%
Goggles +7 -1%
Forecast Sell-In 2011/2012 after order season febru ary 2011
Goggles +7 -1%
Trend : Overall increase confirmed for Europe durin g order time
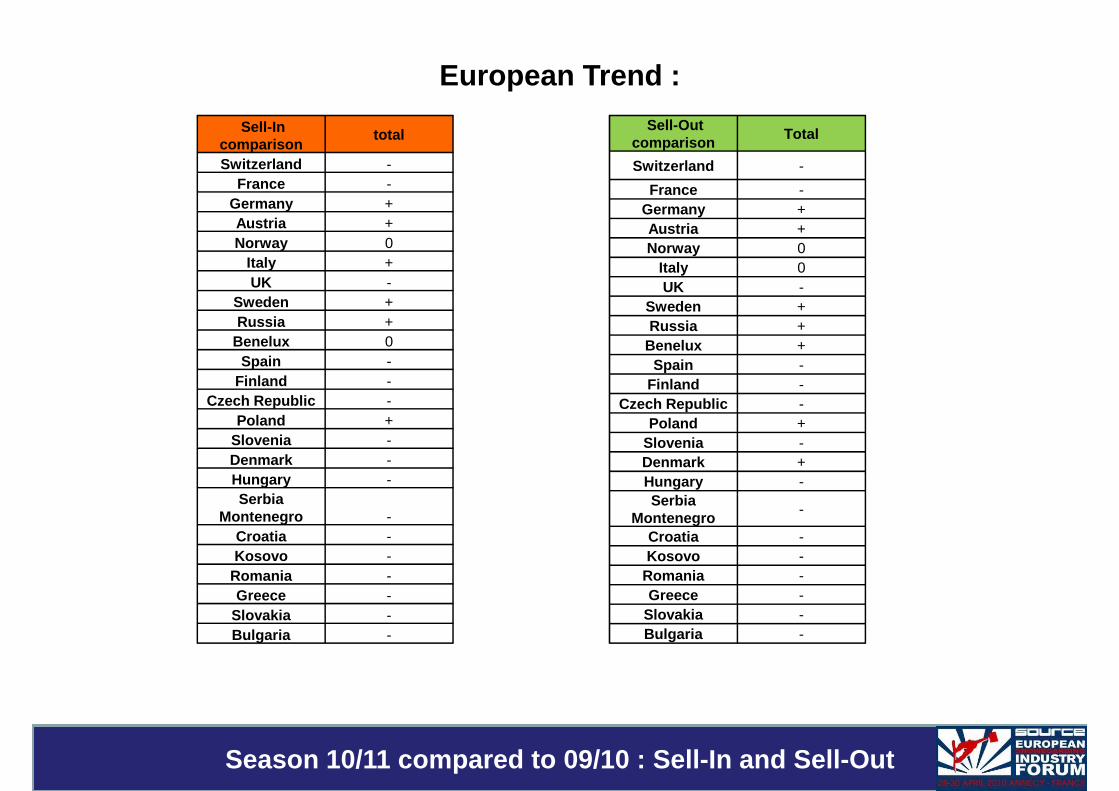
European Trend :
Sell-In comparison
total
Switzerland -France -
Germany +Austria +Norway 0
Italy +
Sell-Outcomparison
Total
Switzerland -
France -Germany +Austria +Norway 0
Italy 0Italy +UK -
Sweden +Russia +
Benelux 0Spain -
Finland -Czech Republic -
Poland +Slovenia -Denmark -Hungary -Serbia
Montenegro -
Italy 0UK -
Sweden +Russia +
Benelux +Spain -
Finland -Czech Republic -
Poland +Slovenia -Denmark +Hungary -Serbia
Montenegro-
Season 10/11 compared to 09/10 : Sell-In and Sell-O ut
Croatia -Kosovo -
Romania -Greece -
Slovakia -Bulgaria -
Croatia -Kosovo -
Romania -Greece -
Slovakia -Bulgaria -

09/10 Boards Bindings Boots 10/11 Boards Bindings Boots
1 Burton Burton Burton 1 Burton Burton Burton
2 Nitro Ride Salomon 2 Nitro Flow Salomon
3 Salomon Flow Nitro 3 K2/Ride Ride Nitro
4 K2 Nitro DC shoes 4 Salomon Nitro Northwave
5 Ride K2 Vans 5 Head / Lib Tech Salomon Vans / DC / 32
6 Head Salomon 32 6 Rome K2 K2
7 Rome Head Head/Northwave 7 Völkl Drake Head / Deeluxe
8 Völkl Drake Flow/K2 8 Rossignol Union Flow
9 Lib TechWed'ze/Crazy
Creeks Deeluxe 9 Nidecker Head Ride
Brand ranking Estimate , season 2009/10 Vs 2008/09
Creeks
10+
ElanNidecker
FlowAtomicForumWed’ze
Crazy CreeksRossignol
SPUnionAtomic
Elan
RideWed’Ze
Crazy Creeks10 +
Forum / FlowAtomicWed’ze
ElanYes
SPAtomicWed’ze
AtomicWed’ze

09/10 Apparel Goggles Helmets 10/11 Apparel Goggles Helmet s
1 Burton Oakley Giro 1 Volcom Oakley Giro
2 Volcom Dragon Red/Smith 2 Burton Anon / Smith Red
3 Billabong Anon Bern 3 QuiksilverElectric Dragon Smith
4 Billabong Von Zipper Uvex4 Quiksilver Electric Protec
5 Zimstern Alpina Uvex 5 O'Neill Spy Protec5 Zimstern Alpina Uvex 5 O'Neill Spy Protec
6 O'Neill Spy/VZ Scott 6special Blend
686Adidas Scott
7 Bonfire Smith/Uvex Salomon 7 Zimstern Quiksilver Bern
8 Sessions Scott Alpina/K2 8 North face Uvex K2
9 Foursquare686 Adidas Poc/Sweet 9 Bonfire IS Poc
Brand ranking Estimate , season 2009/10
10+ HorsefeathersNike 6.0
ISBriko
Carrera10+ Foursquare
HorsefeathersWed’ze
SweetAlpinaCarrera
SalomonWed’ze

39% 36%
60%
80%
100%
resorts
cities
% of sales between ski resorts Vs cities (global mar ket hard goods) :
Cities : 64 %Ski resorts : 36 %
61% 64%
0%
20%
40%
season 0910 season 1011
cities
30% 24%80%
100%
resorts
% of sales between ski resorts Vs cities (global ma rket apparel)
Cities : 76 %Ski resorts : 24 %
Distribution segmentation : details
70% 76%
0%
20%
40%
60%
season 0910 season 1011
resorts
cities

% rental Vs sales (global market hard goods) :
Sales : 78 % Rental : 22 %
78%
22%
78%
22%
20%
40%
60%
80%
100%
rental
sales
0%
20%
season 0910 season 1011
Distribution segmentation : details
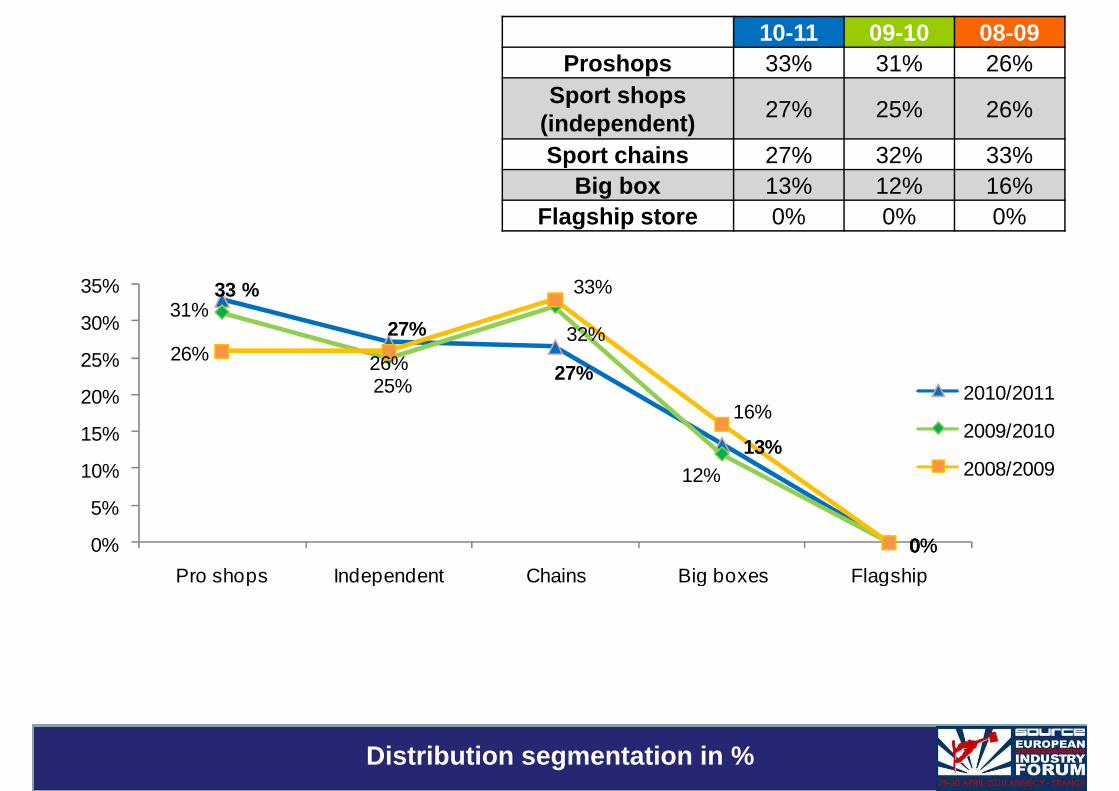
10-11 09-10 08-09Proshops 33% 31% 26%
Sport shops (independent)
27% 25% 26%
Sport chains 27% 32% 33%Big box 13% 12% 16%
Flagship store 0% 0% 0%
33 %
27%
27%
13%
31%
25%
32%
12%
26% 26%
33%
16%
5%
10%
15%
20%
25%
30%
35%
2010/2011
2009/2010
2008/2009
00%0%0%
Pro shops Independent Chains Big boxes Flagship
Distribution segmentation in %

Based on retail price information
Board price segmentation season 10-11
Board price X < 199 € 199€<X<300€ 300€<X<400€ 400€<X<500 € X >500 €
% 9 23 34 23 11
Boots price X < 99 €99 € < X <
149 €150 € < X <
199 €200 € < X <
249 €250 € < X <
299 €300 € < X
% 9 22 28 22 14 6
Bindings price segmentation season 10 -11
Boots price segmentation season 10-11
Price segmentation Men’s products %
Bindings price segmentation season 10 -11
Bindingsprice
X < 99 €100 € < X <
149 €150 € < X <
199 €200 € < X <
249 €250 € < X <
299 €300 € < X
% 5 27 36 19 10 2

Based on retail price information
Board price segmentation season 10-11
Board price X < 199 € 199€<X<300€ 300€<X<400€ 400€<X<500 € X >500 €
% 10 29 45 14 2
Boots price X < 99€100 € < X <
149 €150 € < X <
199 €200 € < X <
249 €250 € < X <
299 €300 € < X
% 8 19 44 16 9 2
Bindings price segmentation season 10 -11
Boots price segmentation season 10-11
Price segmentation Women’s products %
Bindings price segmentation season 10 -11
Bindingsprice
X < 99 €100 € < X <
149 €150 € < X <
199 €200 € < X <
249 €250 € < X <
299 €300 € < X
% 11 38 39 9 3 1
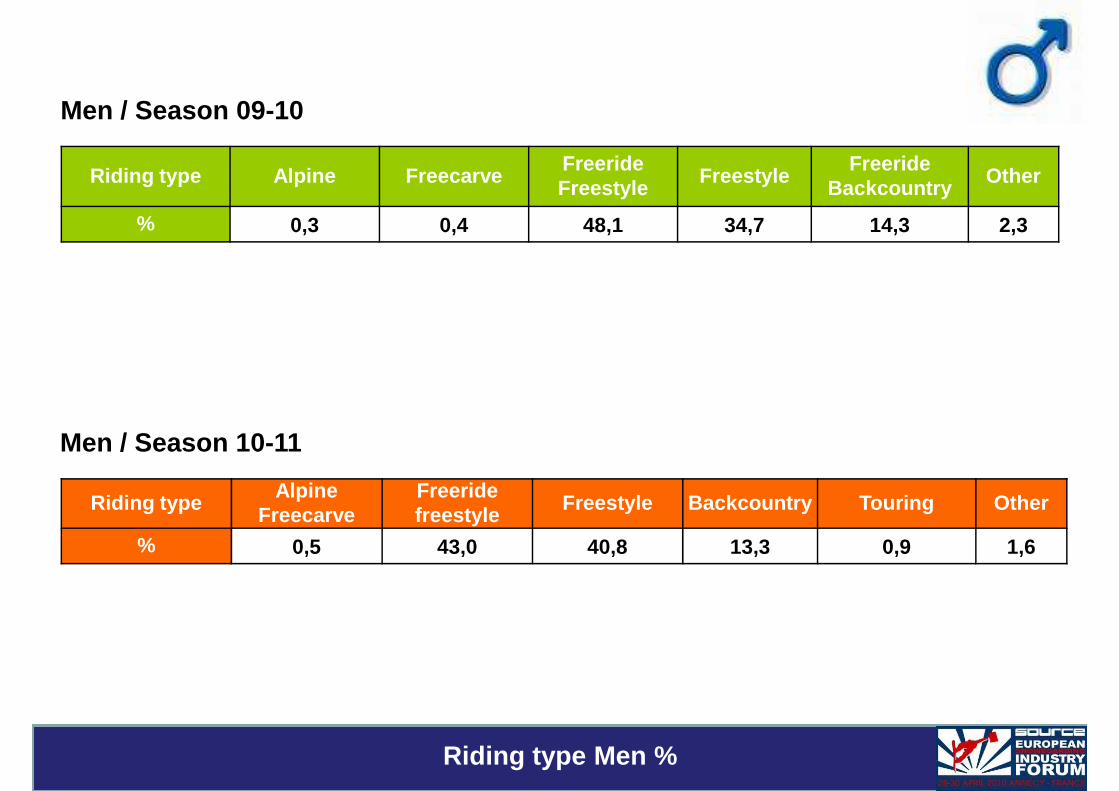
Men / Season 09-10
Riding type Alpine FreecarveFreeride Freestyle
FreestyleFreeride
BackcountryOther
% 0,3 0,4 48,1 34,7 14,3 2,3
Men / Season 10-11
Riding typeAlpine
FreecarveFreeride freestyle
Freestyle Backcountry Touring Other
Riding type Men %
% 0,5 43,0 40,8 13,3 0,9 1,6

Women / Season 09-10
Riding type Alpine FreecarveFreerideFreestyle
FreestyleFreeride
BackcountryOther
% 0 0 58,7 31,0 9,8 0,5
Women / Season 10-11
Riding typeAlpine
FreecarveFreeride freestyle
Freestyle Backcountry Touring Other
Riding type Women %
Freecarve freestyle
% 0 47,4 41,1 11,4 0 0,1

23%
7%
70%
Season 09-10Women
Kids
Men
25%
7%68%
Season 10-11 Women
Kids
70% Men
Participation (sales)
68%Men

64
Men Sales Winter 10-11 Vs 09-10 in %
31
3944
27
49
1011
0910
Men sales details
BOA system Speed entrance system in bindings
sales
Rocker boards

61
Women Sales Winter 10-11 Vs 09-10 in %
39
4845
29
43
1011
0910
Women sales details
BOA system Speed entrance system in bindings
sales
Rocker boards
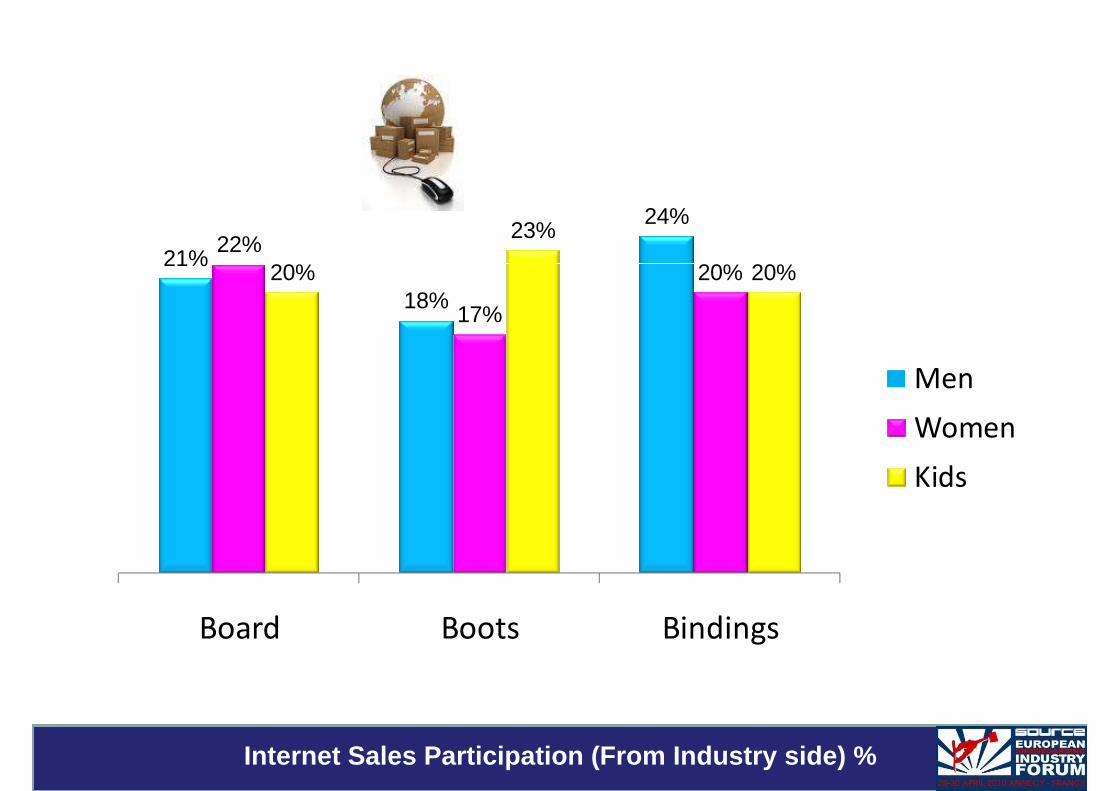
21%
24%22%
20%20%
23%
20%21%
18%17%
20%20% 20%
Men
Women
Kids
Internet Sales Participation (From Industry side) %
Board Boots Bindings

China 58%Austria 35%
Production sites (From Industry side)
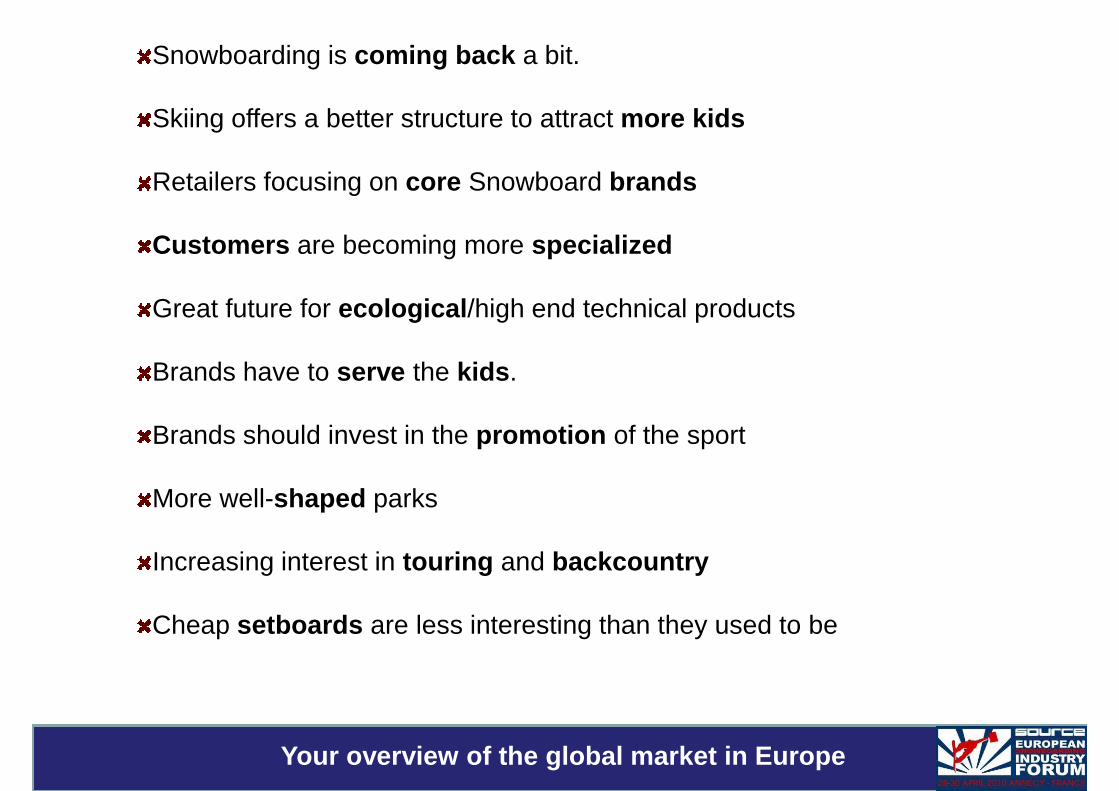
Snowboarding is coming back a bit.
Skiing offers a better structure to attract more kids
Retailers focusing on core Snowboard brands
Customers are becoming more specialized
Great future for ecological /high end technical products
Brands have to serve the kids .
Brands should invest in the promotion of the sport
More well-shaped parks
Increasing interest in touring and backcountry
Cheap setboards are less interesting than they used to be
Your overview of the global market in Europe

Sell-out started very early in all of Europe but drop from beginning of 2011.
A lot of closed out products
Participants are getting older .
Rental is helping to moderate the variances of the market
Specialized media are moving and changing but still suffering
Lack of mainstream impact and coverage
Lack of a big European star rider
A little demographic raise up
Europe will also be affected by Japanese production creating overstock
Your overview of the global market in Europe
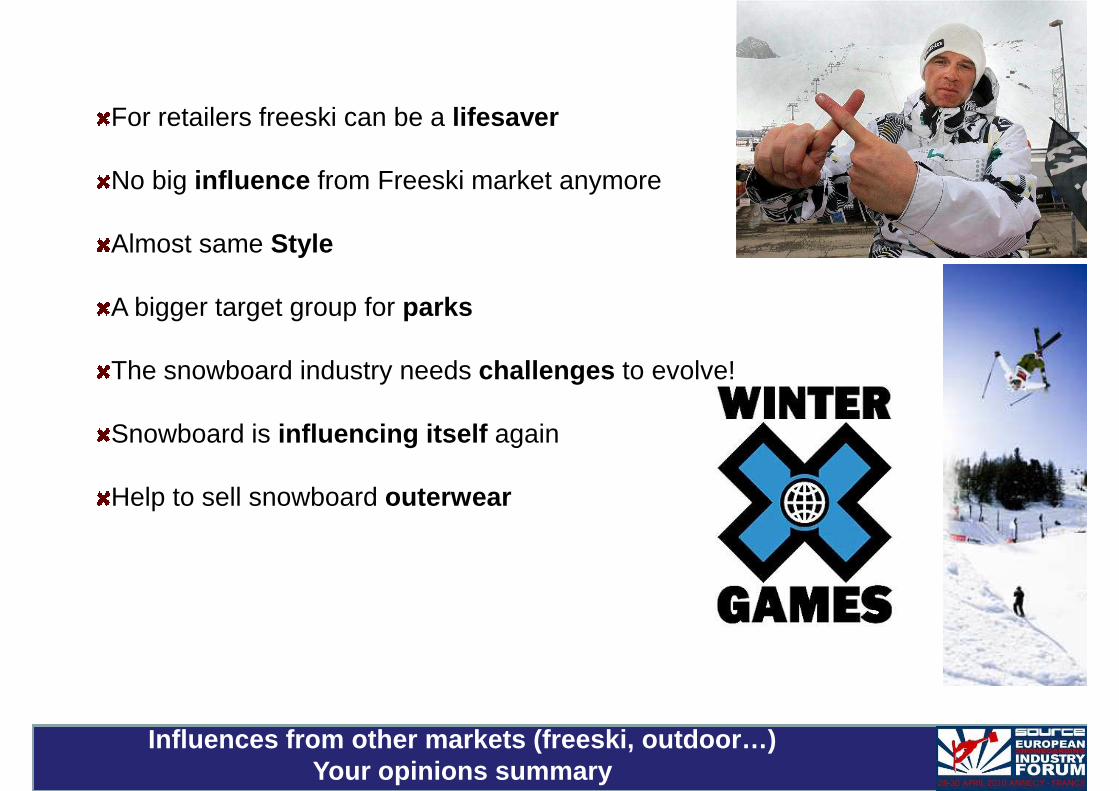
For retailers freeski can be a lifesaver
No big influence from Freeski market anymore
Almost same Style
A bigger target group for parks
The snowboard industry needs challenges to evolve!
Snowboard is influencing itself again
Help to sell snowboard outerwear
Influences from other markets (freeski, outdoor…)Your opinions summary
Strengths:
Still very cool imageStrong shop network who knows what they are doingAnti establishmentAnti establishmentNew riding style coming from the USAA wide generation of boarders now have children and spread the sport to their kidsMass distribution of the sport: OlympicsTrendyYouth driven > Market/Trend-pullDifferentiating > LifestyleSolid 20-30 target groupDedicated actors (media, distribution…)
SWOT of the market (Strengths, weaknesses, opportu nities, threats)
Dedicated actors (media, distribution…)New events – (European pro test tour, European X games) Board CultureReverse camberMature and settled market

Weaknesses:
No structure for kids to get into the sportLack of mass media support in EuropeProduction dictatorshipProduction dictatorshipWeather dependentNot a ‘’fresh ’’ sport activityCostNeed to plan your day on the hill way aheadResort snowboard facilities Brand ability to invest Participants are getting olderPrices are still going down
SWOT of the market (Strengths, weaknesses, opportu nities, threats)
Specialty distribution sells less products and cheaperExtended Payment TermsConsignment conditions are becoming normal. Financial situation in EuropeEnvironmental concerns

Opportunities:
The “coolest ” winter sport, compared to skateboardingSnow halls and parksUrban SnowboardingThe young kids are getting back into shredding againSell to the specialized customerSnowboarders are maturing and have more money to spendSnowboarders are maturing and have more money to spendNew markets New riding styles (Think Tank approach ) bring fresh air into the sportRocker is more Fun for 95% of the participantsSustainable developmentPrivate/public transportation developmentRental businessUSA is up again Big events like the 2d X games in Europe are also encouraging
SWOT of the market (Strengths, weaknesses, opportu nities, threats)
Big events like the 2d X games in Europe are also encouraging Touring (split board) for older snowboardersResort equipmentEuro sized events Working together as a community

Threats:
Media views sport as inaccessibleCost of the sportFreeskiing competitionsFreeskiing competitionsPrice pressure Video Games – kids getting fat and staying indoorsAmazon, Zalando, etc –STOP Selling through them directly! Overproduction Crude oil futures prices variations > consumer buying powerClosed out productsClimate changingPro scene shrinking and struggling
China
SWOT of the market (Strengths, weaknesses, opportu nities, threats)
Price increases in ChinaSnowboards are only for rich people ?Market too coreAging of target group.