evaluating financial development in emerging …
TRANSCRIPT
Evaluating financial development in emerging capitalmarkets with efficiency benchmarks
Author
C. Worthington, Andrew, Higgs, Helen
Published
2006
Journal Title
Journal of Economic Development
Copyright Statement
© 2006 The Economic Research Institute of Chung-Ang University. This is the author-manuscript version of this paper. Reproduced in accordance with the copyright policy of thepublisher. This journal is available online at http://165.194.73.110/newjed/index.html
Downloaded from
http://hdl.handle.net/10072/26046
Link to published version
http://www.jed.or.kr/
Griffith Research Online
https://research-repository.griffith.edu.au

EVALUATING FINANCIAL DEVELOPMENT IN EMERGING CAPITAL MARKETS WITH EFFICIENCY BENCHMARKS
ANDREW C. WORTHINGTON
University of Wollongong
HELEN HIGGS
Queensland University of Technology
This paper examines the weak-form market efficiency of twenty-seven emerging markets. The sample encompasses three markets in Africa (Egypt, Morocco and South Africa), ten in Asia (China, India, Indonesia, Korea, Malaysia, Pakistan, the Philippines, Sri Lanka, Taiwan and Thailand), four in Europe (Czech Republic, Hungary, Poland and Russia), seven in Latin America (Argentina, Brazil, Chile, Colombia, Mexico, Peru and Venezuela) and three in the Middle East (Israel, Jordan and Turkey). Daily market returns are tested for random walks using serial correlation coefficient and runs tests, Augmented Dickey-Fuller (ADF), Phillips-Perron (PP) and Kwiatkowski, Phillips, Schmidt and Shin (KPSS) unit root tests and multiple variance ratio tests. The serial correlation and runs tests conclude that most emerging markets are weak-form inefficient. However, the unit root tests suggest the presence of weak-form efficiency in many emerging markets, but with some exceptions. The results from the most stringent multiple variance ratio tests are in general agreement with the serial correlation and runs tests. On this basis, only Hungary, Jordan and Israel are weak-form market efficient, with Egypt, Korea, Malaysia and Argentina meeting at least some of the requirements of a random walk.
Keywords: Market efficiency, Random walks, Emerging markets.
JEL classification: C10, G14, O16
1. INTRODUCTION
Stock markets play a crucial role in financial development. However, the ability of
stock markets to play the role that is ascribed to them – attracting foreign investment,
boosting domestic saving and improving the pricing and availability of capital – depends
upon the presence of market efficiency. In an efficient market, the prices of stocks fully
incorporate all relevant information, and hence stock returns will display unpredictable (or
random walk) behaviour. A market following a random walk is consistent with equity being
appropriately priced at an equilibrium level, whereas the absence of a random walk infers
distortions in the pricing of capital and risk. This has important implications for the allocation
of capital within an economy and hence overall financial development.
In this manner, tests of market efficiency and, more particularly, random walks,
provide an important means by which financial development can be appraised. Only in fully
deregulated and liberalised markets characterised by appropriate incentives and institutional

WORTHINGTON & HIGGS 2
frameworks can we expect the necessary prerequisites for market efficiency – including
market liquidity, breadth and depth – to be satisfied. But the issue of how efficient markets
actually are in the real world is clearly a question that can only be resolved by resorting to
empirical evidence. This can be problematic in that the measurement of market efficiency is
beset with a number of conceptual and methodological difficulties.
In this paper an attempt is made to examine the random walk behaviour (and hence
market efficiency) of emerging markets using a number of alternative, though
complementary, testing procedures. The paper itself is divided into five main areas. Section 2
provides a synoptic review of the different techniques for the measurement of market
efficiency on the basis of random walks and deals with the literature on the empirical
measurement of market efficiency. Section 3 provides a description of the data employed in
the analysis. Section 4 discusses the empirical methodology used. Attention is paid to the four
types of tests employed and their differing assumptions regarding the random walk
hypothesis. The results are dealt with in Section 5. The paper ends with some concluding
remarks in the final section.
2. RANDOM WALKS AND MARKET EFFICIENCY
Random walks in stock returns are crucial to the formulation of rational expectations
models and the testing of (weak-form) market efficiency. In an efficient market, the prices of
stocks fully incorporate all relevant information, and hence stock returns will display
unpredictable (or random walk) behaviour. In stock prices not characterised by a random walk
the return generating process is dominated by a temporary component and therefore future
returns can be predicted by the historical sequence of returns. Tests for weak form market
efficiency then focus on the predictability of stock returns.
Despite its apparent singularity, the random walk model actually comprises three
successively more restrictive hypotheses with sequentially stronger tests for random walks
(Campbell et al. 1997). The least restrictive of these is that in a market that complies with a
random walk it is not possible to use information on past prices to predict future prices
(RW3). That is, returns in a market conforming to RW3 are serially uncorrelated,
corresponding to a random walk hypothesis with dependent but uncorrelated increments.
However, it may still be possible for information on the variance of past prices to predict the
future volatility of the market. A market that conforms to these conditions implies that returns
are serially uncorrelated, corresponding with a random walk hypothesis with increments that

EFFICIENCY IN EMERGING CAPITAL MARKETS 3
are independently, but not identically, distributed (RW2). Finally, if it is not possible to
predict either future price movements or volatility on the basis of information from past
prices, then such a market complies with the most restrictive notion of a random walk (RW1).
In such a market, returns are serially uncorrelated and conform to a random walk hypothesis
with independent and identically distributed increments.
A variety of tests have been employed within this framework to examine random
walks (and hence tests for weak-form efficiency) in real-world markets (Fama 1970; 1991).
One approach is to test the serial correlation of returns. Since under the random walk
hypothesis the increments are uncorrelated at all leads and lags, autocorrelation tests form the
basis of a large number of studies. Another approach is to examine the sequence of returns, of
which the runs test is well known. This is regarded as a more appropriate test of the
assumption of independence under the non-normal distribution of returns. However, more
recent work often employs variance (or multiple variance) ratio and unit root tests. An
important property of the former is that it entails testing not only the RW1 hypothesis, but
also RW2 and RW3. In the case of the latter, though they imply non-zero serial
autocorrelation under both the null and alternative hypothesis, they are useful for the
identification of nonstationarity as a necessary condition for a random walk, with other tests
used to verify the independence assumption.
To this end, an ever-increasing number of studies have examined random walks in the
world’s stock markets. Some of these have chosen to concentrate on individual markets.
These include studies of random walks in Korea (Ayadi and Pyun 1994, Ryoo and Smith
2002), China (Lee et al. 2001), Hong Kong (Cheung and Coutts 2001), Slovenia (Dezlan
2000), Spain (Regúlez and Zarraga 2002), the Czech Republic (Hajek 2002), the United
Kingdom (Poon 1996) and Turkey (Zychowicz et al. 1995, Buguk and Brorsen 2003). Others
have elected instead to focus on emerging markets on a regional basis. Markets in Asia
(Huang 1995, Groenewold and Ariff 1998), Latin America (Urrutia 1995, Ojah and Karemera
1999. Grieb and Reyes 1999, Karemera et al. 1999), Africa (Smith et al. 2002, Appiah-Kusi
and Menyah 2003) and the Middle East (Abraham et al. 2002) have been addressed in this
manner. However, these studies generally concentrate on developed markets and none have
examined a large number of markets across regions.
Similarly, with few exceptions these studies have employed a single testing procedure
for random walks and market efficiency. Some, such as Poshakwale (1996) and Abraham et
al. (2002), have concentrated on tests for serial dependence, while others, including Karemara
et al. (1999) and Ryoo and Smith (2002), have employed variance ratio tests. The low power

WORTHINGTON & HIGGS 4
of unit root tests and the restrictive assumptions of tests for serial dependence are well known,
but even the variance ratio test (as against multiple variance ratio tests) is shown to be inexact
under certain conditions. In addition, nearly all of these studies have specified returns as
weekly or longer. For example, Karemara et al. (1999) employed monthly data, while Los
(2000), Abraham et al. (2002) and Ryoo and Smith (2002) used weekly. An obvious
qualification is the lack of suitable return series in the past, seeing as some random walk tests
have been shown to be imprecise in the presence of infrequent or non-synchronous trading.
Nevertheless, this is still an important omission since it is likely that some violations of the
random walk hypothesis are likely to be obscured at the longer sampling frequencies.
3. DESCRIPTION AND PROPERTIES OF THE DATA
The data employed in the study is composed of market value-weighted equity indices
for twenty-seven emerging markets. Three of these markets are in Africa (EGY – Egypt,
MOR – Morocco, SAF – South Africa), ten in Asia (CHN – China, IND – India, INA –
Indonesia, KOR – Korea, MLY – Malaysia, PAK – Pakistan, PHL – Philippines, SRI – Sri
Lanka, TWN – Taiwan, THA – Thailand), four in Europe (CZH – Czech Republic, HGY –
Hungary, POL – Poland, RUS – Russia), seven in Latin America (ARG – Argentina, BRZ –
Brazil, CHL – Chile, COL – Columbia, MEX – Mexico, PRU – Peru, VEN – Venezuela) and
three in the Middle East (ISR – Israel, JOR – Jordan, TUR – Turkey). All data is obtained
from Morgan Stanley Capital International (MSCI) and specified in US dollar terms. The
series encompass dissimilar sampling periods given the varying availability of each index.
The end date for all series is 28-May-2003 with EGY commencing on 1-Sep-1997, PAK on 1-
Nov-1995, MOR, CZH, HGY and RUS on 2-Jan-1995, SAF, CHN, IND, SRI, POL, COL,
PRU, VEN and ISR on 1-Jan-1998 and the remaining markets on 31-Dec-1987. MSCI indices
are widely employed in the financial literature on the basis of the degree of comparability and
avoidance of dual listing, and are constructed to overcome problems associated with
infrequent trading in markets.
Daily data is specified. By way of comparison, Poshakwale (1996) and Cheung and
Coutts (2001) also used daily returns to test for random walks in emerging markets. The
natural log of the relative price is computed for the daily intervals to produce a time series of
continuously compounded returns, such that 100log 1 ttt ppr , where pt and pt-1
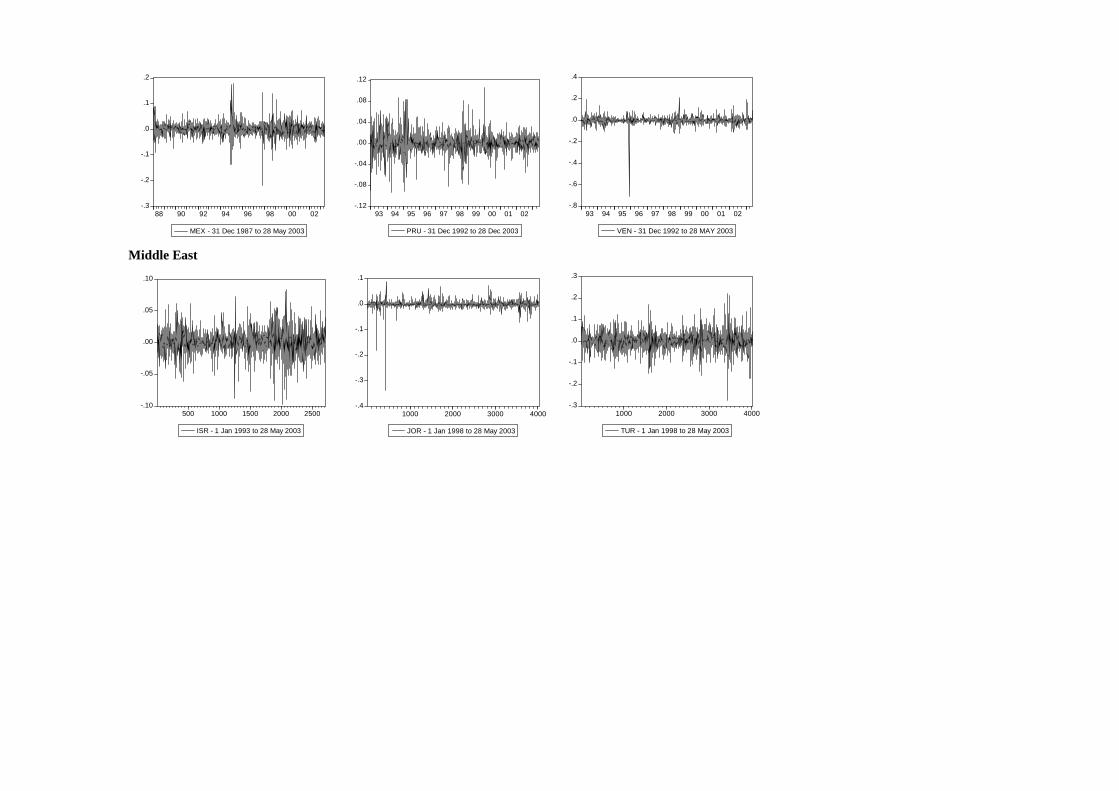
represent the stock index price at time t and t-1, respectively. Figure 1 includes graphs of all
series. Table 1 presents a summary of descriptive statistics of the daily returns for the twenty-

EFFICIENCY IN EMERGING CAPITAL MARKETS 5
seven markets. Sample means, maximums, minimums, standard deviations, skewness,
kurtosis and Jacque-Bera statistics and p-values are reported. The lowest mean returns are in
China (-0.0007), Egypt (-0.0006) and Pakistan (-0.0002) and the highest mean returns are for
Hungary (0.0005), Russia (0.0006) and Mexico (0.0007). The lowest minimum returns are in
Argentina (-0.9270), Venezuela (-0.7124) and Indonesia (-0.4308), and the highest maximum
returns are in Hungary (0.3796), Indonesia (0.4551) and Argentina (0.4559). The standard
deviations of returns range from 0.0077 (Morocco) to 0.0401 (Argentina). On this basis, of
the twenty-seven markets the returns in Morocco, Jordan and Chile are the least volatile, with
Turkey, Russia and Argentina being the most volatile.
<TABLE 1 HERE>
By and large, the distributional properties of all twenty-seven return series appear non-
normal. Given that the sampling distribution of skewness is normal with mean 0 and standard
deviation of T6 where T is the sample size, all of the return series, with the exception of
Taiwan, Mexico and Peru, are significantly skewed. Indonesia, China, Egypt, Columbia,
Korea, Morocco, Thailand, Philippines, Sri Lanka and Hungary are positively skewed,
indicating the greater probability of large increases in returns than falls, while the remaining
markets are negatively skewed, signifying the greater likelihood of large decreases in returns
than rises. The kurtosis, or degree of excess, in all market returns is also large, ranging from
5.0435 for the Czech Republic to 309.6680 for Jordan, thereby indicating leptokurtic
distributions. Given the sampling distribution of kurtosis is normal with mean 0 and standard
deviation of T24 where T is the sample size, then all estimates are once again statistically
significant at any conventional level. Finally, the calculated Jarque-Bera statistics and
corresponding p-values in Table 1 are used to test the null hypotheses that the daily
distribution of market returns is normally distributed. All p-values are smaller than the .01
level of significance suggesting the null hypothesis can be rejected. None of these market
returns are then well approximated by the normal distribution.
4. EMPIRICAL METHODOLOGY
4.1 Random walk hypothesis
Consider the following random walk with drift process:
ttt εpp 1 (1)

WORTHINGTON & HIGGS 6
or
ttt εΔpr (2)
where pt is the logarithm of the index price observed at time t, is an arbitrary drift
parameter, rt is the change in the index and t is a random disturbance term satisfying E(t) = 0
and E(tt-g) = 0, g 0, for all t.
Under the random walk hypothesis, a market is (weak-form) efficient if the most
recent price contains all available information and therefore the best predictor of future prices
is the most current price. In the strictest version of the efficient market hypothesis, t is not
only random and stationary, but exhibits no autocorrelation, since the disturbance term cannot
possess any systematic forecast errors. This provides three complementary testing procedures
for random walks or weak-form market efficiency. To start with, the parametric serial
correlation test of independence and the non-parametric runs test can be used to test for serial
dependence in the series. Alternatively, unit root tests can be used to determine if the series is
difference or trend non-stationary as a necessary condition for a random walk. Finally,
multiple variance ratio procedures can focus attention on the uncorrelated residuals in the
series, under assumptions of both homoskedastic and heteroskedastic random walks.
4.2 Serial dependence tests
Two approaches are employed to test for serial dependence in the returns. First, the serial
correlation coefficient test is a widely employed procedure that tests the relationship between
returns in the current period and those in the previous period. If no significant autocorrelations
are found then the series are assumed to follow a random walk. Second, the runs test
determines whether successive price changes are independent and unlike the serial correlation
test of independence, is non-parametric and does not require returns to be normally
distributed. Observing the number of ‘runs’ - or the sequence of successive price changes with
the same sign - in a sequence of price changes tests the null hypothesis of randomness. In the
approach selected, each return is classified according to its position with respect to the mean
return. That is, a positive change is when the return is greater than the mean, a negative
change when the return is less than the mean, and zero change when the return equals the
mean.
To perform this test A is assigned to each return that equals or exceeds the mean value
and B for the items that are below the mean. Let nA and nB be the sample sizes of items A and
B respectively. The test statistic is U, the total number of runs. For large sample sizes, that is

EFFICIENCY IN EMERGING CAPITAL MARKETS 7
where both nA and nB are greater than twenty, the test statistic is approximately normally
distributed:
U
U
σ
μUZ
(3)
BABABA
UBA nnn
nn
nnnnnσ
n
nnμ
and )1(
)2(2 ,1
2 where
2U
4.3 Unit root tests
Three different unit root tests are used to test the null hypothesis of a unit root or random
walk: namely, the Augmented Dickey-Fuller (ADF) test, the Phillips-Peron (PP) test, and the
Kwiatkowski, Phillips, Schmidt and Shin (KPSS) test. To start with, the well-known ADF
unit root test of the null hypothesis of nonstationarity or random walk is conducted in the
form of the following regression equation:
(4)
q
iitiitiitit pptp
11010
where denotes the logarithm of the price for the i-th market at time t, ,
are coefficients to be estimated, q is the number of lagged terms, t is the trend term, 1 is the
estimated coefficient for the trend, 0 is the constant, and is white noise. MacKinnon’s
critical values are used in order to determine the significance of the test statistic associated
with 0. The PP incorporates an alternative (nonparametric) method of controlling for serial
correlation when testing for a unit root by estimating the non-augmented Dickey-Fuller test
equation and modifying the test statistic so that its asymptotic distribution is unaffected by
serial correlation. Finally, the KPSS test differs from these other unit root tests in that the
series is assumed to be stationary under the null.
itp 1 ititit ppp
Of course, it is well known that ADF unit root tests fail to reject the null hypothesis of
a unit root for many time series, and that allowing for error autocorrelation using the PP test
does not necessarily improve these results. However, the KPSS test complements the standard
unit root tests since it can distinguish between the logarithm of the prices that appear to be
stationary, those that appear to have a unit root, and those that are not sufficiently informative
to be sure whether they are either.
4.4 Multiple variance ratio tests
The multiple variance ratio (MVR) test as proposed by Chow and Denning (1993) is used to
detect autocorrelation and heteroskedasticity in the returns. Based on Lo and MacKinlay’s
(1988) earlier single variance ratio (VR) test, Chow and Denning (1993) adjusts the focus of

WORTHINGTON & HIGGS 8
the tests from the individual variance ratio for a specific interval to one more consistent with
the random walk hypothesis by covering all possible intervals. As shown by Lo and
MacKinlay (1988), the variance ratio statistic is derived from the assumption of linear
relations in observation interval regarding the variance of increments. If a series follows a
random walk process, the variance of a qth-differenced variable is q times as large as the first-
differenced variable. For a series partitioned into equally spaced intervals and characterised
by random walks, one qth of the variance of (pt - pt-q) is expected to be the same as the
variance of (pt – pt-1):
)()( 1 ttqtt ppqVarppVar (5)
where q is any positive integer. The variance ratio is then denoted by:
)1(
)(
)(
)(1
)(2
2
1 q
ppVar
ppVarq
qVRtt
qtt
(6)
such that under the null hypothesis VR(q) = 1. For a sample size of nq + 1 observations (p0, p1,
…, pnq), Lo and Mackinlay’s (1988) unbiased estimates of 2(1) and 2(q) are
computationally denoted by:
)1(
)ˆ()1(ˆ 1
21
2
nq
ppnq
kkk
(7)
and
h
qpp
q
nq
qkqkk
2
2
)ˆ(
)(ˆ
(8)
)( ofmean sampleˆwhere 1 tt pp and:
)1)(1(nq
qqnqqh (9)
Lo and Mackinlay (1988) produce two test statistics, Z(q) and Z*(q), under the null hypothesis
of homoskedastic increments random walk and heteoskedastic increments random walk
respectively. If the null hypothesis is true, the associated test statistic has an asymptotic
standard normal distribution. With a sample size of nq + 1 observations (p0, p1, …,pnq) and
under the null hypothesis of homoskedastic increments random walk, the standard normal test
statistic Z(q) is:
)(ˆ1)(ˆ
)(0 qσ
qRVqZ
(10)

EFFICIENCY IN EMERGING CAPITAL MARKETS 9
where
2/1
0 )(3
)1)(12(2)(ˆ
nqq
qqqσ (11)
The test statistic for a heteroskedastic increments random walk, Z*(q) is:
)(ˆ1)(ˆ
)(*
qσ
qRVqZ
e
(12)
where
2/11
1
2
ˆ14)(ˆ
q
kke δ
q
kqσ (13)
and
2
1
21
)1(
21
21
)ˆ(
)ˆ()ˆ(ˆ
nq
jjj
nq
kjkjkjjj
k
μpp
μppμpp
δ (14)
Lo and MacKinlay’s (1988) procedure is devised to test individual variance ratios for a
specific aggregation interval, q, but the random walk hypothesis requires that VR(q) = 1 for all
q. Chow and Denning’s (1993) multiple variance ratio (MVR) test generates a procedure for
the multiple comparison of the set of variance ratio estimates with unity. For a single variance
ratio test, under the null hypothesis, VR(q) = 1, hence Mr(q) = VR(q) – 1 = 0. Consider a set of
m variance ratio tests {Mr(qi)i = 1,2,…,m}. Under the random walk null hypothesis, there
are multiple sub-hypotheses:
Hoi: Mr(qi) = 0 for i = 1,2,…,m
H1i: Mr(qi) 0 for any i = 1,2,…,m (15)
The rejection of any one or more Hoi rejects the random walk null hypothesis. For a set of test
statistics, say Z(q), {Z(qi)i = 1,2,…,m}, the random walk null hypothesis is rejected if any
one of the estimated variance ratio is significantly different from one. Hence only the
maximum absolute value in the set of test statistics is considered. The core of the Chow and
Denning’s (1993) MVR test is based on the result:
1)};;()(,...,)({max 1 TmSMMqZqZPR m (16)
where SMM(;m;T) is the upper point of the Standardized Maximum Modulus (SMM)
distribution with parameters m (number of variance ratios) and T (sample size) degrees of
freedom. Asymptotically when T approaches infinity:

WORTHINGTON & HIGGS 10
2/*);;(lim
ZmSMMT
(17)
mZ /1*
2/)1(1 andon distributi normal standard where *
. Chow and Denning control
the size of the MVR test by comparing the calculated values of the standardized test statistics,
either Z(q) or Z*(q) with the SMM critical values. If the maximum absolute value of, say Z(q)
is greater than the SMM critical value than the random walk hypothesis is rejected.
Importantly, the rejection of the random walk under homoskedasticity could result
from either heteroskedasticity and/or autocorrelation in the equity price series. If the
heteroskedastic random walk is rejected then there is evidence of autocorrelation in the equity
series. With the presence of autocorrelation in the price series, the first order autocorrelation
coefficient can be estimated using the result that is asymptotically equal to a weighted
sum of autocorrelation coefficient estimates with weights declining arithmetically:
)(ˆ qM r
1
1
)(ˆ12)(ˆq
kr k
q
kqM (18)
2q where :
)1(ˆ1)2(ˆ)2(ˆ RVM r (19)
5. EMPIRICAL RESULTS
Table 2 provides two sets of test statistics. The first set includes the statistics and p-
values for the tests of serial independence, namely, the parametric serial correlation
coefficient and the nonparametric one sample runs test. The null hypothesis in the former is
for no serial correlation while in the latter it is the random distribution of returns. The second
set of tests is unit root tests and comprises the ADF tests (pure random walk) and PP t-
statistics and p-values and the KPSS LM-statistic and asymptotic significance. In the case of
the former the null hypothesis of a unit root (random walk) is tested against the alternative of
no unit root. For the latter, the null hypothesis of no unit root is tested against the alternative
of a unit root (random walk).
<TABLE 2 HERE>
Turning first to the tests of independence, all of the null hypotheses of no serial
correlation for the twenty-seven emerging markets are rejected at the .10 level or lower, with
the exception of Egypt and Jordan. The null hypothesis of no serial correlation is rejected at
the .10 level for Israel and the .05 level for Hungary and Argentina and at the .01 level

EFFICIENCY IN EMERGING CAPITAL MARKETS 11
elsewhere. The significance of the autocorrelation coefficient indicates that the null
hypothesis of weak-form market efficiency may be rejected and we may infer that twenty-five
of the markets are weak-form inefficient over the various sample periods.
With the exception of Argentina, all of the significant coefficients are positive
indicating persistence in returns, with persistence being higher in Columbia (0.3390), Sri
Lanka (0.2640) and Chile (0.2270) and lower in Israel (0.0290), Hungary (0.0420) and
Taiwan (0.0600). The average persistence is 0.1374 in these emerging markets. For Argentina
the serial correlation coefficient of -0.0310 is indicative of a mean reversion process.
However, it should be noted that over shorter horizons the markets exhibiting persistence
(mean-reversion) could also exhibit mean-reversion (persistence). In terms of the runs tests,
the negative z-values for all of the markets indicates that the actual number of runs falls short
of the expected number of runs under the null hypothesis of return independence at the .01
level or lower for all markets, except Egypt. These likewise indicate positive serial
correlation. We then also reject the null hypothesis of weak-form efficiency when employing
the nonparametric assumptions entailed in runs tests. By way of comparison, Karemera et al.
(1999) used monthly data and runs tests to conclude that only the Philippines, Singapore,
Taiwan and Thailand were not weak-form efficient from an international investor’s
perspective (when measured in US dollars) while Korea, Indonesia, Malaysia and Thailand
were weak-form efficient on this basis. Poshakwale (1996) also rejected the null hypothesis of
weak form efficiency using runs tests, though only for the Indian market.
The unit root tests in Table 2 are supportive of the hypothesis that most of these
emerging equity markets are weak-form efficient. The ADF and PP t-statistics fail to reject
the null hypotheses of a unit root at the .01 level or lower, thereby indicating that all of the
return series examined are non-stationary (weak form efficient) with the exception of Mexico,
Poland and Taiwan. For the KPSS tests of the null hypothesis of no unit root, the LM-statistic
exceeds the asymptotic critical value at the .01 level for all emerging markets with the
exception of Czech Republic, Poland and Taiwan. As a necessary condition for a random
walk, the ADF and PP unit root tests fail to reject the requisite null hypothesis in the case of
all twenty-four emerging markets except Mexico, Poland and Taiwan, while the KPSS unit
root tests reject the required null in twenty-four emerging markets, with the exception of the
Czech Republic, Poland and Taiwan. From the three unit root tests, the results indicate that a
majority of emerging markets are weak-form efficient. However, since it is well know that
unit root tests have very poor power properties, a preferred alternative is to use multiple
variance ratio tests.

WORTHINGTON & HIGGS 12
Table 3 presents the results of the multiple variance ratio tests of returns in the twenty-
seven emerging equity markets. The sampling intervals for all markets are 2, 5, 10 and 20
days, corresponding to one-day, one week, one fortnight and one month calendar periods. For
each interval Table 3 presents the estimates of the variance ratio VR(q) and the test statistics
for the null hypotheses of homoskedastic, Z(q) and heteroskedastic, Z*(q) increments random
walk. Under the multiple variance ratio procedure, only the maximum absolute values of the
test statistics are examined. For sample sizes exceeding at least 1,498 observations (Egypt)
and where m = 4, the critical value for these test statistics is 2.49 at the .05 level of
significance. For each set of multiple variance ratio tests, an asterisk denotes the maximum
absolute value of the test statistic that exceeds this critical value and thereby indicates whether
the null hypothesis of a random walk is rejected.
<TABLE 3 HERE>
Consider the results for India. The null hypothesis that daily equity returns follow a
homoskedastic random walk is rejected at Z(2) = 7.0171. Rejection of the null hypothesis of a
random walk under homoskedasticity for a 2-day period is also a test of the null hypothesis of
a homoskedastic random walk under the alternative sampling periods and we may therefore
conclude that Indian equity returns do not follow a random walk. However, rejection of the
null hypothesis under homoskedasticity could result from heteroskedasticity and/or
autocorrelation in the return series. After a heteroskedastic-consistent statistic is calculated,
the null hypothesis is also rejected at Z*(2) = 5.2580. The heteroskedastic random walk
hypothesis is thus rejected because of autocorrelation in the daily increments of the returns on
Indian equity. We may conclude that the Indian equity market is not weak form efficient.
Further, Lo and MacKinlay (1988) show that for q=2, estimates of the variance ratio
minus one and the first-order autocorrelation coefficient estimator of daily price changes are
asymptotically equal [India’s serial correlation coefficient in Table 2 is 0.1340]. On this basis,
the estimated first order autocorrelation coefficient is 0.1347 corresponding to the estimated
variance ratio of 1.1347 (i.e. 1.1347 - 1.0000). Further, persistence is suggested
where , whereas when a mean reverting process is indicated. This
indicates there is positive autocorrelation (or persistence) in Indian equity returns over the
long horizon.
)2(R̂V
1)2(ˆ RV 1)2(ˆ RV
By way of comparison, observe the results for Hungary. At none of the sampling
intervals are the test statistics for the null hypotheses of homoskedastic, Z(q) and

EFFICIENCY IN EMERGING CAPITAL MARKETS 13
heteroskedastic, Z*(q) random walks greater than the critical value of 2.49. This suggests that
the Hungarian equity market is weak-form efficient. Alternatively, in the case of Egypt the
null hypotheses of a homoskedastic random walk is rejected [Z(q)=2.6916], but the null
hypothesis of heteroskedastic random walk is not [Z*(q)=1.9862]. This indicates that rejection
of the null hypothesis of a homoskedastic random walk could be the result, at least in part, of
heteroskedasticity in the returns, and cannot be assigned exclusively to the autocorrelation in
returns. This is especially important in the case of Egypt since the serial correlation and runs
tests were both suggestive that returns in that market followed a random walk. In fact, it is
likely that the apparent random walk was partly a product of heteroskedasticity in daily
returns, and not the absence of autocorrelation.
Of the twenty-seven emerging markets, the multiple variance ratios testing procedure
rejects the null hypothesis of a random walk under assumptions of both homoskedasticity and
heteroskedasticity for all with the exception of Egypt, Korea, Malaysia, Hungary, Argentina,
Israel and Jordan. We may then conclude that none of the former is weak-form efficient. With
Egypt, Korea, Malaysia and Argentina the null hypothesis of a homoskedastic random walk is
rejected, but not that for a heteroskedastic random walk. This infers that the random walk
violation could be the result of heteroskedasticity and autocorrelation in daily returns. On this
basis, there is strong evidence that Israel, Jordan and Hungary are weak-form efficient, while
Egypt, Korea, Malaysia and Argentine have weaker evidence of weak-form efficiency.
Nevertheless, the multiple variance ratio technique indicates the presence of positive
autocorrelation (or persistence) in all these markets (except Argentina where negative
autocorrelation or mean reversion is indicated) and thereby provides comparable evidence to
the results of the serial correlation coefficients and runs tests. A summary of random walk test
results is presented in Table 4.
<TABLE 4 HERE>
As noted, few studies exist by which a direct comparison of results can be made,
primarily because most specified monthly, rather than daily, returns. In Asia, Karemera et al.
(1999) concluded that domestic investors would perceive Indonesia, Korea, Malaysia,
Philippines, Taiwan and Thailand as following a random walk under Chow and Denning’s
(1993) multiple variance ratio procedure, with Korea, Malaysia and Taiwan following a
random walk under Lo and MacKinlay’s (1988) earlier single variance ratio approach. More
recently, Ryoo and Smith (2002) found that as price limits were removed for individual
securities, the Korean market progressively approached a random walk, while Lee et al.

WORTHINGTON & HIGGS 14
(2001) concluded that random walks could be rejected in all of China’s stock exchanges on
the basis of variance ratio tests.
A similar situation exists in previous work covering European emerging equity
markets. Rockinger and Urga (2000: 471) used daily data and GARCH analysis to also
conclude that of the markets considered (Czech Republic, Hungary, Poland and Russia) only
“…the Hungarian market is nonpredictable over the entire sample and, therefore, satisfies our
criteria for weak efficiency. This result is in line with the fact that this market has existed for
10 years longer than the other markets and is strongly regulated”. Hajek (2002: 377) likewise
found in a study of the Czech market that “results from serial correlation, Box-Pierce and
Variance Ratio tests provide evidence that a random walk hypothesis cannot be validated with
respect to the daily returns. The weak-form of efficiency on the Czech equity markets was
thus not proved”.
Finally, the results strongly contradict earlier evidence on market efficiency in Latin
American emerging markets. Urrutia (1995) and Ojah and Karemera (1999), for instance,
concluded that Argentina, Brazil, and Chile were weak-form efficient, though Urrutia (1995)
and Karemera et al. (1999) surmised that Mexico was weak-form inefficient. They do,
however, substantiate Haque et al. (2001) conclusion that all of these markets are not weak-
form efficient on the basis of testing the earlier Lo and MacKinlay (1988) single variance
ratio procedure using weekly returns.
6. CONCLUSION AND POLICY OUTCOMES
Financial development is an important determinant of an economy’s ability to grow
and develop over time. At the various national levels, the many types of financial regulatory
reforms pursued and the different financial frameworks established come together, however
the ability of these differently deregulated and liberalised markets to perform their role
ultimately depends upon the level of market efficiency. In this manner, a quantitative
knowledge of market efficiency allows the past progress in financial development to be
assayed, and gives direction on suitable national benchmarks for policymakers and others in
the future.
This paper examines the weak-form market efficiency of twenty-seven emerging
equity markets. Three different procedures are employed to test for random walks in daily
returns: (i) the parametric serial correlation coefficient and the nonparametric runs test are
used to test for serial correlation; (ii) Augmented Dickey-Fuller, Phillips-Perron and

EFFICIENCY IN EMERGING CAPITAL MARKETS 15
Kwiatkowski, Phillips, Schmidt and Shin unit root tests are used to test for non-stationarity as
a necessary condition for a random walk; and (iii) multiple variance test statistics are used to
test for random walks under varying distributional assumptions. The results for the tests of
serial correlation are in broad agreement, categorically rejecting the presence of random walks
in daily returns in most markets, with the exception of Egypt and Jordan, while the runs tests
produce similar results, with the exception of Egypt. Contrary to the serial correlation and
runs tests, the unit root tests conclude that unit roots, as necessary conditions for a random
walk (weak-form market efficiency), are present in all, or nearly all, of the log of the price
series, with the exception of Mexico, Poland and Taiwan for the ADF and PP tests and the
Czech Republic, Poland and Taiwan for the KPSS test. Finally, the multiple variance ratio
procedure conclusively rejects the presence of random walks in most emerging markets. Only
Hungary, Jordan and Israel satisfy the most stringent random walk criteria with Egypt, Korea,
Malaysia and Argentina meeting at most some of the requirements of a random walk.
The results of this analysis are consistent with the generalisation that emerging
markets are unlikely to be associated with the random walks required for the assumption of
weak-form market efficiency. This says that much progress is still needed in terms of
financial development. Furthermore, the results offer contradictory evidence to earlier work
using a variety of tests for random walks, of which the most likely contributory factor in those
instances is the use of weekly and monthly sampling frequencies, rather than any variation in
testing procedure.
The policy outcomes of this analysis are less certain. This is because while market
efficiency has been measured, no attempt has been made to link this with market breadth,
depth and liquidity or with the underlying pace of deregulation and liberalisation. However,
depending upon the test employed, some markets are obviously more efficient than others and
this provides useful benchmarks, both regionally and globally. Such benchmarks include
Hungary in Europe, Egypt in Africa, Argentina in Latin America, Israel and Jordan in the
Middle East and Malaysia and Korea in Asia. Closer examination of the developments in
these markets is then warranted. One common feature is their relatively long tenure when
compared to other emerging markets. This suggests that institutional maturity is an important
determinant of market efficiency. These markets are also generally larger and this could also
be linked with their efficiency.
There are, of course, a number of ways in which this research could be extended. One
possible extension would be to use the multiple variance ratio test procedure in conjunctions
with intraday data. While Ronen (1997) and Andersen et al. (2001) have shown that the single

WORTHINGTON & HIGGS 16
variance ratio test is not robust and can be misleading in a high-frequency context, no such
evidence concerns the more developed multiple variance ratio test. A second extension would
be to examine more fully the relationship between the evolving characteristics of emerging
stock markets and market efficiency. It is generally known that weak-form inefficiency is
linked with the newer, small capitalisation markets with low levels of liquidity and turnover
but little is known about how quickly markets approach a random walk as they become more
liquid and institutionally mature. Stock level data may be able to throw some light on this
question with the contrast between large and small capitalisation stocks, as would the
decomposition of the data used in this analysis into shorter periods.
REFERENCES
Abraham, A., F.J. Seyyed, and S.A. Alsakran (2002), “Testing the random walk behaviour and efficiency of the Gulf stock markets,” The Financial Review, Vol. 37, 469-480.
Andersen, T.G., T. Bollerslev, and A. Das (2001), “Variance ratio statistics and high-frequency data: Testing for changes in intraday volatility patterns,” Journal of Finance, Vol. 56, 305-327.
Appiah-Kusi, J. and K. Menyah (2003), “Return predictability in African stock markets,” Review of Financial Economics, Vol. 12. 247-271.
Ayadi, O.F. and C.S. Pyun (1994), “An application of variance ratio test to the Korean securities market,” Journal of Banking and Finance, Vol. 18, 643-658.
Buguk, C. and B.W. Brorsen (2003), “Testing weak-form market efficiency: Evidence from the Istanbul stock exchange,” International Review of Financial Analysis (in press).
Campbell, J.Y., A.W. Lo, and A.C. MacKinlay (1997), The Econometrics of Financial Markets, Princeton, Princeton University Press.
Cheung, K.C. and J.A. Coutts (2001), “A note on weak form market efficiency in security prices: Evidence from the Hong Kong stock exchange,” Applied Economics Letters, Vol. 8, 407-410.
Chow. K.V. and K. Denning (1993), “A simple multiple variance ratio test,” Journal of Econometrics, Vol. 58, 385-401.
Dezelan, S. (2000), “Efficiency of the Slovenian equity market,” Economic and Business Review, Vol. 2, 61-83.
Fama, E. (1970), “Efficiency markets: A review of theory and empirical work,” Journal of Finance, Vol. 25, 1181-1185.
Fama, E. (1991), “Efficient capital markets II,” Journal of Finance, Vol. 46, 1575-1617. Grieb, T. and M.G. Reyes (1999), “Random walk tests for Latin American equity indexes and
individual firms,” Journal of Financial Research, Vol. 22, 371-383. Groenewold, N. and M. Ariff (1998), “The effects of de-regulation on share market efficiency
in the Asia-Pacific,” International Economic Journal, Vol.12, 23-47. Groenewold, N. and K.C. Kang (1993), “The semi-strong efficiency of the Australian share
market,” Economic Record, Vol. 69, 405-410. Hajek, J. (2002), “Weak-form efficiency in the Czech equity market,” Politicka Ekonomie,
Vol. 50, 377-389. Haque, M., M.K. Hassan, and O. Varela (2001), “Stability, volatility, risk premiums and
predictability in Latin American emerging stock markets,” Quarterly Journal of Business and Economics, Vol. 40, 23-44.

EFFICIENCY IN EMERGING CAPITAL MARKETS 17
Huang, B.N. (1995), “Do Asian stock markets follow random walks? Evidence from the variance ratio test,” Applied Financial Economics, Vol. 5, 251-256.
Karemera, D., K. Ojah, and J.A. Cole (1999), “Random walks and market efficiency tests: Evidence from emerging equity markets,” Review of Quantitative Finance and Accounting, Vol.13, 171-188.
Kawatsu, H. and M.R. Morey (1999), “An empirical examination of financial liberalization and the efficiency of emerging market stock prices,” Journal of Financial Research, Vol. 22, 385-411.
Lee, C.F., G.M. Chen, and O.M. Rui (2001), “Stock returns and volatility on China’s stock markets,” Journal of Financial Research, Vol. 24, 523-543.
Lian, K.K. and G.K. Leng (1994), “Weak-form efficiency and mean reversion in the Malaysian stock market,” Asia-Pacific Development Journal, Vol. 1, 137-152.
Lo, A. and A.C. MacKinlay (1988), “Stock market prices do not follow random walks: Evidence from a simple specification test,” Review of Financial Studies, Vol. 1, 41-66.
Los, C.A. (2000), “Nonparametric efficiency testing of Asian stock markets using weekly data,” chapter in Advances in Econometrics Vol. 14, Stanford, Conn.: JAI Press.
Ojah, K. and D. Karemera (1999), “Random walks and market efficiency tests of Latin American Emerging equity markets: A revisit,” The Financial Review, Vol. 34, 57-72.
Poon, S.H. (1996), “Persistence and mean reversion in UK stock returns,” European Financial Management, Vol. 2, 169-196.
Poshakwale, S. (1996), “Evidence on weak form efficiency and day-of-the-week effect in the Indian stock market,” Finance India, Vol. 10, 605-616.
Regúlez, M. and A. Zarraga (2002), “Common features between stock returns and trading volume,” Applied Financial Economics, Vol.12, 885-893.
Rockinger, M. and G. Urga (2000), “The evolution of stock markets in transition economies,” Journal of Comparative Economics, Vol. 28, 456-472.
Ronen, T. (1997), “Tests and properties of variance ratios in microstructure studies,” Journal of Financial and Quantitative Analysis, Vol. 32, 183-204.
Ryoo, H.J. and G. Smith (2002), “Korean stock prices under price limits: Variance ratio tests of random walks,” Applied Financial Economics, Vol.12, 545-553.
Smith, G., K. Jefferis, and H.J. Ryoo (2002), “African stock markets: multiple variance ratio tests of random walks,” Applied Financial Economics, Vol. 12, 475-484.
Urrutia, J.L. (1995), “Tests of random walk and market efficiency for Latin American emerging markets,” Journal of Financial Research, Vol.18, 299-309.
Zychowicz, E.J., M. Binbasioglu, and N. Kazancioglu (1995), “The behaviour of prices on the Istanbul stock exchange,” Journal of International Financial Markets, Institutions and Money, Vol. 5, 61-71.
Mailing Addresses: Professor A.C. Worthington, School of Accounting and Finance, University of Wollongong, Wollongong NSW 2522, Australia. Email. [email protected]
Ms. H. Higgs, School of Economics and Finance, Queensland University of Technology, GPO Box 2434, Brisbane QLD 4001, Australia. Email. [email protected]

Table 1. Descriptive Statistics for Emerging Capital Markets
Market Start End Observations Mean Maximum Minimum Std. Dev. Skewness Kurtosis Jarque-Bera JB p-value EGY 01-Sep-1997 28-May-2003 1498 -6.43E-04 0.0929 -0.0900 0.0163 0.1948 6.9287 9.73E+02 0.0000 MOR 02-Jan-1995 28-May-2003 2192 1.74E-04 0.0625 -0.0482 0.0077 0.3841 9.1153 3.47E+03 0.0000
Afr
ica
SAF 01-Jan-1993 28-May-2003 2714 1.53E-04 0.1126 -0.1302 0.0155 -0.3884 9.8804 5.42E+03 0.0000 CHN 31-Dec-1992 28-May-2003 2714 -6.92E-04 0.1274 -0.1444 0.0206 0.1499 7.8377 2.66E+03 0.0000 IND 31-Dec-1992 28-May-2003 2714 -5.51E-05 0.0886 -0.0896 0.0160 -0.1047 5.9132 9.65E+02 0.0000 INA 31-Dec-1987 28-May-2003 4019 4.63E-05 0.4451 -0.4308 0.0287 0.1186 46.3110 3.14E+05 0.0000 KOR 31-Dec-1987 28-May-2003 4019 4.10E-05 0.2688 -0.2167 0.0238 0.3767 15.3820 2.58E+04 0.0000 MLY 31-Dec-1987 28-May-2003 4019 1.19E-04 0.2585 -0.3697 0.0196 -0.7903 60.5769 5.56E+05 0.0000 PAK 1-Nov-1995 28-May-2003 1975 -1.82E-04 0.1421 -0.1573 0.0218 -0.4492 9.3993 3.44E+03 0.0000 PHL 31-Dec-1987 28-May-2003 4019 -4.53E-05 0.2197 -0.1094 0.0174 0.7072 15.8291 2.79E+04 0.0000 SRI 31-Dec-1992 28-May-2003 2714 -1.34E-04 0.2758 -0.1014 0.0149 2.5955 50.4735 2.58E+05 0.0000 TWN 31-Dec-1987 28-May-2003 4019 1.14E-04 0.1265 -0.1113 0.0213 0.0214 5.3354 9.14E+02 0.0000
Asi
a
THA 31-Dec-1987 28-May-2003 4019 -2.61E-05 0.1810 -0.1444 0.0216 0.6936 12.3500 1.50E+04 0.0000 CZH 30-Dec-1994 28-May-2003 2193 1.60E-04 0.0676 -0.0739 0.0155 -0.1012 5.0435 3.85E+02 0.0000 HGY 30-Dec-1994 28-May-2003 2193 5.28E-04 0.3796 -0.2580 0.0218 2.6035 71.5944 4.32E+05 0.0000 POL 31-Dec-1992 28-May-2003 2714 4.82E-04 0.1253 -0.1159 0.0242 -0.1407 6.7288 1.58E+03 0.0000 E
urop
e
RUS 2-Jan-1995 28-May-2003 2193 5.80E-04 0.2422 -0.3101 0.0360 -0.3899 11.3524 6.43E+03 0.0000 ARG 31-Dec-1987 28-May-2003 4019 4.52E-04 0.4559 -0.9270 0.0401 -2.8730 95.1709 1.43E+06 0.0000 BRZ 31-Dec-1987 28-May-2003 4019 3.98E-04 0.2123 -0.2635 0.0288 -0.4078 10.6391 9.88E+03 0.0000 CHL 31-Dec-1987 28-May-2003 4019 4.19E-04 0.0870 -0.1623 0.0127 -0.4897 14.1018 2.08E+04 0.0000 COL 31-Dec-1992 28-May-2003 2714 -8.87E-05 0.1329 -0.0735 0.0132 0.3010 11.0072 7.29E+03 0.0000 MEX 31-Dec-1987 28-May-2003 4019 6.87E-04 0.1784 -0.2176 0.0196 -0.0669 15.4183 2.58E+04 0.0000 PRU 31-Dec-1992 28-May-2003 2714 2.69E-04 0.1065 -0.0930 0.0160 0.0579 9.0184 4.10E+03 0.0000
Lat
in
A
mer
ica
VEN 31-Dec-1992 28-May-2003 2714 8.45E-06 0.2137 -0.7124 0.0284 -5.3078 153.7496 2.58E+06 0.0000 ISR 01-Jan-1993 28-May-2003 2714 6.75E-05 0.0828 -0.0979 0.0165 -0.2436 6.7389 1.61E+03 0.0000 JOR 01-Jan-1998 28-May-2003 4019 -4.79E-05 0.0890 -0.3391 0.0104 -9.4699 309.6680 1.58E+07 0.0000
Mid
dle
Eas
t
TUR 01-Jan-1998 28-May-2003 4019 5.65E-05 0.2201 -0.2742 0.0340 -0.1229 7.7714 3.82E+03 0.0000 Notes: Africa: EGY – Egypt, MOR – Morocco, SAF – South Africa; Asia: CHN – China, IND – India, INA – Indonesia, KOR – Korea, MLY – Malaysia, PAK – Pakistan, PHL – Philippines, SRI – Sri Lanka, TWN – Taiwan, THA – Thailand; Europe: CZH – Czech Republic, HGY – Hungary, POL – Poland, RUS – Russia; Latin America: ARG – Argentina, BRZ – Brazil, CHL – Chile, COL – Columbia, MEX – Mexico, PRU – Peru, VEN – Venezuela; Middle East: ISR – Israel, JOR – Jordan, TUR – Turkey. JB – Jarque-Bera. Critical values for significance of skewness and kurtosis respectively at the .05 level are 0.1240 and 0.2481 (EGY), 0.1080 and 0.2161 (PAK), 0.1025 and 0.2051 (MOR, CZH, HGY, RUS), 0.0922 and 0.1843 (SAF, CHN, IND, SRI, POL, COL, PRU, VEN, ISR), 0.0757 and 0.1515 (INA, KOR, MLY, PHL, TWN, THA, ARG, BRZ, CHL, MEX, JOR, TUR).

Figure 1. Daily Returns for Emerging Capital Markets Africa
-.10
-.05
.00
.05
.10
250 500 750 1000 1250
EGY - 1 Sep 1997 to 28 May 2003
-.06
-.04
-.02
.00
.02
.04
.06
.08
95 96 97 98 99 00 01 02
MOR - 2 Jan 1995 to 28 May 2003
-.15
-.10
-.05
.00
.05
.10
.15
500 1000 1500 2000 2500
SAF - 1 Jan 1993 to 28 May 2003
Asia
-.15
-.10
-.05
.00
.05
.10
.15
93 94 95 96 97 98 99 00 01 02
CHN - 31 Dec 1992 to 28 May 2003
-.10
-.05
.00
.05
.10
93 94 95 96 97 98 99 00 01 02
IND - 31 Dec 1992 to 28 May 2003
-.6
-.4
-.2
.0
.2
.4
.6
88 90 92 94 96 98 00 02
INA - 31 Dec 1987 to 28 May 2003
-.3
-.2
-.1
.0
.1
.2
.3
88 90 92 94 96 98 00 02
KOR - 31 Dec 1987 to 28 May 2003
-.4
-.3
-.2
-.1
.0
.1
.2
.3
88 90 92 94 96 98 00 02
MLY - 31 Dec 1987 to 28 May 2003
-.16
-.12
-.08
-.04
.00
.04
.08
.12
.16
1996 1997 1998 1999 2000 2001 2002
PAK - 1 Nov 1995 to 28 May 2003
-.12
-.08
-.04
.00
.04
.08
.12
.16
.20
.24
88 90 92 94 96 98 00 02
PHL - 31 Dec 1987 to 28 May 2003
-.2
-.1
.0
.1
.2
.3
93 94 95 96 97 98 99 00 01 02
SRI - 31 Dec1992 to 28 May 2003

-.15
-.10
-.05
.00
.05
.10
.15
88 90 92 94 96 98 00 02
TWN - 31 Dec 1987 to 28 may 2003
-.15
-.10
-.05
.00
.05
.10
.15
.20
88 90 92 94 96 98 00 02
THA - 31 Dec 1987 to 28 May 2003
Europe
-.08
-.06
-.04
-.02
.00
.02
.04
.06
.08
95 96 97 98 99 00 01 02
CZH - 30 Dec 1994 to 28 May 2003
-.3
-.2
-.1
.0
.1
.2
.3
.4
95 96 97 98 99 00 01 02
HGY - 20 Dec 1994 to 28 May 2003
-.15
-.10
-.05
.00
.05
.10
.15
93 94 95 96 97 98 99 00 01 02
POL - 31 Dec 1992 to 28 May 2003
-.4
-.3
-.2
-.1
.0
.1
.2
.3
95 96 97 98 99 00 01 02
RUS - 2 Jan 1995 to 28 May 2003
Latin America
-1.0
-0.8
-0.6
-0.4
-0.2
0.0
0.2
0.4
0.6
88 90 92 94 96 98 00 02
ARG - 31 Dec 1987 to 28 May 2003
-.3
-.2
-.1
.0
.1
.2
.3
88 90 92 94 96 98 00 02
BRZ - 31 Dec 1987 to 28 May 2003
-.20
-.15
-.10
-.05
.00
.05
.10
88 90 92 94 96 98 00 02
CHL - 31 Dec 1987 to 28 May 2003
-.08
-.04
.00
.04
.08
.12
.16
93 94 95 96 97 98 99 00 01 02
COL - 31 Dec 1992 to 28 May 2003
-.3
-.2
-.1
.0
.1
.2
88 90 92 94 96 98 00 02
MEX - 31 Dec 1987 to 28 May 2003
-.12
-.08
-.04
.00
.04
.08
.12
93 94 95 96 97 98 99 00 01 02
PRU - 31 Dec 1992 to 28 Dec 2003
-.8
-.6
-.4
-.2
.0
.2
.4
93 94 95 96 97 98 99 00 01 02
VEN - 31 Dec 1992 to 28 MAY 2003
Middle East
-.10
-.05
.00
.05
.10
500 1000 1500 2000 2500
ISR - 1 Jan 1993 to 28 May 2003
-.4
-.3
-.2
-.1
.0
.1
1000 2000 3000 4000
JOR - 1 Jan 1998 to 28 May 2003
-.3
-.2
-.1
.0
.1
.2
.3
1000 2000 3000 4000
TUR - 1 Jan 1998 to 28 May 2003

Table 2. Independence and Unit Root Tests for Emerging Capital Markets
Serial correlation Runs test Unit root tests
Market Coefficient p-value Mean Cases < mean
Cases ≥ mean
Total cases
Number of runs
Runs Z-value
p-value ADF
t-statisticADF
p-value PP
t-statisticPP
p-value KPSS LM-
statistic KPSS
significance EGY 0.0210 0.2083 -6.43E-04 631 867 1498 704 -1.4529 0.1462 -0.9003 0.7886 -0.9066 0.7866 3.6860 0.0100 MOR 0.1410 0.0000 1.74E-04 1127 1066 2193 1023 -3.1487 0.0016 -1.6989 0.4317 -1.6817 0.4405 1.4754 0.0100
Afr
ica
SAF 0.0900 0.0000 1.63E-04 1357 1357 2714 1235 -4.7229 0.0000 -2.5872 0.0957 -2.5750 0.0983 1.5328 0.0100 CHN 0.1800 0.0000 -6.92E-04 1348 1366 2714 1181 -6.7944 0.0000 -0.8120 0.8151 -0.7555 0.8306 5.9522 0.0100 IND 0.1340 0.0000 -5.51E-05 1302 1412 2714 1147 -8.0295 0.0000 -2.1261 0.2344 -2.0892 0.2492 0.9207 0.0100 INA 0.1850 0.0000 4.63E-05 2064 1955 4019 1745 -8.3365 0.0000 -1.3241 0.6205 -1.3887 0.5894 3.8200 0.0100 KOR 0.0730 0.0000 4.10E-05 2171 1848 4019 1837 -5.0977 0.0000 -2.1096 0.2410 -2.1864 0.2114 1.4078 0.0100 MLY 0.0920 0.0000 1.19E-04 2040 1979 4019 1763 -7.7963 0.0000 -1.8086 0.3767 -1.9145 0.3258 1.0652 0.0100 PAK 0.0700 0.0009 -1.82E-04 869 1106 1975 906 -3.1185 0.0018 -1.6106 0.4769 -1.7596 0.4010 3.0615 0.0100 PHL 0.1790 0.0000 -4.53E-05 1940 2079 4019 1777 -7.3003 0.0000 -0.8497 0.8042 -0.8561 0.8023 1.7749 0.0100 SRI 0.2640 0.0000 -1.34E-04 1292 1422 2714 1079 -10.6178 0.0000 -1.0677 0.7305 -1.1639 0.6921 5.0127 0.0100 TWN 0.0600 0.0001 1.14E-04 2139 1880 4019 1911 -2.8881 0.0039 -2.9705 0.0378 -3.0367 0.0317 0.4037 –
Asi
a
THA 0.1840 0.0000 -2.61E-05 1958 2061 4019 1767 -7.6463 0.0000 -1.0626 0.7325 -0.9995 0.7556 3.6711 0.0100 CZH 0.1200 0.0000 1.60E-04 1092 1101 2193 987 -4.7196 0.0000 -1.5711 0.4973 -1.4422 0.5628 0.4740 – HGY 0.0420 0.0246 5.28E-04 1453 740 2193 731 -11.9708 0.0000 -1.5549 0.5056 -1.5627 0.5016 2.8771 0.0100 POL 0.1430 0.0000 4.82E-04 1411 1303 2714 1255 -3.8786 0.0001 -4.0981 0.0010 -4.0842 0.0010 0.4490 – E
urop
e
RUS 0.0930 0.0000 5.80E-04 1113 1079 2192 957 -5.9720 0.0000 -1.4691 0.5493 -1.5553 0.5054 1.5524 0.0100 ARG -0.0310 0.0247 4.52E-04 2106 1913 4019 1867 -4.3916 0.0000 -2.6501 0.0831 -2.6549 0.0822 3.1939 0.0100 BRZ 0.1520 0.0000 3.98E-04 2054 1965 4019 1791 -6.8979 0.0000 -2.4406 0.1307 -2.4976 0.1161 5.0290 0.0100 CHL 0.2270 0.0000 4.19E-04 2126 1893 4019 1585 -13.2568 0.0000 -2.6332 0.0863 -2.5961 0.0938 4.1724 0.0100 COL 0.3390 0.0000 -8.87E-05 1315 1399 2714 1043 -12.0569 0.0000 -1.1330 0.7048 -1.2526 0.6535 4.2617 0.0100 MEX 0.1230 0.0000 6.87E-04 2074 1945 4019 1775 -7.3727 0.0000 -3.2238 0.0187 -3.2635 0.0167 4.7819 0.0100 PRU 0.1810 0.0000 2.69E-04 1404 1310 2714 1245 -4.2816 0.0000 -2.2022 0.2057 -2.1284 0.2335 1.0369 0.0100 L
atin
Am
eric
a
VEN 0.0930 0.0000 8.45E-06 1454 1260 2714 1185 -6.4093 0.0000 -2.7039 0.0734 -2.5935 0.0944 0.7922 0.0100 ISR 0.0290 0.0655 1.30E-04 1357 1357 2714 1276 -3.1486 0.0016 -1.6349 0.4645 -1.6961 0.4332 2.2301 0.0100 JOR -0.0090 0.2842 -4.79E-05 1473 2546 4019 1695 -5.8525 0.0000 -1.9622 0.3039 -1.9779 0.2968 0.8947 0.0100
Mid
dle
Eas
t
TUR 0.1030 0.0000 5.65E-05 2092 1927 4019 1799 -6.5774 0.0000 -2.2665 0.1831 -2.2930 0.1743 1.4955 0.0100 Notes: Africa: EGY – Egypt, MOR – Morocco, SAF – South Africa; Asia: CHN – China, IND – India, INA – Indonesia, KOR – Korea, MLY – Malaysia, PAK – Pakistan, PHL – Philippines, SRI – Sri Lanka, TWN – Taiwan, THA – Thailand; Europe: CZH – Czech Republic, HGY – Hungary, POL – Poland, RUS – Russia; Latin America: ARG – Argentina, BRZ – Brazil, CHL – Chile, COL – Columbia, MEX – Mexico, PRU – Peru, VEN – Venezuela; Middle East: ISR – Israel, JOR – Jordan, TUR – Turkey. For Augmented Dickey-Fuller (ADF) tests hypotheses are H0: unit root, H1: no unit root (stationary). The lag orders in the ADF equations are determined by the significance of the coefficient for the lagged terms. Pure random walk only in the series. The Phillips-Peron (PP) unit root test hypotheses are H0: unit root, H1: no unit root (stationary). Intercepts only in the series. The Kwiatkowski, Phillips, Schmidt and Shin (KPSS) unit root test hypotheses are H0: no unit root (stationary), H1: unit root. The asymptotic critical values for the KPSS LM test statistic at the .10, .05 and .01 levels are 0.3470, 0.4630 and 0.7390 respectively.

Table 3. Multiple Variance Ratio Tests for Emerging Capital Markets
Market Statistics q = 2 q = 5 q = 10 q = 20 Market Statistics q = 2 q = 5 q = 10 q = 20 Market Statistics q = 2 q = 5 q = 10 q = 20 EGY VRq 1.0220 1.1524 1.1940 1.2429 PHL VRq 1.1816 1.3061 1.3347 1.5881 BRZ VRq 1.1530 1.3386 1.4444 1.5376 Zq 0.8515 *2.6916 2.2244 1.8915 Zq *11.5136 8.8576 6.2843 7.5022 Zq 9.6965 *9.7974 8.3445 6.8571 Z*q 0.6255 1.9862 1.6646 1.4923 Z*q *6.1956 5.1894 3.9776 5.0838 Z*q 5.0969 *5.3539 4.9252 4.3488 MOR VRq 1.1458 1.4130 1.6097 1.8559 SRI VRq 1.2646 1.5524 1.8235 2.0574 CHL VRq 1.2299 1.3986 1.5281 1.7725 Zq 6.8295 8.8272 *8.4570 8.0644 Zq *13.7825 13.1355 12.7055 11.0840 Zq *14.5756 11.5350 9.9155 9.8541 Z*q 4.3886 6.2088 6.2832 *6.2868 Z*q 6.8487 *7.0220 6.8004 6.5137 Z*q *9.4875 7.7593 7.0012 7.4213 SAF VRq 1.0917 1.1729 1.1962 1.2640 TWN VRq 1.0614 1.1812 1.2226 1.3759 COL VRq 1.3402 1.8039 2.0702 2.4869 Zq *4.7789 4.1118 3.0275 2.7669 Zq 3.8896 *5.2418 4.1790 4.7952 Zq 17.7205 *19.1145 16.5124 15.5860 Z*q *2.8062 2.6131 2.0168 1.9497 Z*q 2.9760 *3.8226 3.0566 3.5432 Z*q 10.1606 *11.9481 11.0265 11.0981 CHN VRq 1.1805 1.3272 1.3081 1.4551 THA VRq 1.1849 1.3216 1.3007 1.4653 MEX VRq 1.1244 1.1939 1.2105 1.3425 Zq *9.4053 7.7807 4.7532 4.7705 Zq *11.7214 9.3069 5.6452 5.9350 Zq *7.8833 5.6113 3.9516 4.3690 Z*q *5.5254 4.8829 3.1739 3.3900 Z*q *6.3203 5.0496 3.2070 3.5353 Z*q *3.6223 2.8368 2.1745 2.5795 IND VRq 1.1347 1.2674 1.3008 1.4189 CZH VRq 1.1221 1.1910 1.1723 1.3414 PRU VRq 1.1818 1.2814 1.2651 1.3679 Zq *7.0171 6.3577 4.6420 4.3912 Zq *5.7185 4.0822 2.3902 3.2165 Zq *9.4709 6.6907 4.0902 3.8568 Z*q *5.2580 4.7768 3.5559 3.4763 Z*q *4.6378 3.2832 1.9160 2.6147 Z*q *5.8074 4.3022 2.7807 2.7895 INA VRq 1.1863 1.3268 1.2810 1.4412 HGY VRq 1.0427 1.0437 1.0233 1.1223 VEN VRq 1.1342 1.1300 1.1495 1.1610 Zq *11.8110 9.4556 5.2762 5.6282 Zq 1.9987 0.9331 0.3228 1.1520 Zq *6.9890 3.0900 2.3061 1.6876 Z*q *3.2535 2.9189 1.7275 2.0253 Z*q 1.9141 0.9187 0.3273 1.1975 Z*q *4.0589 1.8932 1.5833 1.2960 KOR VRq 1.0740 1.0164 0.9255 1.0246 POL VRq 1.1452 1.3358 1.4047 1.6208 ISR VRq 1.0301 1.0862 1.0760 1.1142 Zq *4.6891 0.4738 -1.3979 0.3136 Zq 7.5629 *7.9845 6.2440 6.5076 Zq 1.5663 2.0507 1.1724 1.1975 Z*q 2.3758 0.2243 -0.6490 0.1474 Z*q 5.2307 *5.3495 4.2133 4.5407 Z*q 1.0966 1.4564 0.8604 0.9065 MLY VRq 1.0929 1.1896 1.1459 1.1864 RUS VRq 1.0939 1.2094 1.2882 1.4989 JOR VRq 0.9915 0.9974 1.0197 1.0416 Zq *5.8880 5.4877 2.7393 2.3779 Zq 4.3948 *4.4755 3.9960 4.6997 Zq -0.5376 -0.0756 0.3702 0.5310 Z*q 1.8517 1.9006 1.0602 1.0158 Z*q 1.9353 2.3035 2.3310 *2.9737 Z*q -0.3659 -0.0541 0.2730 0.3966 PAK VRq 1.0717 1.2034 1.3401 1.5342 ARG VRq 0.9698 0.8321 0.7445 0.7630 TUR VRq 1.1031 1.1511 1.1964 1.3430 Zq 3.1850 4.1249 4.4767 *4.7767 Zq -1.9147 *-4.8571 -4.7980 -3.0226 Zq *6.5369 4.3720 3.6871 4.3755 Z*q 2.2264 2.7516 3.0597 *3.3991 Z*q -0.6659 -1.4829 -1.5782 -1.0872 Z*q *3.6577 2.5756 2.3516 3.0378
Notes: Africa: EGY – Egypt, MOR – Morocco, SAF – South Africa; Asia: CHN – China, IND – India, INA – Indonesia, KOR – Korea, MLY – Malaysia, PAK – Pakistan, PHL – Philippines, SRI – Sri Lanka, TWN – Taiwan, THA – Thailand; Europe: CZH – Czech Republic, HGY – Hungary, POL – Poland, RUS – Russia; Latin America: ARG – Argentina, BRZ – Brazil, CHL – Chile, COL – Columbia, MEX – Mexico, PRU – Peru, VEN – Venezuela; Middle East: ISR – Israel, JOR – Jordan, TUR – Turkey. VR(q) – variance ratio estimate, Z(q) - test statistic for null hypothesis of homoskedastic increments random walk, Z*(q) - test statistic for null hypothesis of heteroskedastic increments random walk; the critical value for Z(q) and Z*(q) at the 5 percent level of significance is 2.49, an asterisk indicates significance at this level; Sampling intervals (q) are in days.

Table 4. Summary Efficiency Outcomes
Market
Serial correlation
Runs ADF
unit root PP
unit root KPSS
unit root Multiple
variance ratio EGY Efficient Efficient Efficient Efficient Efficient Weakly efficient MOR Inefficient Inefficient Efficient Efficient Efficient Inefficient
Afr
ica
SAF Inefficient Inefficient Efficient Efficient Efficient Inefficient CHN Inefficient Inefficient Efficient Efficient Efficient Inefficient IND Inefficient Inefficient Efficient Efficient Efficient Inefficient INA Inefficient Inefficient Efficient Efficient Efficient Inefficient KOR Inefficient Inefficient Efficient Efficient Efficient Weakly efficient MLY Inefficient Inefficient Efficient Efficient Efficient Weakly efficient PAK Inefficient Inefficient Efficient Efficient Efficient Inefficient PHL Inefficient Inefficient Efficient Efficient Efficient Inefficient SRI Inefficient Inefficient Efficient Efficient Efficient Inefficient TWN Inefficient Inefficient Inefficient Inefficient Inefficient Inefficient
Asi
a
THA Inefficient Inefficient Efficient Efficient Efficient Inefficient CZH Inefficient Inefficient Efficient Efficient Inefficient Inefficient HGY Inefficient Inefficient Efficient Efficient Efficient Strongly efficientPOL Inefficient Inefficient Inefficient Inefficient Inefficient Inefficient E
urop
e
RUS Inefficient Inefficient Efficient Efficient Efficient Inefficient ARG Inefficient Inefficient Efficient Efficient Efficient Weakly efficient BRZ Inefficient Inefficient Efficient Efficient Efficient Inefficient CHL Inefficient Inefficient Efficient Efficient Efficient Inefficient COL Inefficient Inefficient Efficient Efficient Efficient Inefficient MEX Inefficient Inefficient Inefficient Inefficient Efficient Inefficient PRU Inefficient Inefficient Efficient Efficient Efficient Inefficient
Lat
in
A
mer
ica
VEN Inefficient Inefficient Efficient Efficient Efficient Inefficient ISR Inefficient Inefficient Efficient Efficient Efficient Strongly efficientJOR Efficient Inefficient Efficient Efficient Efficient Strongly efficient
Mid
dle
Eas
t
TUR Inefficient Inefficient Efficient Efficient Efficient Inefficient