evaluating profitability and efficiency of bank
TRANSCRIPT

Evaluating Profitability and Efficiency of Bank
Performance in Palestine.
Wesam M. A. Hamed
Submitted to the
Institute of Graduate Studies and Research
in partial fulfillment of the requirements for the Degree of
Master of Science
in
Banking and Finance
Eastern Mediterranean University
February, 2014
Gazimağusa, North Cyprus

Approval of the Institute of Graduate Studies and Research
Prof. Dr. Elvan Yılmaz
Director
I certify that this thesis satisfies the requirements as a thesis for the degree of Master
of Science in Banking and Finance.
Prof. Dr. Salih Katırcıoğlu
Chair, Department of Banking and Finance
We certify that we have read this thesis and that in our opinion it is fully adequate in
scope and quality as a thesis for the degree of Master of Science in Banking and
Finance.
Assoc. Prof. Dr. Nesrin Özataç
Supervisor
Examining Committee
1. Prof. Dr. Salih Katırcıoğlu
2. Assoc. Prof. Dr. Eralp Bektaş
3. Assoc. Prof. Dr. Nesrin Özataç

iii
ABSTRACT
Nowadays, the role of banks in economics is undeniable. All the financial activities
are depending on them because they help to develop the economy quickly, so the
profitability measurements of the banking system should be investigated.
The goal of this study is to find the profitability measurements for 7 commercial
Palestinian banks and the researcher will do that on an analysis of bank for the period
2005-2011. The Palestinian banks profitability will be done by evaluating two main
parts of ratios; the first one is the bank specific ratios which are capital adequacy
ratio, liquidity ratio, management efficiency ratio, and the last one is the asset quality
ratio. In addition, the second part is macroeconomic determinants (inflation and
interest rate).
In this research, panel data is used to evaluate the relationship between the variables.
The study followed the previous studies such as the case of Turkey (Alper and
Anbar, 2011) that investigated the profitability to measure the bank –specific
performance for 10 commercial banks for the period of 2002-2010 and they came out
that there is a positive relationship between the interest rate and profitability and this
result agrees with the statistical analysis for of this study’s case.

iv
The study concluded that the macroeconomic factors have more impact to the
profitability of the banks in Palestine when compared to the bank specific
determinants that exist because of the special structure of each bank, so for that the
researcher concluded the study by suggesting some solutions to the problems faced
in this study.
Keywords: Palestine, panel data, bank profitability, macroeconomics factor, bank
specific determinants.

v
ÖZ
Günümüzde bankaların ekonomideki rolü inkar edilemez.Onlar finansal faaliyetlerin
kalbidir ve ekonomik kalkınma hızını artırmak için yardımcı olurlar. Böylece
bankacılık sisteminin karlılığı belirleyicileri değerlendirilmelidir.Bu tezin amacı,7
ticari Filistin bankalarının karlılık belirleyicilerini bulmak için 2005-2011 dönemi
için bir banka analizi yapmaktır. Filistin bankaları karlılık makroekonomik
belirleyicileri olarak sermaye oranı, aktif kalitesi oranı, yönetim verimliliği oranı,
banka-özel ve enflasyon ve faiz oranı gibi likidite oranını uygulayarak tarafından
incelenir.
Bu araştırmada, panel değerlendirilme tarihi ilişkisi kullanılmıştır.Çalışma sonucu
değerlerinin makroekonomik belirleyicileri tarafından belirlendigi ve karlılık oranın
filistin bankalarında farklı oldugu anlaşıldı çünkü her bankanın özel bir kar oranı
belirleyicisi vardır ve Filistin bankalarının makroekonomik etkilerinden farklı oldugu
anlaşılıyor.
Biz bu çalışmada karşılaşılan sorunlara bazı çözümler önerdik.
Anahtar Kelimeler: Filistin, panel tarihi, banka karlılığı, makroekonomi faktörü,
banka spesifik belirleyicileri.

vi
Dedicated to my family

vii
ACKNOWLEDGMENTS
First of all, I would like to thank God for his splendid support to accomplish this
thesis.
I would also like to appreciate the effort of my supervisor Assoc. Prof. Dr. Nesrin
Özataç for her outstanding contribution and guidance of this thesis. Without her
invaluable supervision, all my efforts could have been short-sighted.
Dr. Özataç provided me her time whenever I needed, not only to finish up the thesis
work, but also achieve with a strong background in the field chosen. Without her I
would not have reached that far.
Secondly, I would like to express my gratitude to my close friend Amjad Taha for his
sincere support throughout my research and preparation. Besides that, I extend my
heartfelt to my parents for believing in me, and supported me financially and
morally. I would like to dedicate this study to them as an indication of their
significance in this study as well as in my life.

viii
TABLE OF CONTENTS
ABSTRACT ................................................................................................................ iii
ÖZ ................................................................................................................................ v
LIST OF TABLES ....................................................................................................... x
LIST OF ABBREVIATIONS ..................................................................................... xi
1 INTRODUCTION OF RESEARCH ........................................................................ 1
1.1 The Background of the Research ....................................................................... 1
1.2 The Goal of the Thesis ....................................................................................... 4
1.3 The Study Findings ............................................................................................ 5
1.4 The Framework of the Research ........................................................................ 5
2 THE ECONOMY AND BANKING FACTORS IN PALESTINE .......................... 6
2.1 Introduction ........................................................................................................ 6
2.2 The Macroeconomic Variables: ......................................................................... 7
2.2.1 The Exchange Rates .................................................................................... 7
2.2.2 The GDP of Palestine Economy .................................................................. 8
2.2.3 The Inflation ................................................................................................ 9
2.3 The Economy of Palestine ................................................................................ 10
2.3.1 The Agriculture Sector in Palestine .......................................................... 11
2.3.2 The Industrial Production in Palestine ....................................................... 11
2.4 The Banking and Financial System .................................................................. 11
2.4.1 The Financial System ................................................................................ 11
2.4.1 The Banking of Palestine ........................................................................... 12
2.5 The Foreign Trade in Palestine ........................................................................ 13
2.5.1 The Exports ................................................................................................ 13
2.5.2 The Imports ................................................................................................ 14
2.6 The Tourism in Palestine .................................................................................. 14
2.7 The Government Budget in Palestine ............................................................... 15
3 THE LITERATURE REVIEW ............................................................................... 16
4 METHODOLOGY AND RESEARCH DATA ...................................................... 20
4.1 The Data ........................................................................................................... 20
4.2 The Variables ................................................................................................... 20
4.2.1 The Dependent Variables .......................................................................... 20

ix
4.2.2 The Independent Variables: ....................................................................... 21
4.3 The Methodology ............................................................................................. 23
5 RESULTS AND DISCUSSIONS ........................................................................... 25
5.1 The Analysis of Correlation .............................................................................. 25
5.2 The Autocorrelation ......................................................................................... 27
5.3 The Model of Simple Regression ..................................................................... 29
5.4 The Variables Test ........................................................................................... 30
5.4.1 The Hypothesis .......................................................................................... 30
5.4.2 The Macroeconomic Measurements .......................................................... 30
5.4.3 The Bank-Specific Measurements ............................................................. 31
6 CONCLUSION AND RECOMMENDATIONS ................................................... 33
REFERENCES .......................................................................................................... 36
APPENDICES ........................................................................................................... 39
x
LIST OF TABLES
Table 1.1: Banks and Branches in Palestine as of end 2012 ………………………. 4
Table 2.1: The Exchange Rate between Palestinian (NIS) and US Dollar …………8
Table 2.2: GDP (composition between sectors) of Palestine Economy (2012)……..8
Table 2.3: GDP (purchasing power parity) of Palestine Economy (2008-2011) …...9
Table 2.4: GDP- Real Growth Rate of Palestine Economy (2008-2011) …………..9
Table 2.5: The Inflation Rate in Palestine (2005-2011) ……………..…………...... 9
Table 2.6: Deposit Interest Rate in Palestine (2003-2011) ……………………….. 10
Table 2.7: Palestinian banking institutions system 2012. ………………….……... 13
Table 5.1: Correlation of Dependent and Independent Variables. ……………….. 27
Table 5.2: Results of Simple Regression for LROA. ……………………………... 29
Table 5.3: Results Simple Regression for LROE …………………………….…… 29
Appendix1: Panel Unit Root Tests for Palestine banks …………………….……. 42
Appendix 2: Panel Unit Root Tests for Palestine banks …………………….…… 43
Appendix 3: Simple Regression Results for ROE …………………………….…. 44
Appendix 4: Simple Regression Results for ROA ……………………………..… 45

xi
LIST OF ABBREVIATIONS
PMA: Palestine Monetary Authority
ESCWA: Economic and Social Commission for Western Asia
PA: Palestine Authority
PALTRADE: Palestine Trade Center
JOD: Jordanian Dinar
NIS: New Israel Shekel
GDP: Gross Domestic Product
ROA: Return on asset
ROE: Return on equity
CAR: Capital adequacy ratio
EFF: Management efficiency ratio
ASQ: Asset quality ratio
LQR: Liquidity ratio
INF: Inflation
IR: Interest rate
E-VIEWS: Econometric views
r2: Coefficient of Determination
P-value: Probability Value
T-start: Test Statistic Value

1
Chapter 1
INTRODUCTION OF RESEARCH
1.1 The Background of the Research
Nowadays, the role of banks in economics is undeniable. All the financial activities
are depending on them because they help the economy to develop quickly. Banks are
the financial institutions that stand alongside with other investment banks and
institutions that get profits from the investment of money. As financial
intermediaries, banks are standing between borrowers who demand the capital and
depositors who supply the capital.
In the last 20 years in Palestine, the banking system has begun to grow and form as a
real financial institution. Therefore, the goal of this research is to evaluate the
profitability and proficiency performance in Palestinian banks.
Nowadays, Palestine banking system is on the stand of improvement. So, it is
essential to control and improve this banking sector. For this reason, it is decided to
consider this research.
In 1967, West Bank was occupied by Israel and before that there were 11
commercial banks in Palestine (3 in Gaza and 8 in West Bank) with 30 branches of
which 26 in the West Bank and only 4 in Gaza. At that time their credit facilities
represented 71.4 % of their deposits (ESCWA 1987).
2
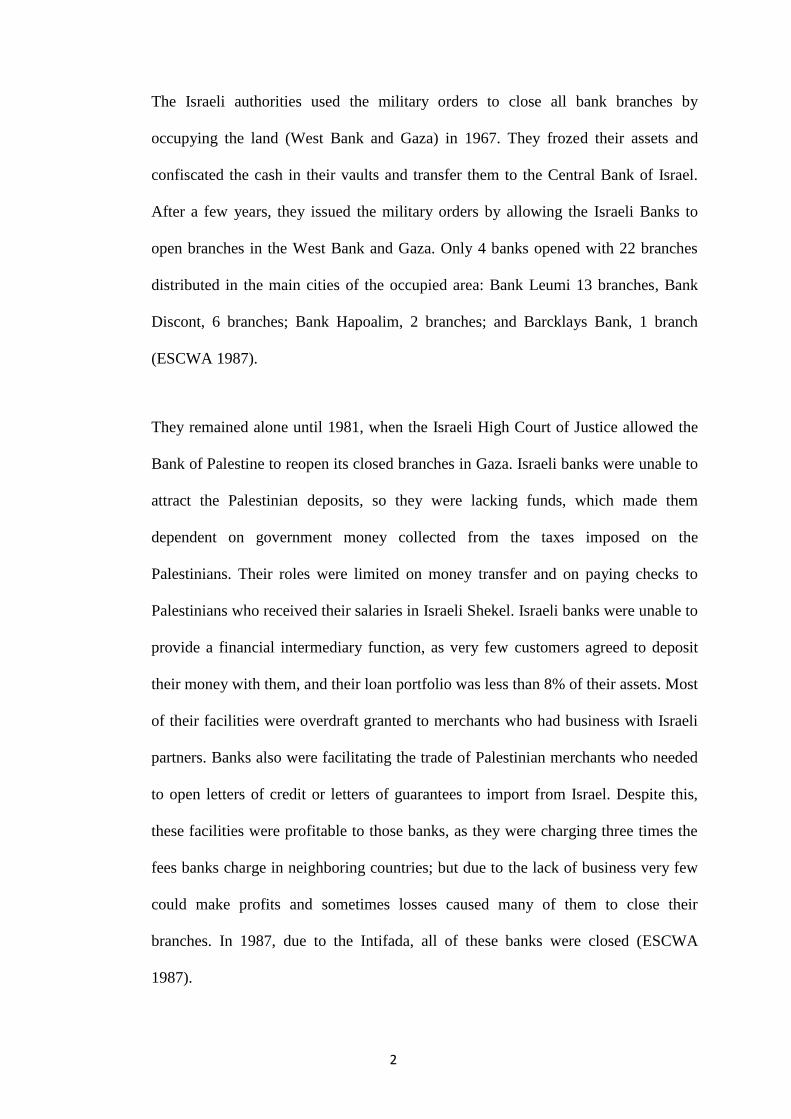
The Israeli authorities used the military orders to close all bank branches by
occupying the land (West Bank and Gaza) in 1967. They frozed their assets and
confiscated the cash in their vaults and transfer them to the Central Bank of Israel.
After a few years, they issued the military orders by allowing the Israeli Banks to
open branches in the West Bank and Gaza. Only 4 banks opened with 22 branches
distributed in the main cities of the occupied area: Bank Leumi 13 branches, Bank
Discont, 6 branches; Bank Hapoalim, 2 branches; and Barcklays Bank, 1 branch
(ESCWA 1987).
They remained alone until 1981, when the Israeli High Court of Justice allowed the
Bank of Palestine to reopen its closed branches in Gaza. Israeli banks were unable to
attract the Palestinian deposits, so they were lacking funds, which made them
dependent on government money collected from the taxes imposed on the
Palestinians. Their roles were limited on money transfer and on paying checks to
Palestinians who received their salaries in Israeli Shekel. Israeli banks were unable to
provide a financial intermediary function, as very few customers agreed to deposit
their money with them, and their loan portfolio was less than 8% of their assets. Most
of their facilities were overdraft granted to merchants who had business with Israeli
partners. Banks also were facilitating the trade of Palestinian merchants who needed
to open letters of credit or letters of guarantees to import from Israel. Despite this,
these facilities were profitable to those banks, as they were charging three times the
fees banks charge in neighboring countries; but due to the lack of business very few
could make profits and sometimes losses caused many of them to close their
branches. In 1987, due to the Intifada, all of these banks were closed (ESCWA
1987).

3
There were no banks in Palestine until 1994, except one branch of Cairo-Amman
Bank, which was reopened in 1986 in addition to the Bank of Palestine in Gaza.
After the Oslo agreement in 1993, the Wadi Araba Agreement between Jordan and
Israel and the Paris Accord in 1994, Israeli authorities allowed Jordanian banks to
reopen their branches closed in 1967. They also allowed the Palestinians to establish
the Palestine Monetary Authority in 1995 to overview banks and to give licenses to
the newly established banks (PMA 2012).
Since 1995, the PMA has issued several laws and regulations. The most important
are the Banking Law, the PMA law and the Money Changers Law. Recently the
PMA drafted a Central Bank Law which is awaiting a Presidential decree. The new
law is expected to transform the PMA into a fully-fledged central bank which will
have the authority to issue the national currency whenever the required conditions
are met (PMA 2012).
Currently three currencies are circulated in Palestine: Israeli shekel, US dollar, and
Jordanian dinar. Since its establishment, the PMA has issued several licenses to new
banks and allowed the banks to open new branches, which made the number of banks
to increase from 2 in 1994 to 17 by the end of 2012, with over 226 branches and
offices. The following table shows the distribution of the banks between local and
foreign, and the number of branches in 2012.

4
Table 1.1: Banks and Branches in Palestine as of end 2012
Banks and Branches Number of Banks Number of Branches
Local Banks
Foreign Banks:
Jordanian
Egyptian
British
7
10
8
1
1
118
108
101
6
1
Total 17 226
Source: Palestine Monetary Authority, Annual Report 2012.
1.2 The Goal of the Thesis
The goal of this thesis is to evaluate the profitability measurements for 7 commercial
Palestinian banks and it will do that on an analysis of the banks for the period 2005-
2011. The Palestinian banks profitability will be done by evaluating the two main
parts of ratios, the first one is the bank specific ratios which are capital adequacy
ratio, asset quality ratio, management efficiency ratio, and liquidity ratio, and the
second is the macroeconomic determinants (inflation and interest rate).
The bank profitability will be measured by the dependent variables like return on
assets (ROA) and return on equity (ROE). Additionally, according to the last
researches it is essential to check the effects of the squeezes on Palestine banking
sector as well and here in the study there are numerous amount of previous
researches that have also been resulted in the same scope like the study of Dietrich
and Wanzenried (2009), which investigated the profitability of 453 commercial
banks in Swiss during period of time from 1999 to 2006. Ramllal (2009) investigated
the profitability measurements of Taiwanese banks by depending on industry
specific, bank specific and macroeconomic measurements during a period from 2002
to 2007.

5
1.3 The Study Findings
The study is done for 7 commercial banks in Palestine based on their asset size
covering a period from 2005 until 2011.The study evaluates how the banks specific
factors and the macroeconomic factors (interest rate and inflation rate) affect the
financial performance in Palestinian banks. Panel data is be used to examine if there
is any statistical significant effect or not in regard to the independent variables and
bank profitability ratios, such as return on assets, asset quality, return on equity,
capital adequacy ratio, liquidity, and management efficiency.
1.4 The Framework of the Research
The research is organized as the following: Part 1 is about the introduction of the
research, Part 2 focuses on the economy and some banking factors in Palestine, Part
3 focuses on literature review depending on the previous studies, Part 4 discusses the
methodology and research data, Part 5 brings out the empirical results and
discussions of the research and finally Part 6 focuses on the conclusion and
recommendations.

6
Chapter 2
THE ECONOMY AND BANKING FACTORS IN
PALESTINE
2.1 Introduction
Generally, Palestine is a country that has a poor economy as a result of inattention
because it was streaked over the time by Israel. In addition to that, the Palestinian
economic growth has been slowly because of the functional war that has existed with
Israel. Palestine has few resources and there is no industry. So, putting the country
onto a strong footing is going to be a major challenge. Nowadays, the country is
almost depending on foreign aid to keep her economy going on. Therefore, this
tension that has existed over the last years does not seem to bring a good future.
Actually, the economy of Palestine refers to the economy of the Palestinian
territories that includes East Jerusalem, Gaza Strip and West Bank.
However, Palestine economy starts to have economic infrastructure. According to the
last few years, the Palestinian industry has grown which has corporate in the
economy improvement in Palestine.
Agriculture is the major sector to the findings of the Palestinian economy in addition
to some small manufactures in the Palestinian economy. West Bank is the highest

7
standard economic area in Palestine when compared to East Jerusalem and Gaza
Strip (Central Bank of Palestine, 2013).
As it is discussed in Chapter 1, the Palestinian economy has depended on the Israeli
procedures for years. Also Palestine has other dynamic markets like Jordan and the
major exports of Palestine are sent to Israel and Jordan.
PALTRADE or the Palestine Trade Center always aimed to improve the trade of
Palestine and encourage a dynamic business and develop the dealings of trade
through the competence construction (Central Bank of Palestine, 2013).
Palestine is depending on three currencies which are Israeli shekel, Jordanian dinar
and US dollar (NIS, JOD and USD).
Any economy in the world is depending on the macroeconomic factors .Therefore,
this part will present the factors regarding to the case of Palestine.
2.2 The Macroeconomic Variables:
The macroeconomic variables in this part are exchange rate, gross domestic product
(GDP), deposit interest rate and inflation rate.
2.2.1 The Exchange Rates
Official exchange rate refers to the exchange rate calculated in the legally sanctioned
exchange market. This rate can be measured by dividing the local currency units
above the foreign currency. The value for exchange rate in Palestine was 3.903 as of
2012 (CIA World Factbook, 2013).

8
The table below presents the exchange rate between the Palestinian (NIS) and US
Dollar for the period 2007-2012.
Table 2.1: The Exchange Rate between Palestinian (NIS) and US Dollar (2007-2012)
Years 2007 2008 2009 2010 2011 2012
Exchange Rate 4.11 3.588 3.932 3.73 3.578 3.903
Source: CIA World Factbook, Exchange rates of Palestine, 2013
2.2.2 The GDP of Palestine Economy
Through the period 1968-1980, The GDP (Gross Domestic Product) of Palestine
economy rose up by 7% but after that period it slowed down. During the 1994 Paris
Economic Protocol in Gaza Strip and West Bank the economic situations
deteriorated. Through the period 1992-1996, the GDP declined by 36.1% due to the
population growth and falling incomes, as well as the corruption in the ruling of
Palestine Authority. However, in late 1999 when Israel permitted safe passage
between the Gaza Strip and West Bank, the economic activity improved. In 2006,
GDP of Palestine declined but in the years 2007 and 2008 the Palestinian Territories
witnessed a real increase in this ratio (CIA World Factbook, 2013).
Table 2.2: GDP (composition between sectors) of Palestine Economy (2012)
Sector
2012
Agriculture
4.2 %
Industry
17.9 %
Services
77.9 %
Source: CIA World Factbook, GDP of Palestine economy, 2013

9
According to the tables that listed below it can be said that the growth percentage of
the GDP has a big decrease in 2011 by 5.7% when compared to 2009, when
decreased by 6.8%.
Table 2.3: GDP-purchasing power parity- of Palestine Economy (2008-2011)
Year 2008 2009 2010 2011
GDP (in billion $) 7.026 7.106 7.589 8.022
Source: CIA World Factbook, GDP-purchasing power of Palestine, 2013
Table 2.4: GDP- Real Growth Rate of Palestine Economy (2008-2011)
Year 2008 2009 2010 2011
GDP ($) 7% 7% 6.8% 5.7%
Source: CIA World Factbook, GDP-real growth rate of Palestine, 2013
2.2.3 The Inflation
Inflation is calculated by the consumer price index that reflects the annual percentage
change in the cost over the average consumer of acquiring a basket of goods and
services that may be fixed or changed at specified intervals, such as yearly.
Generally, the Laspeyres formula is used (International Monetary Fund, 2013).
The prices in Palestine are changing from time to time. Therefore, the inflation rate
in Palestine has a prominent place in the business and economy. The statistical report
of this study that related to the inflation in Palestine can prove these percentages of
inflation. In the table that is provided below it can be seen that the inflation rate was
reported as 3.88 percent in 2006, and then it decreased in 2007 by 1.83 % but it went
back to increase by 9.89% in 2008. This change in the inflation rate was because of
the Israel war on Gaza Strip in 2008 (International Monetary Fund, 2013).
Table 2.5: The Inflation Rate in Palestine (2005-2011)
Year 2005 2006 2007 2008 2009 2010 2011
Value 3.47 3.88 1.83 9.89 2.75 2.9 2.8
Source: Central bank of Palestine, inflation rate of Palestine, 2013.

10
2.2.4 The Interest rate
Any economy can be influenced by this factor. In this case Palestine does not have
real rate of government, so the interest rate will be evaluated according to the deposit
interest rate that plays the main role special in the Palestine banking sector. In the
table below, the fluctuation in this factor can be seen (Central Bank of Palestine,
2013).
The table below shows that the value for the deposit interest rate in Palestine was
0.53 in 2011. Generally, during the last 10 years this factor has reached a maximum
value in 2007 of 3.02 and a minimum value in 2010 of 0.29.
Table 2.6: Deposit Interest Rate in Palestine (2003-2011)
Year 2003 2004 2005 2006 2007 2008 2009 2010 2011
Value 0.74 1.12 2.24 2.97 3.02 0.81 0.40 0.29 0.53
Source: Central bank of Palestine, deposit interest rate of Palestine, 2013.
2.3 The Economy of Palestine
2.3.1 The Agriculture Sector in Palestine
Agriculture is one of the leading sectors in Palestine economy (Central Bank of
Palestine, 2013). This sector helps a large number of Palestinians to get the
possibility of employment. However, the agriculture in Palestine is divided into the
rain fed that forms the primary cultivated area of the total cultivated Palestinian land
and the irrigated cultivation. Also, it is still the provider of the major necessities to
the Palestinian people. The main fruit trees in Palestine are olive, grapevines, figs,
citrus, and almonds. Grapevine is the second main fruit crops product in the West
Bank of Palestine. The type of Palestinian agriculture is yearly and it contains fruits

11
and vegetables. Therefore, in Palestine there are more than 30 different vegetable
crops are planted (Central Bank of Palestine, 2013).
2.3.2 The Industrial Production in Palestine
Industrial production in Palestine is reported by the Central Bureau of Statistics in
Palestine. The industry in Palestine evaluates the outputs of the business in the
industrial cycle of the economy such as mining, utilities, and manufacturing. From
2012 until 2013, it was averaged 7.2 % and after that it reached high of 18.3 % in
August 2013 even its record was -6.9 % in March of 2012 (Central Bank of
Palestine, 2013).
2.4 The Banking and Financial System
2.4.1 The Financial System
After the signing of Oslo Accord in 1993 and Paris Protocol in 1994, the formal
Palestinian financial sector emerged. Paris Protocol gave Palestinians the authority to
manage and control the monetary and financial affairs to develop the anticipated
economic growth (World Bank group, 2013).
However, the Palestinian environment is difficult, but they have administered to
anticipate the financial sector consist of the expected sub-sectors such as banks,
housing finance, insurance companies, payments system, securities market
companies, microfinance institutions and financial leasing companies.
The Palestinian Authority (PA) has established two main institutions to supervise and
manage all the operations of the financial sector: the first one is the Palestinian
Monetary Authority for the banking sector as well as micro finance institutions,
payment system and money changers, and the second is the Capital Market Authority

12
for the non-banking system, pension funds, insurance companies, financial leasing,
and mortgage finance companies.
The establishment of this financial sector and those subsectors is unpredictable
because the Palestinian monetary power remains limited since there is no national
currency until now in Palestine. (World Bank group, 2013)
2.4.1 The Banking of Palestine
The Palestinian banking system dominates the financial sector. The vulnerable
banking system stilled its dependence on the system banks of Jordan and also the
Israeli point of view.
Palestinian banks have a limited economical role because of the political instability
and the depressed economic activity and these banks also reflects various structural
crises like the shortage of suitable collateral and the uncertainty of the output in debt
collection.
Palestine Monetary Authority takes into considerations many steps to improve the
stability of the banking system. PMA worked and still working to develop the capital
requirements, payments system, credit bureau and the rules on secured credit in the
banking system of Palestine.

13
At the figure below (2-7), the Palestinian banking system institutions as designed by
Palestine Monetary Authority in 2012 can be seen.
Source: Palestine Monetary Authority, 2012 Annual Report.
2.5 The Foreign Trade in Palestine
2.5.1 Exports
The Palestinian economy has lack resources, so their exports are too little. In 2012,
the export of goods was US$ 575.5 Million and it increased by 11 percent when

14
compared to 2009. The main commodities and goods exported are stone, olives, fruit,
vegetables and limestone (Palestinian Central Bureau of Statistics, 2012).
2.5.2 Imports
The Palestinian economy demands in huge size on the imports because they wanted
to cover the deficit in the resources and problems that Israeli occupation faces them.
In 2010, the import of goods was US$ 3,958.5 Million and it increased by 9.9 percent
when compared to 2009. The main commodities and goods imported are food,
consumer goods, and chemicals (Palestinian Central Bureau of Statistics, 2012).
2.6 The Tourism in Palestine
Tourism in Palestine faced too many political crises and wars. After the 1967 Arab-
Israeli war, the tourist industry in Palestine collapsed. But after the Oslo Accords
signed in 1994, it has recovered. After that it went back again to decline by 90
percent in the Second Intifada (2000-2006). In 2010, 4.6 million people visited
Palestine including 2.2 million from abroad (Palestinian Central Bureau of Statistics,
2012).
Tourism in Palestine focuses on the historical and public sites in Jerusalem,
Bethlehem, Jericho, and Gaza. In 2007 there were over 300,000 guests at Palestinian
hotels, and half of them in Jerusalem.
Over the last 15 years, the value of the international tourism was fluctuated between
$667 million in 2010 and $37 million in 2001 (Palestinian Central Bureau of
Statistics, 2012).

15
2.7 The Government Budget in Palestine
The government budget of any country is a document plan that measures the public
revenues and expenditure in any country. Through 2011, the revenues of Palestine
was 2.1$ billion but the expenditure was around 3.2$ billion. In summary, the
Palestinian government had a deficit by 16.6% of gross domestic product in this
period (The World Factbook, 2013).

16
Chapter 3
THE LITERATURE REVIEW
Nowadays banks are playing a significant role in contribution to the growth of the
economy. Various studies are found which focus on bank profitability either internal
or external factors. Various researches employed various characteristics and the
external variables of bank level data across countries. This research follows the
previous research steps in evaluating the bank profitability in different studies that
focused on different singled countries. These are as follow: Smadi (2010), Albertazzi
and Gambacorta (2008), Alper and Anbar (2011), Anwar and Herwanay (2006),
Aysan and Ceyhan (2007), Bader and Malawi (2007), Davydenko (2011), Dietrich
and Wanzenried (2009), Lee and Hsieh (2012) and Ramllal (2009).
Different researchers have focused on the asset and liability management in the
banking system (Tektas, and Gunay, 2005) explaining the asset and liability
management in financial problems. Tektas and Gunay found that if any bank
working on maximizing its profit and controlling the various risks that they face by
decreasing them, so the bank’s asset-liability management will be an efficient. Also
their research showed how if the market perceptions changing, so it can create some
crisis.
Multiple regression analysis and correlations (Tarawaneh, 2006) are used to
investigate the financial performance of commercial banks of Oman. Medhat used

17
dependent variables like return on asset and interest income and other independent
variables like asset management, bank size, and the operational efficiency. The
findings showed that a positive strong correlation is founded between the operational
efficiency and financial performance and also there is a moderate correlation
between the bank size and ROA in his ANVOVA analysis.
Smadi (2010) evaluated how the bank specific and macroeconomic measurements in
23 Jordanian banks over the period (1995-2008) are interrelated. He found that the
strong capital and profit should be indicated by higher risk index level of the banking
system. Smadi showed also that during a high risk in 1997 and also the low
economic performance, there will be low risk index of the sample.
Albertazzi and Gambacorta (2008) used the independent variables in their analysis
such as the operating cost, non-interest income, net interest income, and provisions
and profit before tax and dependent variable as banking profitability. They found that
the independent variables affected the bank profitability to become decreased during
the period 1990-2001.
Alper and Anbar (2011) evaluated the profitability to measure the bank–specific
performance of 10 commercial banks through a time from 2002 to 2010 for the case
of Turkey.
They found that the non interest income and the size of the bank have a positive
influence on the profitability of the banks. It means any bank having the largest size,
will have the highest profitability. He also found that the bank’s profitability is
affected negatively by the size of the credit portfolio. In other words, higher interest

18
rate has a direct influence on increasing the profitability and this result agrees with
the statistical analysis for this syudy’s case.
In the case of Indonesia, Anwar and Herwanay (2006) focused on Private Non-
foreign Exchange banks and Provincial Government’s banks during the period of
1993 to 2000. They used ROA and ROE as dependent variables to evaluate the
profitability and they found that there is positive impact on the profitability from the
CRTA and LIQ.
A study on bank performance in the Turkish banking sector is also been achieved by
Aysan and Ceyhan (2007). They suggested that medium sized banks are more
efficient than larger size banks .And they found a significant positive relationship
between loan ratio and the performance had existed. Also return on equity does not
have statistical significant relationship with any of the efficiency factors.
In the case of Jordan banks, Bader and Malawi (2007) investigated the influence of
real interest rate in the Jordanian economy by depending on the co-integration
analysis. They planned to explore the influence of the real interest rate on the
investment in the country during 1990-2005. Bader and Malawi found out that there
is a negative significant relationship between the real interest rate and the level of
investment.
Davydenko (2011) investigated the bank profitability by implementing the internal
and external variables during a period of 2005-2009 in Ukrainian banking system.
They found that the Ukrainian banking system suffered on the loans quality and will
not able to reconstruct the flow of money by depending on the increasing flow of

19
deposits. Also there is a negative effect on profitability from liquidity, credit risk,
inflation, and foreign ownership. Also, he found in his study that there is a positive
effect of capital, bank size, concentration rate, and exchange rate depreciation.
Dietrich and Wanzenried (2009) investigated the determinants like industry-specific,
bank-specific and macroeconomic factors for 453 Swiss commercial Banks during
the period 1999-2006. They found that there are significant differences in
profitability between the industry-specific and macroeconomic factors that have
significant positive effect on profitability and the Swiss Commercial Banks.
Lee and Hsieh (2012) investigated the bank specific and macroeconomic factors and
how they affect the profitability of 42 countries during the period (1994 to 2008).
They suggested that there was a positive relationship between the risk of profit and
the capital of the bank. Also Lee and Hsieh concluded that they should develop the
Asian countries banking system by supporting the investing banks by the financial
efficiency.
In the case of Taiwan, Ramllal (2009) evaluated the profitability factors by
depending on industry-specific and macroeconomics factors during the period (2002-
2007). The researcher found that the bank capital has positive relationship with the
profitability. And the reason behind that is having more capital and the banks can
easily extend loans to customers.

20
Chapter 4
METHODOLOGY AND RESEARCH DATA
4.1 Data
This chapter presents the macroeconomic factors and methodology of Palestine
banking sector until period 2005-2011. The data for 7 commercial banks in Palestine
were collected according to the size of banks and the availability of the data to
measure the macroeconomic factors that affect the profitability of the Palestine banks
over the period of 2005-2011. E-views program will be used to make an analysis that
offers a solution for econometrics analysis, simulation and forecasting and all ratios
that included in the analysis were calculated by Microsoft excel.
4.2 The Variables
The variables consist of two categories as dependent variables which are Return on
Asset (ROA) and Return on Equity (ROE) and the independent variables consisting
of two groups as bank-specific Capital Adequacy (CA), Asset Quality (ASQ),
Management Quality (EFF) and liquidity (LQ)) and as macroeconomic variables
(Inflation rate and Real interest rate).
4.2.1 The Dependent Variables
Return on Asset (ROA):
The ROA is the ratio that used to see the efficiency of any management and her
ability to use the total asset to collect more earnings. Return on assets tells what the
company can do with what it has. In other words, it tells how much of earnings it can

21
derive from the total assets. It is a common measure used for comparing the
performance of financial institutions (such as banks), because the majority of their
assets will be recorded in financial statements at a value that is close to their actual
market value. ROA is an indicator of how profitable a bank is before leverage
(borrowing), compared with other banks and its competitors, so the return on asset is
the total amount of net income over its total assets.
Return on Asset = Net Income/Total Assets.
Return on Equity (ROE)
The ROE is the ratio of quantity of the profit that can be earned for each one dollar
invested in the stock of the firm. This factor is the company’s net income over its
shareholder equity.
A business that has a high return on equity is more likely to be the one that is capable
of generating the cash internally. For the most part, the higher a company's return on
equity the better it earns when compared to its industry.
Return on Equity = Net Income/Shareholder's Equity.
4.2.2 The Independent Variables:
Capital Adequacy:
Capital Adequacy is the ratio that is used to measure the ability of the financial
institution assets to meet its financial obligation. This ratio can be calculated as the
company’s capital over its total asset.
Capital Adequacy: Capital /Total Asset.
Asset Quality:
Asset quality is the ratio that explains the left side of the balance sheet that is related
to the loan performance of the bank. Although, the high loan will generate the high

22
risks of the bank, so this ratio is useful to measure the assets quality. This ratio can
be calculated as the total loans of the company over its total assets.
Asset Quality: Total loans / Total assets.
Management Efficiency Ratios:
Management efficiency ratios are used to measure and show how the banks and
financial institutions use their assets and liabilities. Also it’s used to measure the
receivable turnover, equity’s quality and ability of the bank to repay the liability.
This ratio can be calculated as the interest income of the company over its interest
expenses.
Management Efficiency: Interest income / Interest expenses.
Liquidity Ratios:
Liquidity ratios are used to measure the ability of the banks liquidity to cover short-
term debts. We can calculate this ratio as the liquid asset of the company over its
total assets.
Liquidity: Cash / Total assets.
Inflation Rate:
Inflation rate is one of the macroeconomic factors that affect the banking profitability
and also it's indicating the change of price. This ratio can be calculated as the
following formula:
Formula: i= P1 – P0/ P0 * 100
Interest Rate:
Interest rate is one of the macroeconomic factors that show the growth rate of
purchasing power derived from an investment. Interest rate is used for to affect the
banking profitability. In our case, Palestine does not have real rate of government, so

23
the interest rate will be evaluated according to the deposit interest rate that is paid by
commercial or similar banks for demand.
4.3 The Methodology
In this section, the panel data will be used to evaluate the profitablilty of Palestine
banks with the panel data anlysis.
To the test hypothesis, the regression analysis will be investigated to do the unit root
test to investigare the data are non-stationary or stationary and also the panel data
that determine the cross sectional data and time series data because it will be used to
investigate the various years with the various banks. And also the unit root test will
be used to evaluate the data is stationary or non-stationary which mean variance,
mean, covariance of variables do change or not change with time.
In unit root test the null hypothesis will be the non-stationary and the alternative will
be the stationary. In this study, it is found all the variables are stationary.
The panel of the regression equation in the econometric will be used is:
Yi,t = β0 + βXi,t + εt
Where:
Yi,t is the dependent variable of the function
β0 is the intercept of model
Xi,t repesents the independent variables in the corresponding time (t)
εt represents error term

24
In this analysis the models are as follow:
Y= f (CARi,t, ASQi,t, EFFi,t, LQRi,t, INFi,t, IRi,t).
ROA=β0+β1(CARi,t)+β2(ASQi,t)+β3(EFFi,t)+β4(LQRi,t),t+ β5(INFi,t)
+ β6(IRi,t)+ εt .
ROE=β0+β1(CARi,t)+β2(ASQi,t)+β3(EFFi,t)+β4(LQRi,t)+ β5(INFi,t)+
Β6(IRi,t) + εt.

25
Chapter 5
RESULTS AND DISCUSSIONS
The regression analysis model will be investigated in this part. The researcher will
check if all the variables are stationary or not. Firstly, the panel unit root will be
tested to check the variables by considering the Levin, Lei & Chu (LLC) & Im
Pesaran Shin (IPS) & Wu (PP) that will show the level of significant α (Alpha) 1%,
5%, and 10%. The alternative hypothesis (H1) cannot be rejected if the series are
stationary and the null hypothesis (H0) can be rejected that means the series are
stationary.
5.1 The Analysis of Correlation
Correlation analysis evaluates the strength of the linear significant relationship
between the dependent variables and independent variables. As it was discussed
previously in Chapter 4, there are dependent variables and independent variables.
Now the relationship between each independent variable with the dependent variable
will be discussed according to the results that obtained from the e-views program.
According to the table below it can be seen that the variables are negatively and
positively correlated.
ROA has a positive significant correlation with CAR by 0.127 and that means if the
return on asset increase, the capital adequacy will increase. On the other hand, ROE

26
has a negative significant correlation with CAR by -0.627 and that means when the
return on equity increase, the capital adequacy will decrease in the Palestinian banks.
ROA has a positive significant correlation with ASQ by 0.189 and that means if the
return on asset increase, the assets quality will increase. On the other hand, ROE has
also a positive significant correlation with ASQ by 0.229 and that means when the
return on equity increase, the asset quality will increase as a result in the Palestinian
banks.
ROA has a negative significant correlation with EFF by -0.349 and that means if the
return on asset increase, the management efficiency will decrease. On the other hand,
ROE has also a negative significant correlation with EFF by -0.101 and that means
when the return on equity increase, the management efficiency will decrease as a
result in the Palestinian banks but it will be a lower decrease if the return on asset
increases.
Return on asset has a negative significant correlation with LQR by -0.103 and that
means if the return on asset increase, the liquidity ratio will decrease. On the other
hand, ROE has a positive significant correlation with LQR by 0.017 and that means
when the return on equity increase, the liquidity ratio will increase accordingly.
ROA has a negative significant correlation with LQR by -0.103 and that means if the
return on asset increase, the liquidity ratio will decrease. On the other hand, ROE has
a positive significant correlation with LQR by 0.017 and that means when the return
on equity increase, the liquidity ratio will increase accordingly.

27
For the macroeconomic factors interest rate and inflation rate, it is found that ROA
has a positive significant correlation with the interest rate by 0.367 and also a
positive significant correlation with the inflation rate by 0.183. However, ROE has a
lower positive significant correlation with the interest rate by 0.160 and also a lower
positive significant correlation with the inflation rate by 0.129.
Finally, if the correlation between the independent variables is high and more than
50%, so multicollinearity problem will occur. According to the analysis, this problem
wasn’t found in the independent variables; therefore this part can be concluded as
there is no multicollenarity problem between the independent variables of this
research.
Table 5.1: Correlation of Dependent and Independent Variables
LROA LROE LCAR LASQ LEFF LLQR LIR LINF
LROA 1.000
LROE 0.692 1.000
LCAR 0.127 -0.627 1.000
LASQ 0.189 0.229 -0.110 1.000
LEFF -0.349 -0.101 -0.236 -0.243 1.000
LLQR -0.103 0.017 -0.134 -0.472 0.339 1.000
LIR 0.367 0.160 0.175 -0.100 -0.478 -0.244 1.000
LINF 0.183 0.129 0.019 0.038 -0.146 0.001 -0.111 1.000
5.2 The Autocorrelation
Autocorrelation shows if there is any high correlation between the linear regression
formula and the error term. If the correlation between the independent variables is
high and Durbin Watson value (d) is lower than 1.50, so there will be autocorrelation
problems in the data.

28
According to the results, it can be observed that the Durbin Watson value (d) was
2.01; higher than 1.50.
The coefficient of determination (r2), R-Squared is the proportion of the total
variation in the dependent variable (ROA and ROE) that is explained or accounted
for by the variation in the independent variable (CAR, ASQ, EFF, and LQR).
In the analysis, R-Squared is equal to 0.571212 in the simple regression result for
LROA and it increased to 0.921331 in the simple regression result for LROE.
It can be said that 57.1 percent of the variation in the ROA accounted for the
variation in the independent variable (CAR, ASQ, EFF, and LQR). And 92.1 percent
of the variation in the ROE explained, or accounted for by the variation in the
independent variable (CAR, ASQ, EFF, and LQR).
In the tables 5.2 and 5.3 the results of simple regression for LROA and LROE can be
seen respectively and (L) means the logarithm and the logarithm was used because a
better behaved distribution for the independent variables was aimed and also to
reduce the effect of outliers.

29
Table 5.2: Results of Simple Regression for LROA
Variable Coefficients STD.ERROR T- Statistic Probability
C -1.387116 0.598005 -2.319573 0.0257
LCAR 0.086919 0.040202 2.162071 0.0368
LASQ 0.028819 0.009927 2.903113 0.0061
LEFF 0.134471 0.087650 1.534174 0.1331
LLQR 0.208811 0.020347 10.26230 0.0000
LIR 0.267850 0.045450 5.893320 0.0000
LINF 0.361662 0.110054 3.286226 0.0022
R-Squared 0.571212 F-Statistics 8.659012 0.000005
Durbin-
Watson 2.014070
Table 5.3: Results of Simple Regression for LROE
Variable Coefficients STD.ERROR T- Statistic Probability
C -1.389623 0.598229 -2.322894 0.0255
LCAR -0.913250 0.040116 -22.76534 0.0000
LASQ 0.028821 0.009926 2.903502 0.0060
LEFF 0.135535 0.087626 1.546743 0.1300
LLQR 0.208978 0.020314 10.28757 0.0000
LIR 0.267656 0.045464 5.887140 0.0000
LINF 0.361460 0.110031 3.285083 0.0022
R-Squared 0.921331
F-Statistics 76.12488 0.000000
Durbin-
Watson 2.014915
5.3 The Model of Simple Regression
According to the study it is found that the data are stationary and that means the
average, variance and covariance are moving in the same direction. Therefore, the
formula of the simple regression will be tested by using the E-views software in
according to find the statistically significant relationship between the variables
(dependent and independent).
30
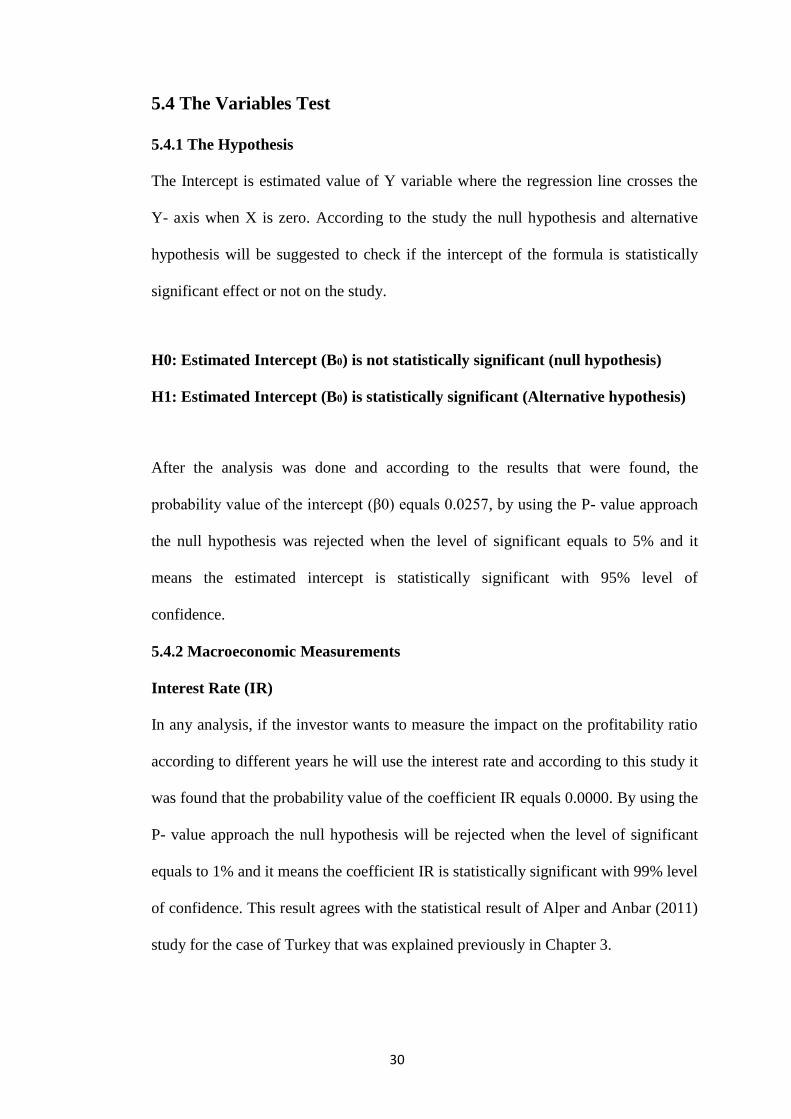
5.4 The Variables Test
5.4.1 The Hypothesis
The Intercept is estimated value of Y variable where the regression line crosses the
Y- axis when X is zero. According to the study the null hypothesis and alternative
hypothesis will be suggested to check if the intercept of the formula is statistically
significant effect or not on the study.
H0: Estimated Intercept (B0) is not statistically significant (null hypothesis)
H1: Estimated Intercept (B0) is statistically significant (Alternative hypothesis)
After the analysis was done and according to the results that were found, the
probability value of the intercept (β0) equals 0.0257, by using the P- value approach
the null hypothesis was rejected when the level of significant equals to 5% and it
means the estimated intercept is statistically significant with 95% level of
confidence.
5.4.2 Macroeconomic Measurements
Interest Rate (IR)
In any analysis, if the investor wants to measure the impact on the profitability ratio
according to different years he will use the interest rate and according to this study it
was found that the probability value of the coefficient IR equals 0.0000. By using the
P- value approach the null hypothesis will be rejected when the level of significant
equals to 1% and it means the coefficient IR is statistically significant with 99% level
of confidence. This result agrees with the statistical result of Alper and Anbar (2011)
study for the case of Turkey that was explained previously in Chapter 3.

31
Inflation Rate (INF)
According to the study, it was found that the probability value of the coefficient INF
equals 0.0022. By using the P- value approach the null hypothesis will be rejected
when level of significant equals to 1% and it means the coefficient INF is statistically
significant with 99% level of confidence
5.4.3 The Bank-Specific Measurements
Asset Quality (ASQ)
Asset quality ratio was used to discuss the balance sheet left side that related to the
loan performance of the financial institution. Since t- computed value was greater
than t- critical value at alpha = 0.01 level, therefore, H0 was rejected and H1 was
accepted that the estimated coefficient of ASQ was statistically significant at 99
percent confidence interval. The same conclusion was reached by p-value approach
where t-prob value (p=0.0060) was less than alpha =0.01 level.
Liquidity Ratio (LQ)
Liquidity ratio was used to evaluate if the liquidity of the banks are able cover the
short-term debts or not. Since t- computed value is greater than t- critical value at
alpha = 0.01 level, therefore, H0 was rejected and H1 was accepted that the estimated
coefficient of LQ is statistically significant at 99 percent confidence interval. The
same conclusion was reached by p-value approach where t-prob value (p=0.0000) is
less than alpha =0.01 level.
Management Efficiency (EFF)
Management efficiency ratios were used to measure and discuss how the banks and
financial institutions use their assets and liabilities. Since t- computed value was less
than t- critical value at alpha = 0.10 level, therefore, H0 could not be rejected and H1
was rejected that the estimated coefficient of EFF was not statistically significant.

32
The researcher reached the same conclusion by p-value approach where t-prob value
(p=0.1331) was greater than alpha =0.10 level.
Capital Adequacy (CA)
Capital Adequacy was used to check if the assets of the financial institution or the
bank are able to cover the financial obligation. Since t- computed value was greater
than t- critical value at alpha = 0.05 level, therefore, the researcher rejected H0 and
accepted H1 that the estimated coefficient of CA is statistically significant at 95
percent confidence interval. We reach the same conclusion by p-value approach
where t-prob value (p=0.0368) was less than alpha =0.05 level.

33
Chapter 6
CONCLUSION AND RECOMMENDATIONS
The economy’s system is closely connected to the banking system. In other words,
one of the factors behind the growth of the economy is a well-banking system. So it
was found that the Palestinian banks determinants of profitability can be done by an
analysis of 7 commercial banks for the period 2005-2011.
Palestine banking system is on the stand of improvement. So, it is essentially to
control and improve this banking sector. In this regard, the researcher decided to
consider this theme.
Following the results that were obtained from the analysis and in the light of the
interpretated results, one of the surprising results was that the capital adequacy ratio
has a positive impact with the return on asset and that means the profitability should
be accompanied with the adequacy of banks capital. On the other hand, there is
negative relationship between the capital adequacy and the return on equity. For that
the researcher recommends that the Palestinian banks should increase their reserve
accounts to increase their capital adequacy ratio for the coming period to enhance the
safety of their banking systems and also to affect the return on equity by increasing
positively, because banks interested in high return for shareholders and they
considered as profit making organizations. So, they will optimize their capital levels
to earn a higher return on equity.

34
Also, the study concluded that there is a positive relationship between the liquidity
ratio and the dependent variables (return on assets and return on equity) and that
shows that Palestinian banks are able to cover the short term debts from the good
liquidity that it has and this also shows that the banking sector will be able to
continue as a going concern in the future.
According to the analysis results, it was found that there is also a significant positive
relationship between the management efficiency ratio and the dependent variables
(return on equity and return on assets) and that means the Palestinian banks
managements have been successful in managing their assets and liabilities and this
result encourages the Palestinian investors to invest more in the coming years even
they know that Palestine banking sector and economy are under development.
In addition, the researcher found out that the Palestinian banking sector is able to
evaluate the assets to measure the credit risk that associated with it. It is understood
and found that there is a significant positive relationship between the asset quality
ratio and the dependent variables (return on asset and return on equity) and the
reason behind that is the bank managers are interested in the quality of their loans
because loans provide earnings for the bank.
One can understand the positive inflation rate might be good for the Palestinian
economy under all circumstances because Palestine depends on three currencies, the
Jordanian dinar, US dollar and Israeli shekel (JOD, USD and NIS).
A positive interest rate in this situation means that the nominal interest rate is close to
zero and it makes the interest rate to be as high as the rate of deflation.

35
In short, the research concludes that the macroeconomic factors have more impact to
the profitability of banks in Palestine as compared with the bank specific
determinants and the reason behind that is the special structure of each bank.
In further work, researchers will try to increase the number of independent variables
such as the size of the banks and the researcher will also try to increase the number
of years to get more accurate results.

36
REFERENCES
Albertazzi, T. and Gambacorta, H. (2008). Bank Profitability and the Business Cycle
for Anglo-Saxon Countries, Journal of Financial Stability, Vol. 5, No. 4, PP. 393–
409.
Alper, D. and Anbar, A. (2011). Bank Specific and Macroeconomic Determinants of
Commercial Bank Profitability: Empirical Evidence from Turkey. Business and
Economics Research Journal, 2: 2,139-152.
Anwar, M. and Herwany, A. (2006). The Determinants of Successful Bank
Profitability in Indonesia: Empirical Study for Provincial Government’s Banks and
Private Non-Foreign Banks. Working Papers in Business, Management and Finance,
No 200601.
Arzu Tektas, E. Nur Ozkan-Gunay, Gokhan Gunay. (2005). "Asset and Liability
Management in Financial Crisis", Journal of Risk Finance, The, Vol. 6 Iss: 2,
pp.135–149.
Aysan, A. and Ceyhan, S. (2007). What Determines the Banking Sector in
Globalized Financial Markets: The Case of Turkey? Bogaziçi University. Social
Performance Science Research Network (SSRN).
Bader, N. and Malawi, G. (2007). The Impact of Interest Rate on Investment in
Jordan Co-integration Analysis, JKAU: Econ. & Adm., Vol. 24, No. 1, PP.199-209.

37
Central Bank of Palestine
http://www.pma.ps (Accessed on 1/11/2013).
Davydenko, A. (2011). Determinants of Bank Profitability in Ukraine.
Undergraduate Economic Review, 7: 1
Data of Palestinian banks
http://data.worldbank.org/country/west-bank-gaza (Accessed on: 30/11/2013).
Dietrich, A. and Wanzenried, G. (2009). What Determines the Profitability of
Commercial Banks? New Evidence from Switzerland. Lucerne University of
Applied Sciences. SSRN.
Economic and Social Commission for Western Asia, ESCWA, 1987
http://www.escwa.un.org/members/main.asp?country=Palestine (Accessed on
11/11/2013)
International Monetary Fund
http://www.imf.org (Accessed on 15/11/2013)
Lee, H. and Hsieh, D. (2012). The Impact of Bank Capital on Profitability and Risk
in Asian Banking, Journal of International Money and Finance, Vol. 32, No. 8, PP.
251–281.
Palestinian Central Bureau of Statistics
http://www.pcbs.gov.ps (Accessed on: 1/12/2013).

38
Palestine Monetary Authority, PMA, Annual Report 2012.
http://www.pma.ps/Default.aspx?tabid=295&language=ar-EG (Accessed on:
15/11/2013).
Ramllal, I. (2009). Bank-Specific, Industry-Specific and Macroeconomic
Determinants of Profitability in Taiwanese Banking System: Under Panel Data
Estimation. International Research Journal of Finance and Economics, 34, 160-167.
Smadi, R. (2010). The Macroeconomic and Bank Specific Factors in Jordanian
Banks During a Time Period from 1995 to 2010, Journal of World Economic, Vol. 6,
No 6, PP.1-35.
Tarawaneh Medhat. (2006). "A Comparison of Financial Performance in the Banking
Sector, Evidence from Omani "Commercial Banks," International Research Journal
of Finance and Economy, Issue 3.
The World Bank Group
http://www.worldbank.org/ (Accessed on: 2/12/2013).
The World Factbook
https://www.cia.gov/library/publications/the-world-factbook/geos/we.html (Accessed
on: 27/12/2013).

39
APPENDICES

42
Appendix1: Panel Unit Root Tests for Palestinian Banks
Note: ROE represents return on equity; CAR is a capital adequacy; EFF is a management quality; LQR Notes:
ROE represents the liquidity. T represents the most general model with a drift and trend; is the model with a
drift and without trend; is the most restricted model without a drift and trend. Optimum lag lengths are
selected based on Schwartz Criterion. *, **, *** denote rejection of the null hypothesis at the 1%, 5%, 10%
levels. Tests for unit roots have been carried out in E-VIEWS 6.0.
Variables
Levels
LLC IPS M-W
LROE T -6.49* .069 33.68*
-5.84* -1.03 33.91*
-4.19* - 44.99*
LROA T -9.58* -0.340 38.48*
-8.25* -3.01* 44.14*
-2.15 - 28.28
LCAR T -9.59* -0.547 38.56*
-5.47* -1.634** 37.34*
-0.313 - 9.34
LLQR T -6.117* -0.1434 22.04***
-3.84* -1.02 28.68*
-16.30* - 20.68
LASQ T -8.13* -0.0894 24.23**
-1.57*** 0.6591 10.66
-2.369*** - 31.29*
LEFF T -5.86* -0.378 41.10*
-3.25* -1.73** 33.17*
-0.0612 - 12.35
LINF T -8.65* -0.7026 51.88*
-5.41* -3.32* 52.78*
-1.89** - 26.89**
LIR T -15.16* -2.13** 87.62*
-14.75* -6.37* 87.41*
-14.82* - 107.4*

43
Appendix 2: Panel Unit Root Tests for Palestinian Banks
Variables
1st differences
LLC IPS M-W
LROE T -4.39* 0.538 13.59
-5.91* -1.204 34.51*
-6.801* - 52.66*
LROA T -6.39* 0.006 27.53*
-7.65* -2.104** 37.26*
-9.047* - 76.42*
LCAR T -12.24 -1.215 62.61*
-9.56* -3.21* 53.51*
-9.08* - 74.47*
LLQR
T -33.012* -4.71* 48.45*
-11.55* -3.37* 42.26*
-7.97* - 65.64*
LASQ T 14.42* -1.028 47.03*
-12.06 -3.017* 43.26*
-7.28* - 49.61*
LEFF T -5.06* 0.368 30.93*
-4.502* -1.767 30.90***
-6.38* - 66.13*
LINF T -8.041* -0.942 59.58*
-10.02* -4.74* 84.08*
14.59* - 130.67*
LIR T -18.34* -1.97 87.62*
-14.75* -6.37* 83.07*
-21.22* - 128.95*
Note: ROE represents return on equity; CAR is a capital adequacy; EFF is a management quality; LQR
represents the liquidity. T represents the most general model with a drift and trend; is the model with a
drift and without trend; is the most restricted model without a drift and trend. Optimum lag lengths are
selected based on Schwartz Criterion. *, **, *** denote rejection of the null hypothesis at the 1%, 5%,
10% levels. Tests for unit roots have been carried out in E-VIEWS 6.0.

44
Appendix 3: Simple Regression Results for ROE
Dependent Variable: LROE Method: Panel EGLS (Period SUR) Date: 12/10/13 Time: 21:12 Sample: 2005 2011 Periods included: 7 Cross-sections included: 7 Total panel (unbalanced) observations: 46 Linear estimation after one-step weighting matrix White period standard errors & covariance (no d.f. correction) WARNING: estimated coefficient covariance matrix is of reduced rank
Variable Coefficient Std. Error t-Statistic Prob. C -1.389623 0.598229 -2.322894 0.0255
LCAR -0.913250 0.040116 -22.76534 0.0000 LASQ 0.028821 0.009926 2.903502 0.0060 LEFF 0.135535 0.087626 1.546743 0.1300 LLQR 0.208978 0.020314 10.28757 0.0000 LIR 0.267656 0.045464 5.887140 0.0000 LINF 0.361460 0.110031 3.285083 0.0022
Weighted Statistics R-squared 0.921331 Mean dependent var -2.181822
Adjusted R-squared 0.909228 S.D. dependent var 5.392973 S.E. of regression 0.831023 Sum squared resid 26.93338 F-statistic 76.12488 Durbin-Watson stat 2.014915 Prob(F-statistic) 0.000000
Unweighted Statistics R-squared 0.480311 Mean dependent var -2.529507
Sum squared resid 17.61176 Durbin-Watson stat 0.970266

45
Appendix 4: Simple Regression Results for ROA
Dependent Variable: LROA Method: Panel EGLS (Period SUR) Date: 12/10/13 Time: 21:10 Sample: 2005 2011 Periods included: 7 Cross-sections included: 7 Total panel (unbalanced) observations: 46 Linear estimation after one-step weighting matrix White period standard errors & covariance (no d.f. correction) WARNING: estimated coefficient covariance matrix is of reduced rank
Variable Coefficient Std. Error t-Statistic Prob. C -1.387116 0.598005 -2.319573 0.0257
LCAR 0.086919 0.040202 2.162071 0.0368 LASQ 0.028819 0.009927 2.903113 0.0061 LEFF 0.134471 0.087650 1.534174 0.1331 LLQR 0.208811 0.020347 10.26230 0.0000 LIR 0.267850 0.045450 5.893320 0.0000 LINF 0.361662 0.110054 3.286226 0.0022
Weighted Statistics R-squared 0.571212 Mean dependent var -3.802245
Adjusted R-squared 0.505245 S.D. dependent var 8.318261 S.E. of regression 0.831325 Sum squared resid 26.95297 F-statistic 8.659012 Durbin-Watson stat 2.014070 Prob (F-statistic) 0.000005
Unweighted Statistics R-squared 0.157817 Mean dependent var -4.333463
Sum squared resid 17.58328 Durbin-Watson stat 0.970544