evaluating the impacts of traffic signal priority … given to potential cost effective alternatives...
TRANSCRIPT

Evaluating the Impacts of Transit Signal Priority Strategies on
Traffic Flow Characteristics:
Case Study along U.S.1, Fairfax County, Virginia
Vinit Deshpande
Thesis submitted to the faculty of the Virginia Polytechnic Institute and State
University in partial fulfillment of the requirements for the degree of
MASTER OF SCIENCE
In
Civil Engineering
Thesis Research Committee Members
Dr. John Collura, Chair
Dr. Antoine G. Hobeika
Dr. Dusan Teodorovic
Dr. Sam Tignor
Keywords- VISSIM, Bus Efficiency, Bus Service Reliability
January, 2003
Falls Church, VA

Evaluating the Impacts of Transit Signal Priority Strategies on
Traffic Flow Characteristics:
Case Study along U.S.1, Fairfax County, Virginia
Vinit Deshpande (ABSTRACT)
Transportation engineers and planners worldwide are faced with the challenge of
improving transit services in urban areas using low cost means. Transit signal priority is
considered to be an effective way to improve transit service reliability and efficiency. In
light of the interest in testing and deploying transit signal priority on a major arterial in
Northern Virginia, this research focuses on the impacts of transit signal priority in the
U.S.1 corridor in Fairfax County in terms of benefits to transit and impacts on other traffic.
Using a simulation tool, VISSIM, these impacts were assessed considering a ten second
green extension priority strategy.
The results of the simulation analysis indicated that the Fairfax Connector buses benefit
from the green extension strategy with little to no impact on the other non-transit traffic.
Overall, improvements of 3.61% were found for bus service reliability and 2.64% for bus
efficiency, while negative impacts were found in the form of increases in queue lengths on
side streets by a maximum value of approximately one vehicle.
Because this research has provided a foundation for the evaluation of transit signal priority
for VDOT and Fairfax County engineers and planners, future research can build upon this
effort. Areas identified for future research include the provision of priority for the entire
bus route; combination of emergency preemption and transit priority strategies; evaluation
of other priority strategies using system- wide priority concepts; and the impacts of priority
strategies in monetary terms.

DEDICATION
I would like to dedicate this work to my mother, Vibhavari Deshpande, for all the sacrifices
she made to ensure I had a good education.
iii

ACKNOWLEDGEMENTS
There are many people I would like to acknowledge for their assistance and support
throughout the pursuit of this research. Unfortunately, many will go unnamed here. For
those who are not mentioned, please know that your words of encouragement made a
difference.
First of all, I would like to express my sincere gratitude to Dr. John Collura, my teacher,
advisor, and the chair of my graduate committee for all of his support and guidance
throughout this endeavor. I am greatly indebted to him for providing me with the financial
support to complete my graduate studies at Virginia Tech. I learned a lot of things from
him personally as well as professionally. I would also like to thank the rest of my graduate
committee, Dr. Antoine Hobeika, Dr. Dusan Teodorovic and Dr. Sam Tignor for their
encouragement and guidance.
I would like to thank my research colleague Mr. Chuck Louisell for all his support and
encouragement; I learned much from my interactions with him on a professional level.
Also, I would like to express my sincere thanks to my research team at Virginia Tech for
their cooperation.
I would like to thank the technical staff at ITC-World for their help with VISSIM and
VAP.
I would like to thank my parents, Vibhavari and Vinod Deshpande for ensuring I had a
great life and good education. Finally, I would like to thank all my friends for their
everlasting encouragement.
iv

TABLE OF CONTENTS
CHAPTER 1 : INTRODUCTION...................................................................................... 1 1.1 Problem Statement…………………………………………………………………..2 1.2 Research Objectives…………………………………………………………………2 1.3 Scope Of Research…….…………………………….………………………………3 1.4 Thesis Contribution…..……………………………..………………………………4 1.5 Thesis Organization………...………………………...…………………………..…4
CHAPTER 2 : LITERATURE REVIEW ......................................................................... 6 2.1 Overview of Traffic Signal Priority Systems……………………………………….6 2.2 Priority vs Preemption……..………………………………………………………..7 2.3 Objectives of Priority………..…………….………………………………………..8 2.4 Design Implementation Issues-Traffic Signal Priority Systems……………………9 2.5 Priority Strategies…………………………………………………………….……12 2.6 Detection Technologies………………………………………………………..…..17 2.7 Traffic Simulation Tools…………………………………………………………...22 2.8 Deployments/Results and Lessons Learned……………………………….………23 2.9 Conclusion……………....…………………………………………………………32
CHAPTER 3 : RESEARCH APPROACH AND EVALUATION PLAN.................... 34 3.1 Research Approach……………….………………………………………………..34 3.2 Evaluation Plan………………………………………………………………..…...38 3.3 Summary…………………………………………………………………………...41
CHAPTER 4 : U.S.1 TRAFFIC FLOW CHARACTERISTICS .................................. 42 4.1 Location…….……...……………………………………………………………....49 4.2 Data Collection….……………….………………………………………………...52 4.3 Traffic Signal Timing Data.……………………………………………....……….75 4.4 Priority Strategy…...…….…………………………………………………………75
CHAPTER 5 : MODELLING IN VISSIM ..................................................................... 71 5.1 Network Modeling.………………………………………………………………...73
5.2 Traffic Signal Control……………………………………………………………. 5.3 Calibration of Model…………...…………………………………………………..78 5.4 Simulation Scenarios………………………………………………………………79 5.5 Summary…………………………………………………………………………...80
CHAPTER 6 : RESULTS, CONCLUSIONS AND RECOMMENDATIONS ............ 81 6.1 Bus Service Reliability- Time Reliability………..…………………………….…..81 6.2 Bus Efficiency……………………………………..……………………………….84 6.3 Other Traffic Related Impacts…………………………….……………………….87 6.4Conclusions……………………………………….………………………….……..90 6.5 Recommendations for Future Research.……………………………………….…..91
REFERENCES…………………………………………...……..…………………....…..93
v


LIST OF FIGURES
Figure 1: Framework Concept ............................................................................................. 35 Figure 2: Roadmap showing U.S.1 Study Corridor............................................................. 42 Figure 3: Study segment in Synchro file ............................................................................. 44 Figure 4: Queue Length on South Kings Highway- AM Peak Period................................. 55 Figure 5: Queue Length on Memorial Drive- AM Peak Period .......................................... 56 Figure 6: Queue Length on Memorial Drive- AM Peak Period .......................................... 57 Figure 7: Queue Length on Shields Avenue - PM Peak Period........................................... 58 Figure 8: Queue Length on Shields Avenue - PM Peak Period........................................... 59 Figure 9: Queue Length on Beacon Hill Road - PM Peak Period ....................................... 60 Figure 10: Queue Length on Beacon Hill Road - PM Peak Period ..................................... 61 Figure 11: Queue Length on Beacon Hill Road - PM Peak Period ..................................... 61 Figure 12: System Architecture for 3M Opticom Emitter Detection System...................... 68 Figure 13: Photographs showing 3M Opticom Emitters ..................................................... 69 Figure 14: 3M Detector and Confirmation Light................................................................. 70 Figure 15: Study Corridor Modeled in VISSIM.................................................................. 73 Figure 16: Study Corridor with 7 Signalized Intersections ................................................. 74 Figure 17: Standard Deviation of elapsed time between endpoints- AM Peak Period........ 82 Figure 18: Standard Deviation of elapsed time between endpoints- PM Peak Period ........ 83 Figure 19: Travel Time Savings for Northbound Buses - AM Peak Period........................ 85 Figure 20: Travel Time Savings for Southbound Buses - PM Peak Period ........................ 86 Figure 21: Average Queue Lengths on Side Streets - AM Peak Period .............................. 88 Figure 22: Average Queue Lengths on Side Streets - AM Peak Period .............................. 89
vii

Chapter 1 : INTRODUCTION
Transportation engineers worldwide are faced with the challenge of providing more
reliable and efficient transportation system. Given the ongoing growth in travel demand
and constraints surrounding traditional ways to enhance carrying capacity, attention is
being given to potential cost effective alternatives to increase system efficiency without
major infrastructure investments. Such transportation system management strategies have
evolved over the years as potential cost effective alternatives to sustain the immense
pressure over the transportation system, especially in the urban areas. A strategy currently
being considered to enhance the efficiency of public transport service reliability is transit
signal priority.
The inefficiency of urban bus systems can be attributed in part to the delay experienced at
signalized intersections. Past research shows that the stopped delay at intersections
comprises about 20 percent of overall transit delay (Zhang, 2001). With rapid development
in communication technology, more and more jurisdictions are considering advanced
signal control systems and priority strategies. An advantage of such control systems is that
they can accommodate changing demands in traffic. Such systems can also perform better
under varying demand levels and can be designed to identify a particular type of vehicle
such as transit vehicles to provide some form of priority control.
For more than two decades, transit operators and traffic engineers have implemented and
evaluated traffic signal priority systems for transit with varying degrees of success.
Research has shown that priority strategies may contribute to increase in the quality of
transit service but at the same time it is also important to note the potential negative
impacts on the other facility users. Research efforts underway around the world reflect the
interest among the professionals to examine the potential benefits and to quantify the
impacts of these strategies on the total transportation system.
1

1.1 Problem Statement
The Virginia Department of Transportation (VDOT) together with Fairfax County is
performing an operational field test of transit priority strategies along U.S.1 in Northern
Virginia. A primary objective of the field test is to enhance the performance of the Fairfax
Connector buses along U.S.1 without having substantial negative impacts on other non-
transit traffic. In light of the interest in testing and deploying the priority system, there is a
need for an evaluation framework and measures in order to determine the impacts
associated with these priority strategies as applied to transit as well as overall traffic flow
characteristics. An evaluation framework and measures would provide an approach for
local stakeholders to examine the likely impacts of the potential deployment to assess the
degree to which the deployment achieves its desired objectives. In particular, this research
focuses on determining the extent to which traffic signal priority strategies might improve
the service reliability of Fairfax Connector buses in the corridor and associated impacts on
other traffic.
1.2 Research Goal and Objectives
The overall goal of the research is to evaluate the impacts of traffic signal priority systems
on the traffic flow characteristics along U.S.1 in terms of benefits to transit and impacts on
other non-transit traffic. This research intends to address two major objectives.
The first objective is to identify a set of performance measures to assess the impacts of
traffic signal priority system deployment on U.S.1 in Northern Virginia. These measures
focus on the problems and objectives stakeholders hope to address by deploying the
proposed system. These measures will help both traffic and the transit operators identify
the consequences of transit priority systems.
2
The second objective is to illustrate the use of measures identified above to evaluate the
impacts of transit priority on U.S.1. These measures are used with data collected in the
field and with VISSIM, a simulation model.
1.3 Scope Of Research
To improve our understanding about the issues related to the assessment of traffic signal
priority systems, a thorough literature review was presented. The literature review will help
identify and synthesize appropriate references of research projects involving the
deployment of traffic signal priority systems. In particular the focus provides background
on the objectives of signal priority; discusses the various technologies used; and
summarizes prior experiences in U.S.
An evaluation framework is presented to address the expectations of the stakeholders. This
framework is primarily based on the findings of research conducted at Virginia Tech
(Chang, 2002). The research herein identifies the appropriate measures from the evaluation
framework to test transit signal priority on U.S.1. A primary aim here is to help VDOT and
Fairfax County assess the performance of the traffic signal priority system in terms of the
extent to which the stated objectives are met and various impacts are realized, along U.S.1
in Northern Virginia.
The next step involved collecting data to use the appropriate measures in the evaluation
framework. This consisted of field study performed by a team of researchers. A subsequent
step was to select a simulation approach. The review of existing simulation models (Ova,
Smadi) showed that VISSIM was a good candidate. VISSIM is a microscopic model
similar to CORSIM in display but capable of detailed consideration of the roadway, traffic,
and passenger effects on transit performance. VISSIM provided the level of fidelity
required to incorporate the level of detail required to complement a field study. The use of
VISSIM gives an additional advantage of combining the benefits of both approaches
namely field study and simulation-based studies. It also gives an opportunity to conduct a
3

comparative study between predicted impacts by VISSIM and actual observations on the
field in the ‘after’ case, once the system is deployed on U.S.1.
In the end, conclusions and recommendations will describe the major findings of the
research.
1.4 Thesis Contribution
This research is significant in several ways. First, it focuses on the first operational
deployment of a traffic signal priority system in the Northern Virginia region. Secondly,
the results are very important for the transportation community because of increasing
interest in the impacts of such priority systems on the total transportation system. Thirdly,
this research provides the basis for a comparison of the simulation results reported herein
and the “before” and “after” field study currently in progress. Finally, this is the first
activity at Virginia Tech to use VISSIM to model transit priority, and thus is paving the
way for future research to evaluate the impacts of transit priority.
1.5 Thesis Organization
This thesis is consists of six chapters. Following this chapter, Chapter 2 reviews the work
that has been done in the area of signal priority systems and includes a review of different
strategies used for traffic signal priority; different detection technologies; the impacts of
priority on the transportation system; and actual signal priority experiences in the United
States as well as in other parts of the world.
Chapter 3 introduces the research approach and the evaluation framework to assess the
priority deployment on U.S.1 in Northern Virginia. The framework includes different
measures and the data collection methods required to evaluate priority strategies.
4

Chapter 4 describes the U.S.1 case study corridor and the traffic flow and transit
characteristics in the corridor.
Chapter 5 describes VISSIM, the simulation model used to evaluate the impacts of signal
priority in the U.S.1 corridor. General overview of VISSIM is performed along with the
data requirements and the calibration method.
Chapter 6 reviews the results based on VISSIM simulations. This chapter also summarizes
the major conclusions of the research and identifies the areas for future research.
5
Chapter 2 : LITERATURE REVIEW
The first step in the research for traffic signal priority systems is to study the vast amount
of literature available in this subject. This enables the author to understand the state-of-art
traffic signal priority systems and findings in previous studies. It is important to understand
the different approaches taken by various researchers in the past with respect to their
objectives, in order to formulate an approach for study that will cover all the aspects related
to the deployment and the analysis in this research. The literature review also presents
evidence that supports or rejects the theory and hypotheses to be posited in this research.
This Chapter also reviews traffic signal priority fundamentals including the objectives of
the priority strategies, different strategies and technologies used and summarizes the results
and findings in past studies.
2.1 Overview of Traffic Signal Priority Systems
Traffic Signal priority (TSP) has been deployed for more than three decades to facilitate the
movement of in-service transit vehicles, either buses or streetcars, through traffic-signal
controlled intersections by reducing the time that transit vehicles spend delayed at
intersection queues(Chang, 2002). TSP can reduce transit delay and travel time to improve
transit reliability, thereby increasing the quality of the transit service. It also has the
potential of reducing overall delay at the intersection on a per-person basis. TSP is a tool,
effectively used to improve the overall efficiency of the transportation system through
basic transportation principles and advanced technological solutions. At the same time, it is
essential to understand its potential impacts on other facility users, keeping them to the
minimum to achieve maximum benefits with acceptable amount of side effects.
6

2.2 Priority vs. Preemption
Before discussing the strategies used to implement TSP, it is important to revisit the
definition of priority and how it differs from preemption. Priority and preemption are often
used synonymously, when in fact they are different systems (Chang, 2002). These two
systems may use similar technologies, which are implemented in identical fashion.
However, signal priority modifies the normal signal operation to better accommodate the
transit vehicles, while preemption interrupts the normal operation for special events (e.g.
emergency vehicle responding to emergency call).
Preemption is traditionally used at railroad crossings and at signalized intersections for
emergency vehicles where a high degree of priority is warranted for safety and
performance reasons. The granting of preemption typically has minimal restrictions, owing
to the importance afforded to safety of public emergency workers and response to
individuals in need. When a traffic signal is preempted then there is no consideration for
maintaining the existing signal-timing plan such that the coordination can be maintained
between adjacent traffic signals. Preemption uses a special signal timing plan, requiring the
traffic signal controller to transition out of and back into the coordinated operation of
normal signal timing plan.
Traffic signal priority attempts to provide some priority service opportunities within the
coordinated operation of traffic signal. This allows reduced delay but not elimination of
delay, to transit vehicles without significantly impacting the other traffic. Since transit
service is typically much more frequent than rail or emergency vehicles service, this allows
the system to maintain a better level of performance. It should be noted that preemption
could be applied to the transit buses but the impacts of this action must be carefully
considered. The application of priority is often subjected to conditions and criteria, mostly
to limit the impacts on the other traffic.
Objectives of preemption and priority are quite different (Chang, 2002), though the system
architecture in implementation may appear similar. The objectives of priority will be
7
studied in detail later in this chapter. Commonly sighted objectives of emergency vehicle
preemption are:
• The system shall significantly reduce response time to emergencies.
• The system shall significantly improve the safety and health of emergency
personnel by reducing accidents, relieving stress or both.
• The system shall reduce accidents between non-emergency vehicles related to
responding emergency units at intersections where it is installed.
2.3 Objectives of Priority
The primary objective of a traffic signal priority system is to improve the public transit
system by reducing the delay it incurs at the signalized intersections. In the U.S. 1 case
study the following objectives were established by the stakeholders including the Virginia
Department of Transportation (VDOT) and Fairfax County.
1. the system should be deployed to improve bus service reliability for Fairfax
Connector buses along the corridor;
2. the system should also improve the bus efficiency at which the Fairfax Connector
buses operate in the corridor;
3. the system should have minimal impacts on the other facility users including traffic
on side streets; and,
4. the priority system should be a part of larger ITS system that includes preemption
system for emergency vehicles, providing a safer interaction between buses and
emergency vehicles; this is very important considering high frequency bus service
along the main line during rush hours and emergency vehicle entering from the side
street.
These objectives form the basis for the evaluation framework and selected measures and
that are presented in this research.
8

2.4 Design Implementation Issues- Traffic Signal Priority Systems
Before presenting details about various strategies and technologies used for traffic signal
priority systems, it is essential to study the components that make the traffic priority signal
system. This section reviews the overall structure of the traffic signal priority systems at a
higher level and introduces the different challenges faced by transportation engineers in
successful planning and deployment of traffic signal priority system. The information in
this section is based on the knowledge obtained from the literature review of past work
(Gifford, Pelletiere, and Collura, 2002) and well supplemented by the author’s academic
background.
There are many factors that affect implementation of traffic signal priority systems (ITS
America, 2002). They can be categorized in two major categories: traffic related factors
and transit related factors. Over the years, traffic and transit engineers have had tough times
to agree on the purpose and value of traffic signal priority systems. Many times it has been
a challenge to get all the stakeholders at the same table to discuss possible use of traffic
signal priority systems, due to their conflicting views. There have been different opinions
among the professionals about potential benefits of the deployment of traffic signal priority
system as against the large amount of money invested. The case study orientation of this
research concentrates more on the planning and design implementation issues.
2.4.1 Traffic Signal Related Issues 2.4.1.1 Roadway Geometry
Roadway geometry is one of the most critical factors for the operation of any traffic signal
priority system as it directly dictates the capability of the system and types of possible
operations. Roadway geometry is impacted by the surrounding land development, which
dictates the number and location of the intersections and the transit stops. Roadway
geometry offers challenges such as plane of vision e.g. (horizontal and vertical line of
sight) for the detection technologies.
9

2.4.1.2 Traffic Volumes
Traffic volumes are a crucial factor because they change with time for any given
intersection or segment of the road. During peak hours the network is often operating under
constrained conditions with higher volumes of general-purpose traffic and transit as well. It
is crucial for the transit operators to achieve the maximum benefits from the traffic signal
priority systems during peak hours, as there is a higher transit usage at this time. The
impacts of traffic signal priority systems primarily depend on the volume of traffic in the
direction of the transit route as well as the volume conflicting with the transit route.
2.4.1.2 Traffic Signal System including Hardware and Software
This is an operating factor and relates to the extent to which the traffic signal priority
system is able to achieve the desired results. For example, it is critical that the signal
hardware and software can deploy intended priority strategies and can store and transfer the
data in the required format.
2.4.1.3 Pedestrians
Pedestrians have an influence on the operation of the traffic signal priority systems. In most
instances, the time required for a pedestrian to safely cross the street at a signalized
intersections limits the time available for the signal priority. Also, pedestrians are often the
transit customers hence they may require the service at the same time as the transit
vehicles.
2.4.1.4 Adjacent Intersection Operations
Adjacent intersection operations are very important to understand in order to achieve the
progression for the transit vehicles. This is very crucial in the case of closely spaced
intersections. This is a crucial factor in this research as the study corridor consists of 7
intersections in a stretch of 1.3 mile. It is very important to maintain coordination to the
extent possible and consider this prior to deployment of the priority system.
10

2.4.2 Transit Related Issues 2.4.2.1 Type of Transit System
This has an impact on the traffic signal priority system, as it will be easier to implement the
system for rail-based than for road-based transit. Rail systems are generally on exclusive
(or semi exclusive) right of ways and so prediction of vehicle arrival times at the
intersections where they intersect with normal traffic, tend to be more accurate than the bus
system because of the traffic impacts. Dwell time is also a major contributor to the
uncertainty in arrival to the intersection and is in part why express bus services benefit
more form traffic priority system.
2.4.2.2 Transit Stops
The location of transit stops relative to a signalized intersection may impact the
effectiveness of the traffic signal priority system. Studies have shown that the far side stops
are more compatible with priority systems than near side stops as discussed below.
Near side stops present some additional challenges related to where the transit vehicle
should be detected. If the transit vehicle is detected upstream of the transit stop then the
dwell time at that near side stop needs to be considered. This dwell time can be variable.
Near side stops provide a challenging situation often referred as triple-stop-point, where a
queue of vehicles waiting at the intersection makes the transit vehicle stop at the back of
the queue, then stopping again at the stop to pick up the passengers, and again at the
intersection. Researchers have proposed some solutions to this problem. For example,
requiring the driver to shut down the emitter when the vehicle approaches the near side
stop; however this adds to the driver’s stress, Connecting the power to the emitter to the
door of the transit vehicle in order to turn the emitter off when the door is open may be a
strategy to consider.
Far side stops are more compatible with the traffic signal priority system, but they may be
unsafe and lead to rear end accidents.
11

2.5 Priority Strategies
Research on traffic signal priority systems has been conducted worldwide over last three
decades. There have been many research attempts in urban areas all over the United States
and also in Canada, Japan and Europe. Vehicle signal priority has been used with light rail
transit, express bus services, and /or regular transit services. In general, signal priority
strategies can be classified in to three major categories: passive priority, active priority and
real time/adaptive priority strategies (ITS America, 2002).
2.5.1 Passive Priority Strategies
Passive priority strategies attempt to favor routes with significant transit use in the system
wide traffic signal timing schemes, giving consideration to factors such as timing
coordinated signals at average transit vehicle speed instead of average automobile speed,
reducing the cycle length to reduce delay. This approach tries to better accommodate the
transit vehicles while balancing the auto-favored system with basic traffic engineering
principles. In general, when transit operations are predictable (e.g. consistent dwell times),
transit frequencies are high, and traffic volumes are low, passive priority strategies can
perform efficiently. It includes providing progression for transit vehicles adjusting the
offsets according to average operating speed of transit buses, providing phase sequence
designed to more frequently serve a phase that has high transit demand, or by providing
transit by-pass at metering locations. The following are commonly used passive priority
strategies.
• Adjustment of Cycle Length
Shortening the cycle length at intersections along the transit route helps to reduce transit
vehicle delay, but it also reduces the capacity of the intersection. So the benefits to the
transit vehicles must be weighted against the cost associated with the reduction in capacity
12

resulting from the shorter cycle lengths. This approach can be efficient where we have low
traffic volumes and high frequency of transit buses.
• Area-wide Timing Plans.
Area wide timing plans is set such that they favor transit bus progression through the
network. There are two different approaches to how these plans can be generated. First,
allocating the green time based on the number of passengers, rather than vehicles, which
pass through the network. This basically favors the high occupancy transit vehicles over
single occupancy automobiles increasing the person throughput of the network. To use this
technique, vehicle occupancies must be known to allow average passenger delays to be
minimized. For this purpose automatic passenger counters can be installed on the transit
buses. Secondly, area-wide timing plans can also be designed to give priority to transit
vehicles by coordinating intersection signal plans to allow transit vehicle progression
through the network. The effectiveness of this technique is highly dependent on the ability
to forecast the bus travel times between the network intersections, due to the large
variability in dwell times. As a result, this technique is best suited for the express transit
routes, because these routes are less prone to variability in travel times between
intersections.
• Phase Splitting
Phase splitting refers to splitting priority phases in to multiple phases and repeating these
phases within the same cycle. Although the cycle length is not changed in these strategies,
they reduce the capacity of the intersection.
• Metering Vehicles
Metering a signal phase can restrict the flow of vehicles entering a designated roadway in a
network. This kind of metering reduces the flow downstream of the bottleneck. Transit
13

signal priority in this case can allow transit buses to by-pass the metered signal phases, thus
providing a smoother flow for transit vehicles.
2.5.2 Active Priority Strategies
Active priority strategies involve detecting the presence of the transit vehicles, and
depending on the system logic and traffic conditions, provide special treatment for them.
This relies on the advanced communication technologies to both detect the presence of a
transit vehicle, and predict its arrival time at the intersection. There is a need for
communication link between signal controller and the transit vehicles. As a result, initial
capital investment and periodic maintenance costs are required to operate these strategies.
The following are commonly used active priority strategies.
• Phase Extension (Green Extension)
Green extension strategy extends the green time for transit vehicle movement when such
vehicle is approaching the intersection. This strategy only applies when the signal is green
for approaching transit vehicle. This is an effective strategy as it reduces the delay for the
transit vehicle substantially by accommodating it in the same cycle and thus not making it
wait for another complete cycle to get the green. The impacts on the other traffic are also
less as it does not change or disrupt the phasing.
• Early Green (Red truncation)
Early green strategy shortens the green time of crossing traffic or conflicting phases to
expedite the return to green (i.e. red truncation) for the movement where transit vehicle has
been detected. Additional green time is allocated to the beginning of the transit vehicles
normal green phase to reduce delay. This applies when the signal is red for the transit
vehicle movement when the vehicle is detected.
14

• Actuated Transit Phase (Red interruption)
Actuated transit phases are only displayed only when a transit vehicle is detected at the
intersection. An example could be an exclusive left turn phase for the transit vehicle. The
left turn is only displayed when the transit vehicle is detected in that lane. Another example
would be the use of queue jump phase that will allow the transit vehicle to enter the
downstream link ahead of the normal traffic stream.
• Phase Insertion
This is basically an insertion of a special phase for the transit vehicle. A short green phase
on the transit vehicles is added in to its normal red phase while conflicting approaches are
forced to stop. The phase is only inserted when a transit vehicle is detected and it requests
the priority.
• Green Truncation
If the transit vehicle is detected far from the intersection, truncating the transit vehicles
green would increase the probability of the transit vehicle to receive a green during next
cycle as it arrives at the intersection. Delay to cross street may be reduced through the
green truncation. The additional green given to the transit vehicle is truncated once the
transit vehicle has passed through the intersection.
• Phase Rotation
The order of signal phases can be rotated to provide the priority to the transit vehicle. For
example, a northbound left turn could always be a lagging phase, meaning it follows the
opposite through signal. A left turning bus, requesting priority that arrives before the green
signal for the through phase begins could request the left turn phase. With the phase
rotation concept, the left turn phase could be served as a leading phase in order to expedite
the passage of the transit vehicle.
15

Active priority measures are broadly classified in to two main categories: unconditional
priority and conditional priority. In the former approach, the priority is granted whenever
the transit vehicle is detected at the intersection. This approach is similar to the preemption
where the priority is always granted, subject to safety considerations including the
minimum clearance intervals. In the later approach the priority is only granted if predefined
conditions are satisfied. Typically these conditions will include the considerations for the
saturation on the side streets, the schedule adherence of the transit vehicle and/or the transit
rider ship. Conditional priority is used more often at locations within a network of closely
spaced traffic signals, because intersections do not operate independently in this
environment.
2.5.3 Adaptive/ Real Time Strategies
Adaptive/real time strategies provide priority while simultaneously trying to optimize some
given performance criteria. The criteria may include person delay, transit vehicle delay,
automobile delay, and/or combination of these criteria. These strategies continuously
optimize the effective timing plan based on real time, observed data. They typically require
early detection of transit vehicles in order to provide more time to adjust the signals to
provide priority while minimizing the impacts. These systems also often require the ability
to update the transit vehicles arrival time, which can vary according to number of stops and
traffic conditions. The updated arrival time can then provide feedback in to the process of
adjusting the signal timings.
2.6 Detection Technologies
Detection technology forms an important component of overall traffic signal priority
system architecture. It forms the communication link between the approaching transit
vehicle and the traffic signal controller. For active priority to be effective it is very
16

important to detect the approaching transit vehicle and accordingly adjust the signal
phasing system to provide the priority to the transit vehicle.
In simple form, detection technology consists of a message conveyer, which is installed on
the transit vehicle and a receiver, which is installed in the signal controller. There are
different types of media to carry this messages to the signal controller namely light, sound,
radio frequencies, etc. There has been extensive research performed at Virginia Tech to
study different technologies, system requirements and past deployments (Collura, Chang,
Willhaus, and Gifford, 2000). Researchers have studied different types of detection
technologies according to their functionality, strengths, and limitations. These technologies
have been used by different vendors in different fashions. So the different vendor
implementations were studied individually. This section mentions the findings from
previous research in brief in order to provide the sufficient knowledge about this important
aspect of the traffic signal priority system architecture.
17

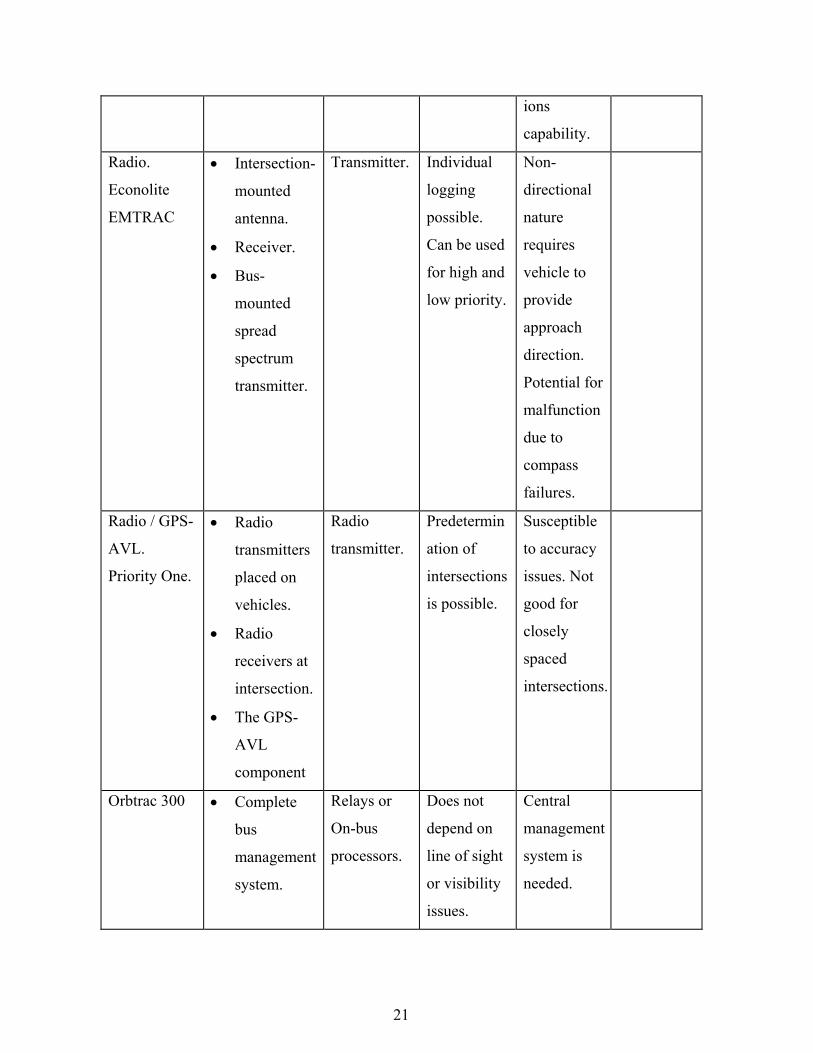
Table 1: Detection Technologies used for Transit Signal Priority
Media
And
Vendor.
Components Activation Strengths Limitations Special
Feature
or
Notes
Light
(Infrared
light)
3M
• Infrared
strobe
emitters.
• Infrared
detectors.
• Phase
selector card
By a switch
or automatic
mechanism.
Popular
technology,
Readily
available,
Separate
high and
low
priorities for
emergency
and non-
emergency
vehicles.
Individual
vehicle
logging
Dependent
on good
visibility
conditions,
Possibility
of
interference
with
neighboring
intersection
s, limited
transfer
capability
Optional
conformati
on light,
Vehicle
identificati
on numbers
are coded
in the
message for
particular
emitter.
Light
(Infrared
light)
Optronics/To
mar
Strobecom
• Infrared
strobe
emitters.
• Infrared
detector.
• Interface
device.
By switch
or automatic
mechanism.
Compatibilit
y with
Opticom
Vehicle
level
control,
used for
different
vehicle
classes.
Performanc
e hampered
by visibility
issues, low
data transfer
potential.
Optional
Confirmati
on light,
Vehicle
identificati
on numbers
are coded
in the
message for
particular
emitter.
18
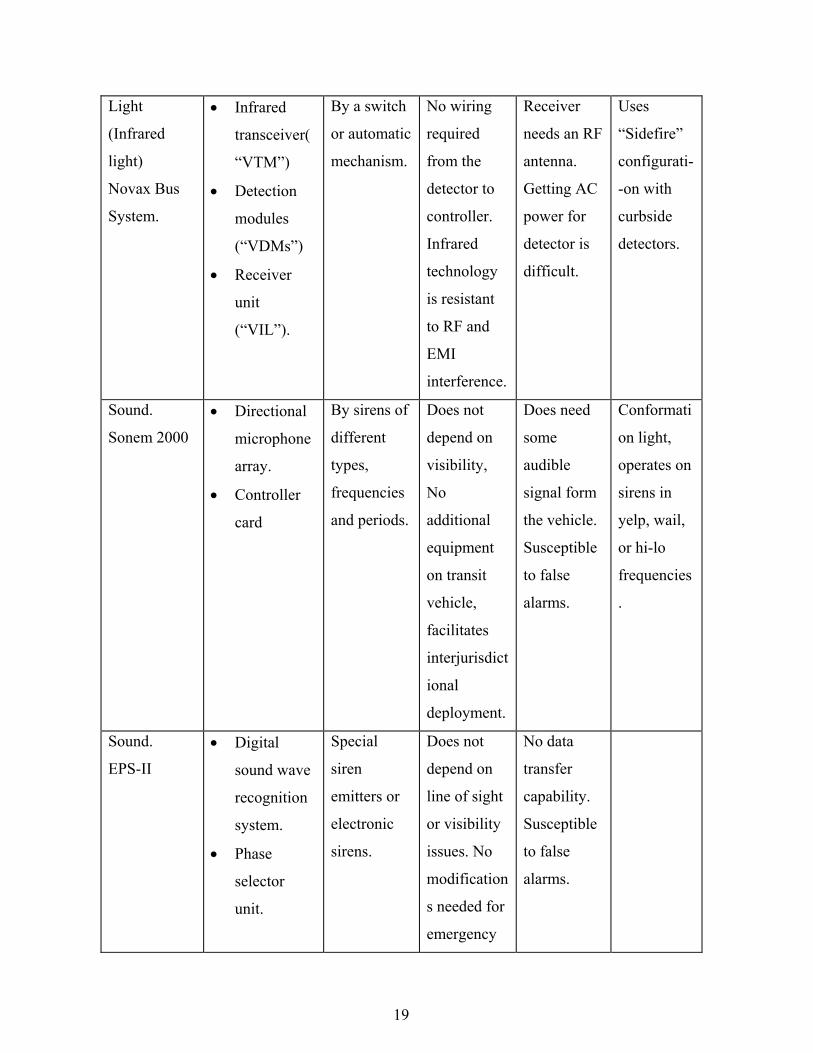
Light
(Infrared
light)
Novax Bus
System.
• Infrared
transceiver(
“VTM”)
• Detection
modules
(“VDMs”)
• Receiver
unit
(“VIL”).
By a switch
or automatic
mechanism.
No wiring
required
from the
detector to
controller.
Infrared
technology
is resistant
to RF and
EMI
interference.
Receiver
needs an RF
antenna.
Getting AC
power for
detector is
difficult.
Uses
“Sidefire”
configurati-
-on with
curbside
detectors.
Sound.
Sonem 2000
• Directional
microphone
array.
• Controller
card
By sirens of
different
types,
frequencies
and periods.
Does not
depend on
visibility,
No
additional
equipment
on transit
vehicle,
facilitates
interjurisdict
ional
deployment.
Does need
some
audible
signal form
the vehicle.
Susceptible
to false
alarms.
Conformati
on light,
operates on
sirens in
yelp, wail,
or hi-lo
frequencies
.
Sound.
EPS-II
• Digital
sound wave
recognition
system.
• Phase
selector
unit.
Special
siren
emitters or
electronic
sirens.
Does not
depend on
line of sight
or visibility
issues. No
modification
s needed for
emergency
No data
transfer
capability.
Susceptible
to false
alarms.
19
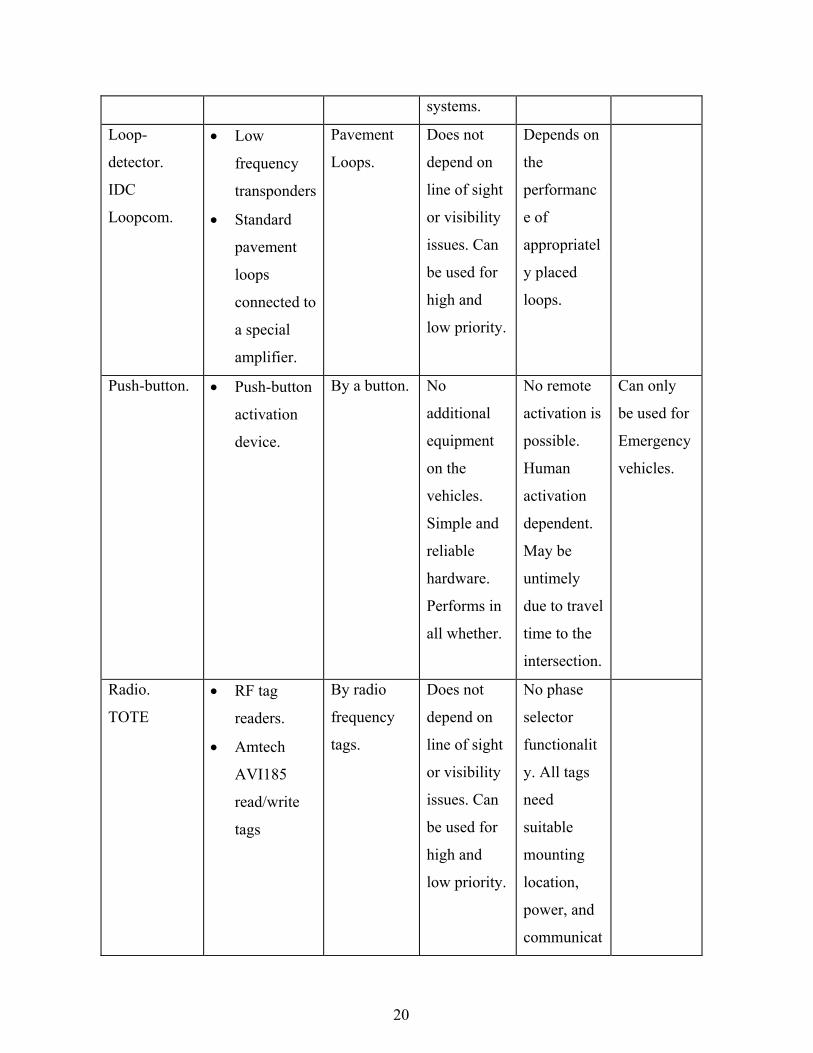
systems.
Loop-
detector.
IDC
Loopcom.
• Low
frequency
transponders
• Standard
pavement
loops
connected to
a special
amplifier.
Pavement
Loops.
Does not
depend on
line of sight
or visibility
issues. Can
be used for
high and
low priority.
Depends on
the
performanc
e of
appropriatel
y placed
loops.
Push-button. • Push-button
activation
device.
By a button. No
additional
equipment
on the
vehicles.
Simple and
reliable
hardware.
Performs in
all whether.
No remote
activation is
possible.
Human
activation
dependent.
May be
untimely
due to travel
time to the
intersection.
Can only
be used for
Emergency
vehicles.
Radio.
TOTE
• RF tag
readers.
• Amtech
AVI185
read/write
tags
By radio
frequency
tags.
Does not
depend on
line of sight
or visibility
issues. Can
be used for
high and
low priority.
No phase
selector
functionalit
y. All tags
need
suitable
mounting
location,
power, and
communicat
20
ions
capability.
Radio.
Econolite
EMTRAC
• Intersection-
mounted
antenna.
• Receiver.
• Bus-
mounted
spread
spectrum
transmitter.
Transmitter. Individual
logging
possible.
Can be used
for high and
low priority.
Non-
directional
nature
requires
vehicle to
provide
approach
direction.
Potential for
malfunction
due to
compass
failures.
Radio / GPS-
AVL.
Priority One.
• Radio
transmitters
placed on
vehicles.
• Radio
receivers at
intersection.
• The GPS-
AVL
component
Radio
transmitter.
Predetermin
ation of
intersections
is possible.
Susceptible
to accuracy
issues. Not
good for
closely
spaced
intersections.
Orbtrac 300 • Complete
bus
management
system.
Relays or
On-bus
processors.
Does not
depend on
line of sight
or visibility
issues.
Central
management
system is
needed.
21

2.7 Traffic Simulation Tools
Traffic simulation tools model the dynamic flow of vehicles along a roadway. There are
essentially three main categories of traffic simulation models: macroscopic, mesoscopic,
and microscopic. Macroscopic simulation tools do not model individual vehicles but
instead model traffic flow using aggregate traffic speed, flow, and density relationships.
Mesoscopic simulation tools do track individual vehicles, however the movement of these
individual vehicles are governed by similar traffic speed, flow, and density relationships.
Microscopic simulation tools, on the other hand, track individual vehicles whose
movement is governed by individual driver behavior models (e.g., car following models
and lane changing models). Historically, macroscopic tools have been used to model larger
transportation networks because they require less computing resources as compared to
microscopic models. Mesoscopic tools are the most recent of the types of models and strive
to incorporate the strengths of both the macroscopic and microscopic approaches. For
purposes of this research, references to traffic simulation models and tools will be focused
primarily on microscopic models (Louisell, 2002).
Traffic simulation analysis is particularly useful for conducting “what if” scenarios in a
simulated environment prior to field implementation (Louisell, 2002). These “what if”
scenarios could be related to changes in roadway geometric features, lane configuration,
traffic signal timing, transit routes, or any number of other traffic operational strategies or
alternatives.
Highway capacity analysis and traffic signal optimization are typically conducted prior to
simulation analysis to assist in the development of appropriate operational alternatives.
Some of the strengths of traffic simulation analysis include its ability to model traffic
control devices and individual vehicles on a time step (usually one second) basis and the
ability to model uncertainty through stochastic processes.
There are several different traffic simulation tools available and there have been some
recent assessments of these tools. Skabardonis conducted an assessment study for the
22

Washington State Department of Transportation where he identified over a dozen
simulation models and conducted a detailed assessment of the following five: CORSIM,
INTEGRATION, MITSIM, PARAMICS, and VISSIM (Skabardonis, 1999). In addition,
Skabadonis provides an extensive bibliography of recent research related to traffic
simulation analysis. The Institute of Transport Studies at the University of Leeds also
conducted a thorough review of microscopic traffic simulation models (Institute of
Transport Studies, 1997). Since the strengths and weaknesses of these simulation models
vary, it is important to choose a model that is appropriate for the analysis at hand. There
have also been some recent studies on strengths and limitations of these models (Choa,
Milan, Stanek, 2001). As this research involved modeling of a signalized corridor for
traffic signal priority systems, VISSIM was selected because of its capability to provide
detailed information on the MOE identified; it has a strong emphasis on modeling transit,
and it allows the user to evaluate traffic signals through fixed time controllers or through
explicitly defined controller logic (Ova, Smadi). Also, this research is the first effort at
Virginia Tech to use VISSIM to program traffic signal priority systems using Vehicle
Actuated Programming, making it a significant contribution to the research tools at
Virginia Tech.
2.8 Deployments/Results and Lessons Learned - Traffic Signal Priority
Systems
Traffic signal priority systems have been deployed and tested in various urban areas around
the United States. It has also been widely applied in Canada, Japan and Europe. There have
been research efforts in the past at Virginia Tech to review selected experiences in U.S.
(Collura, Chang, and Gifford, 2000). In this section results of the major studies are
presented including the study findings and the conclusions. Information is gathered through
published as well as non-published literature, journals and technological magazines and
worldwide web pages. First, the U.S. experiences are presented followed by the other
international experiences. These experiences are classified in two major categories: field
studies and simulation studies.
23

2.8.1 Field Studies in the U.S.
2.8.1.1 Portland, Oregon
An operational test was carried out at four intersections on Powell Boulevard, Portland in
1994(Kloos, Danaher, and Hunter-Zaworski, 1994). It is a five-lane arterial with three bus
stations located at far side and one is at near side. The strategies used were green
extension/early green (red truncation) and queue jump with shared right turn lanes. The
extensions or early green was allowed up to 10 second in off-peak periods and up to 20
seconds during peak-periods. Portland tested both TOTE and LoopComm detection
systems along with 170 Type controllers with Wapiti IKS firmware. The performance
measures included bus travel time, delay to non-transit vehicles and person delay at four
intersections. Data collected showed 6 minutes reduction in bus travel time during peak-
hours and no significant impact on average vehicle or person delay was noticed.
2.8.1.2 Louisiana Avenue, Minnesota
This project relates to research reported herein very closely as it is also characterized by
closely spaced intersections and heavy traffic volumes (Westwood Professional Services,
Inc., 1995). Opticom was tested at a diamond interchange for through traffic signals;
different detectors were used for left turn and through lanes. Econolite ASC-8000 ASC/2
controllers were used in the test. Three levels of priority, low, medium and high were tested
as against the base case of no priority. Low, provided extended green while remaining in
coordination; medium, provided longer extended green while remaining in coordination;
high, provided preemption. The high priority reduced bus travel time by 38%, while the
medium and low priority did not reduce bus travel time. Medium and low priority did not
increase auto-stopped time, but high priority increased it by 4.4 sec (23%). The investigator
concluded that priority treatment within coordinate operation is a viable strategy.
24

2.8.1.3 San Diego, CA
Passive priority to trolleys in downtown San Diego was deployed in Celniker in 1992
(Celniker, Wayne Terry, 1992). The high frequency of trolleys was a major challenge and
brought lengthy delays through the former preemption system. So area wide planning of
active priority system was planned to give a progression to the trolleys. The drivers were
asked to wait for the fresh green and were assured progression to the next station as long as
they departed within first 3 seconds of green. About 2-3 minutes of travel time reduction
was achieved over a section of 4.8 km.
2.8.1.4 Miami, Florida
Miami tested a bus preemption system and other priority measures in 1973 along a 16 km
section of I95 and Northwest Seventh Avenue corridor of an express bus route, the Orange
Streaker (Wattleworth, Courage, Wallace, 1977). The priority strategies included
reversible, exclusive lane, preemption, and a coordinated signal system for bus progression.
These were addressed by five scenarios: 1- no priority, 2- signal preemption for buses, 3-
preemption for buses and exclusive lanes, 4- signal progression and exclusive lane and 5-
signal preemption, signal progression, exclusive bus lane. The most effective treatment for
reducing bus delays and travel time was found to be bus lanes, followed by preemption,
and then progression. Preemption was found to not be as effective as progression in
maintaining schedule adherence. Traffic impacts were found to be minimal, and influenced
more by signal control parameters (fully actuated vs. coordinated actuated and pretimed vs.
coordinated-actuated) than the preemption.
2.8.1.5 Charlotte, NC
Charlotte deployed signal priority along a radial corridor for express buses. Opticom
emitters were installed on the buses. The deployment showed an average of 4% savings on
travel time for the buses. On the operation side, the vehicles showed reduced wear and tear
decreasing the maintenance and less vehicular emissions. The study showed a great success
25

on an overall basis as it was very well accepted by public and was seen as a positive
solution for growing congestion problems. There were no significant negative impacts on
other traffic.
2.8.1.6 Chicago, Illinois
Chicago found the loop detector based system to be simple and reliable (Collura, Chang,
Willhaus, and Gifford, 2000). About 2-3 minutes were saved on the travel time on a bus
run of 13-17 minutes, and the impact to traffic was minimal. The system also showed that
these were the results of providing the priority to only 30% buses as 70% of the buses
arrived during the normal green phase.
2.8.2 Simulation Studies
2.8.2.1 Baltimore, Maryland
Kuah (Kuah, 1992) investigated signal progression for light rail transit (LRT) in downtown
Baltimore in 1992. The corridor was along Howard Street and was 2.4 km long. The time
space diagram for the Central Light Rail Line (CLRL) was proposed using following
assumptions: constant dwell time of 30 sec., 7.5 minutes bi-directional headway, cruise
speeds of 40-48km/hr on straight tracks and 24-32 on curved tracks and acceleration rates
of 0.84 and 0.76 m/s^2, respectively. The simulation software used was TRANSYT and
was applied in two scenarios: with and without CLRL for the year 1992. Results showed no
degradation in LOS with introduction of CLRL. However, for one intersection LOS
degraded from B to F. Individual vehicle delay was predicted to increase 14% and average
transit operating speeds were predicted to decrease by 7 % with the introduction of CLRL.
2.8.2.2 Austin, Texas
Garrow and Michemehl (Garrow, Michemehl, 1997) conducted a priority simulation along
a 4.1 km arterial having 11 intersections in Austin, Texas in 1997. The simulation was done
26

using TRAF-Netsim to get three models: peak-period local bus, off-peak period local bus,
and off-peak period express bus. The results were as follows.
• Shortening cycle lengths may be useful during off-peak hours. If the reduction is
limited then it may help both the transit vehicles as well as the other vehicles along the
arterial and cross streets by reducing delays
• Unconditional priority offers good potential during off-peak hours. It is recommended
to limit the length of green extension or red truncation at major intersections. It is very
important to consider the saturation levels at the cross street before taking out the green
from them. For example, removing 5-10 seconds green at intersections having
saturation levels of 0.8 to 0.9 can cause signal plan failure
• Far side bus stops are more favorable for traffic signal priority systems than the near
side stops
• Signal priority does not affect the overall average person travel time at intersections
with significant cross street saturation levels
2.8.2.3 Chicago, Illinois
Bauer, Medema, and Subbarao (1995) reported using simulation for providing priority to
LRT vehicles in downtown Chicago (Chicago Central Area Circulator). It was for the
proposed project of the Central Area Circulation (CAC), which has an exclusive lane.
TransSim II and TRAF-Netsim were used in the simulation. The simulated priority
strategies included: 1) Fixed time controllers at intersection and semi-actuated controllers
at junctions to give progression to LRT vehicles; 2) red truncation or green extension; 3)
delay of LRT is minimized through the use of interactive communication between LRT
vehicles and the signal controller, which allows the LRT arrival times at intersections to be
predictable.
The results showed that the third strategy led to higher average speed for the LRT. Strategy
1 produced minimal system wide-delay and strategies 2 and 3 yielded similar system wide
delays.
27
2.8.2.4 Seattle, Washington
Jacobson, and Brinckerhoff (1993) reported a study of signal priority given to buses in
Seattle area in 1993. There were two different strategies used namely HOV-weighted
OPAC strategy and lift strategy. In the former strategy the number of people or vehicles
through the intersection were maximized by using a dynamic programming algorithm. It
was evident from the study that this algorithm outperforms the conventional signal timing
method. In the latter strategy, upstream loop detectors identified the presence of buses; the
signal design assumes all the other non-concurrent approaches are not there (lifted) for a
given amount of time. The operating parameters were the detector locations and the time
during which the traffic is lifted.
TRAF-Netsim was used for the simulation. The ‘lift’ strategy showed a 33% decrease in
bus delay and minimal impacts to the private vehicles. When this strategy was simulated on
three adjacent intersections the benefits to the buses were marginal and negative impacts to
private vehicles increased. This strategy does not work well with closely spaced
intersections.
2.8.2.5 College Station, Texas
Development and laboratory testing of an intelligent concept for providing priority to buses
at signalized intersections without disrupting progression was tested in Texas (Balke,
Dudek, Urbanik, 2000). The concept used bus position information to predict when in the
cycle a bus would arrive at the bus stop and stop line of a signalized intersection and to
determine whether a bus needs priority. The strategy used to provide priority was selected
on the basis of the estimated arrival time of the bus at the stop line. Priority was provided
by using phase extension, phase insertion, and early return strategies without causing the
controller to drop from coordination. Implementation of the strategies was accomplished
through normal traffic-signal controller commands (such as Ring Force Offs and Phase
Holds). Hardware-in-the-loop simulation studies were performed to evaluate the
effectiveness of the concept with real traffic-signal controllers. The performance of the
28
intelligent bus priority approach was examined at three volume-to-capacity levels: 0.5, 0.8,
and 0.95. Significant reductions in bus travel times were achieved at all three volume-to-
capacity levels by using the intelligent bus priority approach. Use of the intelligent bus
priority approach resulted in only minor increases in total system stop delay and individual
approach stop delays at volume-to-capacity levels of 0.5 and 0.8. The results of the
simulation studies performed as part of this study suggested to the researchers that the
intelligent bus priority approach could be used at moderate traffic levels (up to volume-to-
capacity levels of 0.9 or less) without significantly affecting cross-street delays.
2.8.3 Field Studies in Canada, Europe & the Pacific Rim Experiences
2.8.3.1 Vicenza, Italy
Vinceza Public Transportation Company studied the deployment of the 3M-priority control
system (Collura, Chang, and Gifford, 2000). The study included five intersections and 18
buses. Tracking of travel times by day of week and by hour of day for one week before and
on week after the deployment of Opticom system showed an average reduction of 23.8% of
bus travel times through the center of the city. Results also indicated an average travel
speed increase of 5 Km/hr, which represents a 30% increase.
2.8.3.2 Swansea, England
Swansea reported a traffic signal priority study in 1994 (Eavns, 1994). Exclusive bus lanes
with both active and passive priority for buses were deployed. The passive priority was
implemented through SCOOT system while active priority included green extension, red
truncation and transit phase insertion.
The results showed a two percent decrease in travel time with the passive priority and an
increase by 17% on other approaches. Green extension or red truncation achieved savings
in bus travel times up to 11% in peak hours at the cost of a 7% increase in delay to private
vehicles. While green extension showed no reduction in travel times and the delay to other
vehicles increased by 15%.
29

2.8.3.3 Stuttgart, Germany
Three priority levels were developed in Stuttgart to provide priority to a light rail transit
system (Nelson, 1993). The first level was called ‘limited preferential system’ and allowed
green extension only when required. The second level allows both extensions and recalls
while third level provides absolute priority, also known as preemption. ‘Limited
preferential treatment’ reduced the transit delays by 50% with minimal extra delay to
private vehicles.
2.8.3.4 Brisbane, Australia
Brisbane City Council developed an active bus priority system called RAPID bus priority
system, based around its own Urban Traffic and Control system known as BLISS (Brisbane
Linked Intersection Signal System). The priority system was deployed at 14 traffic signals
on Waterworks Road in Brisbane (Peterson, 1994). The literature indicates that the system
was successful and was implemented nation wide.
2.8.3.5 Lyon & Toulouse, France
Lyon developed a bus priority method called CELTIC, which provided a conditional
priority to the transit buses (Farges, Henry, 1994). A conditional priority strategy was
developed incorporating state estimation and optimization at each intersection over a 50
second horizon. Various criteria are used for the conditional priority including the
minimization of the delay to public vehicles.
The field test was carried out in Toulouse. The field test showed that statistically
significant reductions in transit travel time in the range of 11 to 14 % with no significant
changes in general traffic travel times.
30

2.8.3.6 Strasbourg, France
Strasbourg and few other French cities tested a traffic signal priority system prepared by a
company called CGA (Laurence, 1994). The system uses a beacon-based approach where
the system communicates with the transit vehicles before selecting the strategy. The study
showed system wide reductions in transit travel times in the range of 4-5%.
2.8.3.7 Zurich, Switzerland
Zurich has very high standards for the public transportation system with the aim of zero
delay at signalized intersections (Bishop, 1994). It carries high annual trips in the range of
490 per person, which compares with 131 for Manchester and 290 for England. On
detection of a public transport system the controller makes sure that it receives a green at
upcoming intersection and the information is also passed on to the successive intersections
to achieve local optimization. Metering is also done to keep the transit routes congestion
free. It is claimed that at 90% of the signalized intersections have zero waiting time for
transit buses.
2.8.3.8 Toronto, Canada
Toronto deployed a non-optimizing signal priority strategy for streetcars on a 1.6 km
section of Queen Street (Municipality of Metropolitan Toronto, 1991). The headway for
streetcars is 4 minutes in rush hours and 5-6 minutes during non-rush hours. The strategies
used were green extension and red truncation. The study showed that the green extension
was much more effective than the red truncation, as only 12% of the red truncation were
fully used by the streetcars. In this study, the provision of priority disrupted the
coordination with successive signal and then the simultaneous provision of priority as
considered. The provision of priority decreased the travel times and the delays for the
streetcar. This resulted in large reduction in average passenger delay due to high occupancy
of transit vehicles.
31

2.8.3.9 Eindhoven, Netherlands
A conditional bus priority implementation in Eindhoven, the Netherlands, was studied
using varying levels of provision of priority (Furth, Muller, 2000). Conditional priority for
buses at signalized intersections means that late buses are given priority and early buses are
not. This scheme is a method of operational control that improves service quality by
keeping buses on schedule. Results showed the strong improvement in schedule adherence
compared with a no-priority situation. Traffic impacts at an intersection were studied for
three scenarios-no priority, absolute priority, and conditional priority. Compared with no
priority, absolute priority increased delays significantly while conditional priority had
almost no impact.
2.8.3.10 London, United Kingdom
Use of Automatic Vehicle Location (AVL) for provision of priority to transit buses in
London and Southampton was studied (Hounsell, McLeod, 1998). The use of AVL in
applications for bus priority at traffic signals is described, including a comparative review
of different architectures and techniques that have emerged. Results of a feasibility study
for the use of AVL in this context in London are presented. This study indicated that using
AVL to target high-occupancy, high-headway buses with higher levels of priority could
provide economic benefits for buses and passengers up to twice those achieved with
current operations, where priority is equally available to all buses; Deployment details of
this application, related to COUNTDOWN, are described
2.9 Conclusion
This Chapter reviewed the vast amount of literature available related to traffic signal
priority. Different technologies were presented and the challenges these technologies offer
were assessed. The chapter also presents some of the results and findings of prior research
efforts in U.S as well as in allover the world.
32
A traffic signal priority system has the potential to serve as a part of the solution to ever-
increasing congestion issues by increasing the overall efficiency of public transport service.
Careful planning and design must precede deployment. Moreover, the literature shows that
the traffic signal priority systems can enhance the public transportation systems in terms of
improved schedule reliability, reduced operating cost and increased operating efficiency.
There are many influencing factors, which play an important role in the effectiveness of the
priority system and its impacts on the other facility users. It should also be noted that a
traffic signal priority system may serve more effectively if it is implemented as a part of a
larger ITS system.
.
33

Chapter 3 : RESEARCH APPROACH AND EVALUATION PLAN
3.1 Research Approach
This chapter will present the research approach and the evaluation plan used for this
research. This provides framework in which this research was carried out and presented to
the stakeholders. The knowledge gained form the literature review and the past research
carried out in the field of transit priority at Virginia Tech by Dr. John Collura and James
Chang (Chang, 2002), forms the building block for this evaluation framework. This chapter
concentrates on synthesizing that knowledge to formulate a framework for the U.S.1
project.
The evaluation framework establishes an appropriate context in which the deployment of
the traffic signal priority system was examined on U.S.1. This evaluation framework and
plan can provide objective basis for local stakeholders to examine the likely impacts of the
potential deployment and to assess the degree to which the deployment achieves the
desired objectives. The evaluation framework provides an important foundation for
determining whether a project or an individual strategy meets the intended objectives.
Without a framework, there is a risk of attempting to justify the worthwhileness of a project
without systematic evidence. Almost all potential projects have some merits. However,
when considering whether a project should be developed or deployed, the planning process
should consider to what extent the stated objectives would be met and what negative
impacts would be realized, relative to other alternatives. In particular, the work focuses on
the extent to which traffic signal priority strategies can improve the on time performance of
Fairfax Connector buses in the corridor and the extent to which deployment of traffic signal
priority system affects the overall traffic flow characteristics in the corridor.
The overall concept of the evaluation framework is explained in the following diagram,
which is an outcome of the past research done by James Chang (Chang, May 2002) at
Virginia Tech. This diagram relates the different aspects of the deployment to the
objectives of the stakeholders. The evaluation framework considers the environment
34

surrounding the deployment of the traffic signal priority systems in order to summarize the
positive and negative impacts on the traffic flow characteristics along the study corridor.
Stakeholders w/ differing objectives
Varying operational environments
Strategies
EVALUATION PLAN
Performance
Given / Fixed
Test Alternatives Measure Results
Figure 1: Framework Concept
As it can be seen from the figure, the evaluation framework intends to assess the
deployment strategies in context to various operational environments and various
objectives stakeholders hope to address. In order to assess the performance of a chosen
strategy as ‘input’ the objectives and the operating environment are taken as ‘given/fixed’
and is evaluated to get the impacts on the present scenario as an ‘output’.
The evaluation framework helps in establishing the measures to be taken in order to
evaluate all the objectives so as to what data is to be collected and when. This is the
primary step in formulation of the evaluation framework. As we are doing this, the current
operational environment i.e. various signal timing plans, traffic flow characteristics and
transit scheduling, etc, are taken as given and the strategies are formulated according to
35

that. The central element of the framework, the evaluation plan, specifies how the
performance of each strategy in terms of meeting stated objectives in the specific
environment would be quantified.
In case of U.S.1, two major stakeholders are Virginia Department of Transportation
(VDOT) and Fairfax County. VDOT is responsible for the traffic operational behavior i.e.
traffic flows, signal timings, etc. while Fairfax County provides local public transit service
through Fairfax Connector. As both try to use the same facility to achieve individual goals
it is quite understandable that they have different objectives behind the deployment of the
traffic signal priority along U.S.1. In order to formulate the evaluation framework it is very
important to understand their individual concerns and objectives behind the deployment.
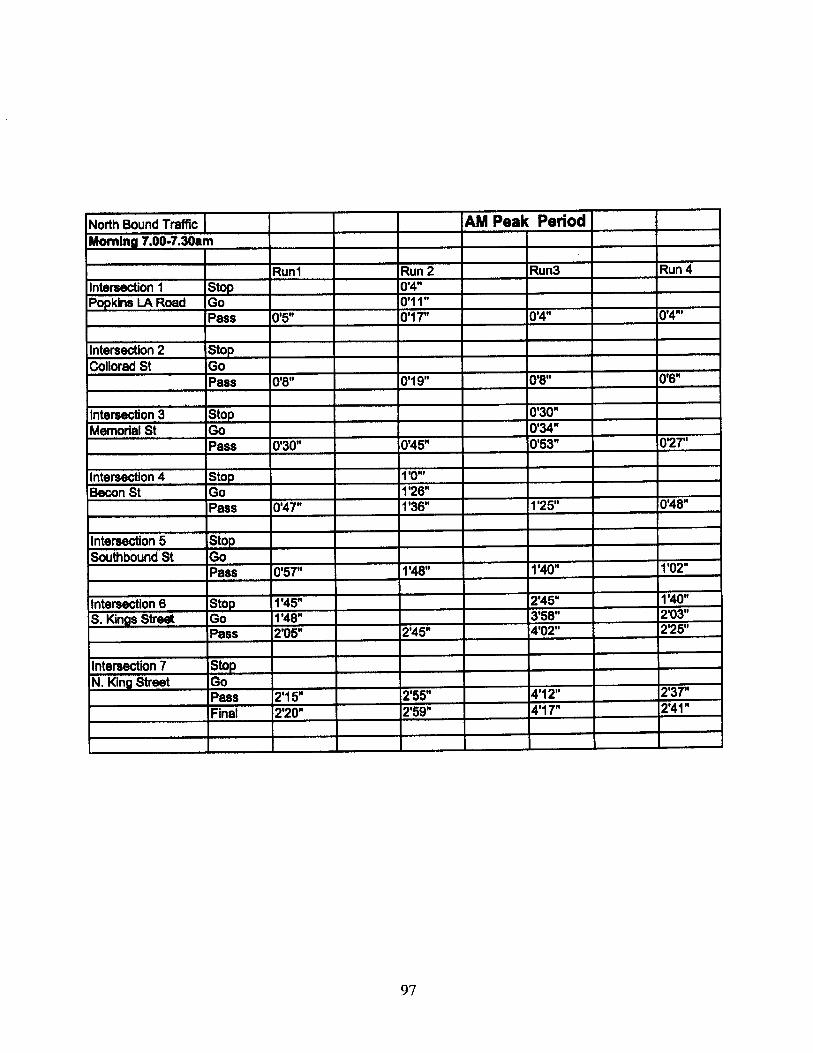
U.S.1 or Richmond Highway is a major arterial in Northern Virginia. The study corridor
comprises of seven signalized intersections in a span of 1.3 miles between Popkins Lane on
the southern side and North Kings Highway/Shields Avenue on north. This facility is used
as an access to the capital belt way and the Washington Metro. Due to heavy traffic
volumes and very closely spaced signalized intersections, the operational skills of traffic
engineers are at highest demand in peak hours. Also, there is a centrally located fire station,
which uses the facility to serve the adjoining areas.
As VDOT tries to accommodate these various facility users they have their specific
objectives and concerns behind the deployment of traffic signal priority systems. First as
objectives, they hope that the deployment will help in facilitating uniform traffic flow
behavior thorough the corridor minimizing the differential operating speed between
automobiles and transit buses. Also, if highly occupied transit buses are accommodated in
normal traffic flow then higher person throughput can be achieved and person delay can be
minimized along the main line. Usually transit buses fall away from the normal progressing
traffic due to their low operating speed and dwell times, if the offsets can be
accommodative enough then the number of stops and intersection delay for the buses can
be reduced making them a part of the progressing traffic. Also, the deployment of traffic
signal preemption and priority will improve safety aspect of the corridor allowing
36

emergency vehicles a right of way over transit as well as other vehicles. At the same time
they have their own concerns so as not to adversely affect the traffic operations in the
corridor. The deployment may increase the person delay and queue lengths on the cross
streets. It may also disturb the synchronized operations of the signal timing plans for all
theses intersections, this is very important aspect as all the intersections are very closely
spaced along the main line. Secondly, operational limitations of priority systems due to
issues like near side and far side bus stops and geometric demands can be subject to debate
due to their detrimental effect on the signal operations. So it is quite understandable that
VDOT has a conservative approach towards the deployment strategy. This is a pilot project
evaluated by Virginia Tech to help VDOT address all their objectives.
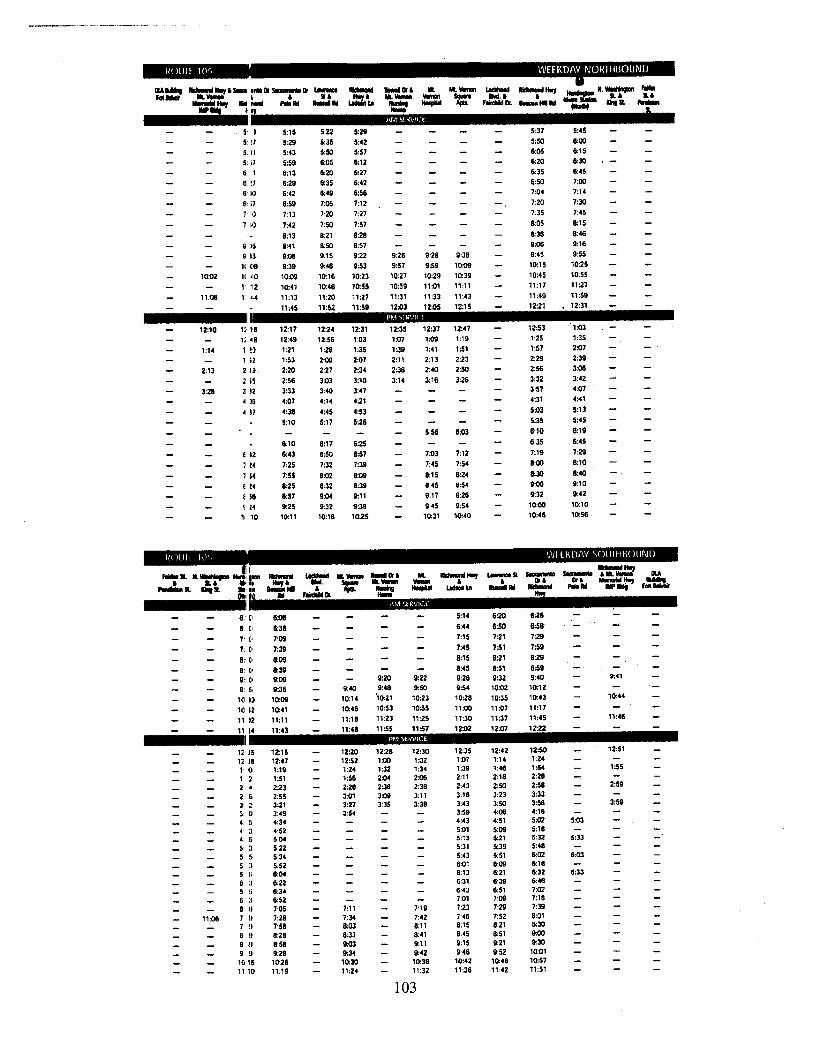
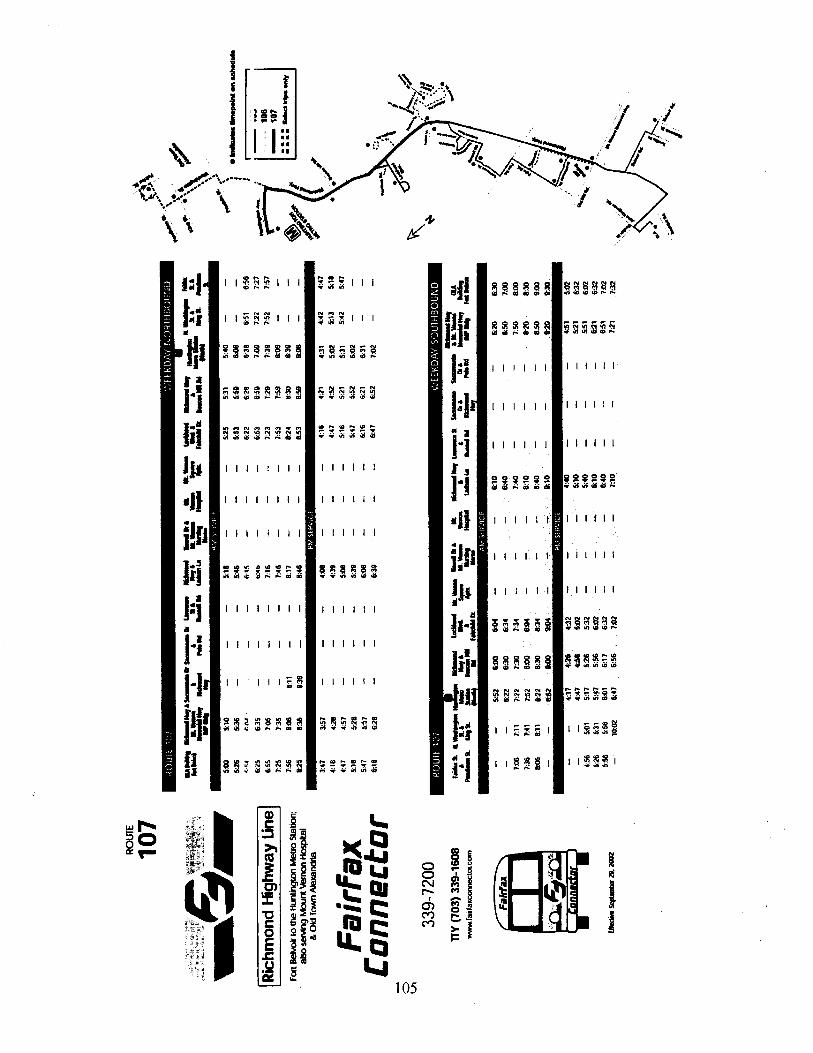
Fairfax County provides the local public transit system through Fairfax Connector. Three
of their major service routes use the selected corridor to serve the residential areas on the
southern side with an access to the Washington Metro at Huntington metro station. Being
primary stakeholders in the project, they also have their own objectives and concerns
behind deployment of the traffic signal priority system. As objectives, they hope to
improve the service reliability and efficiency along the corridor. Also, if the average
operating speed along the corridor is increased then it is easier to maintain the constant
headway and achieve higher operating efficiency. If the number of stops at the intersections
is minimized then it can increase the fuel efficiency while reducing the operating costs. A
Traffic signal priority system will also help in achieving improved total travel times and
will increase the customer satisfaction.
As can be seen, there may be many different dimensions to a single objective. Selection of
an appropriate perspective and corresponding measures can be facilitated by a systematic
evaluation plan. The following section will further examine the evaluation plan and how it
can be tailored to the objectives and environment.
37

3.2 Evaluation Plan As discussed previously, the evaluation plan embodies the evaluation objective, in this case
the measurement of performance impacts resulting from various traffic signal priority
strategies. Appropriate measures of effectiveness, both quantitative and qualitative, can be
established for each system objective to be assessed in the evaluation. The following table
shows all the objectives and the different measures used to quantify them (Chang, 2002).
Depending on the particular environment and objectives, the most appropriate measures of
effectiveness are chosen from the proposed measures.
38

Objective Measure Measurement 1.0 Bus Service
Reliability (transit schedule adherence)
1.1 On Time Performance % of arrivals in on-time window at timepoint(s)
1.2 Time Reliability Standard deviation of elapsed time between timepoints /
endpoints 1.3 Perceived OTP Survey measure of rider opinion 1.4 Spacing Maximum headway measured at
timepoint(s) 1.5 Arrival Reliability Standard deviation of delta
(actual time vs. scheduled) at timepoint(s)
2.0 Bus Efficiency (transit travel time
savings)
2.1 Run Time Elapsed time(mean) between start and end points
2.2 95%-ile RT 95%-ile elapsed time between start and end points
2.3 Trip Time Weighted passenger time on board / in-vehicle
2.4 Perceived Travel Time Survey of change in riders’ opinions before & after
3.0 Other Traffic-Related Impacts
3.1 Overall Delay Delay by [corridor/intersection], [person/vehicle]
3.2 # of stops Stops by [corridor/intersection], [person/vehicle]
3.3 Mainline Travel Time %-ile / average operating speed 3.4 Cross Street Delay Maximum / 95%-ile delay,
average delay 3.5 Fuel Consumption /
Emissions Model output for corridor,
average per vehicle 3.6 Overall System
Efficiency Throughput achieved vehicles
per hour, persons per hour 3.7 Intersection Safety Red light running / accident
frequency Table 2: Evaluation Measures
This evaluation plan addresses the different objectives and measures them quantitatively.
The data needed for this evaluation plan is collected on the field by a team of research
students form Virginia Tech. This evaluation plan will be implemented through simulation
using VISSIM as a simulation tool.
39

3.2.1 Application to the Objectives
Building on prior discussion about the evaluation plan and framework, it is now important
to apply this evaluation plan to various objectives to state the hypothesis that we intend to
examine in this research. This application will be studied in two major categories: transit
related and other traffic related.
3.2.1.1 Application to Transit Related Objectives
The framework and plan will be applied to the evaluation of bus service reliability impacts
resulting from various traffic signal priority strategies. A theory is posited by Chang
(Chang, 2002) which establishes bus transit reliability as a function of four major factors;
this theory attempts to apply the insights of Markowitz (Markowitz, 1959) in Modern
Portfolio Theory to analysis and optimization of transit reliability (Chang, 2002). So these
objectives are addressed in two major categories: Bus service reliability and Bus efficiency.
This framework presents these two as a function of several factors mentioned as different
measures in the table. As far as service reliability is considered, factors take in account the
waiting time for the passengers at the bus stops and the schedule adherence of the transit
buses. This has a direct effect on the quality of the transit service as perceived by the riders.
These factors also account for the spacing and the schedule adherence of the bus. In case of
the bus efficiency, the factors concentrate on the total travel time for a passenger for a
single trip measuring the travel time between end points.
The selection of these measures under the given conditions on the U.S.1 corridor lead to
the following hypotheses to be examined
Hypothesis #1
Provision of priority to Fairfax Connector buses will be associated with higher bus service
reliability.
40
Hypothesis #2 Provision of priority to Fairfax Connector buses will be associated with higher bus service efficiency. 3.2.1.2 Application to Other Traffic Related Objectives
The framework presents other traffic related impacts as a function of several factors
including the delays to mainline as well as side streets. These factors concentrate on
intersection delays and person delays. This includes the average operating speed and
number of stops on the main line and delays and increase in queue lengths on the side
streets. This evaluates impacts on the other traffic as a result of deployment of traffic signal
priority system along U.S.1.
The selection of these measures under the given conditions on the U.S.1 corridor gives rise
to the following hypotheses to be examined: -
Hypothesis #3
Provision of priority to Fairfax Connector buses will be associated with little to no impact
on the other traffic conditions such as increased queue lengths on side streets.
3.3 Summary
This chapter has presented the evaluation framework and evaluation plan, which will be
implemented using the data collected on the field and VISSIM as a simulation tool. The
following chapter describes the data collection, operational environment and the strategies
of deployment.
41
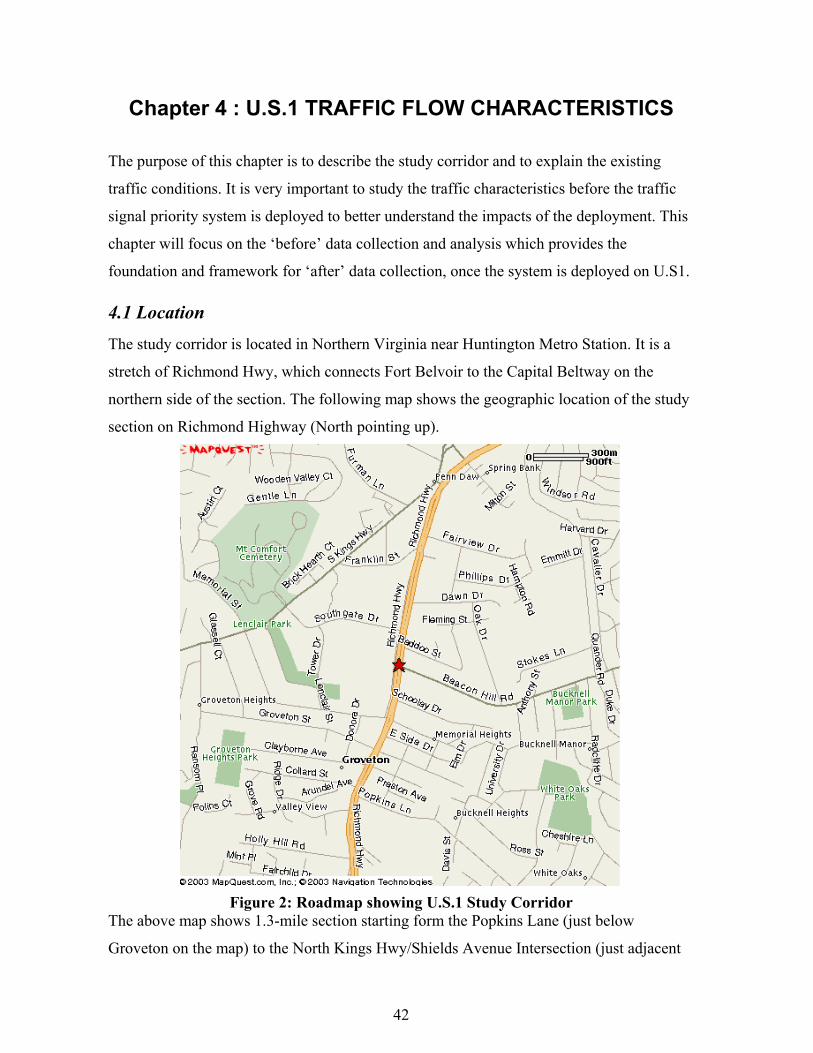
Chapter 4 : U.S.1 TRAFFIC FLOW CHARACTERISTICS
The purpose of this chapter is to describe the study corridor and to explain the existing
traffic conditions. It is very important to study the traffic characteristics before the traffic
signal priority system is deployed to better understand the impacts of the deployment. This
chapter will focus on the ‘before’ data collection and analysis which provides the
foundation and framework for ‘after’ data collection, once the system is deployed on U.S1.
4.1 Location
The study corridor is located in Northern Virginia near Huntington Metro Station. It is a
stretch of Richmond Hwy, which connects Fort Belvoir to the Capital Beltway on the
northern side of the section. The following map shows the geographic location of the study
section on Richmond Highway (North pointing up).
Figure 2: Roadmap showing U.S.1 Study Corridor The above map shows 1.3-mile section starting form the Popkins Lane (just below
Groveton on the map) to the North Kings Hwy/Shields Avenue Intersection (just adjacent
42

to the Penn Daw on the map). This study section has seven closely spaced signalized
intersections, which are listed below going from south to north.
1. Popkins Lane @ U.S. 1
2. Collard Street @ U.S. 1
3. Memorial Drive @ U.S. 1
4. Beacon Hill Road @ U.S. 1
5. Southgate Drive @ U.S. 1
6. South Kings Highway @ U.S. 1
7. North Kings Highway/ Shields Avenue @ U.S. 1. The following figure shows the
study segment and all the seven intersection in the Synchro file.
43

Figure 3: Study segment in Synchro file
44
4.2 Data Collection
The purpose of data collection is to develop an understanding of the traffic flow
characteristics along the study corridor. In order to evaluate the impacts of traffic signal
priority systems, it is very important to understand the existing traffic behavior along the
corridor. The data collection effort feeds into the evaluation framework described in the
previous chapter and provides the complete picture of existing conditions on U.S.1
In this research, the field study was done for following objectives:
• To collect ‘before’ data for the field study as a part of U.S.1 Traffic Signal Preemption
and Priority Project
• To provide a framework for field data collection for ‘after’ data collection, when the
system is deployed.
• To use a simulation model (VISSIM) with actual field data to calibrate the model.
Data collection was done in March and April 2002 by a team of researchers at Virginia
Tech involving four graduate students under guidance of the principal investigator. Data
was collected and analyzed in two parts namely ‘Traffic Characteristics Analysis – U.S.1:
Base Case’ and ‘Transit Impact Evaluation – U.S.1’
4.2.1 Traffic Characteristics Analysis – U.S.1: Base Case This part of data collection was done in order to examine the existing situation or base case
before the effects of priority are analyzed. Table 3 shows the framework used for this part
of data collection in terms of data elements and data collection. Table 4 shows data
collection time periods.
45

Measure
Data Elements
Data Sources
Before Collection
Analysis
Mainline Travel Time & Number of Automobile
Stops (Platoon w/o bus)
Run time between Popkins Lane & Shields (North Kings Hwy)
Field observations on U.S.1 (Stop Watch)
Complete Complete
Mainline Travel Time & Number of Automobile
Stops (Platoon with bus)
Run time between Popkins Lane & Shields (North Kings Hwy)
(Comparative data profiles for Bus and Auto under similar
Traffic Scenario)
Field observations on U.S.1 (Stop Watch)
Complete Complete
Cross –Street Delay
1.Average Queue Lengths
Field observations on U.S.1 (Stop Watch)
Complete Complete
Table 3: Traffic Characteristics Analysis – U.S.1: Base Case
AM Peak Period 7 to 9 AM Midday Peak Period 12 to 2 PMPM Peak Period 4 to 6 PM
Table 4: Data Collection Time Periods
4.2.1.1 Mainline Travel Time (Only Automobiles)
This part of field data collection examines the average operating speeds of automobiles on
U.S.1, Number of stops for a platoon, total control delay and total travel time along the
corridor were tabulated. Data collection was done based on a ‘floating car’ methodology by
having a team of researchers riding an automobile along the corridor being a part of normal
46

traffic stream, while, data was collected manually using a stopwatch and paper-pencil.
Following table shows the field observation run scenarios,
Time Direction Of Travel Number of Runs Morning Peak North bound 10
AM South bound 10 Evening Peak North bound 10
PM South bound 10
Table 5: Data Collection Scenarios for Mainline Travel Time
As depicted in above table, data collection was done in peak periods in both directions
along U.S.1. Tables 6,7,8 & 9 depict run summaries in AM and PM Peak periods for the
base case.
47
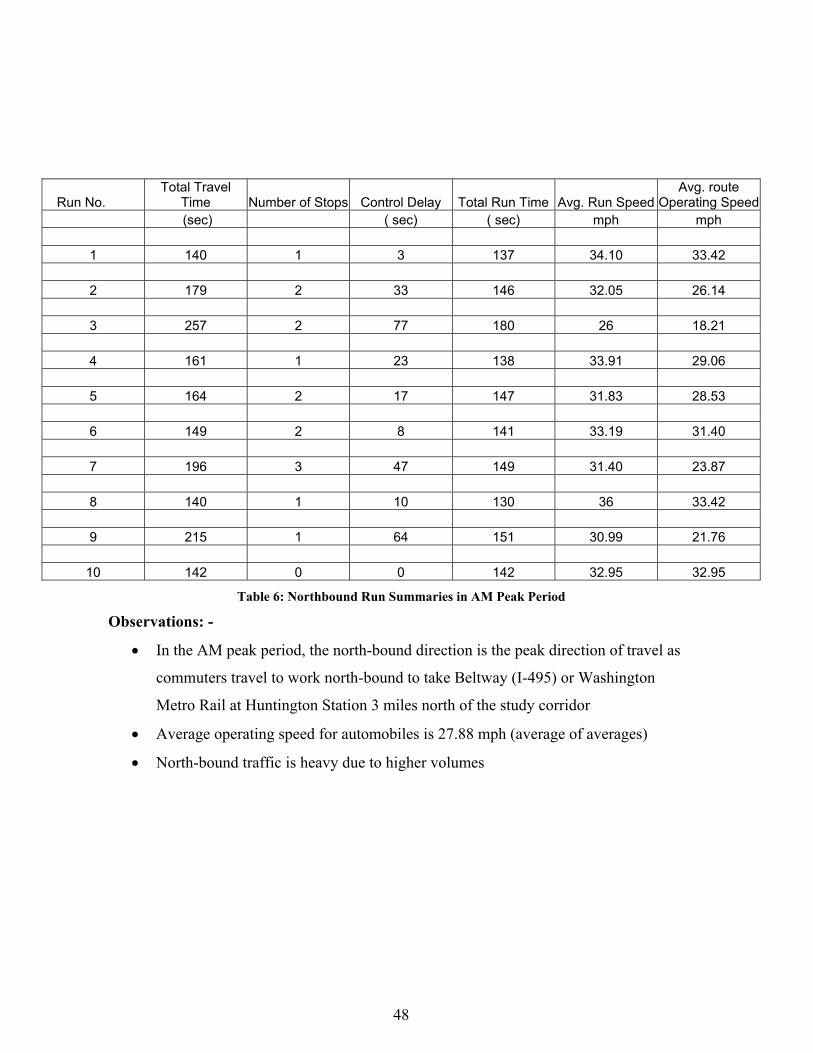
Run No. Total Travel
Time Number of Stops Control Delay Total Run Time Avg. Run SpeedAvg. route
Operating Speed (sec) ( sec) ( sec) mph mph 1 140 1 3 137 34.10 33.42 2 179 2 33 146 32.05 26.14 3 257 2 77 180 26 18.21 4 161 1 23 138 33.91 29.06 5 164 2 17 147 31.83 28.53 6 149 2 8 141 33.19 31.40 7 196 3 47 149 31.40 23.87 8 140 1 10 130 36 33.42 9 215 1 64 151 30.99 21.76
10 142 0 0 142 32.95 32.95
Table 6: Northbound Run Summaries in AM Peak Period
Observations: -
• In the AM peak period, the north-bound direction is the peak direction of travel as
commuters travel to work north-bound to take Beltway (I-495) or Washington
Metro Rail at Huntington Station 3 miles north of the study corridor
• Average operating speed for automobiles is 27.88 mph (average of averages)
• North-bound traffic is heavy due to higher volumes
48

Run No. Total Travel
Time Number of
Stops Control Delay Total Run Time Avg. Run Speed Avg. route Operating
Speed (sec) ( sec) ( sec) mph mph 1 130 0 0 130 36 36 2 244 2 113 131 35.72 19.18 3 250 3 101 149 31.40 18.72 4 114 0 0 114 41.05 41.05 5 150 1 16 134 34.92 31.2 6 120 0 0 120 39 39 7 238 1 109 149 31.40 19.66 8 140 1 31 109 42.93 33.42 9 112 0 0 112 41.78 41.78
10 120 0 0 142 32.95 39
Table 7: Southbound Run Summary-AM Peak Period
Observations: -
• In the AM peak period, south-bound traffic is less heavy as compared to north-
bound traffic
• Average operating speed is 31.90 mph (average of averages)
49

Run No.
Total Travel Time
Number of Stops
Control Delay
Total Run Time Avg. Run Speed
Avg. route Operating Speed
(sec) ( sec) ( sec ) mph mph 1 135 0 0 135 34.66 34.66 2 231 2 81 150 31.2 20.25 3 160 2 9 151 30.99 29.25 4 211 1 48 163 28.71 22.18 5 236 2 77 159 29.43 19.83 6 226 2 79 147 31.83 20.70 7 138 0 0 149 31.40 33.91 8 195 2 44 151 30.99 24 9 203 1 51 152 30.78 23.05
10 222 1 76 142 32.95 21.08
Table 8: Southbound Run Summary-PM Peak Period
Observations: -
• In the PM peak period, the south-bound direction is peak travel direction as
commuters travel back from work
• In the PM peak period, directional distribution is more balanced as commercial
development around study corridor comes in to play
• Average operating speed is 24.89 mph (overall average)
• Average operating speed is lower due to heavy traffic volumes
50

Run No. Total Travel
Time Number of Stops Control Delay Total Run Time Avg. Run Speed Avg. route
Operating Speed (sec) ( sec) ( sec) mph mph 1 294 3 134 160 29.25 15.91 2 216 2 28 188 24.89 21.66 3 128 0 0 128 36.56 36.56 4 143 1 5 138 33.91 32.72 5 275 3 61 214 21.86 17.01 6 163 2 14 149 31.40 28.71 7 155 2 13 149 31.40 30.19 8 142 0 0 142 32.95 32.95 9 159 1 10 149 31.40 29.43
10 180 2 38 142 32.95 26
Table 9: Northbound Run Summary-PM Peak Period
Observations: -
• In PM peak period, directional distribution is more balanced than in AM peak
period
• Average operating speed is 27.11 mph (overall average)
51
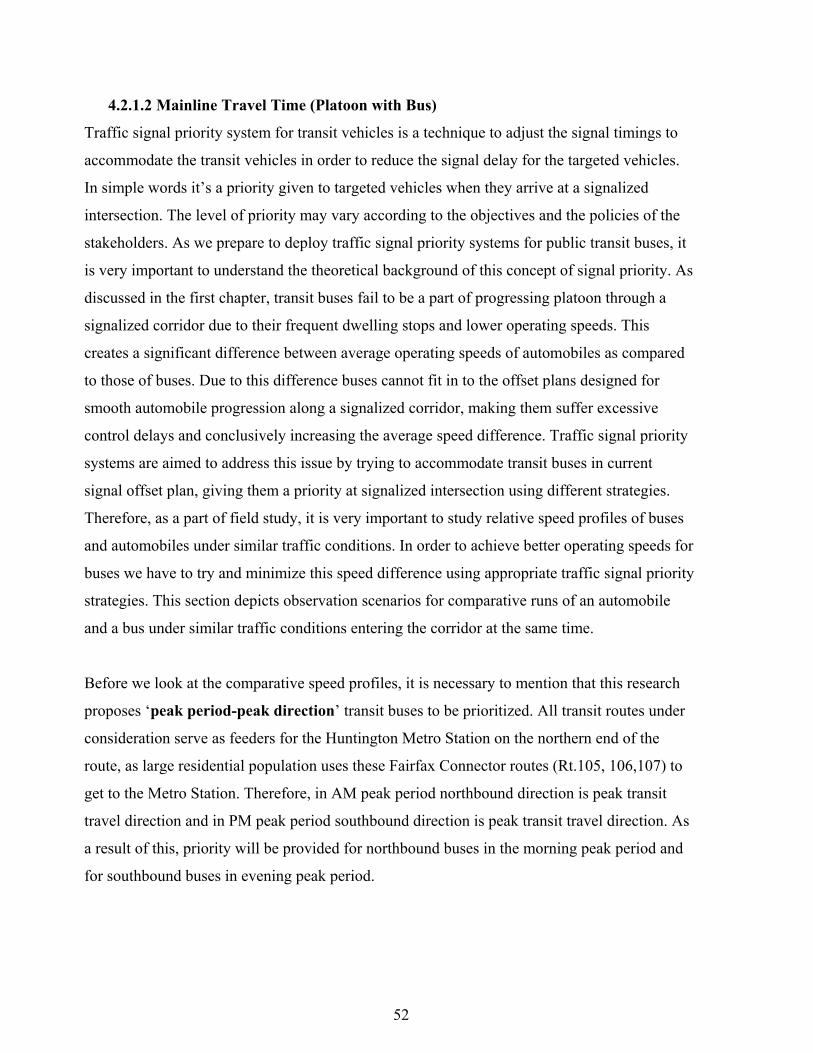
4.2.1.2 Mainline Travel Time (Platoon with Bus)
Traffic signal priority system for transit vehicles is a technique to adjust the signal timings to
accommodate the transit vehicles in order to reduce the signal delay for the targeted vehicles.
In simple words it’s a priority given to targeted vehicles when they arrive at a signalized
intersection. The level of priority may vary according to the objectives and the policies of the
stakeholders. As we prepare to deploy traffic signal priority systems for public transit buses, it
is very important to understand the theoretical background of this concept of signal priority. As
discussed in the first chapter, transit buses fail to be a part of progressing platoon through a
signalized corridor due to their frequent dwelling stops and lower operating speeds. This
creates a significant difference between average operating speeds of automobiles as compared
to those of buses. Due to this difference buses cannot fit in to the offset plans designed for
smooth automobile progression along a signalized corridor, making them suffer excessive
control delays and conclusively increasing the average speed difference. Traffic signal priority
systems are aimed to address this issue by trying to accommodate transit buses in current
signal offset plan, giving them a priority at signalized intersection using different strategies.
Therefore, as a part of field study, it is very important to study relative speed profiles of buses
and automobiles under similar traffic conditions. In order to achieve better operating speeds for
buses we have to try and minimize this speed difference using appropriate traffic signal priority
strategies. This section depicts observation scenarios for comparative runs of an automobile
and a bus under similar traffic conditions entering the corridor at the same time.
Before we look at the comparative speed profiles, it is necessary to mention that this research
proposes ‘peak period-peak direction’ transit buses to be prioritized. All transit routes under
consideration serve as feeders for the Huntington Metro Station on the northern end of the
route, as large residential population uses these Fairfax Connector routes (Rt.105, 106,107) to
get to the Metro Station. Therefore, in AM peak period northbound direction is peak transit
travel direction and in PM peak period southbound direction is peak transit travel direction. As
a result of this, priority will be provided for northbound buses in the morning peak period and
for southbound buses in evening peak period.
52

Tables 10 and 11 show comparative travel characteristics for a transit and non-transit vehicle
under similar traffic conditions: -
Run 1 Run 2 Run 3 Run 4 Run 5Transit Non-Transit Transit Non-Transit Transit Non-Transit Transit Non-Transit Transit Non-Transit
Parameter Vehicle Vehicle Vehicle Vehicle Vehicle Vehicle Vehicle Vehicle Vehicle VehicleTotal Travel Time(sec) 302 210 392 200 345 148 305 123 278 120
Number of Stops 7 2 7 2 6 1 6 0 4 0
Control Delay(sec) 31 87 40 64 48 17 35 0 53 0
Total Dwell Time(sec) 77 NA 91 NA 104 NA 1 NA 65 NA
Total Delay 108 87 131 64 152 17 36 0 118 0
Total Run Time 194 123 261 136 193 131 269 123 160 120
Avg. Run Speed(mph) 24.1237113 38.04878 17.931034 34.411765 24.248705 35.725191 17.39777 38.0487805 29.25 39
Avg. route Operating Speed(mph) 15.4966887 22.285714 11.938776 23.4 13.565217 31.621622 15.344262 38.0487805 16.834532 39
Table 10: Comparative Travel Characteristics-NB-AM Peak Period
Table 11 : Comparative Travel Characteristics-SB-PM Peak Period
Observations: -
perating Speed for Transit Vehicles is 13.9 mph
ph
Run 1 Run 2 Run 3 Run 4 Run 5Transit Non-Transit Transit Non-Transit Transit Non-Transit Transit Non-Transit Transit Non-Transit
Parameter Vehicle Vehicle Vehicle Vehicle Vehicle Vehicle Vehicle Vehicle Vehicle VehicleTotal Travel Time(sec) 370 150 325 156 431 225 302 215 361 165
Number of Stops 5 0 7 0 6 1 4 1 4 0
Control Delay(sec) 22 0 52 0 170 25 56 17 158 40
Total Dwell Time(sec) 90 NA 62 NA 50 NA 40 NA 56 NA
Total Delay 112 87 114 64 220 17 96 0 214 0
Total Run Time 258 63 211 92 211 208 206 215 147 165
Avg. Run Speed(mph) 18.1395349 74.285714 22.180095 50.869565 22.180095 22.5 22.718447 21.7674419 31.836735 28.363636
Avg. route Operating Speed(mph) 12.6486486 31.2 14.4 30 10.858469 20.8 15.496689 21.7674419 12.963989 28.363636
• Average O
• Average Operating Speed for Non-Transit Vehicles is 28.7 m
53

4.2.1.3 Side Street Delay
One of the primary concerns of VDOT upon deployment of signal priority on U.S.1 is the
ses
order to measure the Side Street delay the parameter used in this research is
o the
s
red
ings Highway and U.S. 1 is a critical intersection in AM peak period due to its
k period due to
AM peak based on the field
ill Road and U.S.1, being a commercial activity center, is critical in Mid-day
igures 4 to 11 show the intersection queue lengths at these critical intersections over the
potential negative impact on non-transit traffic, especially on the side streets. This data
collection element concentrates on negative impacts of provision of priority to transit bu
on other vehicles on Side Streets, as the green extension will take some part of their green
time-share in the signal timing plan.
In
measurement of queue lengths on the Side Streets. For this purpose, according t
volume counts and based on field observations specific intersections were identified a
critical intersections at particular times of day. The following observations were conside
in choosing the critical intersection. In simulation, queue lengths on all side streets are
measured.
• South K
heavy traffic volumes from South Kings Highway turning onto U.S.1
• North Kings Highway and U.S.1 is a critical intersection in PM pea
heavy traffic turning onto U.S.1 from North Kings Highway
• Memorial Drive and U.S.1 is a critical intersection in the
observations
• Beacon H
and PM peak period
F
period of 11 consecutive signal cycles.
54
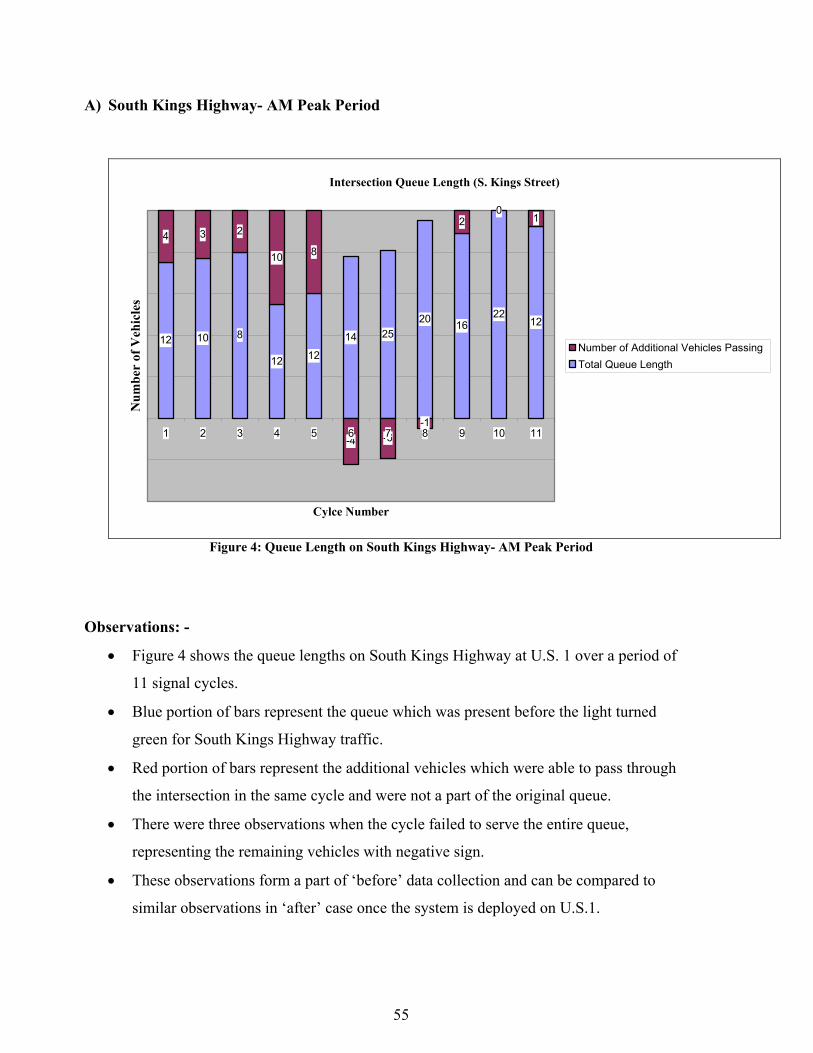
A) outh Kings Highway- AM Peak Period S
Intersection Queue Length (S. Kings Street)
12 10 8
12 12
14 2520 16
2212
4 3 2
10 8
-4 -6-1
20
1
1 2 3 4 5 6 7 8 9 10 11
Cylce Number
Num
ber
of V
ehic
les
Number of Additional Vehicles Passing Total Queue Length
Figure 4: Queue Length on South Kings Highway- AM Peak Period
bservations: -
hows the queue lengths on South Kings Highway at U.S. 1 over a period of
• rs represent the queue which was present before the light turned
• nal vehicles which were able to pass through
• e,
• n and can be compared to
O
• Figure 4 s
11 signal cycles.
Blue portion of ba
green for South Kings Highway traffic.
Red portion of bars represent the additio
the intersection in the same cycle and were not a part of the original queue.
There were three observations when the cycle failed to serve the entire queu
representing the remaining vehicles with negative sign.
These observations form a part of ‘before’ data collectio
similar observations in ‘after’ case once the system is deployed on U.S.1.
55

B) Memorial Drive- AM Peak Period
ng right on red, it is necessary to consider a queue
he
In order to consider the vehicles turni
length based on lane groups because right turn on red is a function of acceptable gap on t
main street and it can vary according to time of the day. Figure 5 and 6 show queue lengths
observed on Memorial Drive in two lane groups.
Memorial Drive (left only )
2
4 4
7
23
9
2
7
451
0
3
3
1
2
0
0
1
1
1
0
2
4
6
8
10
12
1 2 3 4 5 6 7 8 9 10 11
Cycle Number
Num
ber
of V
ehic
les
Number of Additional Vehicels Passing
Total Queue Length
Figure 5: Queue Length on Memorial Drive- AM Peak Period
Observations: -
ph shows the queue length on Memorial Drive (eastbound left turn only lane)
• was present before the light turned
• nal vehicles which were able to pass through
• Above gra
onto U.S. 1 over a period of 11 signal cycles
Blue portion of bars represent the queue which
green for South Kings Highway traffic
Red portion of bars represent the additio
the intersection in the same cycle and were not a part of the original queue
56

Memorial Drive (thro+right )
4
6
98 8
3
5
87
8
3
0
0
0
0
4
4 0
2
21
0
0
2
4
6
8
10
12
14
1 2 3 4 5 6 7 8 9 10 11
Cycle Number
Num
ber
of V
ehic
le
Number of Additional Vehicles PassingTotal Queue Length
Figure 6: Queue Length on Memorial Drive- AM Peak Period
bservations: -
hows the queue length on Memorial Drive (eastbound through+right turn
• t before the light turned
• additional vehicles which were able to pass through
O
• Figure 6 s
lane) to get on to U.S. 1 over a period of 11 signal cycles
Blue portion of bars represent the queue which was presen
green for Memorial Drive traffic
Red portion of bars represent the
the intersection in the same cycle and were not a part of the original queue
57
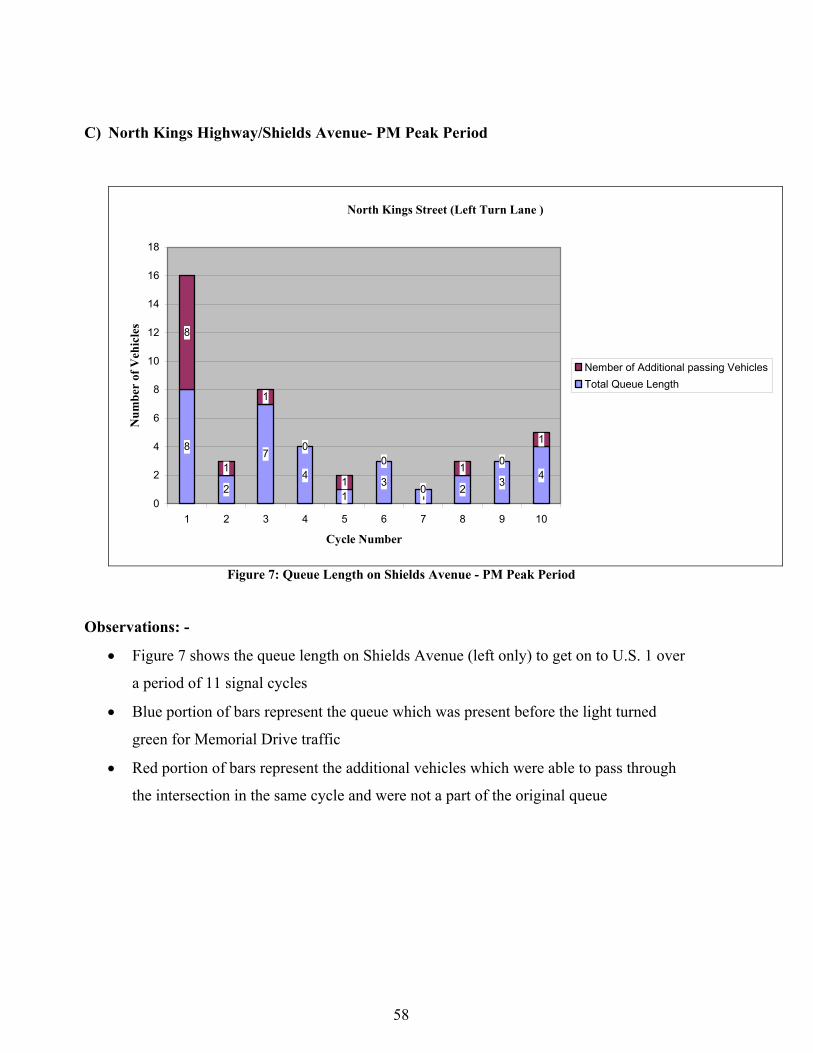
C) North Kings Highway/Shields Avenue- PM Peak Period
North Kings Street (Left Turn Lane )
8
2
7
4
13
12 3
4
8
1
1
0
1
0
0
1 0
1
0
2
4
6
8
10
12
14
16
18
1 2 3 4 5 6 7 8 9 10
Cycle Number
Num
ber
of V
ehic
les
Nember of Additional passing VehiclesTotal Queue Length
Figure 7: Queue Length on Shields Avenue - PM Peak Period
bservations: -
hows the queue length on Shields Avenue (left only) to get on to U.S. 1 over
• t the queue which was present before the light turned
• additional vehicles which were able to pass through
O
• Figure 7 s
a period of 11 signal cycles
Blue portion of bars represen
green for Memorial Drive traffic
Red portion of bars represent the
the intersection in the same cycle and were not a part of the original queue
58

North Kings Street (Thro+right )
9 10 9 95
7
2
812
10
6
15
812
3
9
10
3
11
9
0
5
10
15
20
25
30
1 2 3 4 5 6 7 8 9 10
Cycle Number
Num
ber
of P
assi
ng V
ehic
les
Number of additional passing Vehicles Total Queue Length
Figure 8: Queue Length on Shields Avenue - PM Peak Period
bservations: -
hows the queue length on North Kings/Shields Avenue (through+right) to get
• was present before the light turned
• additional vehicles which were able to pass through
O
• Figure 8 s
on to U.S. 1 over a period of 11 signal cycles
Blue portion of bars represent the queue which
green for Memorial Drive traffic
Red portion of bars represent the
the intersection in the same cycle and were not a part of the original queue
59

D) Beacon Hill Road –PM Peak Period
Beacon Hill (westbound left only )
2
4 4
7
23
9
2
7
451
0
3
3
1
2
0
0
1
1
1
0
2
4
6
8
10
12
1 2 3 4 5 6 7 8 9 10 11
Cycle Number
Num
ber o
f Ve
hicl
es
Number Of Additonal passing Vehicles Total Queue Length
Figure 9: Queue Length on Beacon Hill Road - PM Peak Period
bservations: -
hows the queue length on Beacon Hill Road (left only) to get on to U.S. 1
• queue which was present before the light turned
• additional vehicles which were able to pass through
O
• Figure 9 s
over a period of 11 signal cycles
Blue portion of bars represent the
green for Memorial Drive traffic
Red portion of bars represent the
the intersection in the same cycle and were not a part of the original queue
60

Beacon H l Road( through+right)West bound
46
98 8
35
87
8
3
0
0
00
4
4 0
22
1
0
0
2
4
6
8
10
12
14
1 2 3 4 5 6 7 8 9 10 11
Cycle Number
Num
ber o
f Veh
icle
s
Number of Additional passing Vehicles Total Queue Length
Figure 10: Queue Length on Beacon Hill Road - PM Peak Period
il
B con Hill Road East Bound
9
35
129 8 7
57
10
11
4
7
12
1211
10
7
9
10
0
5
10
15
20
25
30
1 2 3 4 5 6 7 8 9 10
Cycle Number
Num
ber
Of V
ehic
les
Number of Additional passing Vehicles
Total Queue Length
Figure 11: Queue Length on Beacon Hill Road - PM Peak Period
ea
61

4.2.2 Transit Impact Evaluation In order to model the transit service accurately, it is necessary to have an understanding
about transit network and its characteristics.
Table 12 shows the data collection framework used for transit data collection in terms of
data element measures and their sources.
Table 12: Transit Impact Evaluation
Field Study Measure
Data Elements
Data Sources Before
Collection After
Collection
*Simulation
Model Total Corridor Travel Time
Run time between Popkins Lane & Shields (North Kings
Hwy)
1.Field Observations on
U.S.1
Complete To be Completed VISSIM
On Time Performance at Scheduled
checks
ScheDeviance at
Road.
Connector Bus dules
2. Field
U.S.1
mpleted VISSIM dule 1.Fairfax Complete To be Co
time Beacon Hill Sche
Observations on
d On-Off Counts 1.Field WeightePassenger me in the Corridor
on observed bus runs
observations on U.S.1
Complete To be Completed VISSIM Ti
Cross-Street Delay
(Non-Transit Vehicles)
Queue Lengths
major Intersections
1.Field n
U.S.1
Complete To be Completed VISSIM on side streets at observations o
62

Comments: -
• e t re data collection has been done and that
pro cellent fra for after on,
• s simulation tool VISSIM
• All th ures shown in this table have been explained in the earlier section in
co ta co it and veh ghted
pa in the c
4.2.2.1 Weighted Passenger Tim
f s buses with priority at signalized intersections
t if trans cles, with mu er occupancy than passenger cars, are given
eren er
iency of tem can improve substantially. Therefore, it is very important to make
e that w ority to buses traveling in peak direction and having occupancy
above a minimum threshold value in order to justify priority. As mentioned in section
4.3.1.2, this research proposes signal priority for ‘Peak period -Peak direction’ buses
nly. So, priority is proposed for northbound buses in AM peak period and southbound
uses in PM peak period.
he study corridor consists of three Fairfax Connector routes (105,106,107). Following
bles show the on-off counts collected on the field which support the above said notion of
eak period-Peak Direction’
As shown in abov able all the befo
vides an ex
deployed in U.S.1
This research use
e meas
mework d iata collect once the system is
mparative da llection for trans
orridor.
non- ransitt icles except for wei
ssenger time
e One o
is tha
the primary reason
it vehi
to provide transit
ch high
pref tial treatment und such strategies, the person throughput as well as the fuel
effic
sur
the sys
e provide pri
o
b
T
ta
‘P
63

Route 1
orthbound in AM Peak Period
Table 13: Occupancy Data for Rt.105 -NB-AM Peak Period
omments: -
er Ladson Road as shown in blue in above table • Occupancy through study corridor is 30 which is 60% (Bus Capacity = 50) • Table also shows schedule deviance • Bus is 215 seconds behind schedule before entering the corridor
05 (Pole Road to Huntington Metro)
N
C
• Study Corridor starts just aft
me Go time On Off Schedule Time Deviance OccupancyCount Count
Pole Road 1 7:39:40 7:37:00 0:02:40 1
2 7:41:25 7:41:42 3 011
1 7:43:30 7:43:38 1 0
15
24
5 7:54:00 7:54:30 7 07:55:25 7:55:40 3 0
7 7:56:10 0 08 7:56:30 0 09 7:59:30 7:59:48 1 0
311 8:01:35 8:01:42 1 0
8:04:20 0 08:04:50 0 0
6 8:05:20 8:02:41 0 37 8:06:20 0 0
Beacon Hill Road 8:06:55 8:07:05 2 0 301 8:07:45 0 02 0 03 8:09:25 8:09:40 0 34 8:10:35 0 05 8:11:15 0 06 8:16:45 8:17:10 0 27 8:18:00 0 08 8:18:10 0 0
Huntington Metro 8:19:15 0 22 8:15:00 0:04:15 22
Name of the stop Initial No. of Stop tiPassengers
1 7:40:25 7:40:59 5 0
Sacrmento Drive 7:42:15 7:42:30 2 0 7:39:00 0:03:15
2 7:44:05 7:44:20 2 0Plantation Drive 7:45:00 7:45:08 1 0 7:44:00 0:01:00
1 7:46:40 7:46:51 2 02 0 03 7:47:51 7:48:00 1 04 7:48:51 7:48:42 3 05 7:49:10 7:49:20 2 0
Russel Road 7:50:40 7:50:48 1 0 7:50:00 0:00:401 7:51:15 7:51:40 2 02 7:52:32 7:52:40 0 23 7:52:50 7:53:02 1 04 7:53:30 7:53:45 0 3
6
Ladson Road 8:00:30 8:00:35 2 7:57:00 0:03:35
2 8:02:20 8:02:35 1 23 8:03:35 0 045
64
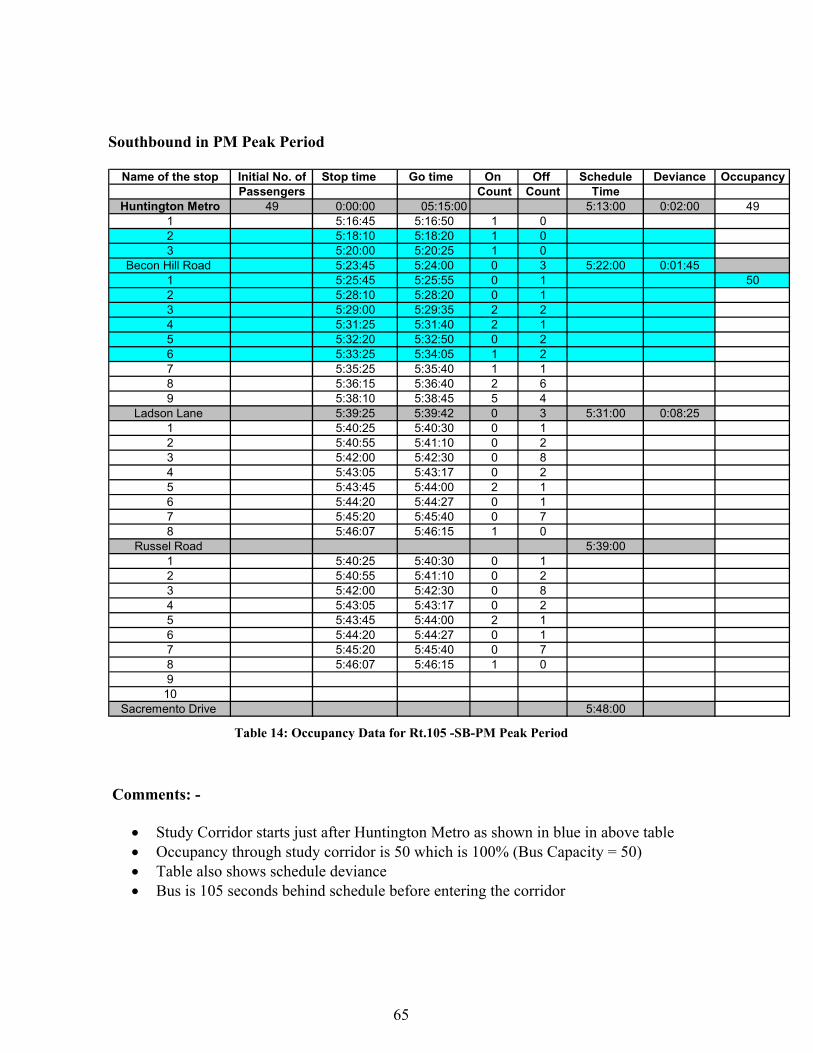
Southbound in PM Peak Period
Table 14: Occupancy Data for Rt.105 -SB-PM Peak Period
Co m
Study Corridor starts just after Huntington Metro as shown in blue in above table • Occupancy through study corridor is 50 which is 100% (Bus Capacity = 50) • Table also shows schedule deviance
chedule before entering the corridor
Name of the stop Initial No. of Stop time Go time On Off Schedule Deviance OccupancyPassengers Count Count Time
Huntington Metro 49 0:00:00 05:15:00 5:13:00 0:02:00 491 5:16:45 5:16:50 1 02 5:18:10 5:18:20 1 03 5:20:00 5:20:25 1 0
Becon Hill Road 5:23:45 5:24:00 0 3 5:22:00 0:01:451 5:25:45 5:25:55 0 1 502 5:28:10 5:28:20 0 13 5:29:00 5:29:35 2 24 5:31:25 5:31:40 2 15 5:32:20 5:32:50 0 26 5:33:25 5:34:05 1 27 5:35:25 5:35:40 1 18 5:36:15 5:36:40 2 69 5:38:10 5:38:45 5 4
Ladson Lane 5:39:25 5:39:42 0 3 5:31:00 0:08:251 5:40:25 5:40:30 0 12 5:40:55 5:41:10 0 23 5:42:00 5:42:30 0 84 5:43:05 5:43:17 0 25 5:43:45 5:44:00 2 16 5:44:20 5:44:27 0 17 5:45:20 5:45:40 0 78 5:46:07 5:46:15 1 0
Russel Road 5:39:001 5:40:25 5:40:30 0 12 5:40:55 5:41:10 0 23 5:42:00 5:42:30 0 84 5:43:05 5:43:17 0 25 5:43:45 5:44:00 2 16 5:44:20 5:44:27 0 17 5:45:20 5:45:40 0 78910
Sacremento Drive 5:48:00
5:46:07 5:46:15 1 0
m ents: -
•
• Bus is 105 seconds behind s
65
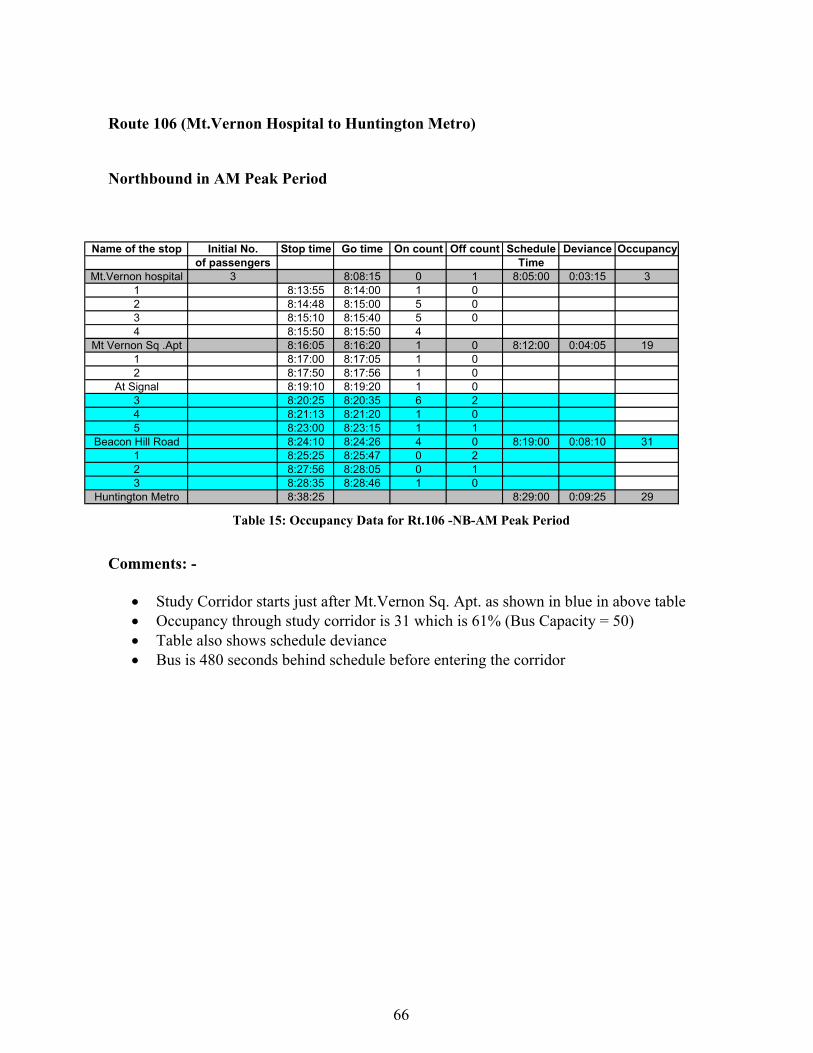
Route 106 (Mt.Vernon Hospital to Huntington Metro) Northbound in AM Peak Period
Table 15: Occupancy Data for Rt.106 -NB-AM Peak Period
Comments: -
• Study Corridor starts just after Mt.Vernon Sq. Apt. as shown in blue in above table • Occupancy through study corridor is 31 which is 61% (Bus Capacity = 50) • Table also shows schedule deviance • Bus is 480 s
Name of the stop Initial No. Stop time Go time On count Off count Schedule Deviance Occupancyof passengers Time
Mt.Vernon hospital 3 8:08:15 0 1 8:05:00 0:03:15 31 8:13:55 8:14:00 1 02 8:14:48 8:15:00 5 03 8:15:10 8:15:40 5 04 8:15:50 8:15:50 4
Mt Vernon Sq .Apt 8:16:05 8:16:20 1 0 8:12:00 0:04:05 191 8:17:00 8:17:05 1 02 8:17:50 8:17:56 1 0
At Signal 8:19:10 8:19:20 1 03 8:20:25 8:20:35 6 24 8:21:13 8:21:20 1 05 8:23:00 8:23:15 1 1
Beacon Hill Road 8:24:10 8:24:26 4 0 8:19:00 0:08:10 311 8:25:25 8:25:47 0 22 8:27:56 8:28:05 0 13 8:28:35 8:28:46 1 0
Huntington Metro 8:38:25 8:29:00 0:09:25 29
econds behind schedule before entering the corridor
66

outhbound in PM Peak Period
Rt.106 -SB-PM Peak Period Comments: -
• Study Corridor starts just after Huntingt Metro shown in blue in above table • Occupancy through study corridor is 33 hich is 65% (Bus Capacity = 50) • Table also shows schedule deviance • Bus is 540 seconds behind schedule before entering the corridor out of which 180
seconds is due to dispatch issues
S
Name of the stop Initial No. of Stop time Go time On Count Off Count Schedule Deviance OccupancyPassengers Time
Huntington Metro 35 0:00:00 5:13:00 5:10:00 0:03:00 351 5:16:40 5:17:00 1 02 5:17:30 5:17:45 0 13 5:18:20 5:18:35 0 14 5:19:00 5:19:20 4 05 5:21:00 5:21:20 0 26 5:22:00 5:22:45 1 17 5:23:40 5:23:45 0 48 5:25:35 5:25:50 1 19 5:27:25 5:27:35 0 1
Beacon Hill Road 5:28:50 5:29:10 3 1 5:19:00 0:09:501 5:29:55 5:30:00 0 2 332 5:32:10 5:32:15 0 13 5:33:00 5:33:10 0 14 5:35:00 5:35:20 1 3
Mt. Vernon Sq.Apt 5:36:25 5:36:35 0 1 5:27:00 0:09:251 5:37:10 5:37:25 0 6234 5:39:50 5:40:00 0 3
5:41:00 5:41:15 0 15:45:20 5:45:45 1 2
7 5:46:35 5:46:40 0 1
Mt. n 5:50
5:38:00 5:38:10 0 35:38:40 5:38:55 0 2
56
8 5:48:50 5:48:55 0 19 5:50:40 5:50:55 0 1
Ver on Hospital 5:52:50 5:37:00 0:1
Table 16: Occupancy Data for
onw
67

4.3 Traffic Signal Timing Data
Traffic signal data used in this research is obtained from the VDOT’s database maintained
in Synchro. Appendix C shows the Synchro inputs for signal timings and traffic volumes.
4.4 Priority Strategy
As mentioned previously, priority strategy used in this research is 10 seconds green
extension. The provision of priority is based on local detection at every intersection using
3M Opticom emitter systems.
Figure 12 : System Architecture for 3M Opticom Emitter Detection System
TransitPriority
EVPreëmption Signal
Controller
TA
FD
ConfirmationDevice
DetectorEmitter
Figure 12 shows the system architecture of the detection system used for this research.
Figures 13 and 14 show the actual photographs of these elements installed on the field.
68

69
Figure 13: Photographs showing 3M Opticom Emitters

Confirmation Light
Detector
Figure 14: 3M Detector and Confirmation Light
70

Chapter 5 : MODELLING IN VISSIM
icroscopic simulation model was used for this res
selected because of its capability to provide detailed information on the MOEs identified in
Chapter 3.VISSIM has a strong emphasis on modeling transit, and it allows the user to
evaluate traffic signals through fixed time controllers or through explicitly defined
controller logic (Ova, Smadi). Also, this is the first effort at Virginia Tech to use VISSIM
odel priority, making it a significant contribution in research tools at the University.
tion will give a general overview of the characteristics of the model, its data
nts, and the calibration method.
VISSIM was developed in Germany through research originating at the University of
Karlsrhue, Karlsrhue, Germany. VISSIM, a German acronym for “traffic in towns -
lation” is a stochastic microscopic simulation model. There are two main components
odel: a traffic simulator and a signal state generator. The traffic simulator
The VISSIM m
to m
This sec
requireme
simu
of the VISSIM m
odel primarily consists of a car following and a lane changing logic. This model uses a
sychophysical driver behavior model developed by Wiedemann (1974) (ITC, 2000b).
asically, this model uses perception thresholds for drivers approaching a moving vehicle
nd the reaction of the driver once a reaction must be taken. This reaction is then an
iterative process of acceleration and deceleratio sing of the vehicle
takes place or the paths of the two vehicles diverge (ITC, 2000b). The model can process
vehicle locations up to 10 time steps per second
The signal state generator operates by acquiring detector information and signal head status
from the traffic simulator, processes the data, and then returns a new value for a signal head
(i.e., green, yellow, or red). This process allows or greater flexibility when creating
simulation networks. The signal state generator uses a language called VAP, an English
acronym for Vehicle Actuated Program. This language is similar to BASIC in using an IF-
THEN logic structure. The VAP polls information and returns signal status to the traffic
simulator once per second.
earch. VISSIM was
m
p
B
a
n of the vehicle until pas
.
f
71

he data requirements of the model consist of mainly four categories: geometric, traffic
icle
on
transit vehicle characteristics, and bus dwell
mes. Table 17 shows the sources used for all these data elements in this research
s
T
characteristics, traffic signal control, and transit information. Signal control data
include parameters such as green times, clearance intervals, maximum and minimum green
times, offsets, and permissive periods. Traffic characteristics include parameters such as
speed distributions, volumes, turning percentages, percentage of heavy vehicles, veh
classifications, acceleration/deceleration distributions, etc. Examples of geometric and
traffic control data are number of lanes, grades, reduced speed areas, pavement markings,
detector locations, yield areas, stop signs, and parking areas. Finally, transit informati
includes routes, schedule, ridership levels,
ti
Table 17: Data Resources for VISSIM modeling
Data Element SourceGeometric Characteristics Synchro file from VDOT
Traffic Characteristics Synchro file from VDOT & Field ObservationsTraffic Signal Control Synchro file from VDOTTransit Information Fairfax Connector Bus Schedules &Field Observation
72

5.1 Network Modeling
ta
ing
Figure 15: Study Corridor Modeled in VISSIM
5.2 Traffic Signal Control
odeling traffic signal control to emulate the ‘before’ case and to deploy a ‘green
xtension’ priority logic to give the ‘after’ case is the heart of this research. Therefore, it
was very important to the maximum extent possible to emulate the signal control data and
to program the model to deploy priority strategy.
The 1.3-mile section of U.S.1 was modeled with VISSIM using the data obtained from da
sources in Table 17. Figure 15 shows a snapshot of the entire network in VISSIM start
from Shields Avenue being north end of the corridor at the top of the graphic Popkins Lane
on the south end (North pointed upwards).
M
e
73

In this research, Signal Control Junction (SCJ) based approach was chosen to model seven
.2.1 Signal Controller Logic
order to program actuated – coordinated signal logic, the signal state generator uses a
nguage called VAP, an English acronym for Vehicle Actuated Program. This language is
similar to BASIC in using an IF-THEN logic structure. The VAP polls information and
simulator once per second.
intersections in VISSIM. One signalized intersection forms one SCJ that includes different
signal head groups attributed to different lane groups. Figure 16 shows a snapshot of entire
network with all seven SCJ shown in red color.
Figure 16: Study Corridor with 7 Signalized Intersections
5
In
la
returns signal status to the traffic
The VAP works on subroutine based programming for individual intersections. This
research makes a significant contribution in acquiring these programming capabilities at
74

Virginia Tech. The VAP being a latest technology, very few attempts have been made in
this area before (ITC-World Website), this forms an important aspect of this research.
All seven intersections were programmed and these VAP programs can be found in the
Appendix B.
ut’ detectors. These are the detectors in VISSIM, which work the same as the 3M emitter
and the detector ope tual green times in
the original logic are replaced by temporary green times which allow the 10 second green
xtension for main line travel and takes that time from side streets to be distributed locally
5.2.2 Signal Priority Logic The literature review summarized in Chapter 2 identified the most common TSP strategies
used throughout the country. The review showed that early green and extended green TSP
strategies were the most commonly used methods. These strategies were also tailored to
meet agencies’ preferences, implementation requirements, and location restrictions. In this
research primary emphasis was on minimum disruption of coordinated traffic signal
operations. This feature was especially important to the case study area, where the main
corridor is a major arterial carrying heavy traffic volumes in peak hours. Also, deployment
is planned for only green extension. So this research modeled only a 10 second green
extension.
As mentioned before, this research applies priority based on individual detection prior to
every intersection. Therefore, the priority logic in VAP is based on ‘Check-In and Check
O
rate in the field. After a bus requests a priority the ac
e
over the same cycle. The following program shows the signal priority subroutine used for
this model,
75

Program for Transit Priority
/*********************************/
/**** TRANSIT SIGNAL PRIORITY ****/
SUBROUTINE TransitPriority1;
BusDetector2 THEN
CheckIn THEN
TempMaxGreen[1]:=Factor1*MaxGreen[1];
TempMaxGreen[2]:=Factor2*MaxGreen[2];
TempMaxGreen[4]:=Factor1*MaxGreen[4];
/*********************************/
IF BusDetector1 THEN
IF presence(BusDetector1) THEN
CheckIn:=TRUE;
END;
END;
IF
IF presence(BusDetector2) THEN
CheckIn:=FALSE;
END;
END;
/**** TEMPORARILY MODIFY MAXGREEN VALUES ****/
IF
76
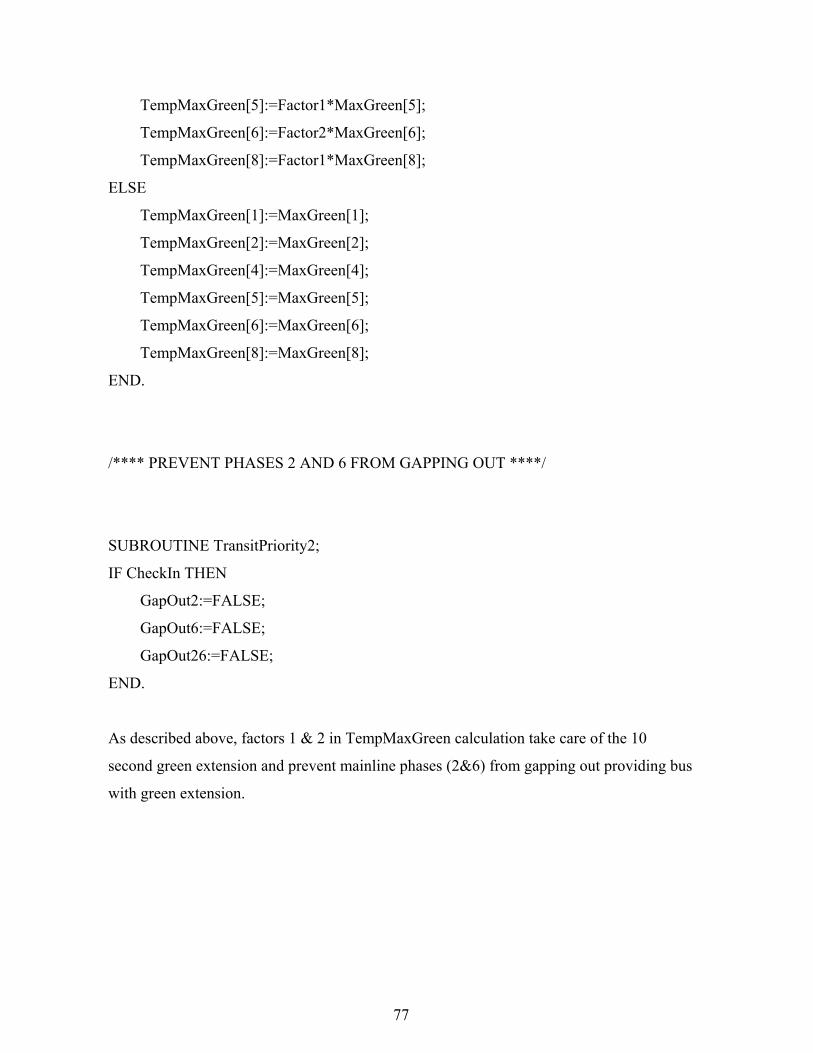
TempMaxGreen[5]:=Factor1*MaxGreen[5];
en[6];
8];
TempMaxGreen[1]:=MaxGreen[1];
TempMaxGreen[2]:=MaxGreen[2];
en[4];
TempMaxGreen[5]:=MaxGreen[5];
TempMaxGreen[6]:=MaxGreen[6];
=MaxGreen[8];
REVENT PHASES 2 AND 6 FROM GAPPING OUT ****/
UBROUTINE TransitPriority2;
ut26:=FALSE;
s described above, factors 1 & 2 in TempMaxGreen calculation take care of the 10
pping out providing bus
ith green extension.
TempMaxGreen[6]:=Factor2*MaxGre
TempMaxGreen[8]:=Factor1*MaxGreen[
ELSE
TempMaxGreen[4]:=MaxGre
TempMaxGreen[8]:
END.
/**** P
S
IF CheckIn THEN
GapOut2:=FALSE;
GapOut6:=FALSE;
GapO
END.
A
second green extension and prevent mainline phases (2&6) from ga
w
77

5.3 Calibration of Model
The calibration of the model is an important process in the methodology because it
nting the actual conditions. Typical
tion measures consist of volume, delay, and travel speeds. In this research, average
or the transit network. Also, this research
ess as most of the model inputs are obtained form
ter 4.
rom field observations (Chapter 4) is 13.4 mph.
ticular class of vehicles to be controlled by the
tor. To be in synch with the field data the desired average operating speed was
hosen in the range of 12.4 to 15. 5 mph. Also, the signal time distributions seen from the
ISSIM output are similar to their inputs from Synchro files, which provides further
ted Programming.
ppendix C shows an example of this green time distribution file from VISSIM.
provides credibility to the results by closely represe
calibra
operating speed is used as a calibration measure f
differs from conventional calibration proc
the field data collection described in Chap
Average operating speed of transit buses f
VISSIM allows the operating speed of par
simula
c
V
support for the signal control programming done using Vehicle Actua
A
78

5.4 Simulation Scenarios
Simulation scenarios are groupings of simulation runs that can be distinguished by certa
characteristics being simulated. There are essentially four distinguishing characteristics (or
in
Table 18: Distinguishing Characteristics of Simulation Runs
in to the simulation scenarios used for this research. These four
haracteristics are shown in Table 18.
Distinguishing Characteristics of Simulation Runs
Distinguishing Characteristic
Possible Values
Number of Possible Values
Low, Medium, High 3
Priority Capability YES or NO 2
Peak Period AM, PM 2
Traffic volume
Random Runs
5 random number seeds
5
Total Runs= 60
factors) that perta
c
79

5.5 Summary
erview of the simulation model, the components of the
for a detailed description of the simulation model used, readers are encouraged to refer to
the VISSIM User Manual (ITC, 2000b).
This section provided a brief ov
model, and the data requirements for proper model development. It provided an
understanding of the capabilities of this model when applied to the methodology. However,
80
Chapter 6 : RESULTS, CONCLUSIONS AND
dition
.1 Bus Service Reliability – Time Reliability
As the study corridor is a small section of a long transit route, schedule deviance is not a
good measure to evaluate results since provision of priority in the study corridor will have
no control on what happens along the entire route. Also, the priority strategy is not related
to lateness of the transit bus as it is assumed to be the driver’s responsibility to make sure
that bus never runs ahead of the schedule. Furthermore, it has been seen from field
observations that buses were often behind schedule before entering the study corridor.
So in this research, the measure for bus service reliability is ‘Time Reliability’ (measure
1.2 in the evaluation framework). Provision of priority to a late bus will assist the bus to
adhere to on the schedule via savings in travel time.
.1.1 Bus Service Reliability – Hypothesis #1
order to test Hypothesis # 1 the measure used is time reliability as a standard deviation
f elapsed time between end points of the study corridor (measure 1.2 from table 2). Two
avel time data collection points were established on either side of the study corridor. The
resulting values for the 15 pairs of simulation runs in AM as well as PM peak period,
without and with priority are shown in the figures 17 & 18.
RECOMMENDATIONS
This chapter focuses on presenting the results of the simulation analysis and in ad
results will be related to the hypotheses presented earlier. Also, major conclusions from
this research will be presented along with recommendations for future research.
6
6 In
o
tr
81

150
250
Std
Dev
.3 234.5 266.8
Std DEV- With Priority 233.4 234.7 219.6 230 237.7 248.6 250.7 232.3 239.5 254.7 220.8 236.7 230 229.6 253.9
13 14 15
Standard Deviation of elapsed time between endpoints AM Peak Period
300
200
0
50
100
Std DEV- No Priority 227.2 236 246.9 233.9 254.5 238.7 238.5 232.9 247 262.5 239.3 232.4 245
1 2 3 4 5 6 7 8 9 10 11 12
Number of Paired Runs
Figure 17: Standard Deviation of elapsed time between endpoints- AM Peak Period
omments: -
sulted in a lower
standard deviation, representing greater bus service reliability.
on run, which is in sync with
the frequency of Fairfax Connector buses in peak hours. It is acknowledged that a
higher number of observations can be obtained by increasing the simulation
duration or increasing the frequency of transit bus operation; however, this research
focuses on emulating the field conditions resulting in 30 paired runs.
C
• In 11 out of 15 in AM Peak period, the provision of priority re
• Overall there was an average decrease of 2.32 % in the standard deviation of travel
time data between end points.
• Standard deviation values represent standard deviation of seven travel time values
for elapsed time between end points. These seven values are for seven buses
passing through the corridor in the one-hour simulati
82

Standard Deviation of elapsed time between endpoints PM Peak Period
0
50
100
150
200
250
300
350
Number of Paired Runs
Std
Dev
Std DEV- No Priority 206.6 262.4 274 303.8 254.5 239.3 256 274.6 246.9 276 204.8 264.5 257.8 296 266.8
Std DEV -With Priority 200.3 246 264.7 270.4 237.7 220.8 259.4 246.9 219.6 267.3 205 254.3 277 273.9 253.9
1 2 3 4 5 6 7 8 9 10 11 12 13 14 15
Figure 18: Standard Deviation of elapsed time between endpoints- PM Peak Period
Overal lower
standar
average
This in
priority
associa on decreased
Comments: -
• In 12 out of 15 in PM Peak period, the provision of priority resulted in a lower
standard deviation, representing greater bus service reliability.
• Overall there was an average decrease of 4.81 % in the standard deviation of travel
time data between end points.
l, in 23 of the 30 paired simulation runs, the provision of priority resulted in a
d deviation, representing greater bus service reliability. Overall there was an
decrease of 3.61% in the standard deviation of travel time between end points.
dicates that the time reliability is higher with conditional priority than with no
, affirming Hypothesis #1, which suggests that the provision of priority will be
ted with higher bus service reliability. While values of standard deviati
83

when priority was provided one must be cautious to draw conclusions about the statistical
significance of the difference in standard deviation values before and after provision of
priority. While paired two-sample t test for means showed the difference to be significant,
the Kolmogorov-Smirnov (K-S test Data Entry Website) test showed otherwise. Additional
observations may assist in exploring these results further.
6.2 Bus Efficiency
As indicated in the evaluation framework, bus efficiency is a measure of travel time
savings for transit buses due to the provision of priority. In order to evaluate travel time
savings ‘Average Run Time’ (measure 2.1) is used.
6.2.1 Bus Efficiency– Hypothesis #2 Two travel time data collection points were established on either side of the study corridor.
The resulting values for the 15 pairs of simulation runs in AM as well as PM peak period,
without and with priority are shown in the Figures 19 and 20.
84

Travel Time Savings for Norhtbound buses in Morning Peak Period
560
440
460
500
520
540
Number of Paired Runs
Tra
vel T
ime
in S
econ
d
Travel Time Without Priority 483 500 500 497 519 506 506 474 504 536 508 493 498 497 543
6 7 8 9 10 11 12 13 14 15
480
4201 2 3 4 5
Travel Time With Priority 496 497 464 489 505 506 509 471 488 519 469 482 485 487 518
Comments: - Figure 19: Travel Time Savings for Northbound Buses - AM Peak Period
• In 12 out of 15 in AM Peak period, the provision of priority resulted in a lower
average run time, representing greater bus efficiency
• Overall there was an average decrease of 2.35 % in the average run time data
between end points
• Each of the 30 travel time values represent the average of seven travel time values
for elapsed time between end points. These seven values are for seven buses
passing through the corridor in one-hour simulation run, which is in sync with the
frequency of Fairfax Connector buses in peak hours. It is acknowledged that
additional observations can be obtained by increasing the simulation duration or
increasing the frequency of transit bus operation; however, this research focuses on
emulating the field conditions resulting in 30 paired runs.
85

Travel Time savings for Southbound Buses in PM Peak Period
0
100
200
300
400
500
600
700
Number of Paired Runs
Tra
vel T
ime
in S
econ
ds
Travel Time Without Priority 557.2 554 575.4 618.5 519 567.3 543 556.7 591.9 560.8 558.8 557.5 579.2 600.8 542.8
Travel Time With Priority 542.2 521.1 538.7 573.4 504.8 552 578.2 553.9 567.3 545.3 558.6 539.7 565.3 579.5 517.7
1 2 3 4 5 6 7 8 9 10 11 12 13 14 15
F
Co
• iority resulted in a lower
• average decrease of 2.89 % in the average run time data
Overal
average
decreas
efficien
Hypoth ssociated with higher bus
service reliability. While values of travel time decreased when priority was provided one
must be cautious to draw conclusions about the statistical significance of the difference in
igure 20: Travel Time Savings for Southbound Buses - PM Peak Period
mments: -
In 14 out of 15 in PM Peak period, the provision of pr
average run time, representing greater bus efficiency
Overall there was an
between end points
l, in 26 of the 30 paired simulation runs, the provision of priority resulted in a lower
run time, representing greater bus efficiency. Overall there was an average
e of 2.64% in the average run time between end points. This indicates that the bus
cy is higher with the provision of priority than with no priority, supporting
esis #2, which states that the provision of priority will be a
86

standard deviation values before and after provision of priority. While the paired two-
sample t test for means showed the difference to be significant, the Kolmogorov-Smirnov
test showed otherwise (K-S test Data Entry Website). Additional observations may assist
studying this hypothesis further.
6.3 Other Traffic-Related Impacts – Queue Lengths on Side Streets
Other traffic-related impacts resulting from the use of transit signal priority play a critical
role in the evaluation process. Some important stakeholder groups tend to be more
cognizant of potential negative impacts on the general motoring public than potential
benefits to transit users and operators. In this research, it is very important to study the
impacts on other traffic on U.S.1, especially the traffic on side streets.
6.3.1 Other Traffic-Related Impacts – Hypothesis #3 In the case of U.S.1, primary concern was the traffic on the side streets, as they receive
minimum penalized to
provide 10 second green extension to the transit buses. As far as U.S.1 traffic is considered,
%(150 second out of 180 second cycle) of green time and the green
extensi
provisi tive impact on through traffic
on
order to test hypothesis #3, the measure used is queue lengths on side streets. VISSIM
ses
eue
ll
share (16%) of green time in the signal timing plan and could be
they receive 84
on provided to transit buses will tend to further increase this percentage. Therefore,
on of priority to transit buses will have little to no nega
U.S.1.
In
provides an inbuilt data collection tool called ‘queue-counter’ which measures the queue
length after a given time interval and compiles them in an output file. . As VISSIM u
three dimensionality of the vehicles to take this into account, the queue length is measured
in feet. In order to get the queue length after every cycle, the time interval for the qu
counter was chosen as the same as the cycle length for all the signals in the study corridor
i.e.180 second. Figure 21 shows average queue lengths on all the side streets in AM as we
87

as PM peak period. Values are averages of queue lengths at the end of each cycle furth
averaged over 15 paired simulation runs in each period.
Queue L
er
engths on Side Streets in AM Peak Period
10
60
70
100
Len
gth
of Q
ueue
in F
eet
Queu 4.04 58.65
Queue Lengths in 'After' case 27.23 3.4 27.4 79.17 90.07 39.25 40.61 1.21 38.41 4.57 60.18
Popkins Collard Memorial Memorial Beacon Beacon Sothgate South South Shields Avenue
WB
Shields Avenue
EB
Figure 21 : Average Queue Lengths on Side Streets - AM Peak Period
Comments: -
• In the AM peak period, the provision of priority resulted in an increase in average
queue length on all the 11 side streets
• Overall there was an average increase of 0.88 feet with a maximum increase of 2.46
feet in the queue length data on side streets
• Increase in queue length is relatively insignificant and represents less than one car
length
80
90
20
30
40
50
0
Side Streets By Approach
e Lengths in 'Before' Case 25.91 3.37 26.96 78.66 88.85 38.03 38.15 1.1 38.06
Lane WB Street EB Drive WB Drive EB Hill Road WB
Hill Road EB
Drive EB Kings Hwy WB
Kings Hwy EB
88
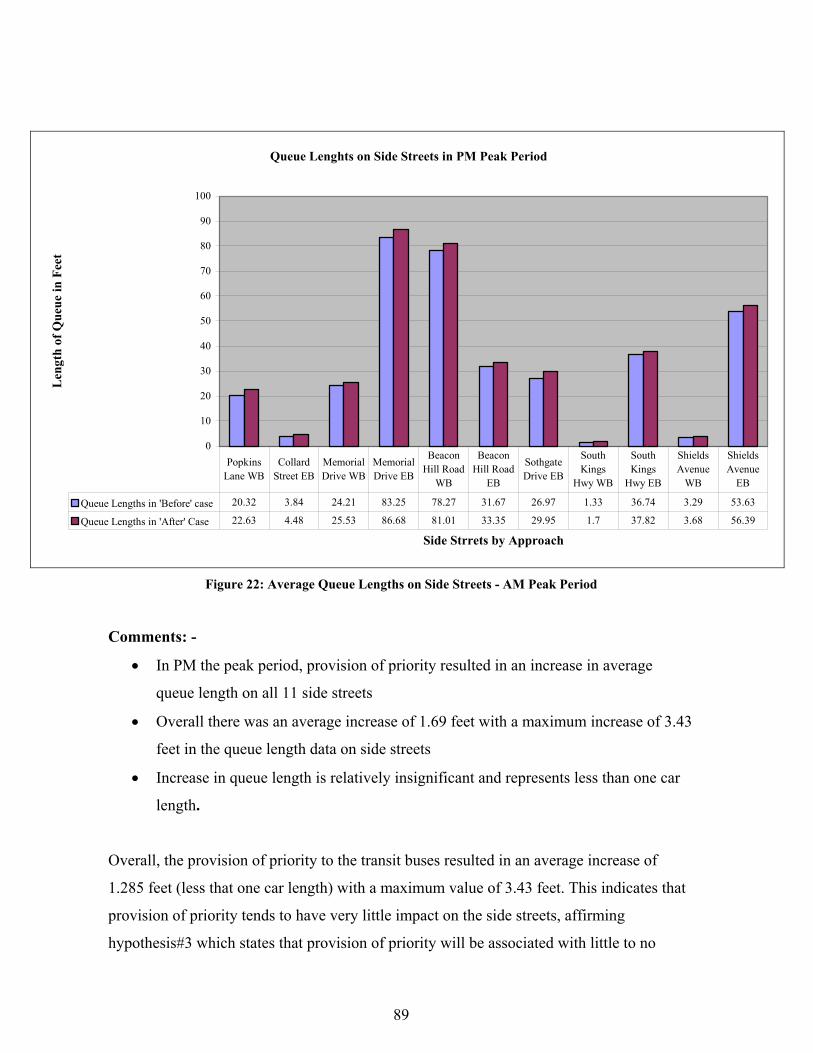
Queue Lenghts on Side Streets in PM Peak Period
0
10
20
30
40
50
60
70
80
90
100
Side Strrets by Approach
Len
gth
of Q
ueue
in F
eet
Queue Lengths in 'Before' case 20.32 3.84 24.21 83.25 78.27 31.67 26.97 1.33 36.74 3.29 53.63
Queue Lengths in 'After' Case 22.63 4.48 25.53 86.68 81.01 33.35 29.95 1.7 37.82 3.68 56.39
Popkins Lane WB
Collard Street EB
Memorial Drive WB
Memorial Drive EB
Beacon Hill Road
WB
Beacon Hill Road
EB
Sothgate Drive EB
South Kings
Hwy WB
South Kings
Hwy EB
Shields Avenue
WB
Shields Avenue
EB
Figure 22: Average Queue Lengths on Side Streets - AM Peak Period
omments: -
he peak period, provision of priority resulted in an increase in average
• of 1.69 feet with a maximum increase of 3.43
• ficant and represents less than one car
Overall, the provision of priority to the transit buses resulted in an average increase of
1.285 feet (less that one car length) with a maximum value of 3.43 feet. This indicates that
provision of priority tends to have very little impact on the side streets, affirming
hypothesis#3 which states that provision of priority will be associated with little to no
C
• In PM t
queue length on all 11 side streets
Overall there was an average increase
feet in the queue length data on side streets
Increase in queue length is relatively insigni
length.
89
impact on the other traffic. While it is acknowledged that the Side Streets impacts can be
evaluated in terms of ‘time’ (e.g. vehicle delay, person delay), this research evaluates them
in terms of queue lengths to address specific concerns of stakeholders. As part of the field
test, traffic engineers were interested in how many more vehicles would be delayed on the
side streets and whether the queue could be dissipated in a same cycle.
6.4 Conclusions
This research focused on analyzing the impacts of transit signal priority on Fairfax
Connector buses on U.S.1 and on overall traffic characteristics in the corridor. Three major
categories of impacts were considered: -
-Effects on Bus Service Reliability
-Effects on Bus Efficiency
-Other Traffic Related Impacts
Within these categories, a variety of indicators was considered according to the framework
proposed by C and
objectives, the most appropriate measures of effectiveness were chosen from the proposed
aluate the potential impacts of provision of signal priority to Fairfax
Con c ed in
the sim lation analysis the following conclusions are
drawn:
provement occurred in the standard deviation of elapsed time between end
hang (Chang, 2002). Depending on the particular environment
measures to ev
ne tor buses and impacts on other non-transit traffic. These measures were then us
ulation analysis. Based on the simu
• Priority may contribute to bus service reliability. When priority was provided, a
3.61% im
points.
• Priority may also assist improving bus efficiency; a 2.64% decrease in run time was
estimated when transit buses were given priority.
90

• Priority had little to no impact on side street traffic; an average increase of 1.825
feet was observed in average queue lengths on side streets with a maximum value
of 3.46 feet.
• Priority may lead to reductions in transit travel time and thus contribute to
improvement in on time schedule performance.
impacts are consistent with the results reported in other priority
with little to no negative impacts on other non-transit traffic affirming all three
.5 Recommendations for Future Research
riority in
e a
priority for a longer segment of U.S.1 needs to be examined to see the
impacts on schedule adherence, headway preservation and negative impacts on
• Considering impacts of relative occupancy levels of transit vehicles will be
important.
• ed priority strategies like early-green and queue jumpers should be
• Fuzzy Logic might be considered to formulate a methodology to find the ‘best’
priority strategy for a given operational environment
• These above
deployment studies.
• Provision of priority resulted in improved bus service reliability and bus efficiency
tested hypotheses
6
While this research has provided a foundation for the evaluation of transit signal p
Northern Virginia area for VDOT and Fairfax County, future efforts can build upon this
research. There are several potential areas which remain to be examined and can hav
significant influence on the way ITS preferential treatment projects are planned in the
region. Some of the potential areas are mentioned here:
• Provision of
other traffic.
Advanc
examined over a stretch of U.S.1 in future
91

• In addition to local detection strategies, a system wide priority should be consider
as Fairfax County plans for future ITS investments.
ratios.
ed
• Impacts of transit priority need to be examined under varying volume to capacity
ion for
• This research focuses on intersection based programming for redistribution of green
ic
evert back to the original timing plan. The capabilities of
identify an optimum strategy.
• of
monetary terms
• The capabilities of VISSIM should be further explored to program preempt
emergency vehicles.
time and does not address alternate ‘transition’ or ‘recovery’ strategy for traff
signal controllers to r
VISSIM and VAP should be explored to program such recovery strategies to
Further investigations should be conducted to convert benefits and other impacts
transit priority into
92

REFER 1. An ed by ATMS and APTS
2. Balke KN, Dudek CL, Urbanik T, Development and evaluation of intelligent bus
ENCES
Introductory Guide to Transit Signal Priority, Preparcommittees of ITS America, April 2002.
priority concept, TRANSPORT RES REC (1727): 12-19 2000, 2000.
er, Thomas, Mark P. 3. Bau Madema and Subbarao V. Jayanthi, Testing of Light Rail
4. BisRep
5. Celniker, Stephen and E. Wayne Terry, Trolley Priority on Signalized Arterials in Downtown San Diego, Transportation Research Record 1361,pp.184-187, 1992.
6. Cha for olytechnic and State University, May 2002
. Choa, F., Milam, R., Stanek, D., CORSIM, PARAMICS, and VISSIM: what the manuals never told you, url:www.fehrandpeers.com/publications/papers/corsim-paramics-vissim-
Signal Control Strategies by combining Transit and Traffic Simulation models, Transportation Research Record 1494, pp.155-160, July 1995.
hop, C., Transit Priority Traffic Control Systems: European Experience, STRP ort 9-1, Canadian Urban Transit Association, 1994.
ng, J., Evaluation of Service Reliability Impacts of Traffic Signal Priority StrategiesBus Transit, Dissertation, Virginia P
7
abstract-m.htm
. Collura, J., Chang, J., Willhaus, E.W., and Gifford, J.L., Traffic Signal Preemption and Priority: Technologies, Past Deployments, and System Requirements, Conference Proceedings of the ITS America Eleventh Annual Meeting and Exposition, Miami Beach, Florida, June 2001.
. Collura, J., Chang, J., and Gifford, J.L., Traffic Signal Priority Strategies for Transit: A Review of Selected Experiences in the United States, Proceedings of the 7th World Congress on Intelligent Transport Systems, Toronto, Italy, November 2000
0. Dion, F., Rakha, H., and Zhang, Y., A Modeling Evaluation of Transit Signal Priority and Adaptive Signal Control along the Columbia Pike Boulevard in the Washington D.C. Region, Virginia Tech Transportation Institute, 2001.
1. Dion, F., Rakha, H., and Zhang, Y., Evaluation of Transit Signal Priority Benefits Along a Fixed-Time Signalized Arterial, Paper presented at 81th Annual Meeting of the Transportation Research Board, January 2002
2. Eavns, G. and Carmarthen Road, Swansea- Bus Priority within SCOOT, 7th International Conference on Road Traffic Monitoring and Control, pp.81-88, April, 1994.
8
9
1
1
1
93

13. Farges, J.L. and J.J. Henry, CELTIC bus priority in Lyon, International Conference on Road Traffic Monitoring and Control. Institution of Electrical Engineers, Savoy Place,
14. Furth PG, Muller THJ, Conditional bus priority at signalized intersections - Better
London , April 1994.
service with less traffic disruption, TRANSPORT RES REC (1731): 23-30 2000, January 2002.
15. Garrow, Michael and Randy Machemehl, Development and evaluation of Transit Signal Priority Strategies, University of Austin, Texas, 1997.
16. Gifford Jonathan, Pelletiere Danilo, Collura John, A Study to Examine the Use of e
keholder Requirements, October 2002.
17.Examine the Use of Signal Preemption and Other Priority Strategies along Signalized
eds,
.C. Region, Presented at the 2001 TRB Annual Meeting.
Signal Preemption and Other Priority Strategies along Signalized Intersections in thWashington, D.C. Area, Task 1 Technical Report on Sta
Gifford Jonathan, Chang James, Collura John, and Willhaus Edward, A Study to
Intersections in the Washington, D.C. Area, Task 2 Technical Report on Technologies, Past Deployments and System Requirements, October 2002.
18. Gifford, J., Pelletiere, D., and Collura, J., An Analysis of the Issues, Concerns, Neand Requirements Associated with Traffic Signal Preemption and Priority in the Washington, D
19. Hounsell N, McLeod F, Automatic vehicle location - Implementation, application, and benefits in the United Kingdom, TRANSPORT RES REC (1618): 155-162 1998, 19
ITC World Technical Help f
98.
20. or VISSIM and VAP- http://www.itc-world.com
22. KS Test Data Entry Website- http://www.physics.csbsju.edu/stats/KS-
23. us Priority at Traffic Signals in Portland: The Powell Boulevard Pilot Project, 1994 ITE Compendium of
24. earned, presentation at Transit Signal Priority Workshop, January 13, 2002 at 81st Annual Meeting of the Transportation
25. Kuah, Geok K., Designing At-grade LRT Progression: Proposed Baltimore Central Light Rail, Transportation Research Record 1361,pp.207-216, 1992.
21. Jacobson, K.L. and P. Brinckerhoff, Transit Signal Priority treatments in Puget Sound region, pacific rim Transtech conference, Seattle, Washington, July 1993.
test.n.plot_form.html
Kloos, W.C., Danaher, A.R., and Hunter-Zaworski, K.M., B
Technical Papers
Kloos, B., Bus Priority in Portland – Lessons L
Research Board
94

26. Laurens, B., Experience in Public Transport Priority at Intersections; Centralized Vs Decentralized Approach, Proceedings of the First World Congress on Applications of Transport Telematics and Intelligent Vehicle-Highway Systems, Paris, December 1994.
f ,
irginia Polytechnic Institute and State University, June 2002.
rt,
30. ean Perspective, Traffic Engineering Control, September 1993.
ium
32. ISS, The 4 Annual IVHS Conference, Atlanta Georgia, April 1994.
33.tation, 1999.
27. Louisell, Chuck, A Framework for Emergency evaluation of Preferential Treatment oEmergency and Transit Vehicles at Signalized Intersections, Dissertation proposalunpublished, V
28. Mainline Traffic Signal Priority Study, Phase-5 Demonstration Project, Final RepoMunicipality of Metropolitan Toronto, April 1991.
29. Markowitz H., Portfolio Selection: Efficient Diversification of Investments, 1959.
Nelson, J.D., Approaches to the provision of priority for public transport at trafficsignals: a Europ
31. Ova, K., Smadi, A., Evaluation of Transit Signal Priority strategies for small-medcities, url: www.ndsu.edu/ndsu/ugpti/DPpdf/DPQ142.pdf,
Petersen, L., Implementation of IVHS Technologies under BL th
Skabardonis, A., Assessment of Traffic Simulation Models, prepared for the Office of Urban Mobility, Washington State Department of Transpor
34. The institute of Transport Studies at Leeds – url: http://www.its.leeds.ac.uk/
35. VISSIM 3.6 - User Manual
36. VAP – User Manual
ation
38. Westwood Professional Services, Inc. Signal Priority for Buses: An Operational test at
39.thesis, Virginia Polytechnic Institute and State University, May 2001.
37. Wattleworth, Joseph A., Kenneth G. Courage, and Charles E. Wallace, Evaluation of Bus Priority Strategies on Northwest Seventh Avenue in Miami, TransportResearch Record 626,pp.32-35, 1977.
Louisiana Avenue, December 1995.
Zhang, Y., An Evaluation of Transit Signal Priority and SCOOT Adaptive Signal Control, Master’s
95

Appendix A
• Examples of Data Collection Sheets Used for Field Data Collection
• Fairfax Connector Bus Schedules
96