evaluating the sensory properties of unpolished australian
TRANSCRIPT

Accepted Manuscript
Evaluating the sensory properties of unpolished Australian wildrice
Tiparat Tikapunya, Robert J. Henry, Heather Smyth
PII: S0963-9969(17)30722-6DOI: doi:10.1016/j.foodres.2017.10.037Reference: FRIN 7085
To appear in: Food Research International
Received date: 1 June 2017Revised date: 5 October 2017Accepted date: 19 October 2017
Please cite this article as: Tiparat Tikapunya, Robert J. Henry, Heather Smyth , Evaluatingthe sensory properties of unpolished Australian wild rice. The address for thecorresponding author was captured as affiliation for all authors. Please check ifappropriate. Frin(2017), doi:10.1016/j.foodres.2017.10.037
This is a PDF file of an unedited manuscript that has been accepted for publication. Asa service to our customers we are providing this early version of the manuscript. Themanuscript will undergo copyediting, typesetting, and review of the resulting proof beforeit is published in its final form. Please note that during the production process errors maybe discovered which could affect the content, and all legal disclaimers that apply to thejournal pertain.

ACC
EPTE
D M
ANU
SCR
IPT
1
Evaluating the sensory properties of unpolished Australian wild rice
Tiparat Tikapunya1,2
, Robert J Henry1, Heather Smyth
1,3
1 Queensland Alliance for Agriculture and Food Innovation, University of Queensland,
Centre for Nutrition and Food Science, Brisbane, QLD 4072, Australia
2 Food Science and Technology Program, Faculty of Agriculture and Technology, Lampang
Rajabhat University, Lampang, Thailand.
3 Corresponding author
ACCEPTED MANUSCRIPT

ACC
EPTE
D M
ANU
SCR
IPT
2
ABSTACT
Australian wild rices are genetically distinct from commercially cultivated rices and present
new opportunities for the development of improved rice cultivars. Before use in rice
breeding, the eating and cooking properties of Australian wild rice must first be understood
as these are key factors in determining rice quality and consumer acceptance. Samples of
Australian wild rice (taxa B) were collected and evaluated together with a commercial
Canadian wild rice (Zizania aquatic L), Oryza sativa L.cv. Nipponbare, and selected
commercial rices including long grain, medium grain, basmati, red basmati, and red rice.
Cooking profiles were established, physical traits were measured and conventional
descriptive analysis techniques were used to compare the sensory properties of the unpolished
rices. Twenty six descriptors, together with definitions, were developed with a panel of
twelve experienced assessors including aroma, flavour, texture and aftertaste attributes.
Results reveal that the Australian wild rice had a mild aroma and flavour similar to that of red
rice and red basmati but without the lingering aftertaste. In terms of texture, the wild rice
was firmer, and somewhat crunchy and chewy rather than soft and fluffy despite requiring a
longer cooking time. The sensory, physical and cooking profiles indicate that Australian wild
rice has a high potential for commercialization in itself and provides a suitable genetic source
for breeding programs, particularly in the coloured rice market.
Keywords: Australian wild rice, sensory, descriptive analysis, rice quality, cooking profile
ACCEPTED MANUSCRIPT

ACC
EPTE
D M
ANU
SCR
IPT
3
1. INTRODUCTION
Rice is the only cereal crop cooked and consumed mainly as whole grains and therefore the
eating characteristics of the whole rice grain is much more important than for any other crop
food (Hossain et al., 2009). Consumers from developed countries demand rice with good
cooking and eating characteristics, but in many developing regions where rice is a staple
food, nutritional value is more important (Sattari et al., 2015). For many decades, scientists
and plant breeders have devoted much attention to improving the quality of cultivated rice.
More recently, researchers are turning to wild rice species to source new quality and
production traits for incorporation into improved commercial cultivars (Henry et al., 2016).
Australian wild rices offer a potentially valuable source of novel alleles for rice breeding
purposes due to their diversity and relative isolation from cultivated rice (Brozynska et al.,
2017) No research has been conducted on consumer traits of Australian wild rice except for
our earlier work on the physical properties of the grain (Tikapunya et al., 2016). An
improved understand of the qualities of Australian wild rices will be required to fully realise
their potential for commercial breeding and production purposes. Advances in the analysis of
the genetic and molecular basis of rice quality (Anacleto et al. 2015) and consumer
preferences will assist in positioning these wild rices in the most receptive market.
The physical properties of three Australian wild rices collected from Cairns, Queensland,
Australia have been evaluated (Tikapunya et al., 2016). The results revealed that Oryza
australiensis had a relatively short grain and was similar in shape to commercially cultivated
rices. Two wild taxa more closely related to domesticated rice (Brozynska et al., 2017) taxa
A (medium grain) and taxa B (long grain) were slender in shape. The grain colour of these
wild rices varied from light red brown to dark brown compared with cultivated rice which
was lighter and brighter. The physicochemical characteristics of the wild rice species were
also studied in order to better understand the functionality of these wild rices (data
ACCEPTED MANUSCRIPT

ACC
EPTE
D M
ANU
SCR
IPT
4
unpublished). Starch profiles for the wild rices revealed a higher amylose content compared
to commercial cultivars indicating wild rice might be beneficial to human health by
contributing to slower digestion rates. These preliminary results suggest that Australian wild
rice may have potential for commercialisation, particularly in the unpolished (coloured) rice
market. The market demand for unpolished (coloured) rice grains has been increasing due to
the association between rice colour and nutritional valve.
Prior to using Australian wild rice in breeding programs or indeed developing a commercial
Australian wild rice cultivar, it will be important to understand the cooking behaviours and
sensory properties of these unique rice species. This study focussed on profiling the cooking,
sensory and eating properties of unpolished Australian wild rice (specifically taxa B) and
benchmarking these qualities against commercial unpolished Canadian wild rice (Zizania
aquatica L.), Oryza sativa L.cv. Nipponbare, and seven unpolished standard commercial rice
cultivars.
2. MATERIALS AND METHODS
2.1 Samples
Samples were identified in the field as part of the work described by Brozynska et al. (2017).
A total of ten unpolished rice types were selected for sensory analysis and are listed in Table
1. The two paddy rice samples (Oryza sativa L.cv. Nipponbare and wild rice (taxa B)) were
collected and stored at (4oC) until used. Eight unpolished commercial rices were purchased
from a local market and stored at room temperature in air-tight plastic bags until sensory
evaluation could take place. All samples were tested within 8 months of purchase or
collection.
ACCEPTED MANUSCRIPT

ACC
EPTE
D M
ANU
SCR
IPT
5
2.2 Sample preparation and presentation
The paddy of Oryza sativa L.cv. Nipponbare and wild rice (taxa B) were dehusked manually.
Unpolished rice (30 g) was added to distilled water with a rice-to-water ratio of 1:4 in a
beaker (250 ml) and covered with an aluminium foil. Beakers were placed in a water bath
(100 ± 1oC). Cooking time was measured from when the contents of the beaker reached
100oC and a minimum cooking time (MCT) was established (Mohapatra & Bal, 2006) for
each rice type individually (approximately 11-31 min). Cooked rice samples were strained
(using a colander) and immediately sub-samples (5 g) were distributed into plastic sample
cups (30 ml) (coded with a 3-digit blinding code), sealed with a lid and placed on a tray in a
humidified warming oven (70oC) before being presented for sensory assessment. All samples
were served for tasting within 30 min of cooking.
Samples were presented to panellists for assessment on white trays together with a plastic tea
spoon and coded with 3-digit blinding codes. During formal evaluation, samples were
assessed in triplicate, with samples presented according to a balanced presentation design
(latin square) within each replicate block. To ensure samples were warm during sensory
assessment, samples were served directly from the warming oven, one at a time, upon
panellist request during formal assessments. No more than 10 samples were assessed within
a 2 hour period.
2.3 Measurement of rice physical properties
The grain size of uncooked samples was measured (Cruz & Khush, 2000) and the length of
20 unpolished rice grains of each sample were measured using a digital Vernier caliper before
and after cooking. The elongation ratio was calculated as a proportion of the length of
cooked rice to length of uncooked rice. The number of burst grains was counted across 100
unpolished cooked rice grains for each sample. Cooked rice grains were analyzed in
ACCEPTED MANUSCRIPT

ACC
EPTE
D M
ANU
SCR
IPT
6
triplicate for color (CIE L c h color space) using a chromameter CR 310 (Konica Minolta,
Japan).
2.4 Sensory panel and evaluation method
The sensory panel was selected based on availability of individuals from a pool of panelists
who had been previously tested for sensory acuity and were experienced in sensory
descriptive studies. Four male and 8 female panellists participated, aged 37-66 years old
(mean age of 48) and participated in all training sessions (8 hours, 4 sessions) and formal
evaluation sessions (6 hours, 3 sessions). Conventional sensory descriptive analysis was the
method used to evaluate the 10 unpolished cooked rice sample. The training phase involved:
familiarising the panellists with the samples, development of descriptive sensory terms and
definitions, associated sensory reference standards and attributes scales and the development
of a tasting protocol together with palate cleansers. A total of 26 attributes (9 aroma, 5
flavour, 8 texture, and 4 after taste) were selected by consensus and are detailed, together
with definition and sensory reference standard, in Table 2. Towards the end of training,
practice sessions were held which mimicked formal evaluation sessions, to verify the
suitability of the method and to assess panelist performance prior to formal evaluation.
During formal evaluation sessions, panelists were instructed to re-acquaint themselves with
the attribute definitions and sensory reference standards, before beginning sample
assessment. By consensus, the panelists agreed to adhere to the following sample assessment
method: lift the lid and assess the aroma in 1 or 2 sniffs, take 1 teaspoon of sample in the
mouth and assess texture, take another 1 teaspoon of sample in the mouth to assess flavor,
and, swallow or expectorate the sample and assess after taste attributes. Attributes were
scored using an unstructured line scale anchored from none (0) to high (100) using a
computerized questionnaire. The panelists were required to refresh their senses between each
sample using filtered water and sliced green apple.
ACCEPTED MANUSCRIPT

ACC
EPTE
D M
ANU
SCR
IPT
7
Training and discussion sessions were held in a meeting room equipped with an electronic
white board, and practice and formal evaluation sessions were held in a purpose-build
sensory evaluation laboratory which was temperature controlled (22⁰C) with day-light
equivalent lighting, and which was equipped with 12 isolated sensory booths and computers.
The software used for data collection was Compusense five (version 5.0, Compusense Inc.,
Guelph, Ontario, Canada).
2.5 Data analysis
The sensory results from Compusense five were exported into Microsoft excel and were
analyzed by XLSTAT (version 2014.6.05, Addinsoft 1995-204, CA, USA). Panel
performance was assessed by calculating discrimination ability, repeatability, and
consistency. Descriptive statistics were calculated for all sensory attribute scores included
minimum, maximum, mean, standard deviation (SD) and the coefficient of variation (CV).
Factors and interactions effects were analyzed using Mixed Model Analysis of Variance
(three way and two way ANOVA) applied on the raw data set (10 sample x 12 panelists x 3
replicates) for each attribute to determine significant differences (p<0.05 and p<0.01).
Principal Component Analysis (PCA) using a correlation matrix was performed to examine
the structure of the data and identify potentially responsible factors for differentiation and
sample grouping. Cooked rice appearance data were also statistically analyzed by analysis of
variance (ANOVA) using post-hoc mean separation. Tukey-Kramer HSD was performed for
the significantly different attributes based on two-way ANOVA. Correlation coefficients
were analysed using Pearson correlation test. Significant differences of the mean values were
determined at p< 0.05 and p< 0.01.
ACCEPTED MANUSCRIPT

ACC
EPTE
D M
ANU
SCR
IPT
8
3. RESULTS
Appearance and physical traits of unpolished cooked rice samples
Results for the grain size measurements (cooked and uncooked) of commercial brown and
red unpolished rices and commercial wild rice, are shown in Table 1 including comparative
‘grain size’ classification, length, width and elongation ratio. Photographs of the rices are
also shown in Fig 1.
As expected Nipponbare was much shorter than the other rices (~5-6mm) with the
commercial wild rice (Zizania) being notably long (~10-12 mm). Basmati and Red basmati 1
were the thinnest rices (~1.6-2.0 mm) and Nipponbare and medium grain were the thickest
rices (width of ~2.6-3.2 mm). Wild rice (taxa B) was mid-range in terms of both length and
width compared to the other rice samples. The elongation ratio (length of cooked rice :
length of uncooked) of rice samples after cooking was similar for all rices with the exception
of Red basmati 1 which was significantly more elongated after cooking (p≥0.05).
Minimum cooking time (MCT), cooked grain colour parameters, and percentage of bursting
grain are indicated in Fig 1. Cooking times ranged from 11 (Red basmati 1) to 31 min
(Zizania). Typically, the wild rice samples (including wild rice taxa B) required longer
cooking times, but not unreasonably so compared to commercial samples. As shown in the
photographs (Fig 1) the rice samples ranged in colour from golden brown to light red, slightly
yellow, dark red and grey. Wild rice (taxa B) was mid-red in colour. Typically the red rice
grains, including wild rice (taxa B), were highly burst after cooking (66-100% burst) while
the other rices were only partially burst (23-49%). The black/grey Zizania rice grains
presented as the most intact after cooking (20% burst).
ACCEPTED MANUSCRIPT

ACC
EPTE
D M
ANU
SCR
IPT
9
Evaluation of the panel performance and the robustness of the sensory data
Following conventional descriptive profiling methods, a list of sensory attributes were
developed by consensus to describe the wild rice samples (shown in Table 2). There were 9
aroma, 4 flavour, 8 texture and 4 aftertaste attributes selected and defined. Scales and
anchors (0-100) were developed for each attribute as well as sensory reference standards (as
shown in Table 2). Due to the inherent challenges of developing accurate texture reference
standards, and given the limited timeframe, only sensory reference standards were prepared
for odour and flavour. (ISO 11036, 1994, Lawless and Heymann, 2013) Each rice sample was
assessed in triplicate under controlled conditions by the panel of 12 assessors. The sensory
data obtained were examined in terms of panellist performance and to determine the
robustness of the sensory data, before final analyses and interpretations were made. During
data analysis it was clear that one sample, the Canadian wild rice (Zizania), strongly
influenced the use of attribute scales due to its inherent differences from the other rice
samples. For this reason the data presented herein include comparisons of all 10 rice samples
as well as comparisons of only 9 rices samples (excluding the Zizania sample).
Panel performance was assessed including each panellists discrimination ability among
samples, repeatability across replicated samples, and consistency which is a measure of the
number of attributes where the panellist did not contribute significantly to the interaction
indicating poor consensus (supplementary material Table A1). While all 12 panellist
performed sufficiently well across the 10 rice samples, when the Zizania sample was
removed from the analysis (due to its extreme differences), two panellists performed poorly
in terms of discrimination ability. Nevertheless, removing these two panellists did not
improve the statistics and interpretation. Consequently, the profiles from all 12 panellists
were included in the analysis of both the 10 and the 9 (Zizania removed) rice sample data
sets.
ACCEPTED MANUSCRIPT

ACC
EPTE
D M
ANU
SCR
IPT
10
To explore the quality and robustness of the sensory data overall, a mixed model analysis of
variance was applied on the sensory data set with (n=10 samples and 12 panellists) and
without the Zizania sample. The results of the model (n=10 samples) are shown in Table 3.
Further, the range, means and coefficient of variation were compared between the two data
sets (n=10 and n=9 samples).
The scoring of each attribute was significantly different (p<0.05) across the 10 cooked
unpolished rice samples indicating that the samples varied for all of the sensory attributes
rated. Furthermore, the interaction of (sample x panellist) was significantly different
(p<0.01) across all of the sensory attributes meaning the panel were able to distinguish
differences among samples for all attributes. The panellists were also found to score
significantly differently from each other for almost all sensory attributes, which is typical of
descriptive sensory studies (Sinesio et al., 1990). Pleasingly, the rating of samples did not
differ between replicates for all attributes with the exception of chewiness and springiness.
This might indicate very slight difference in terms of cooking between replicates. The
interaction of sample x replicate did not differ significantly across attributes with the
exception of fluffiness and flavour intensity which also might also indicate a slight difference
in cooking across the replicates. The interaction of panellist x replicate showed some
significant differences for texture attributes firmness, chewiness, fluffiness and graininess,
and after taste attributes lingering and bitsy. This indicates that panellists may be changing
the way they rate those attributes across the replicates, or again could indicate some slight
variations in cooking of rice samples across the replicates.
The scoring of all sensory attributes among the 9 rice samples (from the data set excluding
Zizania due to its extreme differences) was also significantly different (p<0.05) (data not
shown). The most obvious difference from the sample set of 10 rices was the dramatic
decrease in the variation of scoring for brown bread aroma and flavour which were attributes
ACCEPTED MANUSCRIPT

ACC
EPTE
D M
ANU
SCR
IPT
11
characteristic of the Zizania sample. Similarly, the variation in rating of the texture attributes
was significantly reduced. Nevertheless, all sensory attributes were found to be significantly
different across the data set of 9 rice samples and were useful to interpret differences among
samples.
The sensory panel performance was considered satisfactory and the integrity and robustness
of the sensory data was considered excellent and suitable for further data evaluation and
interpretation.
Exploring differences among rice samples by sensory evaluation
To explore the sensory properties of the cooked unpolished rice samples, the sensory data
were analysed using principal component analysis (PCA). Due to the driving influence of the
Zizania sample, the data were analysed by PCA both with (n=10 samples) and without (n=9)
the Zizania sample included. Further, while initial bi-plots were explored that including all
attributes in a single plot, a decision was made to present the bi-plots separately for aroma,
flavour, texture and after taste. This allowed for a closer examination of differences among
rices within each sensory property type. In all cases, the first two principle components
(PCs) explained more than 85% of the variation in sensory profiles among samples (Fig 2)
(n=10 and 12 panellists) making interpretations possible from a single bi-plot (PC1 v PC2).
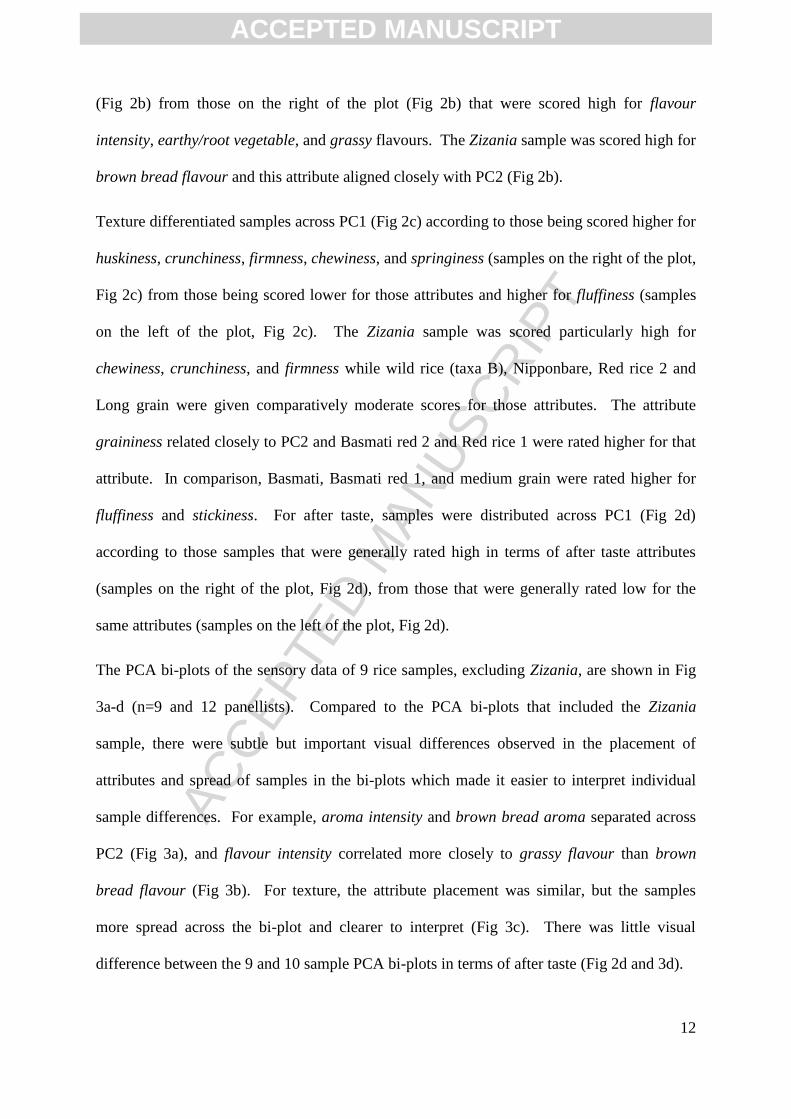
In terms of aroma, cooked unpolished rices were differentiated across PC1, being higher in
sweetness, nutty, buttery, cereal aroma attributes (cooked unpolished rices on the right of the
plot, Fig 2a) or being higher in brown bread, aroma intensity, fermented, earthy/root
vegetable, grassy aroma attributes (cooked unpolished rices on the left of the plot, Fig 2a).
With high scores for brown bread aroma, fermented aroma and aroma intensity, the Zizania
drove the differences observed across PC3. Samples were distinguished in terms of flavour
(across PC1 in Fig 2b) by those that were scored high for cereal flavour on the left of the plot
ACCEPTED MANUSCRIPT
ACC
EPTE
D M
ANU
SCR
IPT
12
(Fig 2b) from those on the right of the plot (Fig 2b) that were scored high for flavour
intensity, earthy/root vegetable, and grassy flavours. The Zizania sample was scored high for
brown bread flavour and this attribute aligned closely with PC2 (Fig 2b).
Texture differentiated samples across PC1 (Fig 2c) according to those being scored higher for
huskiness, crunchiness, firmness, chewiness, and springiness (samples on the right of the plot,
Fig 2c) from those being scored lower for those attributes and higher for fluffiness (samples
on the left of the plot, Fig 2c). The Zizania sample was scored particularly high for
chewiness, crunchiness, and firmness while wild rice (taxa B), Nipponbare, Red rice 2 and
Long grain were given comparatively moderate scores for those attributes. The attribute
graininess related closely to PC2 and Basmati red 2 and Red rice 1 were rated higher for that
attribute. In comparison, Basmati, Basmati red 1, and medium grain were rated higher for
fluffiness and stickiness. For after taste, samples were distributed across PC1 (Fig 2d)
according to those samples that were generally rated high in terms of after taste attributes
(samples on the right of the plot, Fig 2d), from those that were generally rated low for the
same attributes (samples on the left of the plot, Fig 2d).
The PCA bi-plots of the sensory data of 9 rice samples, excluding Zizania, are shown in Fig
3a-d (n=9 and 12 panellists). Compared to the PCA bi-plots that included the Zizania
sample, there were subtle but important visual differences observed in the placement of
attributes and spread of samples in the bi-plots which made it easier to interpret individual
sample differences. For example, aroma intensity and brown bread aroma separated across
PC2 (Fig 3a), and flavour intensity correlated more closely to grassy flavour than brown
bread flavour (Fig 3b). For texture, the attribute placement was similar, but the samples
more spread across the bi-plot and clearer to interpret (Fig 3c). There was little visual
difference between the 9 and 10 sample PCA bi-plots in terms of after taste (Fig 2d and 3d).
ACCEPTED MANUSCRIPT

ACC
EPTE
D M
ANU
SCR
IPT
13
Interestingly, the rices with a brown bran layer, including Nipponbare, long grain, medium
grain, and Basmati (samples indicated in yellow in Fig 2 and 3), were typically grouped
together as they shared similar sensory profiles. The rice with brown bran had a distinct
aroma - cereal aroma, buttery aroma, sweetness aroma, nutty aroma - compared to the rices
with red bran, and were also scored higher for cereal flavour. In contrast, samples with a red
bran layer (samples indicated in red in Fig 2 and 3), including Australian wild rice (taxa B),
were typically found to exhibit more intense and more diverse sensory profiles than brown
bran rices. The red bran rices typically exhibited higher intensities of earthy/root vegetable
aroma (and flavour), grassy aroma (and flavour), and to a lesser degree fermented aroma.
Australian wild rice (taxa B) exhibited milder aroma and flavour characteristics of the red
bran rices.
In terms of texture, the red and brown bran rices were not distinctly separated from each
other and a range of different texture types were observed across the samples (Fig 3c).
Basmati red 1 was scored much higher for fluffiness, medium grain rice scored higher for
springiness and Red rice 1 and Basmati red 2 scored higher for graininess. Both brown and
red bran rice types were scored higher for huskiness, crunchiness, firmness and chewiness
and these included wild rice (taxa B), Nipponbare and Red rice 2.
Similarly, the red and brown bran rices were not distinctly separate in terms of after taste.
Basmati red 2, Red rice 1 and to a certain extent Red rice 2 were scored higher for lingering
aftertaste, bitterness and metallic. The other rice samples, including Australian wild rice
(taxa B), generally received lower scores for after taste attributes indicating they left a
relatively clean finish in the mouth.
ACCEPTED MANUSCRIPT

ACC
EPTE
D M
ANU
SCR
IPT
14
Relationships observed between physical and sensory properties
To evaluate the relationship between rice sensory properties and physical attributes,
including: colour parameters (L, C, h), percentage of burst grain (%bursting) as well as a
minimum cooking time (MCT), principal component analysis (PCA) was again employed on
the combined data set. The PCA bi-plot is shown in Fig 4 for the 10 (Fig 4a) and 9 (Fig 4b)
rice sample sets. The meaningfulness of observed correlations needs to be balanced against
the fact that only a limited sample set was used in this study.
The rices were measured for lightness (L), chroma (C) and hue (H) as shown in the PCA bi-
plot (Fig 4a and b). Lightness (L) as hue (H) generally correlated with the aromas and
flavours of the lighter brown bran rices for example cereal aroma and flavour, buttery aroma,
nutty aroma. Interestingly, lightness also correlated somewhat with stickiness scores.
Chroma (C), representing a colour saturation measurement, didn’t consistently relate to any
of the sensory properties rated.
The increased percentage of burst cooked grains (%bursting) tended to correlate with the
sensory attributes related to red bran rices Reb rice 1 and 2 and Basmati red 2, such as flavour
intensity, earthy / root vegetable aroma and flavour, and lingering aftertaste (Fig 4a and 4b).
Not surprisingly, minimum cooking time (MCT) interacted strongly with texture attributes
among rice samples (Fig 4a and Fig 4b). The Zizania sample with higher firmness,
chewiness, crunchiness, and huskiness scores also required the longest cooking time and had
the highest MCT recorded (Fig 4a), nevertheless, the relationship between these texture
attributes and MCT still remained after removing the Zizania from the analysis (Fig 4b).
ACCEPTED MANUSCRIPT

ACC
EPTE
D M
ANU
SCR
IPT
15
DISCUSSION
Collecting paddy rice from the wild is a challenge due to the inherent shattering behaviour of
wild rice panicles and the different maturity stages within one panicle. Hand harvesting was
applied where the mature seeds (black husk colour) were visually selected and the awns of
the wild rice were gently removed by cutting (Tikapunya et al., 2016). Due to the limit in the
sample volumes able to be collected, mechanical dehusking was impossible and the husks of
paddy rice also needed to be removed by hand to prepare unpolished wild rice grain prior to
use.
There are several factors that influence the cooking and eating properties of rice and with a
range of rice samples, as selected for this study, cooking protocols were tailored to ensure all
rice samples were cooked to the same ideal eating level (Tikapunya, 2017). In this study an
excess water cooking method was selected to assess the eating quality of the unpolished rice
samples as this had been used previously for the preparation of commercial wild rice (Zizania
aquatica L.) (LL & Bagley, 1979).
Unpolished rice has been one of a number of whole grain health products growing in market-
share according to the U.S. Food and Drug Administration extension, 2008 (Bett‐Garber et
al., 2012). Even though many research reports indicated valuable phenolic compounds in
pigmented rice (Finocchiaro et al., 2007; Goffman & Bergman, 2002; Goffman & Bergman,
2004; Liu, 2007), the relationship between bran colour or bran pigment and aroma profiles
has been unclear. While only limited samples were included in the present study, the
preliminary results reported here indicated that different bran colours may indeed contribute
different aroma profiles. For example, brown bran rices exhibited sweetness, nutty, buttery,
and cereal aromas while rice with red bran layers present earthy/root vegetable and grassy
aromas. Australian wild rice (taxa B) has a mid-red bran layer, although it was observed to
exhibit a similar but somewhat milder aroma and flavour profile to that of the brown bran
ACCEPTED MANUSCRIPT

ACC
EPTE
D M
ANU
SCR
IPT
16
rices. It is possible that wild rice (taxa B) has a unique pigment or phenolic profile in the
bran layer.
Flavour profiles in this study were similar to those described by Bett‐Garber et al. (2012),
who demonstrated that brown rices have more intense grainy/starchy, cooked cereal and
corn/popcorn/buttery flavours, while red rices have greater intensity of beany, animal/wet
dog and earthy flavours. Darker coloured cultivars were also associated with stronger after
taste characters especially bitterness which also agrees with the results of the present work.
Together, these results may indeed confirm a correlation between bran colour and aroma and
flavour properties of unpolished rice
Gelatinization of whole grains is a process that starts at the surface with the moisture
gradually penetrating to the interior of the grain during cooking. Typically, by the time the
starch at the centre is gelatinized, the surface cells have been over-cooked and are burst (K,
1948). Interestingly, in the present study, the colour of the unpolished rice had a stronger
correlation with the percentage of burst cooked grains than the cooking time itself. The
highest percentage of burst cooked grains was observed for Red rice1 and Red rice2 which
were also measured to have a higher chroma (C) and lower hue (H) values. It was notable
that the percentage of burst grains of wild rice taxa B was less than that of Red rice 1, even
though it exhibited (similar C and H values, as well as requiring a higher minimum cooking
time (MCT). This observation might indicate that the bran layer characteristics of wild rice
(taxa B) may be quite unique from the red bran layer rices.
The differentiation of histological structure of whole grain rice is a major characteristic
influencing the cooking behaviour and sensory texture of cooked rice. In this study, the
minimum cooking time (MCT) demonstrated a strong correlation with texture attributes.
Attributes firmness, chewiness, crunchiness, huskiness, and springiness were scored higher in
the samples with higher MCTs. The cooking behaviour of unpolished rice was different to
ACCEPTED MANUSCRIPT

ACC
EPTE
D M
ANU
SCR
IPT
17
the cooking behaviours observed with polished rice. Wu et al. (2016) postulated that for
unpolished rice the bran layer characteristics influence cooking behaviour, in an excess water
system, explaining that the culticular layer (pericarp) may be acting as an impermeable
barrier which prevents the penetration of water into the underlying endosperm resulting in the
requirement for a longer cooking time (Chen et al., 2012). A film is created which coats the
rice grain due to components leaching from the starch granules. This film accumulates on the
aleurone layer more readily than on the cuticular or endosperm layers (Wu et al., 2016). The
thickness of the coated film and partial aleurone results in the grain maintaining its physical
structures during cooking resulting in an increase in the hardness of cooked grains. In the
present study, the pericarp layer of wild rice (taxa B) and Zizania aquatica L. might indeed
be thicker than the other commercial rices, requiring a longer cooking time (higher MCT).
Moreover, among the 9 cooked rice samples, the Long and Medium grain, wild rice (taxa B),
and Oryza sativa L.cv. Nipponbare may have a thicker, or multi-layered of aleurone resulting
in higher scores for firmness in texture.
CONCLUSIONS
Australian wild rice (taxa B) was compared to commercial rices in terms of sensory
properties, cooking behaviour as well as selected physical traits. The results of this study
indicate that Australian wild rice (taxa B) has a mild aroma and flavour somewhat similar to
that of rices with red bran layers (red rice and red basmati) but without the lingering
aftertaste. In terms of texture, wild rice (taxa B) is firmer, and somewhat crunchy and chewy
rather than soft and fluffy despite requiring a longer cooking time. In this study bran colour
played an important role in differentiating the sensory profiles of cooked rice. The wild rice
had a mid-red bran layer, yet, it did not exhibit strong earthy/root vegetable and grassy
flavours of the rices with a dark red bran layer. It might be that the Australian wild rice has
ACCEPTED MANUSCRIPT

ACC
EPTE
D M
ANU
SCR
IPT
18
unique bran layer components or pigments as does the Canadian commercial wild rice (black
bran layer) which also expressed a unique aroma and flavour profile. In terms of texture,
firmness and chewiness were the main texture attributes of the wild rice while the rices with
red bran layers were scored higher for huskiness and graininess. Moreover, a lower
percentage of burst grains were observed for wild rice (taxa B) despite it requiring a longer
cooking time which may also indicate a unique bran layer. The desirable sensory
characteristics of Australian wild rice have potential for commercialization as a whole grain
in itself, especially as an ingredient in a gourmet foods such as soups, breakfast cereals, meat
dishes, and dessert. Furthermore, this study has demonstrated that this wild rice provides a
suitable genetic source for rice breeding, particularly for the coloured rice market.
ACKNOWLEDGEMENT
The authors acknowledge the Rural Industries Research and Development Corporation
(RIRDC), the Australian Research Council (ARC) and Lampang Rajabhat University,
Thailand for providing research funding. The authors also acknowledge the contributions
and dedication of the sensory evaluation panel of the Health and Food Sciences Precinct,
Coopers Plains, Australia.
REFERENCES
Anacleto R, Cuevas RP; Jimenez; R, Llorente C, Nissila E, Henry R, Sreenivasulu N (2015) Prospects of breeding high-quality rice in the post-genomic era. Theoretical and Applied Genetics 128 8, 1449-1466.
Bett‐Garber, K., Lea, J., Champagne, E., & McClung, A. (2012). Whole‐Grain Rice Flavour
Associated With Assorted Bran Colours. Journal of Sensory Studies, 27(2), 78-86.
Brozynska, M., Copetti, D., Furtado, A., Wing, R. A., Crayn, D., Fox, G., . . . Henry, R. J.
(2017). Sequencing of Australian wild rice genomes reveals ancestral relationships
with domesticated rice. Plant Biotechnology Journal, 1-10, doi:10.1111/pbi.12674
Chen, H. H., Chen, Y. K., & Chang, H. C. (2012). Evaluation of physicochemical properties
of plasma treated brown rice. Food Chemistry, 135(1), 74-79.
Cruz, N. D., & Khush, G. (2000). Rice grain quality evaluation procedures. In R. K. Singh,
U. S. Singh, & G. S. Khush (Eds.), Aromatic rices (Vol. 3, pp. 15-28). New Delhi:
Oxford & IBH Publishing Co. Pvt. Ltd.
ACCEPTED MANUSCRIPT

ACC
EPTE
D M
ANU
SCR
IPT
19
Finocchiaro, F., Ferrari, B., Gianinetti, A., Dall'Asta, C., Galaverna, G., Scazzina, F., &
Pellegrini, N. (2007). Characterization of antioxidant compounds of red and white rice
and changes in total antioxidant capacity during processing. Molecular Nutrition &
Food Research, 51(8), 1006-1019.
Goffman, F., & Bergman, C. (2002). Total phenolics and antiradical efficiency of rice bran
extracts. Paper presented at the Proceedings of 29th Rice Technical Workshop Group
Meet, Little Rock, AR.
Goffman, F., & Bergman, C. (2004). Rice kernel phenolic content and its relationship with
antiradical efficiency. Journal of Science and Food Agriculture, 84(10), 1235-1240.
Henry, R. J., Rangan, P., & Furtado, A. (2016). Functional cereals for production in new and
variable climates. Current Opinion In Plant Biology, 30, 11-18.
Hossain, M. S., Singh, A. K., & Fasih-uz-Zaman. (2009). Cooking and eating characteristics
of some newly identified inter sub-specific (indica/japonica) rice hybrids.
ScienceAsia, 35(4), 320-325.
ISO 11036 (1994) Sensory analysis methodology texture profile, International Organization
for standardization, Geneva (http://www.iso.org)
K, O. D. A. (1948). Quick-cooking rice and process for making same: Google Patents.
Lawless, H.T. and Heymann, H. 2013. Laboratory Exercises for Sensory Evaluation,
Springer Science and Business Media.
Liu, R. H. (2007). Whole grain phytochemicals and health. Journal of Cereal Science, 46(3),
207-219.
LL, R. A., & Bagley, B. (1979). Quality characteristics of processed wild rice. Cereal
Chemistry, 56(4), 375-379.
Mohapatra, D., & Bal, S. (2006). Cooking quality and instrumental textural attributes of
cooked rice for different milling fractions. Journal of Food Engineering, 73(3), 253-
259. doi: 10.1016/j.jfoodeng.2005.01.028
Sattari, A., Mahdinezhad, N., Fakheri, B., Noroozi, M., & Beheshtizadeh, H. (2015).
Improvement of the eating and cooking qualities of rice: a review. Internal Journal of
Farming Allied Science, 4(2), 153-160.
Sinesio, F., Risvik, E., & Rodbotten, M. (1990). Evaluation of panelist performance in
descriptive profiling of rancid sausages: A multivariate study. Journal of Sensory
Studies, 5(1), 33-52.
Tiparat, T. 2017. Grain quality of Australian wild rice (compared to domesticated rice). PhD
thesis, University of Queensland, Australia
Tikapunya, T., Fox, G., Furtado, A., & Henry, R. (2016). Grain physical characteristic of the
Australian wild rices. Plant Genetic Resources, 1, 12.
Wu, J., Chen, J., Liu, W., Liu, C., Zhong, Y., Luo, D., . . . Guo, X. (2016). Effects of aleurone
layer on rice cooking: A histological investigation. Food Chemistry, 191, 28-35.
ACCEPTED MANUSCRIPT

ACC
EPTE
D M
ANU
SCR
IPT
20
Table 1 Details of the rice samples used for sensory evaluation and summary of physical
measurements a
Varieties
(Code) 1
Product details
Country
of origin
ER2
Grain
Size3
Length (mm) Width(mm)
Uncooked Cooked Uncooked Cooked
Oryza sativa L.cv.
Nipponbare
Provided by NSW breeding
line program
Australia 1.2±0.1b S 5.0±0.1e 6.3±0.4cd 2.6±0.4a 2.7±0.2b
Red Basmati 1
Red Basmati-Lite CIC Agri
Businesses : 5kg Imported
&Distributed by Esher Food
(Australia) Pty Ltd
Sri Lanka 1.6±0.1a M 6.2±0.1de 10.1±0.6b 1.6±0.1c 2.0±0.1bc
Medium grain
SUNRICE Whole grain
Brown Rice Medium grain :
5 kg
Australia 1.1±0.1b M 6.3±0.1de 7.3±0.3cd 2.6±0.1a 3.2±0.3a
Red Basmati 2
Red Basmati CIC Agri
Businesses : 5kg Imported
& Distributed by Esher
Food (Australia) Pty Ltd
Sri Lanka 1.2±0.1b M 6.4±0.1de 7.8±0.4cd 1.7±0.1bc 1.9±0.1bc
Red rice1
Red Raw Rice CIC Agri
Businesses : 5kg Imported
& Distributed by Esher
Food (Australia) Pty Ltd
Sri Lanka 1.2±0.1b M 6.5±0.1d 7.9±0.3c 2.2±0.1ab 2.5±0.2bc
Wild rice
Harvested by hand from
Mareeba Wetland, Cairn (18
May 2015)
Australia 1.1±0.1b L 6.6±0.2d 7.2±0.4cd 2.0±0.3ab 2.2±0.4bc
Long grain
Coles Australian Brown
Rice (long grain rice with a
firm texture and nutty
flavour) : 1 kg
Australia 1.1±0.1b L 6.7±0.1d 7.9±0.6c 2.1±0.1ab 2.6±0.3b
ACCEPTED MANUSCRIPT

ACC
EPTE
D M
ANU
SCR
IPT
21
Red rice2
Absolute Live Himalayan
Red Rice Whole grain :500g
(www.absolutelive.com.au)
South
Central
Asia
1.1±0.1b L 7.0±0.1c 7.4±0.4cd 2.0±0.2ab 2.2±0.2bc
Basmati
Brown Basmati Rice 7
HILLS Impex
(www.7hills.com.au)
Sri Lanka 1.3±0.1b Ex 7.8±0.1b 10.2±1.0ab 1.6±0.1c 2.0±0.1bc
Commercial
wild rice
(Zizania aquatic L)
Chef's choice Wild Rice:
150 g (HBC Trading
Australia Pty. Ltd.)
Canada/
North
America
1.2±0.1b Ex 10.3±0.2a 12.3±1.2a 2.0±0.1ab 2.1±0.3bc
a Mean ± standard deviation was calculated from duplicate measurement (n=20). Values with different letters
in the same column and row of each samples are significantly different at P<0.05. 1 All samples were
purchased from a supermarket with the exception of Oryza sativa L.cv. Nipponbare and wild
rice which were obtained from research samples, 2
elongation ratio of cooked grains (ER),
3Grain size classified by grain length; S, short (≤5.50 mm) ; M, medium (5.51-6.60 mm); L,
long (6.61-7.50 mm); Ex, extra-long (≥7.50 mm).
ACCEPTED MANUSCRIPT

ACC
EPTE
D M
ANU
SCR
IPT
22
Table 2 Summary of sensory attribute terms, their definitions and corresponding sensory
reference standards Sensory attributes Definition Sensory reference standards
Aroma
aroma intensity The overall aroma intensity of the sample. -
sweetness A sweet caramelised aroma, like a sweet porridge or a
cereal-based dessert.
Woolworths Home brand quick oats (750g packet) cooked
with water and added Coles brown sugar (recipe, 15g oats
in 150ml water and 6 tsp of brown sugar cooked on a
stove) ½ tsp presented.
cereal A cereal-like starchy aroma like porridge. Woolworths Home brand quick oats (750g packet) cooked
with water (recipe, 15g oats in 150ml water, cooked in
microwave on 40% power for 4 minutes). ½ tsp
presented.
brown bread An aroma of dark brown bread crust or molasses. Bakers Life Korning brand low GI brown bread crust (~4
cm x 2 cm piece) together with CSR Original Treacle
Golden Circle brand (~0.5g)
earthy/ root vegetable An earthy aroma, like that of beetroot and root vegetables. Australian Grown Love Beets (Aldi) beetroot (5 g)
roughly chopped. 1-2 pieces presented.
grassy A wet grassy, slightly bruised spinach aroma. Frozen spinach (Natures nutrients, Premium quality
frozen chopped spinach, 250g pack) steamed for 2
minutes. ¼ tsp presented plus ½ tsp freshly snipped grass
mixed together.
nutty A delicate nutty aroma like that of almond milk. All natural Blue Diamond Almonds, Almond Breeze
creamy almond milk cashew blend, unsweetened, (1L). 1
tsp presented.
buttery A buttery aroma similar to commercial microwavable
buttered popcorn.
Coles microwave popcorn butter flavour (200g pack). ½
piece of microwavable butter flavoured popcorn prepared
as per packet instructions.
fermented A slightly sour fermented note, like that of fermenting
grain.
Just Rooibos African Tea, organically grown, (100 g
pack) (recipe, 1 tea bag in 150 ml of hot water (65oC)
seeped for 5 mins. 2 tsp of brewed Rooibos tea presented.
Flavour
flavour intensity The overall intensity of flavour. -
ACCEPTED MANUSCRIPT

ACC
EPTE
D M
ANU
SCR
IPT
23
cereal An aroma of dark brown bread crust or molasses. As for aroma
brown bread An earthy aroma, like that of beetroot and root vegetables. As for aroma
earthy/ root vegetable A wet grassy, slightly bruised spinach aroma. As for aroma
grassy A cereal-like starchy aroma like porridge. As for aroma
Texture
firmness The hardness or firmness of the sample when first chewing. -
chewiness The amount of chewing required to break the sample down. -
springiness A springy, bouncy, almost rubbery sensation of the sample
against the teeth when first chewing.
-
crunchiness A crunchy sensation against the teeth when first chewing
the sample.
-
stickiness A sticky sensation perceived where the sample readily
sticks both to itself and the oral surfaces.
-
fluffiness The light fluffy sensation of the sample in the mouth when
first chewing.
-
huskiness The rough, fibrous sensation of husks being separated from
the rice grain when chewing.
-
graininess The grainy, almost sandiness, of the sample when chewing. -
After taste
lingering The lingering of the sample flavour in the mouth after
swallowing.
-
bitsy The bitsiness of the sample left in the mouth after
swallowing.
-
bitterness A bitter taste left in the mouth after swallowing. 0.3 g/l caffeine solution (~10 ml served pp)
metallic A metallic flavour remaining in the mouth after swallowing
sample.
Aluminium foil (~5 cm2) chewed and discarded
ACCEPTED MANUSCRIPT

ACC
EPTE
D M
ANU
SCR
IPT
24
Table 3 Statistical analysis (F ratios and significance for effects of 10 cooked unpolished rice
samples, 12 panellists, 3 replicates and interactions for each sensory attribute obtained by a
mixed model analysis of variance)
Sensory attributes Sample Panellist Replicate Sample x
Panellist
Sample x
Replicate
Panellist x
Replicate
Aroma attributes
aroma intensity 15** 4** 0ns
3** 1ns
1ns
sweetness 5** 4 ** 0ns
3** 0ns
1ns
cereal 19** 2 ** 0ns
2** 0ns
1ns
brown bread 48** 10** 0ns
4** 1ns
1ns
earthy/ root
vegetable
16** 2ns
1ns
4** 1ns
1ns
grassy 11** 2* 3ns
5** 1ns
1ns
nutty 5** 6** 0ns
2** 1ns
1ns
buttery 10** 3** 0ns
2** 1ns
1ns
fermented 5** 3** 4ns
3** 1ns
1ns
Flavour attributes
flavour intensity 14** 4** 0ns
3** 2* 1ns
cereal 11** 4** 2ns
3** 1 ns
1ns
brown bread 37** 13** 1ns
5** 1 ns
1ns
ACCEPTED MANUSCRIPT

ACC
EPTE
D M
ANU
SCR
IPT
25
earthy/ root
vegetable
13** 5** 0ns
4** 1 ns
1ns
grassy 9** 3** 1ns
5** 1ns
1ns
Texture attributes
firmness 30** 9** 3ns
3** 1ns
2*
chewiness 20** 6** 4* 3** 1ns
2*
springiness 8** 6** 4* 3** 1ns
1ns
crunchiness 27** 11** 3ns
3** 1ns
1ns
stickiness 10** 5** 0ns
2** 1ns
2ns
fluffiness 10** 2** 0ns
3** 2* 2**
huskiness 22** 13** 5ns
2** 1ns
1ns
graininess 5** 5** 1ns
3** 1ns
3**
After taste
attributes
lingering 13** 2* 0ns
3** 0ns
2**
bitsy 5** 16** 0ns
3** 1ns
2**
bitterness 13** 6** 0ns
2** 0ns
1ns
metallic 2* 6** 3ns
4** 1ns
1 ns
Statistical significant F ratios indicated by ** (p<0.01), * (p<0.05), ns
not significant
ACCEPTED MANUSCRIPT

ACCEPTED MANUSCRIPT
26
Figure 1 Appearance and colour parameters in L, C, h system, minimum cooking time (MCT) in min, and percentage of bursting grain for
cooked unpolished rice samples
ACCEPTED MANUSCRIPT

ACCEPTED MANUSCRIPT
27
ACCEPTED MANUSCRIPT

ACCEPTED MANUSCRIPT
28
Fig 2 PCA bi-plot of the sensory properties of 10 cooked unpolished rice samples (n=3 replicates x 12 panellists). (a), aroma attributes; (b),
flavour attributes; (c), texture attributes; (d), after taste attributes. : samples with a brown bran colour; : samples with a red bran colour; :
sample with a black bran colour.
ACCEPTED MANUSCRIPT

ACCEPTED MANUSCRIPT
29
Fig 3 PCA bi-plot of the sensory properties of 9 cooked unpolished rice samples (n=3 replicates x 12 panellists). (a), aroma attributes; (b),
ACCEPTED MANUSCRIPT

ACCEPTED MANUSCRIPT
30
flavour attributes; (c), texture attributes; (d), after taste attributes. : samples with a brown bran colour; : samples with a red bran colour; :
sample with a black bran colour.
ACCEPTED MANUSCRIPT

ACCEPTED MANUSCRIPT
31
ACCEPTED MANUSCRIPT

ACCEPTED MANUSCRIPT
32
Fig 4 PCA bi-plot of the physical and sensory attributes (a) of 10 cooked unpolished rice samples and (b) of 9 cooked unpolished rice samples
(n=3 replicates x 12 panellists). : samples with a brown bran colour; : samples with a red bran colour; : sample with a black bran colour
ACCEPTED MANUSCRIPT

ACCEPTED MANUSCRIPT
33
Graphical abstract
ACCEPTED MANUSCRIPT

ACCEPTED MANUSCRIPT
34
Highlights
The longer the cooking time required the higher the firmness score for cooked unpolished rice due to bran layer characteristics.
Undesirable aroma, flavour and after taste attributes of cooked unpolished rices has a strong correlation to the presence of red bran
layers.
Australian wild rice (with a mid-red bran layer) has an acceptable eating quality similar to commercial brown rice.
Commercial and novel Australian wild rices each exhibit unique sensory properties.
ACCEPTED MANUSCRIPT