evaluation and bias correction of satellite rainfall data for
TRANSCRIPT
Hydrol. Earth Syst. Sci., 16, 133–146, 2012www.hydrol-earth-syst-sci.net/16/133/2012/doi:10.5194/hess-16-133-2012© Author(s) 2012. CC Attribution 3.0 License.
Hydrology andEarth System
Sciences
Evaluation and bias correction of satellite rainfall data for droughtmonitoring in Indonesia
R. R. E. Vernimmen1, A. Hooijer1, Mamenun2, E. Aldrian 2, and A. I. J. M. van Dijk 3
1Deltares, P.O. Box 177, 2600 MH, Delft, The Netherlands2Meteorological Climatological and Geophysical Agency of Indonesia (BMKG), Jl.Angkasa I No. 2,Jakarta 10720, P.O. Box 3540 JKT, Indonesia3CSIRO Land and Water, GPO 1666, 2601 Canberra, ACT, Australia
Correspondence to:R. R. E. Vernimmen ([email protected])
Received: 9 March 2011 – Published in Hydrol. Earth Syst. Sci. Discuss.: 22 June 2011Revised: 5 December 2011 – Accepted: 3 January 2012 – Published: 12 January 2012
Abstract. The accuracy of three satellite rainfall products(TMPA 3B42RT, CMORPH and PERSIANN) was investi-gated through comparison with grid cell average ground sta-tion rainfall data in Indonesia, with a focus on their abilityto detect patterns of low rainfall that may lead to droughtconditions. Each of the three products underestimated rain-fall in dry season months. The CMORPH and PERSIANNdata differed most from ground station data and were alsovery different from the TMPA 3B42RT data. It proved possi-ble to improve TMPA 3B42RT estimates by applying a sin-gle empirical bias correction equation that was uniform inspace and time. For the six regions investigated, this reducedthe root mean square error for estimates of dry season rain-fall totals by a mean 9 % (from 44 to 40 mm) and for an-nual totals by 14 % (from 77 to 66 mm). The resulting er-rors represent 10 % and 3 % of mean dry season and annualrainfall, respectively. The accuracy of these bias correctedTMPA 3B42RT data is considered adequate for use in real-time drought monitoring in Indonesia. Compared to droughtmonitoring with only ground stations, this use of satellite-based rainfall estimates offers important advantages in termsof accuracy, spatial coverage, timeliness and cost efficiency.
1 Introduction
Indonesia is a tropical maritime country and most of it re-ceives abundant annual rainfall; e.g. in excess of 2300 mmper year across Java (Aldrian and Djamil, 2008). In largeparts of the country, however, rainfall is highly seasonal andin some areas and seasons erratic. This is the case partic-ularly in areas furthest south of the Equator including thedensely populated island of Java as well as the southern partsof Sumatra, Kalimantan and Papua (Aldrian and Susanto,2003). In these regions, water deficits lasting several monthscan occur and cause failures of water supply systems and ofrain fed and irrigated crops (Kirono and Tapper, 1999; Nay-lor et al., 2001), as well as contribute to enhanced fire risk inforests and peat land areas (Field et al., 2004). Monitoringand understanding dry season rainfall patterns, in time andspace, can assist in better preparation for drought conditions.Outside a few densely populated areas, rainfall monitoringat ground stations over most of Indonesia does not at presentprovide data with the speed, reliability and accuracy requiredfor early warning of droughts. Moreover, ground stations aretoo sparse to achieve the coverage needed for accurate anal-ysis of rainfall patterns, especially as spatial variability inrainfall is high in this country, which has thousands of is-lands and high mountain ranges. It would therefore be usefulif satellite-based sensors could yield rainfall information thatis available with very limited delay, has adequate accuracy,
Published by Copernicus Publications on behalf of the European Geosciences Union.
134 R. R. E. Vernimmen et al.: Evaluation and bias correction of satellite rainfall data
and has full coverage over the country, including the moreremote areas. Over the last decade, several remotely sensedrainfall estimate products have been developed that use datafrom several satellites, with different types of instruments.Remote sensing of precipitation relies on the relationship be-tween rainfall rate and cloud top temperature as observed byinfrared (IR) satellite instruments, or from the influence ofrain drops and ice particles on microwave (MW) radiation,or both. In addition, the Tropical Rainfall Measuring Mis-sion (TRMM) carries a precipitation radar instrument, simi-lar to radar used on the ground for detecting rain (Huffman etal., 2007). Although radar and MW-derived estimates of in-stantaneous rainfall rates are the more accurate, the currentlybest performing remote sensing methods all combine MWand IR observations to deal with the temporally infrequentMW sampling (MW observations are from instruments onpolar-orbiting satellites and therefore infrequent; high tem-poral frequency IR observations from geostationary satellitesare needed to interpolate in time).
Several satellite precipitation products exist (see Sapianoand Arkin, 2009) but three combined MW-IR satellite pre-cipitation products have for some time been available viathe internet in near real-time, and are therefore of particularinterest for operational early warning systems.
The time series of satellite rainfall data have only re-cently become long enough for confident analysis of theirusefulness for water resources management (the earliest go-ing back to 1998). National meteorological organizations areunlikely to adopt such data as a primary information sourceunless they are thoroughly evaluated for the specific con-ditions in their countries, based on a sufficiently long his-torical record covering the full range of climate conditions.A number of comparisons of satellite precipitation productsagainst (up-scaled) station rainfall observations have beenpublished, varying from detailed local and short-term com-parisons (Curtis et al., 2007; Scheel et al., 2011; Villariniand Krajewski, 2007) to ongoing initiatives providing near-real time evaluation statistics over large areas (Ebert et al.,2007). Most quantitative satellite rainfall evaluation studiesfocus on northern America, Europe and Australia, and fewhave evaluated the accuracy of satellite products in humidtropical environments outside these continents.
Within the hydrological community, studies using satelliterainfall have mostly focused on potential use in river flowforecasting (Behrangi et al., 2011; Su et al., 2008), often withan emphasis on the ability to accurately measure high rainfallrather than low rainfall. Most studies concluded that TRMMdata are usefully accurate at monthly time steps, but less soat daily time steps (Su et al., 2008), which limits its use forflood forecasting. Current uses of satellite rainfall productsin water resources monitoring systems early drought warningsystems were reviewed by Van Dijk and Renzullo (2011).In general, operational systems currently use rainfall esti-mates produced by weather forecasting systems (which as-similate satellite observations) and/or gauge-based rainfall
estimates. However, the potential value of satellite precip-itation products for regions with poor on-ground networksis well recognised, and TRMM Multi-satellite Precipita-tion Analysis (TMPA) and PERSIANN (Precipitation Es-timation from Remotely Sensed Information Using NeuralNetworks) rainfall estimates are used in the experimentalAfrican Drought Monitor (Sheffield et al., 2008).
We are not aware of any studies examining the suitabilityof satellite rainfall products for water resources or droughtmonitoring in seasonal tropical maritime environments suchas found in Indonesia. In this setting, accurate knowledge ofrainfall during dry periods is especially critical. The strongmaritime influence and relief cause very high spatial vari-ability in rainfall that challenges interpolation on the basisof on-ground gauges. This means that satellite products maypotentially play a valuable role, but their accuracy too, maybe influenced by topography and coastal influences. In thisstudy, we investigate the accuracy of three satellite rainfallproducts for Indonesia. In addition, we developed a simplemethod to correct the products for bias in real-time to achievea better agreement with rainfall measured at ground stations.
2 Methods and results
2.1 Satellite rainfall products
We studied the real-time products TMPA 3B42RT (Huffmanet al., 2007), CMORPH (Joyce et al., 2004) and PERSIANN(Sorooshian et al., 2000). All are available at 0.25◦
× 0.25◦
spatial resolution and 3-h temporal resolution.Each of the three products evaluated here combines MW
and IR data in somewhat different ways. The real-timeTRMM Multi-satellite Precipitation Analysis 3B42 RealTime product (TMPA 3B42RT, Huffman et al., 2007) usesMW-derived precipitation estimates available from varioussatellites within the 3 h time step and 0.25◦ grid cell, afterwhich missing data are estimated using IR estimates cali-brated against the MW-derived values; in addition, it is theonly product to use the TRMM instrument radar observa-tions. The Precipitation Estimation from Remotely SensedInformation Using Neural Networks product (PERSIANN,Sorooshian et al., 2000) is developed with artificial neuralnetworks estimating rain rates from IR data, with adjust-ments in the network parameters based on MW-derived andon-ground rain rates where available (Hsu et al., 1997). TheClimate Prediction Center Morphing product (CMORPH,Joyce et al., 2004) product uses IR-based cloud tracking tointerpolate between successive precipitation fields derivedfrom MW observations.
Hydrol. Earth Syst. Sci., 16, 133–146, 2012 www.hydrol-earth-syst-sci.net/16/133/2012/
R. R. E. Vernimmen et al.: Evaluation and bias correction of satellite rainfall data 135
0 1,000500Kilometers
(a) Java
Sumatra Kalimantan
Papua
Malaysia
PNGIndonesia
!!
!!! !
!!
! !
! !!
!
! !!
! !!
!!
! !!!
!!!
!!
!!
!!
!! !
!!
!!
!!
!!
!
!
!!
!
!
!!!
!!!
!! !
!
!
!!
!
!
!!!
!!
!!!!
0 5 00250Kilometers
Lampung
Jakarta
BogorBandung
East Java
Banjar Baru
(b)
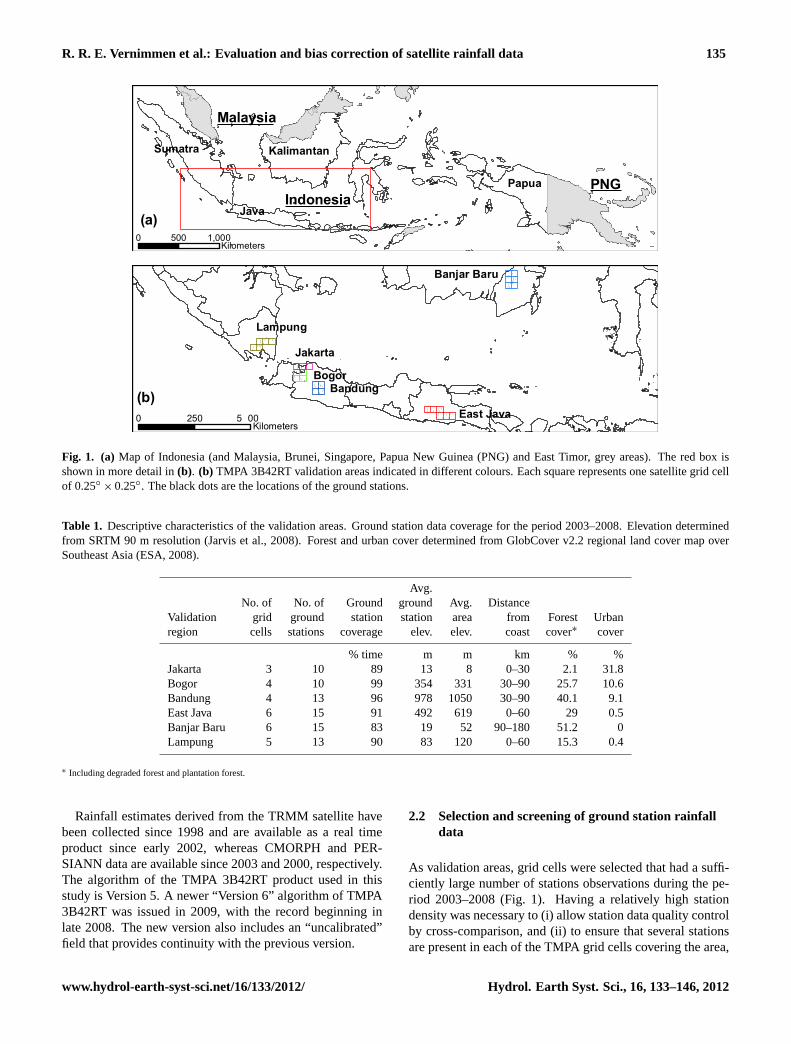
Fig. 1. (a) Map of Indonesia (and Malaysia, Brunei, Singapore, Papua New Guinea (PNG) and East Timor, grey areas). The red box isshown in more detail in(b). (b) TMPA 3B42RT validation areas indicated in different colours. Each square represents one satellite grid cellof 0.25◦ × 0.25◦. The black dots are the locations of the ground stations.
Table 1. Descriptive characteristics of the validation areas. Ground station data coverage for the period 2003–2008. Elevation determinedfrom SRTM 90 m resolution (Jarvis et al., 2008). Forest and urban cover determined from GlobCover v2.2 regional land cover map overSoutheast Asia (ESA, 2008).
Avg.No. of No. of Ground ground Avg. Distance
Validation grid ground station station area from Forest Urbanregion cells stations coverage elev. elev. coast cover∗ cover
% time m m km % %Jakarta 3 10 89 13 8 0–30 2.1 31.8Bogor 4 10 99 354 331 30–90 25.7 10.6Bandung 4 13 96 978 1050 30–90 40.1 9.1East Java 6 15 91 492 619 0–60 29 0.5Banjar Baru 6 15 83 19 52 90–180 51.2 0Lampung 5 13 90 83 120 0–60 15.3 0.4
∗ Including degraded forest and plantation forest.
Rainfall estimates derived from the TRMM satellite havebeen collected since 1998 and are available as a real timeproduct since early 2002, whereas CMORPH and PER-SIANN data are available since 2003 and 2000, respectively.The algorithm of the TMPA 3B42RT product used in thisstudy is Version 5. A newer “Version 6” algorithm of TMPA3B42RT was issued in 2009, with the record beginning inlate 2008. The new version also includes an “uncalibrated”field that provides continuity with the previous version.
2.2 Selection and screening of ground station rainfalldata
As validation areas, grid cells were selected that had a suffi-ciently large number of stations observations during the pe-riod 2003–2008 (Fig. 1). Having a relatively high stationdensity was necessary to (i) allow station data quality controlby cross-comparison, and (ii) to ensure that several stationsare present in each of the TMPA grid cells covering the area,
www.hydrol-earth-syst-sci.net/16/133/2012/ Hydrol. Earth Syst. Sci., 16, 133–146, 2012
136 R. R. E. Vernimmen et al.: Evaluation and bias correction of satellite rainfall data
24
1
Fig. 2. Monthly ground station rainfall records for the period 2003-2008 in a single satellite2
grid cell, around Bogor.3
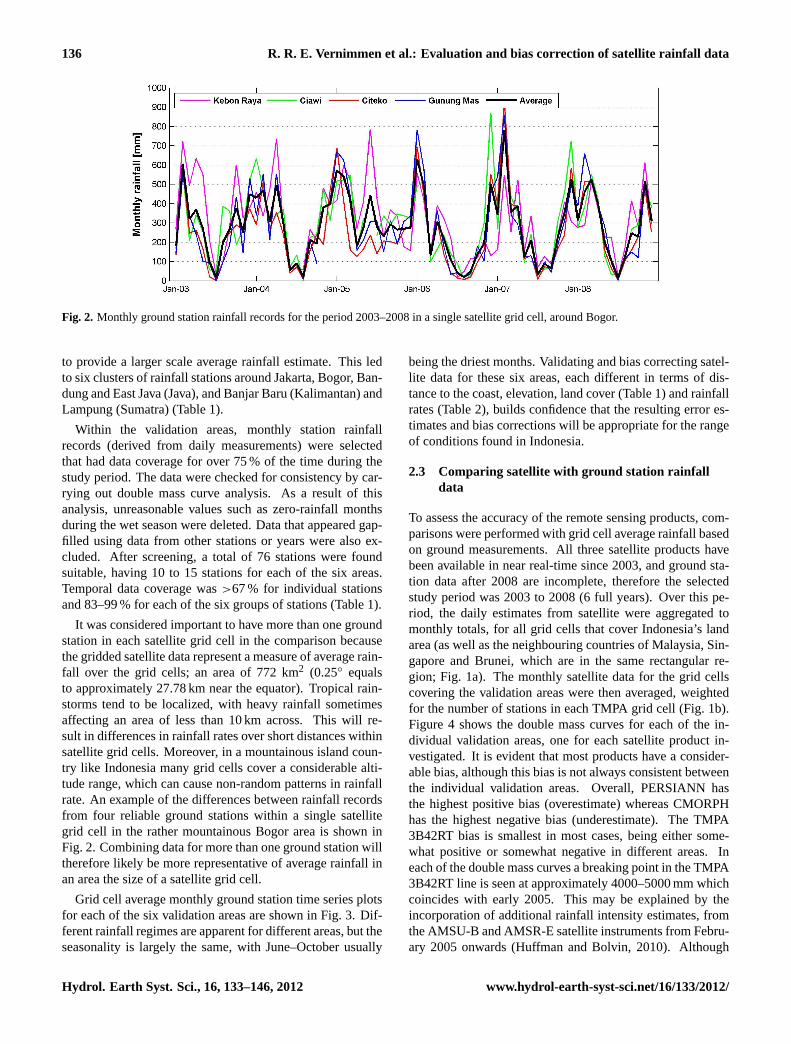
Fig. 2. Monthly ground station rainfall records for the period 2003–2008 in a single satellite grid cell, around Bogor.
to provide a larger scale average rainfall estimate. This ledto six clusters of rainfall stations around Jakarta, Bogor, Ban-dung and East Java (Java), and Banjar Baru (Kalimantan) andLampung (Sumatra) (Table 1).
Within the validation areas, monthly station rainfallrecords (derived from daily measurements) were selectedthat had data coverage for over 75 % of the time during thestudy period. The data were checked for consistency by car-rying out double mass curve analysis. As a result of thisanalysis, unreasonable values such as zero-rainfall monthsduring the wet season were deleted. Data that appeared gap-filled using data from other stations or years were also ex-cluded. After screening, a total of 76 stations were foundsuitable, having 10 to 15 stations for each of the six areas.Temporal data coverage was>67 % for individual stationsand 83–99 % for each of the six groups of stations (Table 1).
It was considered important to have more than one groundstation in each satellite grid cell in the comparison becausethe gridded satellite data represent a measure of average rain-fall over the grid cells; an area of 772 km2 (0.25◦ equalsto approximately 27.78 km near the equator). Tropical rain-storms tend to be localized, with heavy rainfall sometimesaffecting an area of less than 10 km across. This will re-sult in differences in rainfall rates over short distances withinsatellite grid cells. Moreover, in a mountainous island coun-try like Indonesia many grid cells cover a considerable alti-tude range, which can cause non-random patterns in rainfallrate. An example of the differences between rainfall recordsfrom four reliable ground stations within a single satellitegrid cell in the rather mountainous Bogor area is shown inFig. 2. Combining data for more than one ground station willtherefore likely be more representative of average rainfall inan area the size of a satellite grid cell.
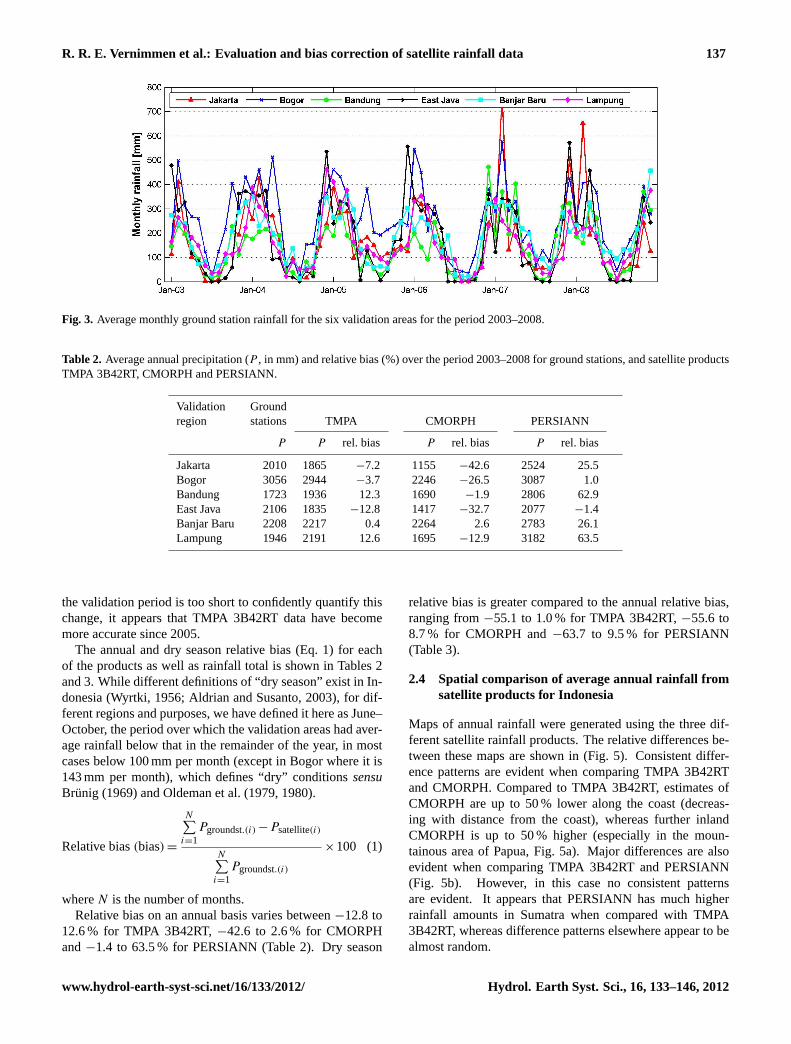
Grid cell average monthly ground station time series plotsfor each of the six validation areas are shown in Fig. 3. Dif-ferent rainfall regimes are apparent for different areas, but theseasonality is largely the same, with June–October usually
being the driest months. Validating and bias correcting satel-lite data for these six areas, each different in terms of dis-tance to the coast, elevation, land cover (Table 1) and rainfallrates (Table 2), builds confidence that the resulting error es-timates and bias corrections will be appropriate for the rangeof conditions found in Indonesia.
2.3 Comparing satellite with ground station rainfalldata
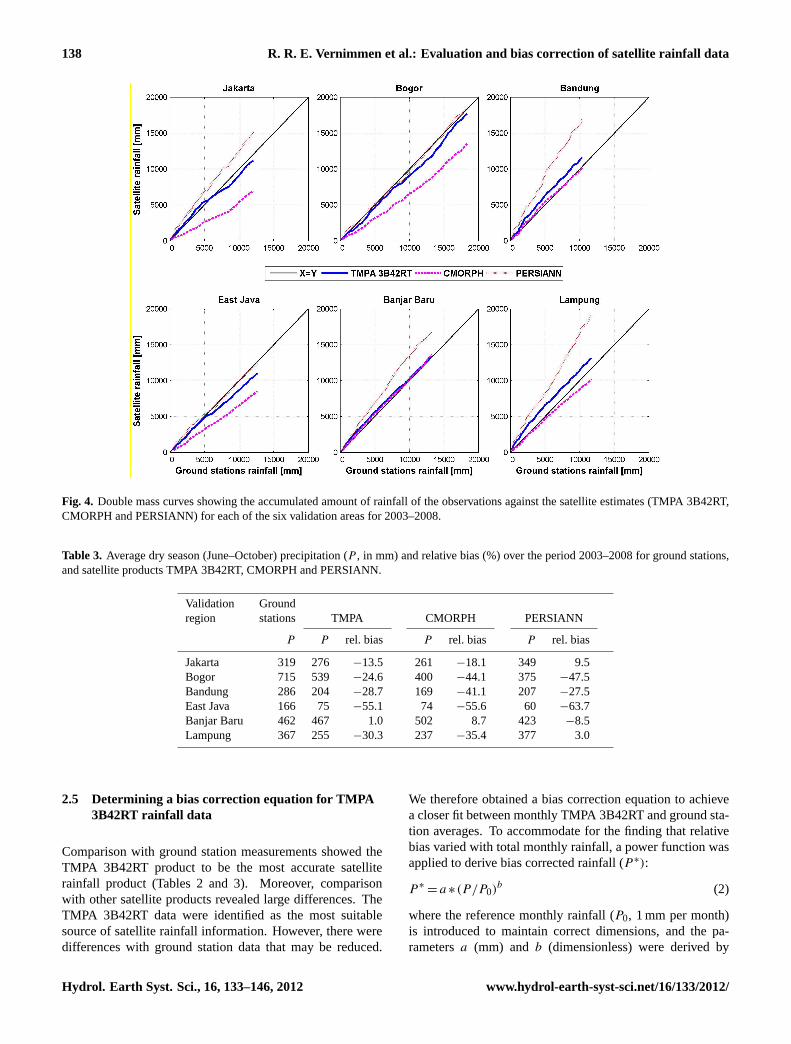
To assess the accuracy of the remote sensing products, com-parisons were performed with grid cell average rainfall basedon ground measurements. All three satellite products havebeen available in near real-time since 2003, and ground sta-tion data after 2008 are incomplete, therefore the selectedstudy period was 2003 to 2008 (6 full years). Over this pe-riod, the daily estimates from satellite were aggregated tomonthly totals, for all grid cells that cover Indonesia’s landarea (as well as the neighbouring countries of Malaysia, Sin-gapore and Brunei, which are in the same rectangular re-gion; Fig. 1a). The monthly satellite data for the grid cellscovering the validation areas were then averaged, weightedfor the number of stations in each TMPA grid cell (Fig. 1b).Figure 4 shows the double mass curves for each of the in-dividual validation areas, one for each satellite product in-vestigated. It is evident that most products have a consider-able bias, although this bias is not always consistent betweenthe individual validation areas. Overall, PERSIANN hasthe highest positive bias (overestimate) whereas CMORPHhas the highest negative bias (underestimate). The TMPA3B42RT bias is smallest in most cases, being either some-what positive or somewhat negative in different areas. Ineach of the double mass curves a breaking point in the TMPA3B42RT line is seen at approximately 4000–5000 mm whichcoincides with early 2005. This may be explained by theincorporation of additional rainfall intensity estimates, fromthe AMSU-B and AMSR-E satellite instruments from Febru-ary 2005 onwards (Huffman and Bolvin, 2010). Although
Hydrol. Earth Syst. Sci., 16, 133–146, 2012 www.hydrol-earth-syst-sci.net/16/133/2012/
R. R. E. Vernimmen et al.: Evaluation and bias correction of satellite rainfall data 137
25
1
Fig. 3. Average monthly ground station rainfall for the six validation areas for the period2
2003-2008.3
Fig. 3. Average monthly ground station rainfall for the six validation areas for the period 2003–2008.
Table 2. Average annual precipitation (P , in mm) and relative bias (%) over the period 2003–2008 for ground stations, and satellite productsTMPA 3B42RT, CMORPH and PERSIANN.
Validation Groundregion stations TMPA CMORPH PERSIANN
P P rel. bias P rel. bias P rel. bias
Jakarta 2010 1865 −7.2 1155 −42.6 2524 25.5Bogor 3056 2944 −3.7 2246 −26.5 3087 1.0Bandung 1723 1936 12.3 1690 −1.9 2806 62.9East Java 2106 1835 −12.8 1417 −32.7 2077 −1.4Banjar Baru 2208 2217 0.4 2264 2.6 2783 26.1Lampung 1946 2191 12.6 1695 −12.9 3182 63.5
the validation period is too short to confidently quantify thischange, it appears that TMPA 3B42RT data have becomemore accurate since 2005.
The annual and dry season relative bias (Eq. 1) for eachof the products as well as rainfall total is shown in Tables 2and 3. While different definitions of “dry season” exist in In-donesia (Wyrtki, 1956; Aldrian and Susanto, 2003), for dif-ferent regions and purposes, we have defined it here as June–October, the period over which the validation areas had aver-age rainfall below that in the remainder of the year, in mostcases below 100 mm per month (except in Bogor where it is143 mm per month), which defines “dry” conditionssensuBrunig (1969) and Oldeman et al. (1979, 1980).
Relative bias(bias) =
N∑i=1
Pgroundst.(i) −Psatellite(i)
N∑i=1
Pgroundst.(i)
×100 (1)
whereN is the number of months.Relative bias on an annual basis varies between−12.8 to
12.6 % for TMPA 3B42RT,−42.6 to 2.6 % for CMORPHand−1.4 to 63.5 % for PERSIANN (Table 2). Dry season
relative bias is greater compared to the annual relative bias,ranging from−55.1 to 1.0 % for TMPA 3B42RT,−55.6 to8.7 % for CMORPH and−63.7 to 9.5 % for PERSIANN(Table 3).
2.4 Spatial comparison of average annual rainfall fromsatellite products for Indonesia
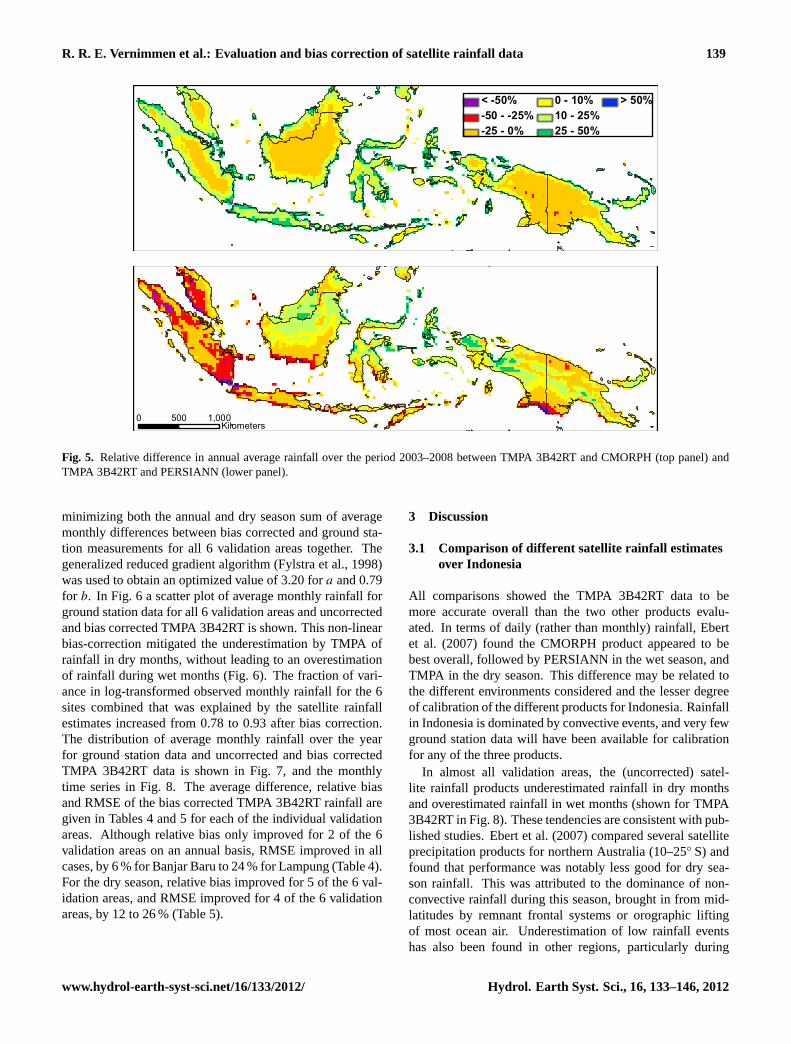
Maps of annual rainfall were generated using the three dif-ferent satellite rainfall products. The relative differences be-tween these maps are shown in (Fig. 5). Consistent differ-ence patterns are evident when comparing TMPA 3B42RTand CMORPH. Compared to TMPA 3B42RT, estimates ofCMORPH are up to 50 % lower along the coast (decreas-ing with distance from the coast), whereas further inlandCMORPH is up to 50 % higher (especially in the moun-tainous area of Papua, Fig. 5a). Major differences are alsoevident when comparing TMPA 3B42RT and PERSIANN(Fig. 5b). However, in this case no consistent patternsare evident. It appears that PERSIANN has much higherrainfall amounts in Sumatra when compared with TMPA3B42RT, whereas difference patterns elsewhere appear to bealmost random.
www.hydrol-earth-syst-sci.net/16/133/2012/ Hydrol. Earth Syst. Sci., 16, 133–146, 2012
138 R. R. E. Vernimmen et al.: Evaluation and bias correction of satellite rainfall data
26
1
Fig. 4. Double mass curves showing the accumulated amount of rainfall of the observations2
against the satellite estimates (TMPA 3B42RT, CMORPH and PERSIANN) for each of the3
six validation areas for 2003-2008.4
Fig. 4. Double mass curves showing the accumulated amount of rainfall of the observations against the satellite estimates (TMPA 3B42RT,CMORPH and PERSIANN) for each of the six validation areas for 2003–2008.
Table 3. Average dry season (June–October) precipitation (P , in mm) and relative bias (%) over the period 2003–2008 for ground stations,and satellite products TMPA 3B42RT, CMORPH and PERSIANN.
Validation Groundregion stations TMPA CMORPH PERSIANN
P P rel. bias P rel. bias P rel. bias
Jakarta 319 276 −13.5 261 −18.1 349 9.5Bogor 715 539 −24.6 400 −44.1 375 −47.5Bandung 286 204 −28.7 169 −41.1 207 −27.5East Java 166 75 −55.1 74 −55.6 60 −63.7Banjar Baru 462 467 1.0 502 8.7 423 −8.5Lampung 367 255 −30.3 237 −35.4 377 3.0
2.5 Determining a bias correction equation for TMPA3B42RT rainfall data
Comparison with ground station measurements showed theTMPA 3B42RT product to be the most accurate satelliterainfall product (Tables 2 and 3). Moreover, comparisonwith other satellite products revealed large differences. TheTMPA 3B42RT data were identified as the most suitablesource of satellite rainfall information. However, there weredifferences with ground station data that may be reduced.
We therefore obtained a bias correction equation to achievea closer fit between monthly TMPA 3B42RT and ground sta-tion averages. To accommodate for the finding that relativebias varied with total monthly rainfall, a power function wasapplied to derive bias corrected rainfall (P ∗):
P ∗= a∗(P/P0)
b (2)
where the reference monthly rainfall (P0, 1 mm per month)is introduced to maintain correct dimensions, and the pa-rametersa (mm) andb (dimensionless) were derived by
Hydrol. Earth Syst. Sci., 16, 133–146, 2012 www.hydrol-earth-syst-sci.net/16/133/2012/
R. R. E. Vernimmen et al.: Evaluation and bias correction of satellite rainfall data 139
< -50%-50 - -25%-25 - 0%
0 - 10%10 - 25%25 - 50%
> 50%
0 1,000500Kilometers
Fig. 5. Relative difference in annual average rainfall over the period 2003–2008 between TMPA 3B42RT and CMORPH (top panel) andTMPA 3B42RT and PERSIANN (lower panel).
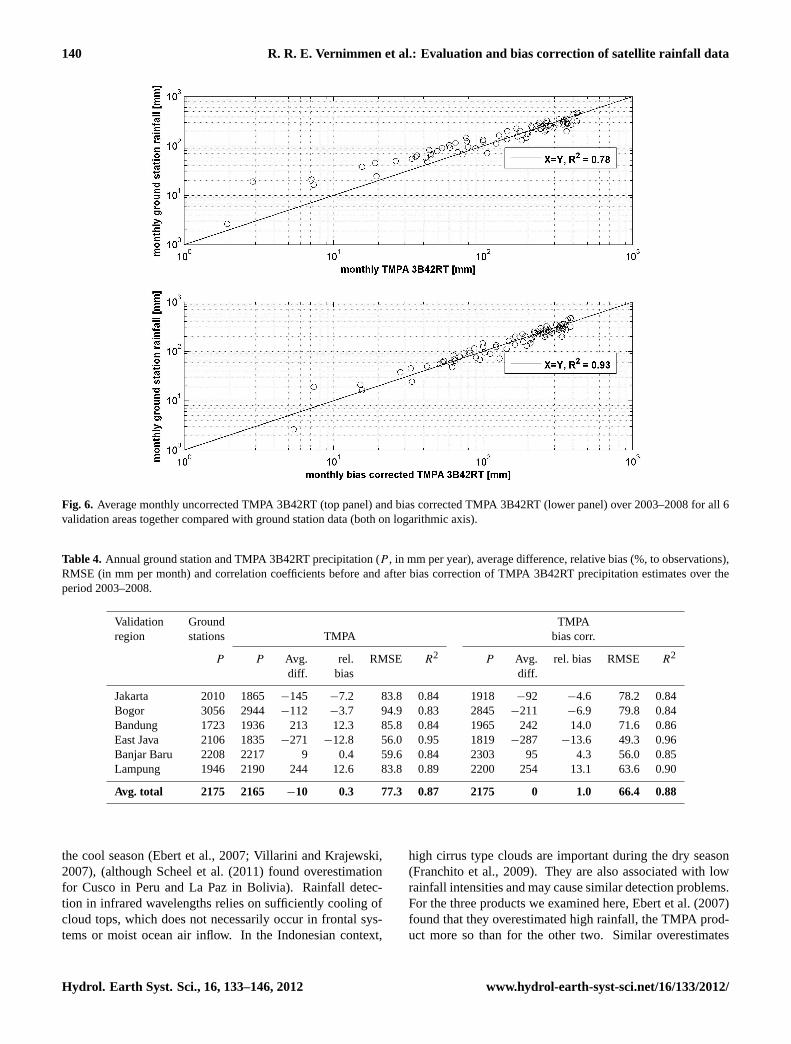
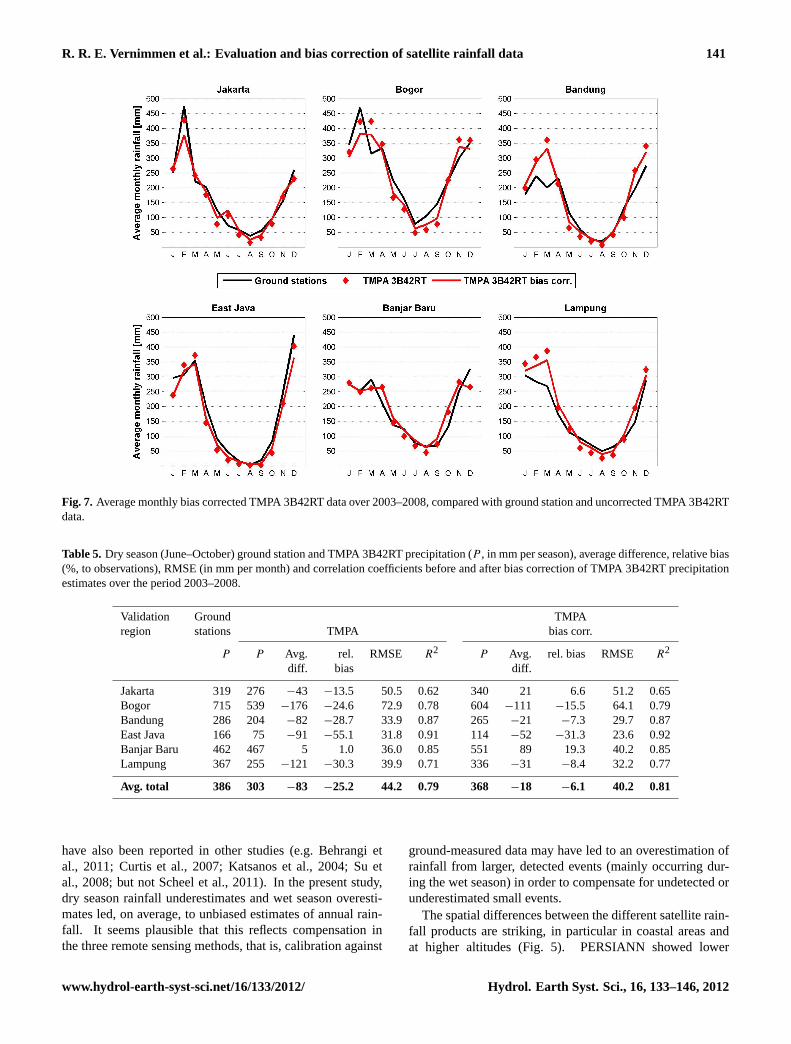
minimizing both the annual and dry season sum of averagemonthly differences between bias corrected and ground sta-tion measurements for all 6 validation areas together. Thegeneralized reduced gradient algorithm (Fylstra et al., 1998)was used to obtain an optimized value of 3.20 fora and 0.79for b. In Fig. 6 a scatter plot of average monthly rainfall forground station data for all 6 validation areas and uncorrectedand bias corrected TMPA 3B42RT is shown. This non-linearbias-correction mitigated the underestimation by TMPA ofrainfall in dry months, without leading to an overestimationof rainfall during wet months (Fig. 6). The fraction of vari-ance in log-transformed observed monthly rainfall for the 6sites combined that was explained by the satellite rainfallestimates increased from 0.78 to 0.93 after bias correction.The distribution of average monthly rainfall over the yearfor ground station data and uncorrected and bias correctedTMPA 3B42RT data is shown in Fig. 7, and the monthlytime series in Fig. 8. The average difference, relative biasand RMSE of the bias corrected TMPA 3B42RT rainfall aregiven in Tables 4 and 5 for each of the individual validationareas. Although relative bias only improved for 2 of the 6validation areas on an annual basis, RMSE improved in allcases, by 6 % for Banjar Baru to 24 % for Lampung (Table 4).For the dry season, relative bias improved for 5 of the 6 val-idation areas, and RMSE improved for 4 of the 6 validationareas, by 12 to 26 % (Table 5).
3 Discussion
3.1 Comparison of different satellite rainfall estimatesover Indonesia
All comparisons showed the TMPA 3B42RT data to bemore accurate overall than the two other products evalu-ated. In terms of daily (rather than monthly) rainfall, Ebertet al. (2007) found the CMORPH product appeared to bebest overall, followed by PERSIANN in the wet season, andTMPA in the dry season. This difference may be related tothe different environments considered and the lesser degreeof calibration of the different products for Indonesia. Rainfallin Indonesia is dominated by convective events, and very fewground station data will have been available for calibrationfor any of the three products.
In almost all validation areas, the (uncorrected) satel-lite rainfall products underestimated rainfall in dry monthsand overestimated rainfall in wet months (shown for TMPA3B42RT in Fig. 8). These tendencies are consistent with pub-lished studies. Ebert et al. (2007) compared several satelliteprecipitation products for northern Australia (10–25◦ S) andfound that performance was notably less good for dry sea-son rainfall. This was attributed to the dominance of non-convective rainfall during this season, brought in from mid-latitudes by remnant frontal systems or orographic liftingof most ocean air. Underestimation of low rainfall eventshas also been found in other regions, particularly during
www.hydrol-earth-syst-sci.net/16/133/2012/ Hydrol. Earth Syst. Sci., 16, 133–146, 2012
140 R. R. E. Vernimmen et al.: Evaluation and bias correction of satellite rainfall data
28
1
Fig. 6. Average monthly uncorrected TMPA 3B42RT (top panel) and bias corrected TMPA2
3B42RT (lower panel) over 2003-2008 for all 6 validation areas together compared with3
ground station data (both on logarithmic axis).4
Fig. 6. Average monthly uncorrected TMPA 3B42RT (top panel) and bias corrected TMPA 3B42RT (lower panel) over 2003–2008 for all 6validation areas together compared with ground station data (both on logarithmic axis).
Table 4. Annual ground station and TMPA 3B42RT precipitation (P , in mm per year), average difference, relative bias (%, to observations),RMSE (in mm per month) and correlation coefficients before and after bias correction of TMPA 3B42RT precipitation estimates over theperiod 2003–2008.
Validation Ground TMPAregion stations TMPA bias corr.
P P Avg. rel. RMSE R2 P Avg. rel. bias RMSE R2
diff. bias diff.
Jakarta 2010 1865 −145 −7.2 83.8 0.84 1918 −92 −4.6 78.2 0.84Bogor 3056 2944 −112 −3.7 94.9 0.83 2845 −211 −6.9 79.8 0.84Bandung 1723 1936 213 12.3 85.8 0.84 1965 242 14.0 71.6 0.86East Java 2106 1835 −271 −12.8 56.0 0.95 1819 −287 −13.6 49.3 0.96Banjar Baru 2208 2217 9 0.4 59.6 0.84 2303 95 4.3 56.0 0.85Lampung 1946 2190 244 12.6 83.8 0.89 2200 254 13.1 63.6 0.90
Avg. total 2175 2165 −10 0.3 77.3 0.87 2175 0 1.0 66.4 0.88
the cool season (Ebert et al., 2007; Villarini and Krajewski,2007), (although Scheel et al. (2011) found overestimationfor Cusco in Peru and La Paz in Bolivia). Rainfall detec-tion in infrared wavelengths relies on sufficiently cooling ofcloud tops, which does not necessarily occur in frontal sys-tems or moist ocean air inflow. In the Indonesian context,
high cirrus type clouds are important during the dry season(Franchito et al., 2009). They are also associated with lowrainfall intensities and may cause similar detection problems.For the three products we examined here, Ebert et al. (2007)found that they overestimated high rainfall, the TMPA prod-uct more so than for the other two. Similar overestimates
Hydrol. Earth Syst. Sci., 16, 133–146, 2012 www.hydrol-earth-syst-sci.net/16/133/2012/
R. R. E. Vernimmen et al.: Evaluation and bias correction of satellite rainfall data 141
29
1
Fig. 7. Average monthly bias corrected TMPA 3B42RT data over 2003-2008, compared with2
ground station and uncorrected TMPA 3B42RT data.3
Fig. 7. Average monthly bias corrected TMPA 3B42RT data over 2003–2008, compared with ground station and uncorrected TMPA 3B42RTdata.
Table 5. Dry season (June–October) ground station and TMPA 3B42RT precipitation (P , in mm per season), average difference, relative bias(%, to observations), RMSE (in mm per month) and correlation coefficients before and after bias correction of TMPA 3B42RT precipitationestimates over the period 2003–2008.
Validation Ground TMPAregion stations TMPA bias corr.
P P Avg. rel. RMSE R2 P Avg. rel. bias RMSE R2
diff. bias diff.
Jakarta 319 276 −43 −13.5 50.5 0.62 340 21 6.6 51.2 0.65Bogor 715 539 −176 −24.6 72.9 0.78 604 −111 −15.5 64.1 0.79Bandung 286 204 −82 −28.7 33.9 0.87 265 −21 −7.3 29.7 0.87East Java 166 75 −91 −55.1 31.8 0.91 114 −52 −31.3 23.6 0.92Banjar Baru 462 467 5 1.0 36.0 0.85 551 89 19.3 40.2 0.85Lampung 367 255 −121 −30.3 39.9 0.71 336 −31 −8.4 32.2 0.77
Avg. total 386 303 −83 −25.2 44.2 0.79 368 −18 −6.1 40.2 0.81
have also been reported in other studies (e.g. Behrangi etal., 2011; Curtis et al., 2007; Katsanos et al., 2004; Su etal., 2008; but not Scheel et al., 2011). In the present study,dry season rainfall underestimates and wet season overesti-mates led, on average, to unbiased estimates of annual rain-fall. It seems plausible that this reflects compensation inthe three remote sensing methods, that is, calibration against
ground-measured data may have led to an overestimation ofrainfall from larger, detected events (mainly occurring dur-ing the wet season) in order to compensate for undetected orunderestimated small events.
The spatial differences between the different satellite rain-fall products are striking, in particular in coastal areas andat higher altitudes (Fig. 5). PERSIANN showed lower
www.hydrol-earth-syst-sci.net/16/133/2012/ Hydrol. Earth Syst. Sci., 16, 133–146, 2012
142 R. R. E. Vernimmen et al.: Evaluation and bias correction of satellite rainfall data
30
1
Fig. 8. Comparison of average monthly ground station rainfall with bias corrected and2
uncorrected TMPA 3B42RT for the individual validation areas.3
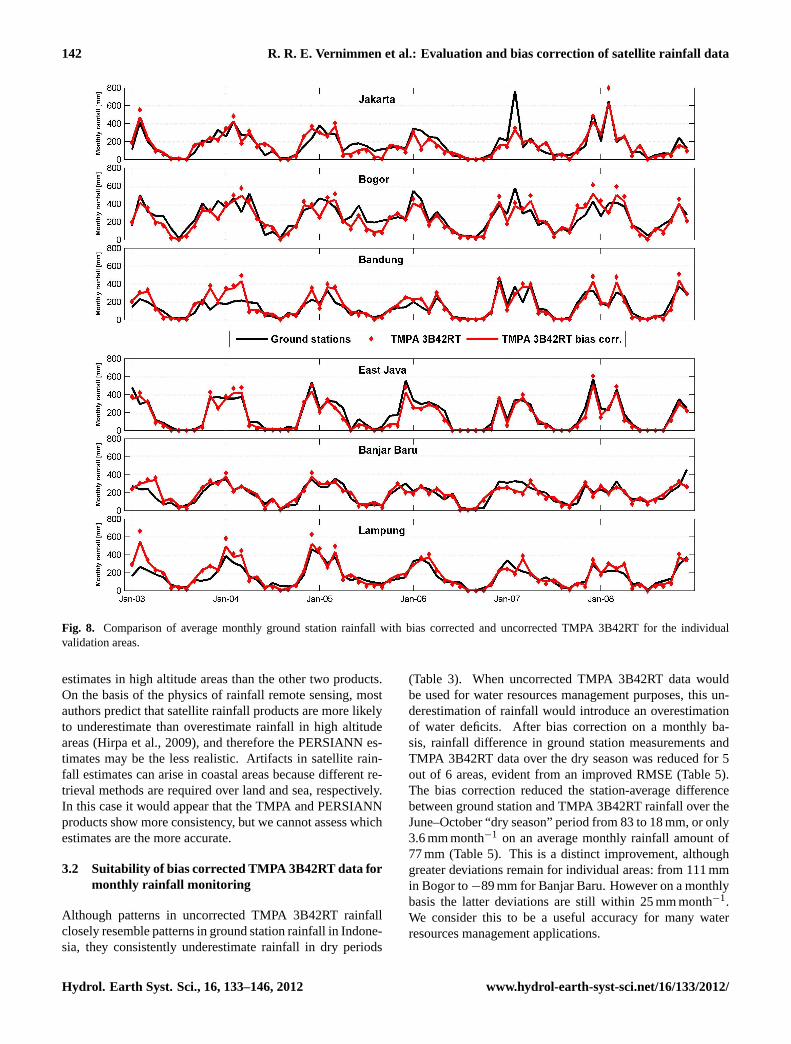
Fig. 8. Comparison of average monthly ground station rainfall with bias corrected and uncorrected TMPA 3B42RT for the individualvalidation areas.
estimates in high altitude areas than the other two products.On the basis of the physics of rainfall remote sensing, mostauthors predict that satellite rainfall products are more likelyto underestimate than overestimate rainfall in high altitudeareas (Hirpa et al., 2009), and therefore the PERSIANN es-timates may be the less realistic. Artifacts in satellite rain-fall estimates can arise in coastal areas because different re-trieval methods are required over land and sea, respectively.In this case it would appear that the TMPA and PERSIANNproducts show more consistency, but we cannot assess whichestimates are the more accurate.
3.2 Suitability of bias corrected TMPA 3B42RT data formonthly rainfall monitoring
Although patterns in uncorrected TMPA 3B42RT rainfallclosely resemble patterns in ground station rainfall in Indone-sia, they consistently underestimate rainfall in dry periods
(Table 3). When uncorrected TMPA 3B42RT data wouldbe used for water resources management purposes, this un-derestimation of rainfall would introduce an overestimationof water deficits. After bias correction on a monthly ba-sis, rainfall difference in ground station measurements andTMPA 3B42RT data over the dry season was reduced for 5out of 6 areas, evident from an improved RMSE (Table 5).The bias correction reduced the station-average differencebetween ground station and TMPA 3B42RT rainfall over theJune–October “dry season” period from 83 to 18 mm, or only3.6 mm month−1 on an average monthly rainfall amount of77 mm (Table 5). This is a distinct improvement, althoughgreater deviations remain for individual areas: from 111 mmin Bogor to−89 mm for Banjar Baru. However on a monthlybasis the latter deviations are still within 25 mm month−1.We consider this to be a useful accuracy for many waterresources management applications.
Hydrol. Earth Syst. Sci., 16, 133–146, 2012 www.hydrol-earth-syst-sci.net/16/133/2012/
R. R. E. Vernimmen et al.: Evaluation and bias correction of satellite rainfall data 143
31
1
Fig. 9. Bias ratio vs. elevation for the individual ground stations in the six validation areas (R22
= 0.0001, n = 73; of the 76 available stations (Table 1), 3 did not have any full year of3
validated observations).4
5
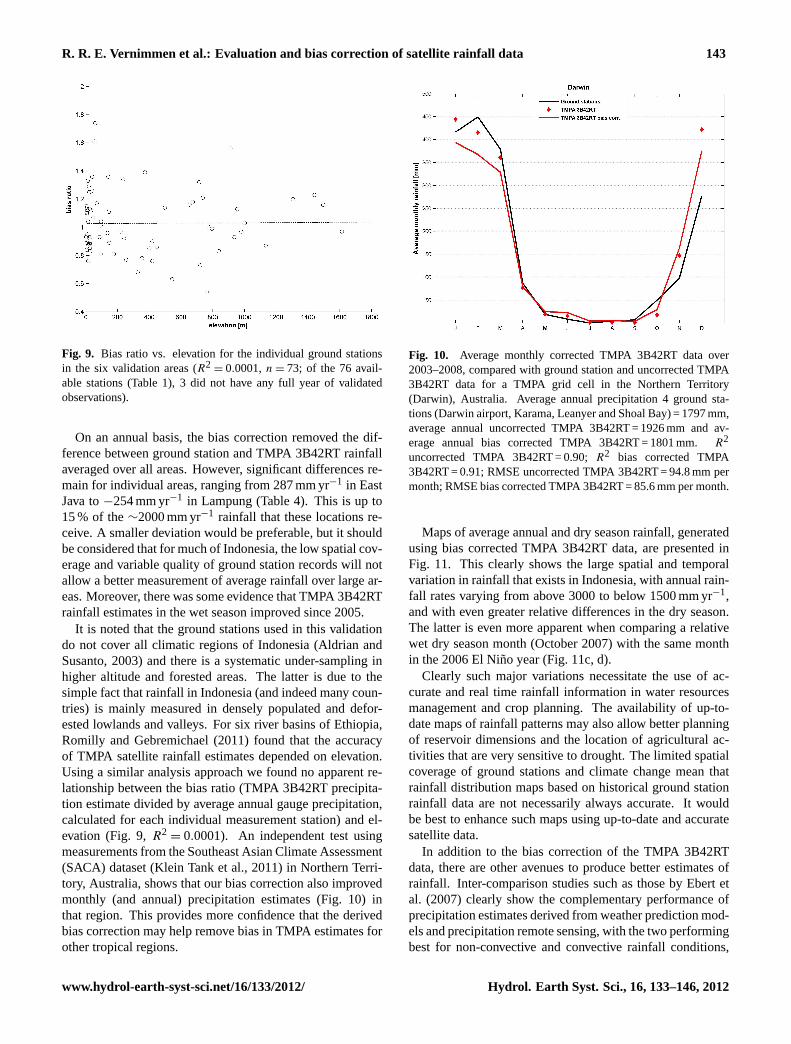
Fig. 9. Bias ratio vs. elevation for the individual ground stationsin the six validation areas (R2
= 0.0001,n = 73; of the 76 avail-able stations (Table 1), 3 did not have any full year of validatedobservations).
On an annual basis, the bias correction removed the dif-ference between ground station and TMPA 3B42RT rainfallaveraged over all areas. However, significant differences re-main for individual areas, ranging from 287 mm yr−1 in EastJava to−254 mm yr−1 in Lampung (Table 4). This is up to15 % of the∼2000 mm yr−1 rainfall that these locations re-ceive. A smaller deviation would be preferable, but it shouldbe considered that for much of Indonesia, the low spatial cov-erage and variable quality of ground station records will notallow a better measurement of average rainfall over large ar-eas. Moreover, there was some evidence that TMPA 3B42RTrainfall estimates in the wet season improved since 2005.
It is noted that the ground stations used in this validationdo not cover all climatic regions of Indonesia (Aldrian andSusanto, 2003) and there is a systematic under-sampling inhigher altitude and forested areas. The latter is due to thesimple fact that rainfall in Indonesia (and indeed many coun-tries) is mainly measured in densely populated and defor-ested lowlands and valleys. For six river basins of Ethiopia,Romilly and Gebremichael (2011) found that the accuracyof TMPA satellite rainfall estimates depended on elevation.Using a similar analysis approach we found no apparent re-lationship between the bias ratio (TMPA 3B42RT precipita-tion estimate divided by average annual gauge precipitation,calculated for each individual measurement station) and el-evation (Fig. 9,R2
= 0.0001). An independent test usingmeasurements from the Southeast Asian Climate Assessment(SACA) dataset (Klein Tank et al., 2011) in Northern Terri-tory, Australia, shows that our bias correction also improvedmonthly (and annual) precipitation estimates (Fig. 10) inthat region. This provides more confidence that the derivedbias correction may help remove bias in TMPA estimates forother tropical regions.
32
1
Fig. 10. Average monthly corrected TMPA 3B42RT data over 2003-2008, compared with2
ground station and uncorrected TMPA 3B42RT data for a TMPA grid cell in the Northern3
Territory (Darwin), Australia. Average annual precipitation 4 ground stations (Darwin airport,4
Karama, Leanyer and Shoal Bay) = 1797 mm, average annual uncorrected TMPA 3B42RT =5
1926 mm and average annual bias corrected TMPA 3B42RT = 1801 mm. R2 uncorrected6
TMPA 3B42RT = 0.90; R2 bias corrected TMPA 3B42RT = 0.91; RMSE uncorrected TMPA7
3B42RT = 94.8 mm per month; RMSE bias corrected TMPA 3B42RT = 85.6 mm per month.8
Fig. 10. Average monthly corrected TMPA 3B42RT data over2003–2008, compared with ground station and uncorrected TMPA3B42RT data for a TMPA grid cell in the Northern Territory(Darwin), Australia. Average annual precipitation 4 ground sta-tions (Darwin airport, Karama, Leanyer and Shoal Bay) = 1797 mm,average annual uncorrected TMPA 3B42RT = 1926 mm and av-erage annual bias corrected TMPA 3B42RT = 1801 mm.R2
uncorrected TMPA 3B42RT = 0.90;R2 bias corrected TMPA3B42RT = 0.91; RMSE uncorrected TMPA 3B42RT = 94.8 mm permonth; RMSE bias corrected TMPA 3B42RT = 85.6 mm per month.
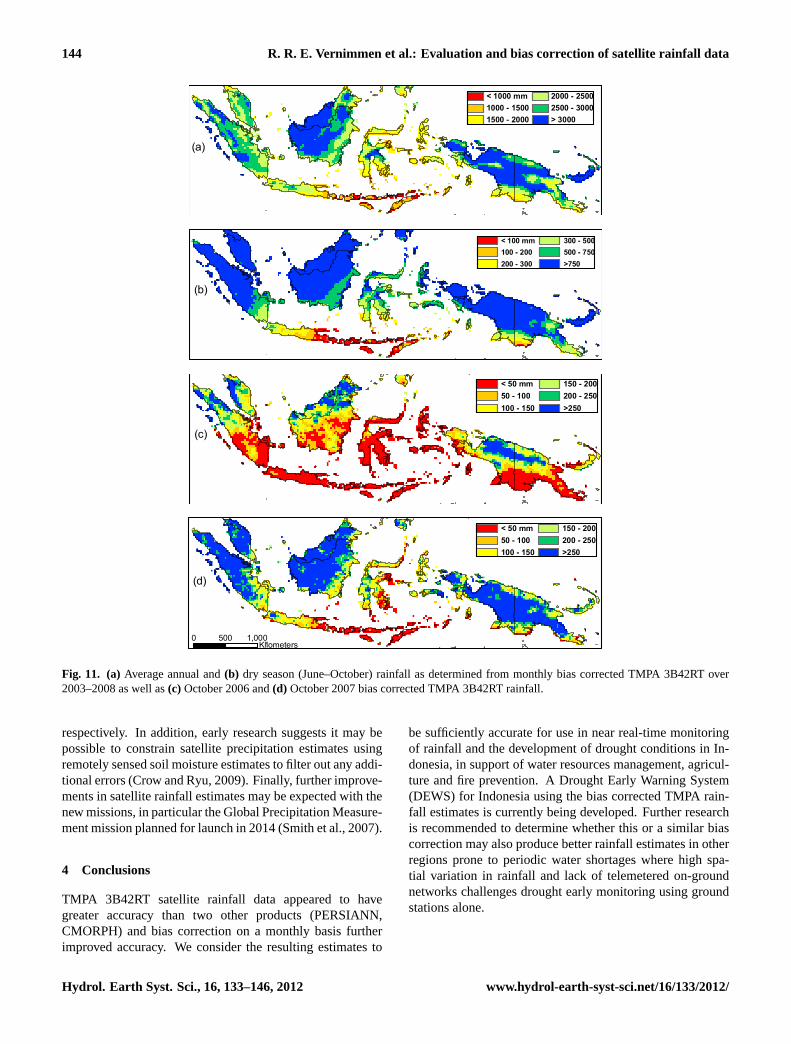
Maps of average annual and dry season rainfall, generatedusing bias corrected TMPA 3B42RT data, are presented inFig. 11. This clearly shows the large spatial and temporalvariation in rainfall that exists in Indonesia, with annual rain-fall rates varying from above 3000 to below 1500 mm yr−1,and with even greater relative differences in the dry season.The latter is even more apparent when comparing a relativewet dry season month (October 2007) with the same monthin the 2006 El Nino year (Fig. 11c, d).
Clearly such major variations necessitate the use of ac-curate and real time rainfall information in water resourcesmanagement and crop planning. The availability of up-to-date maps of rainfall patterns may also allow better planningof reservoir dimensions and the location of agricultural ac-tivities that are very sensitive to drought. The limited spatialcoverage of ground stations and climate change mean thatrainfall distribution maps based on historical ground stationrainfall data are not necessarily always accurate. It wouldbe best to enhance such maps using up-to-date and accuratesatellite data.
In addition to the bias correction of the TMPA 3B42RTdata, there are other avenues to produce better estimates ofrainfall. Inter-comparison studies such as those by Ebert etal. (2007) clearly show the complementary performance ofprecipitation estimates derived from weather prediction mod-els and precipitation remote sensing, with the two performingbest for non-convective and convective rainfall conditions,
www.hydrol-earth-syst-sci.net/16/133/2012/ Hydrol. Earth Syst. Sci., 16, 133–146, 2012
144 R. R. E. Vernimmen et al.: Evaluation and bias correction of satellite rainfall data
< 1000 mm1000 - 15001500 - 2000
2000 - 25002500 - 3000> 3000
(a)
< 100 mm100 - 200200 - 300
300 - 500500 - 750>750
(b)
< 50 mm50 - 100100 - 150
150 - 200200 - 250>250
(c)
0 1,000500Kilometers
< 50 mm50 - 100100 - 150
150 - 200200 - 250>250
(d)
Fig. 11. (a)Average annual and(b) dry season (June–October) rainfall as determined from monthly bias corrected TMPA 3B42RT over2003–2008 as well as(c) October 2006 and(d) October 2007 bias corrected TMPA 3B42RT rainfall.
respectively. In addition, early research suggests it may bepossible to constrain satellite precipitation estimates usingremotely sensed soil moisture estimates to filter out any addi-tional errors (Crow and Ryu, 2009). Finally, further improve-ments in satellite rainfall estimates may be expected with thenew missions, in particular the Global Precipitation Measure-ment mission planned for launch in 2014 (Smith et al., 2007).
4 Conclusions
TMPA 3B42RT satellite rainfall data appeared to havegreater accuracy than two other products (PERSIANN,CMORPH) and bias correction on a monthly basis furtherimproved accuracy. We consider the resulting estimates to
be sufficiently accurate for use in near real-time monitoringof rainfall and the development of drought conditions in In-donesia, in support of water resources management, agricul-ture and fire prevention. A Drought Early Warning System(DEWS) for Indonesia using the bias corrected TMPA rain-fall estimates is currently being developed. Further researchis recommended to determine whether this or a similar biascorrection may also produce better rainfall estimates in otherregions prone to periodic water shortages where high spa-tial variation in rainfall and lack of telemetered on-groundnetworks challenges drought early monitoring using groundstations alone.
Hydrol. Earth Syst. Sci., 16, 133–146, 2012 www.hydrol-earth-syst-sci.net/16/133/2012/
R. R. E. Vernimmen et al.: Evaluation and bias correction of satellite rainfall data 145
Acknowledgements.The work reported here was supported byDeltares internal R&D funding and the SDWA Peatland Pro-gramme. The Delft-FEWS system was used for processing satellitedata. Ground station rainfall data were provided by Perum JasaTirta I and BMKG, the latter which will collaborate on DEWSdevelopment through a Joint Cooperation programme betweenPusAir, BMKG, Deltares and KNMI. The manuscript benefitedfrom the insightful comments of two anonymous referees.
Edited by: S. Thompson
References
Aldrian, E. and Djamil, Y. S.: Spatio-temporal climatic change ofrainfall in East Java Indonesia, Int. J. Climatol., 28, 435–448,2008.
Aldrian, E. and Susanto, R. D.: Identification of three dominantrainfall regions within Indonesia and their relationship to sea sur-face temperature, Int. J. Climatol., 23, 1435–1452, 2003.
Behrangi, A., Khakbaz, B., Jaw, T. C., AghaKouchak, A., Hsu, K.,and Sorooshian, S.: Hydrologic evaluation of satellite precipita-tion products over a mid-size basin, J. Hydrol., 397, 225–237,2011.
Brunig, E. F.: On the seasonality of droughts in the lowlands ofSarawak (Borneo), Erdkunde, 23, 127–133, 1969.
Crow, W. T. and Ryu, D.: A new data assimilation approach forimproving runoff prediction using remotely-sensed soil moistureretrievals, Hydrol. Earth Syst. Sci., 13, 1–16,doi:10.5194/hess-13-1-2009, 2009.
Curtis, S., Crawford, T. W., and Lecce, S. A.: A comparison ofTRMM to other basin-scale estimates of rainfall during the 1999Hurricane Floyd flood. Nat. Hazards, 43, 187–198, 2007.
Ebert, E. E., Janowiak, J. E., and Kidd, C.: Comparison of near-real-time precipitation estimates from satellite observations andnumerical models, B. Am. Meteorol. Soc., 88, 47–64, 2007.
ESA: GlobCover Land Cover v2.2, European Space Agency Glob-Cover Project, led by MEDIAS-France, available at:http://ionia1.esrin.esa.int/index.asp, last access: 25 August 2009, 2008.
Field, R. D., Wang, Y., Roswintiarti, O., and Guswanto: A drought-based predictor of recent haze events in western Indonesia, At-mos. Environ., 38, 1869–1878, 2004.
Franchito, S. H., Rao, V. B., Vasques, A. C., Santo, C. M. E., andConforte, J. C.: Validation of TRMM precipitation radar monthlyrainfall estimates over Brazil, J. Geophys. Res., 114, D02105,doi:10.1029/2007JD009580, 2009.
Fylstra, D., Lasdon, L., Watson, J., and Waren, A.: Design and useof the Microsoft Excel solver, Interfaces, 28, 29–55, 1998.
Hirpa, F. A., Gebremichael, M., and Hopson, T.: Evaluation ofhigh-resolution satellite precipitation products over very com-plex terrain in Ethiopia, J. Appl. Meteorol. Climatol., 49, 1044–1051, 2010.
Hsu, K., Gao, X., Sorooshian, S., and Gupta, H. V.: Precipitation es-timation from remotely sensed information using artificial neuralnetworks, J. Appl. Meteorol., 36, 1176–1190, 1997.
Huffman, G. J. and Bolvin, D. T.: Real-Time TRMM Multi-SatellitePrecipitation Analysis data set documentation, laboratory for at-mospheres, NASA Goddard space flight center and science sys-tems and applications, Inc., 2010, available at:ftp://meso-a.gsfc.
nasa.gov/pub/trmmdocs/rt/3B4XRTdoc.pdf, last access: Febru-ary 2011, 2010.
Huffman, G. J., Adler, R. F., Bolvin, D. T., Gu, G., Nelkin, E.J., Bowman, K. P., Hong, Y., Stocker, E. F., and Wolff, D.B.: The TRMM Multisatellite Precipitation Analysis (TMPA):quasi-global, multiyear, combined-sensor precipitation estimatesat fine scales, J. Hydrometeorol., 8, 38–55, 2007.
Jarvis, A., Reuter, H. I., Nelson, A., and Guevara, E.: Hole-filled seamless SRTM data V4, International Centre for Tropi-cal Agriculture (CIAT), available at:http://srtm.csi.cgiar.org, lastaccess: 3 July 2008, 2008.
Joyce, R. J., Janowiak, J. E., Arkin, P. A., and Xie, P.: CMORPH:A method that produces global precipitation estimates from pas-sive microwave and infrared data at high spatial and temporalresolution, J. Hydrometeorol., 5, 487–503, 2004.
Katsanos, D., Lagouvardos, K., Kotroni, V., and Huffmann,G. J.: Statistical evaluation of MPA-RT high-resolution pre-cipitation estimates from satellite platforms over the centraland eastern Mediterranean, Geophys. Res. Lett., 31, L06116,doi:10.1029/2003GL019142, 2004.
Klein Tank, A. M. G. and Coauthors:. Daily dataset for cli-mate extremes analyses in Southeast Asia, in preparation, Dataand metadata available at:http://saca-bmkg.knmi.nl, last ac-cess: 22 March 2011, 2011.
Kirono, D. G. C. and Tapper, N. J.: ENSO rainfall variability andimpacts on crop production in Indonesia, Phys. Geogr., 20, 508–519, 1999.
Naylor, R. L., Falcon, W. P., Rochberg, D., and Wada, N.: Using ElNino/Southern Oscillation climate data to predict rice productionin Indonesia, Climatic Change, 50, 255–265, 2001.
Oldeman, L. R., Las, I., and Darwis, S. N.: An agroclimatic map ofSumatra, Contributions, Central Research Institute for Agricul-ture, Bogor, No. 52, 35 pp., 1979.
Oldeman, L. R., Las, I., and Muladi: The agroclimatic maps ofKalimantan, Maluku, Irian Jaya and Bali, West and East NusaTenggara, Contributions, Central Research Institute for Agricul-ture, Bogor, No. 60, 32 pp., 1980.
Romilly, T. G. and Gebremichael, M.: Evaluation of satellite rain-fall estimates over Ethiopian river basins, Hydrol. Earth Syst.Sci., 15, 1505–1514,doi:10.5194/hess-15-1505-2011, 2011.
Sapiano, M. R. P. and Arkin, P. A.: An intercomparison andvalidation of high-resolution satellite precipitation estimateswith 3-hourly gauge data, J. Hydrometeorol., 10, 149–166,doi:10.1175/2008JHM1052.1, 2009.
Scheel, M. L. M., Rohrer, M., Huggel, Ch., Santos Villar, D.,Silvestre, E., and Huffman, G. J.: Evaluation of TRMMMulti-satellite Precipitation Analysis (TMPA) performance inthe Central Andes region and its dependency on spatial andtemporal resolution, Hydrol. Earth Syst. Sci., 15, 2649–2663,doi:10.5194/hess-15-2649-2011, 2011.
Sheffield, J., Wood, E. F., Lettenmaier, D. P., and Lipponen, A.:Experimental Drought Monitoring for Africa, GEWEX News, 8,2008.
Sorooshian, S., Hsu, K., Gao, X., Gupta, H. V., Imam, B., andBraithwaite, D.: Evaluation of PERSIANN system satellite-based estimates of tropical rainfall, B. Am. Meteorol. Soc., 81,2035–2046, 2000.
Smith, E., Asrar, G., Furuhama, Y., et al.: International GlobalPrecipitation Measurement (GPM) Program and Mission: An
www.hydrol-earth-syst-sci.net/16/133/2012/ Hydrol. Earth Syst. Sci., 16, 133–146, 2012
146 R. R. E. Vernimmen et al.: Evaluation and bias correction of satellite rainfall data
Overview, in: Measuring Precipitation From Space, edited by:Levizzani, V., Bauer, P., and Turk, F. J., Springer Netherlands,611–653, 2007.
Su, F., Hong, Y., and Lettenmaier, D.: Evaluation of TRMM Multi-Satellite Precipitation Analysis (TMPA) and its utility in hydro-logic prediction in La Plata Basin, J. Hydrometeorol., 9, 622–640, 2008.
van Dijk, A. I. J. M. and Renzullo, L. J.: Water resource monitoringsystems and the role of satellite observations, Hydrol. Earth Syst.Sci., 15, 39–55,doi:10.5194/hess-15-39-2011, 2011.
Villarini, G. and Krajewski, W. F.: Evaluation of the re-search version TMPA three-hourly 0.25◦
× 0.25◦ rainfall es-timates over Oklahoma, Geophys. Res. Lett., 34, L05402,doi:10.1029/2006GL029147, 2007.
Wyrtki, K.: The rainfall over the Indonesian waters, Verhandelin-gen, Kementrian Perhubungan Lembaga Meteorologi dan Ge-ofisika, Jakarta, No. 49, 24 pp., 1956.
Hydrol. Earth Syst. Sci., 16, 133–146, 2012 www.hydrol-earth-syst-sci.net/16/133/2012/