evaluation of 1986 aashto design guide for jointed concrete...
TRANSCRIPT

TRANSPORTATION RESEARCH RECORD 1207
Evaluation of 1986 AASHTO Design Guide for Jointed Concrete Pavements
MING-JEN Liu, MICHAEL I. DARTER, AND SAMUEL H. CARPENTER
The new AASHTO Guide for Design of Pavement Structures (1986) is evaluated using theory and field performance data. Jointed plain (JPCP) and jointed reinforced (JRCP) concrete pavements are considered. The conceptual evaluation considers the assumptions, capabilities, and theoretical limitations of the AASHTO Guide. The analytical field data evaluation includes two approaches: predicted vs. actual ESALs for inservice pavements from NCHRP Project 1-19, and the specific design evaluation. Four broad zones in the United States were used to characterize the performance of the AASHTO designs in different climates. This dual approach to design procedure evaluation provides an overall picture of the capabilities of the new AASHTO Guide. Deficiencies are identified that must be considered by agencies implementing the new AASHTO Guide, and recommendations on how to overcome these deficiencies are provided.
The AASHTO structural slab thickness design model was originally developed using the results from the AASHO road test conducted from 1958 to 1960 near Ottawa, Illinois. The AASHO Interim Guide for Design of Rigid Pavement Structures (!) was first developed in 1962 and revised in 1972 (2) and 1981 (3). During 1984-85 the Subcommittee on Pavement Design and a team of consultants revised the existing guide under NCHRP Project 20-7/24 and issued the current version ( 4). A complete description of the development of the original structural design model is given in the Appendix of the 1981 Interim Guide (3) and in the AASHO Road Test Report (5).
Since the AASHTO Design Guide is widely used for the design of rigid highway pavements, it is important to know its capabilities and limitations and the performance of the AASHTO pavement designs under various conditions. The data base used in this study was developed under NCHRP Project 1-19 ( 6).
The AASHTO Guide is evaluated conceptually and analytically.
CONCEPTUAL EVALUATION
The conceptual evaluation includes a review of the Guide's fundamental basis for development and a summary of the conceptual weaknesses and limitations of the design procedure.
Department of Civil Engineering, University of Illinois, 208 N. Romine Street, Urbana, Ill. 61801.
Fundamental Basis for Development
Performance data from the AASHO Road Test and regression techniques were used to develop the following empirical model:
log10 W = log r + GIB (1)
where
W = axle load applications, for load magnitude L1 and axle type L2, to a serviceability index of P2,
log10 r = 5.85 + 7.35 log (D + 1) + 4.62 log (Ll + L2) + 3.28 log (L2),
B = 1.0 + [3.63(Ll + L2) 5·20J
2
determined level of reliability (R%) that pavement sections will survive the traffic for which they were designed. It applies only to structural deterioration, however, not to loss of serviceability due to nonload causes (e.g., joint deterioration, swelling soils).
2. The joint load transfer factor, J, is extended to consider different types of shoulders. A value of 3.2 is recommended for the J factor for a jointed plain (JPCP) or jointed reinforced (JRCP) concrete pavement with a mechanical load transfer device (e.g., dowel bars) at joints in pavements with asphalt concrete shoulders, whereas the values ranging from 2.5 to 3.1 are recommended for the same pavement with tied PCC shoulders. Nondoweled pavements have a recommended J ranging from 3.8 to 4.4 for AC shoulders, and from 3.6 to 4.2 for tied PCC shoulders. This method adjusts for different load transfer conditions by varying slab thickness.
3. A drainage coefficient (Cd) multiplier is added to the design equation. Its value represents the quality of drainage and the percent of the time the pavement structure is exposed to moisture levels approaching saturation. It provides a way to approximate the effect of drainage by means of modifying the load transfer coefficient, 1. The Cd value for AASHO Road Test subdrainage conditions is 1.0.
4. The potential effect of subgrade swelling and frost heave on the rate of loss in serviceability is considered. The thawweakening and seasonal variations in modulus of subgrade reaction are also considered in the new Guide.
5. The subgrade soil-resilient modulus, MR, is used in the new Guide to estimate the effective modulus of subgrade reaction, k, at the top of the subbase. A loss-of-support factor (LS) included in the design accounts for potential subbase erosion and/or differential vertical soil movement by diminishing the overall effective k value on the basis of the size of the void that may develop beneath the slab. Some suggested ranges of LS, depending on the type of subbase material, are provided. This results in a pavement design for k values as low as 25 pci.
The current structural design model is:
Wis = WislFR = W1sflO - zRso
where
logW18 = 7.351og(D + 1) - 0.06
where
+ Gt/[1 + 1.624 x 10⁷/(D + 1)8A6)
+ (4 .22 - 0.32P,)*log[(S;*Cd(D0 .75 - 1.132)
7 (215.63!)•(Do.75 - 18.42)/(Eclk)o 2s)]
Gt= log [(P; - P,)/(4.5 - 1.5)],
(2)
(3)
W,. = mean predicted total number of 18-kip equivalent single-axle load applications in the design life,
FR = reliability design factor, ZR = standard normal deviate corresponding to selected
level of reliability, So = overall standard deviation for rigid pavement , D mean thickness of pavement slab (in.), P; initial serviceability index, P, = terminal serviceability index,
TRANSPORTATION RESEARCH RECORD 1207
s; = mean modulus of rupture for PCC used on specific project,
J = load transfer coefficient used to adjust for load transfer characteristics of specific design,
Cd = drainage coefficient, Ec = mean modulus of elasticity for PCC (psi), and k = mean modulus of subgrade reaction (pci).
Weaknesses and Probable Limitations
Some major weaknesses and probable limitations of the procedure in designing against important distress types existing in rigid pavement are summarized below.
Accuracy of Structural Design Model
The empirical model of Equation 1 was derived from results from the Road Test data and relates to its specific Road Test conditions. Within these conditions, the ability of Equation 1 to predict the exact number of load applications to any given level of serviceability index for a pavement is shown in Figure 1 (7). The shaded band indicates the range in load applications that includes approximately 90 percent of all the performance data. In the top curve of Figure 1, for example, for slab thicknesses of 8 inches, the resulting number of 30-kip singleaxle applications to a terminal serviceability index of 2.0 ranged between 400,000 and 1,910,000 for controlled AASHO Road Test conditions. If Equation 1 is used for conditions other than those for which it was developed, its range of accuracy or associated error of prediction will be greater. This may be particularly true for different climatic conditions. The modified expression, Equation 3, allows for changes in material properties (S0 Ec , and k), but the accuracy of these adjustments is unknown.
Variability
A serious limitation of the AASHTO design procedure is that the empirical design model (Equation 1 or 3) is based on very short pavement sections where construction and material quality were highly controlled . Typical highway projects, which are normally several miles long, contain much greater construction and material variability and hence show more variability in performance along the project in the form of localized failures. Projects designed using the Guide would, therefore, tend to show significant localized failures before the average project serviceability index (PSI) drops to P,, unless a level of reliability higher than SO percent was selected for the design.
Design Period
Design periods under consideration usually range from 20 to 40 years. The number of years and 1.1 million applications, upon which Equation 1 is based, represent only a fraction of the load applications that would be expected on high-volume pavements over the design period (10 million to 100 million

Liu et al.
12.0
10.0
N 0 .,
B.O ., Cl) c
...: 0
.c 6.0 I-
..c c
(/) 4.0
2.0
Terminal p= 2.0 Single Axle Loads
Bond Width=2x0.17
-0.34/+0.34 .. 7 '
3
E•lropolaled
10 100 Applications (thousands)
1000 3000
FIGURE 1 Illustration of error of prediction of basic AASHO design model (7). Shaded bands indicate range in load applications that includes approximately 90 percent of all the performance data.
applications). Even if these equations can be extrapolated for the large difference in the number of load applications, there are several climatic effects that occur over time (as represented by age) which cause severe deterioration of the pavements even without heavy load applications (e.g., corrosion of steel, joint freezeup, D-cracking, reactive aggregate, incompressible buildup in joints). Therefore, in similar or more severe climates, the pavements would be expected to endure fewer load applications and fewer years than predicted by Equation 1or3. In mild climates, pavements may perform much better than predicted.
Loss of Support
The Road Test used a specific set of pavement materials and one roadbed soil. Many of the Road Test sections showed severe pumping of the subbase with loss of support. Therefore, Equations 1 and 3 are biased toward this high loss-ofsupport condition.
Joint Design
Only one type of joint design was used in the AASHO Road Test. If other types are used, such as joints without dowels or with some unusual type of load transfer devices, the pavement life would be significantly changed. The type of base would also affect load transfer and, thus, performance. Basic deficiencies in the joint design recommendations include little or no guidance on joint spacing, on rational determination of dowel size and spacing, on when mechanical load transfer devices are required, and on load transfer systems other than dowels.
Drainage Design
In the new Guide, drainage effects are considered in terms of the effect of moisture on subgrade strength and on base erodability. For new rigid pavement design, the effect of drainage is considered by modifying the load transfer coefficient, J, through the Cd factor. It is well known that the subdrainage conditions at the Road Test were very poor because of the huge amount of pumping. Despite this, AASHTO recommendations for Cd show a value of 1.0 to correspond to a quality of drainage of good to fair for subgrade saturation levels of greater than 5 percent, which surely existed at the Road Test. This recommendation cannot be adjusted properly for poor drainage conditions. Another question is whether poor subdrainage can be considered by simply increasing slab thickness. This is not likely since a thickness increase only decreases deflection slightly.
Reinforcement Design
Slab reinforcement is designed using the subgrade drag theory. The mathematical expression for subgrade drag theory used for longitudinal reinforcement design is a major simplification of the actual forces encountered. The most significant limitation arises if the unrestrained slab length (i.e., distance between joints) assumed in reinforcement design is altered through a partial or complete seizing of one or more joints. This phenomenon could cause a significant increase (double or more) in the steel stress, which may result in yielding or rupture of reinforcement at an intermediate crack between joints. Also, the the procedure does not allow for loss of effective reinforcement through corrosion. It is expected, therefore, that long joint spacings in cold climates, accom-

4 TRANSPORTATION RESEARCH RECORD 1207
Ir 3.5 l.J.. 3.0 0 (/) 2.5 (/) 0 2 2.0 w 1.5 -~ 1.0 ~
cs 0.5
0 5 10 15 20 25
lt.~C"' IVL/\OC"'\ 1-\VI... \ I L-MI \tJI
FIGURE 2 Sensitivity of Illinois damage (serviceability) model to cumulative load repetitions and age (6).
panied by joint seizure, would result in rupture of the reinforcement with subsequent faulting and spalling of cracks.
Climate
Co11crete pavement performance is highly dependent on the climatic conditions, and evidence exists that climatic conditions could have a significant effect on pavement life (8). Since the AASHO Road Test was conducted over a period of only two years, climatic effects were not as significant as if the same traffic had heen applied over a longer period of, say, 20 to 40 years. Steel corrosion requires several years to develop into a serious condition, so joint lockup and subsequent yielding of the steel reinforcement for JRCP pavements would logically not occur for at least several years after initial construction. Figure 2 shows the results of a life prediction model developed from the Illinois data base ( 6), where age and traffic data were available over short as well as long time periods. An interaction between age and traffic can be observed in that there is much greater pavement damage from heavy traffic over long periods than if the same traffic was applied over a shorter time period.
ANALYTICAL EVALUATION
Predicted Versus Actual ESALs
The actual number of ESALs was compared to the predicted ESAL due to the measured loss in present serviceability index, using the original AASHTO performance equation (i.e., Eq. 3). This comparison was made for each section of JPCP and JRCP in the data base. The actual pavement thicknesses, material properties, serviceability at the time of the study, and actual traffic were input into the equation. The drainage coefficient value for the equation was set at 1.0. The value of the J factor was 3.2 for joints with dowels and 4.1 for joints
with aggregate interlock (without dowels). The data retrieval and computations were completed by utilizing the Statistical Package for the Social Sciences (9). The analysis was run at the 50 percent level of reliability.
The pavement sections in the data base were divided into four broad climatic zones and the results were compared by zone. The data base contains jointed pavement sections from the following states: California (wet-freeze JPCP), Georgia (wet-nonfreeze JPCP), Illinois (wet-freeze JPCP and JRCP), Louisiana (wet-nonfreeze JRCP and JPCP), Minnesota (dryfreeze and wet-freeze JRCP), Nebraska (dry-freeze JRCP), and Utah (dry-freeze JPCP). The plots of predicted vs. actual ESALs for each climatic zone for JPCP and JRCP are given in Figure 3 and Figure 4, respectively.
A summary of the results of the predicted vs. actual ESALs for JPCP and JRCP is given in Table 1. The significance and comparison of the results are discussed below.
JPCP
The results are highly dependent on climate. Almost all the sections in the dry-nonfreeze climate performed better than the original AASHO model predicted (52 of 53 sections, or 98 percent acceptable). None of these pavements contained dowels as did the AASHO Road Test sections. The sections in the dry-freeze and wet-nonfreeze climates performed generally as predicted with 60 and 71 percent of the sections acceptable, respectively.
The JPCP sections in the wet-freeze climate (same as AASH 0 Road Test) performed worse than the AASHO model predicted with only 9 of 36 sections (or 25 percent) acceptable. The average actual ESALs in wet-freeze climate are 7.36 million less than the predicted ESALs (or 92 percent of the average actual ESALs). The JPCP sections performed adequately in the wet-nonfreeze and dry-freeze zones, with the actual ESALs approximately equal to the predicted ESALs.

Liu et al. 5
11e '49
Ory-Freeze Region Wet-Freeze Region - 95 - 42 c c 49 0 n • 36 0 n -
110 3!5 E E • • -28
_J 54 .J < • < en en w LU 2l
411 "C • -0 Q)
Cl) +- • +- 0 Je 0 14 • -0 •• -0 CD Cl) L.. L.. a... 15 a... 7
0 0 0 7 14 21 211 35 0 16 Je 48 54 eo
Actual ESAL (milliC'n) Actual ESAL (million)
(a) (b)
49 21
Ory-Non freeze Region Wei-Non freeze Region - 4e - le c 53
c 45 0 n - 0 n -
3!5 1 !5 E E - -_J ee _J 1e • < < • •• en cn w w • el 9 • -0 "O • Q) Cl) - - • • () l4 0 Cl • ~ -0 "O CD Cl) .... • L.. L.. ... • a... 7 a... 3 • • •
• • • • • • 0
14 et ee 3!5 0 3 e 9 le 18 ESAL (million) Actual ESAL (million)
(c) (d)
FIGURE 3 Predicted ESALs vs. actual ESALs for JPCP, using original AASHO Road Test PSI prediction model.
Figure 3(d) shows that a higher variation exists in prediction in the wet-nonfreeze zone. The results shown in the dry-freeze zone, that 86.9 percent of the average actual ESALs are less than the predicted ESALs, are somewhat biased because one slight-trafficked 13-in. slab section has an erratically high loss in PSI. See Figure 3(a).
The original AASHO equation seems to provide overly conservative JPCP structural designs in the dry-nonfreeze climate, adequate designs in the dry-freeze and wet-nonfreeze climates, but inadequate designs in the wet-freeze climate, all at the 50 percent reliability level.
JRCP
The results in Table 1 show that the JRCP sections did not perform as well in any climate as the original AASHO model predicted. For all the JRCP sections, only 41 of 374 (or 11 percent) performed better than predicted. The average actual ESALs for all JRCP sections were 10.58 million less than the predicted ESALs (or 193. 6 percent of the average actual ESALs). On the basis of these results, the original AASHO equation does not provide adequate JRCP structural designs for any climate at the 50 percent reliability level.

6 TRANSPORTATION RESEARCH RECORD 1207
26 11e
Ory-Freeze Region Wet-Freeze Region ,...... 24 - 98
c c 93 0 n - 232 0 n ..
20 110
E • E • • • • _J 16 _J 114
< II II < (/) • (/) • • •• w w 12 411 •• • "O •••••
"O Cl)
Cl)
.. ·'" -- () 32 0 II "O "O Cl)
Cl)
'-'- Cl. 18 Cl. 4
0 0 0 4 " 12 10 20 0 i6 32 46 04 ilQ
Actual ESAL (million) Actual ESAL (mitllon)
(a) (b)
114
Wet-Non freeze Region - 72 c
~5 0 n . 110
E - • _J 411
< ) (/)
··~ w 311 •• "O •• • . -· Cl) ' .. - •. I I 0 24 ,. "O >. Cl) L
Cl. 12 ... 0
0 12 24 36 411 60
Actual ESAL (million)
(c)
FIGURE 4 Predicted ESALs vs. actual ESALs for JRCP, using original AASHO Road Test PSI prediction model.
Lllmat1c tactors anect J KLP more severely than J PLP. Many of the JRCP sections in the NCHRP 1-19 data base have deteriorated because of factors other than traffic loading. Thus, the AASHO model does not provide adequate JRCP designs. The inherent variability in the prediction of pavement section performance indicates that there is a need to increase the reliability level and other design improvements if the equation is to provide adequate designs for JRCP sections.
:specmc uesign J<;valuation
Results obtained from Heinrichs et al. (10) showed that a significant difference in pavement performance occurred only between the four major zones: wet-freeze, wet-nonfreeze, dry-freeze, and dry-nonfreeze. The specific design evaluation was then conducted using climatic data from the data base. The classification for the four broad climatic zones is the same

Liu et al. 7
TABLE 1 SUMMARY OF RESULTS FOR ORIGINAL AASHO ROAD TEST PSI PREDICTION MODEL
Climatic Region # of # of Section Percent Mean Mean Percen t Cases Acceptable* Acceptable Di fference** Diff erence*~h'r
(1) (2) (3) (4)=(3)/(2) (5) (6 ) --------.-------------------------------------------------- ---------- ----------
JPCP: Wet - Nonfreeze 45 27 60% 0.911 -17. 1% Wet - Freeze 36 9 25% -7.355 - 92. 0% Dry - Nonfreeze 53 52 98 % 6 .405 69 . 5% Dry - Freeze 49 35 71% 0.763 -86 .9% Overall 183 123 67% 0.836 -25 . 4%
JRCP: Wet - Nonfreeze 93 3 3% -15.460 -282.0 % We t; - Freeze 232 34 15% - 9.886 -168.8% Dry - Nonf reeze -**** Dry - Freeze 49 4 8% -4.584 -143.0% Overall 374 41 11% -10. 577 -193 .6 %
* "Acceptable" means the actual number of 18-kip ESALs is equal or greater than the predicted ESALs , i. e. the pavement section performed as good as or better t han the AASHO model predicted, otherwise is "unacceptable" .
** Difference = Actual ESAL - Predicted ESAL, in millions
*** Percent Difference= [(Actual ESAL - Predicted ESAL)/Actual ESAL] x 100%
**** No JRCP section is available in dry-nonfreeze region in COPES.
as used in the above predicted vs. actual ESAL evaluation. The prevailing values of the climatic data in each climatic zone as averaged from the data base are shown in Table 2.
A number of pavement design situations were developed for JPCP and JRCP over the four climatic zones. The design factors that were varied included two subgrade soils (finegrained and coarse-grained), with and without dowels (JPCP only), and shorter and longer joint spacings (JRCP only). The fine-grained subgrade soils were defined as A-7-5 or A-7-6 in the AASHTO soil classification, and the coarse-grained subgrade soils were defined as A-2-6 or A-2-7. The drainage of these two types of subgrade soils was characterized as poor for the fine-grained soils and good for the coarse-grained soils. A resilient modulus of 3,000 psi was assumed for the finegrained soils and 7 ,000 psi for the coarse-grained soils. The elastic k values for fine- and coarse-grained soils were assumed to be 100 pci and 190 pci, respectively, when the subgrade degree of saturation was compacted to 70-90 percent. The
1986 AASHTO Guide was used to generate pavement designs for JPCP and JRCP for each of the design situations. The design life was 20 years, and the design traffic was 15 million 18-kip ESALs in the design Jane.
Specific soil, subbase, concrete, and other properties for the designs are shown in Table 3. The climatic design inputs for the new AASHTO Guide for each of the four climatic zones are given in Table 4. The values of the drainage coefficient Cd and loss-of-support factor LS were used as recommended in the Guide. The dowel size and the reinforcement (JRCP only) were also designed as recommended. The designs were developed at reliability levels of 50, 80, and 90 percent.
These designs were then evaluated using the deterioration models developed from the NCHRP 1-19 data base for pumping, faulting, cracking, joint deterioration, and PSI using the PREDICT program (written in Microsoft BASIC language for the IBM personal computer by M. I. Darter). These models

TABLE 2 SPECIFIC CLIMATIC DATA IN FOUR CLIMATIC ZONES AVERAGED FROM COPES DATABASE
JPCP:
JRCP:
Climatic Zones Annual Precipitation, ems Freezing Index, de§ree-days Mean Temperature, C
* Temperature Range, 0 c
Climat ic Zones Annual Precipitation, ems Freezing Index, de§ree-days Mean Temperature, C Temperature Range, 0 c
Climatic Zones Annual Precipitation, ems Freezing Index, de§ree-days Mean Temperature, C Temperature Range, 0 c
Climatic Zones Annual Precipitation, ems Freezing Index, de§ree-days Mean Temperature, C Temperature Range, 0 c
Dry - Freeze 40
250 11 41
Wet - Freeze 84
625 11 41
Dry - Nonfreeze Wet - Nonfreeze 40 120
0 0 19 19 25 30
Dry - Freeze 55
1125 8
45
Wet - Freeze 78
1125 8
43
Dry - Nonfreeze Wet - Nonfreeze -** 120
0 17 34
* Temperature Range - average daily maximum air temperature in July minus average daily minimum air temperature in January, 0 c
** No JRCP section is available in dry-nonfreeze climate in COPES.
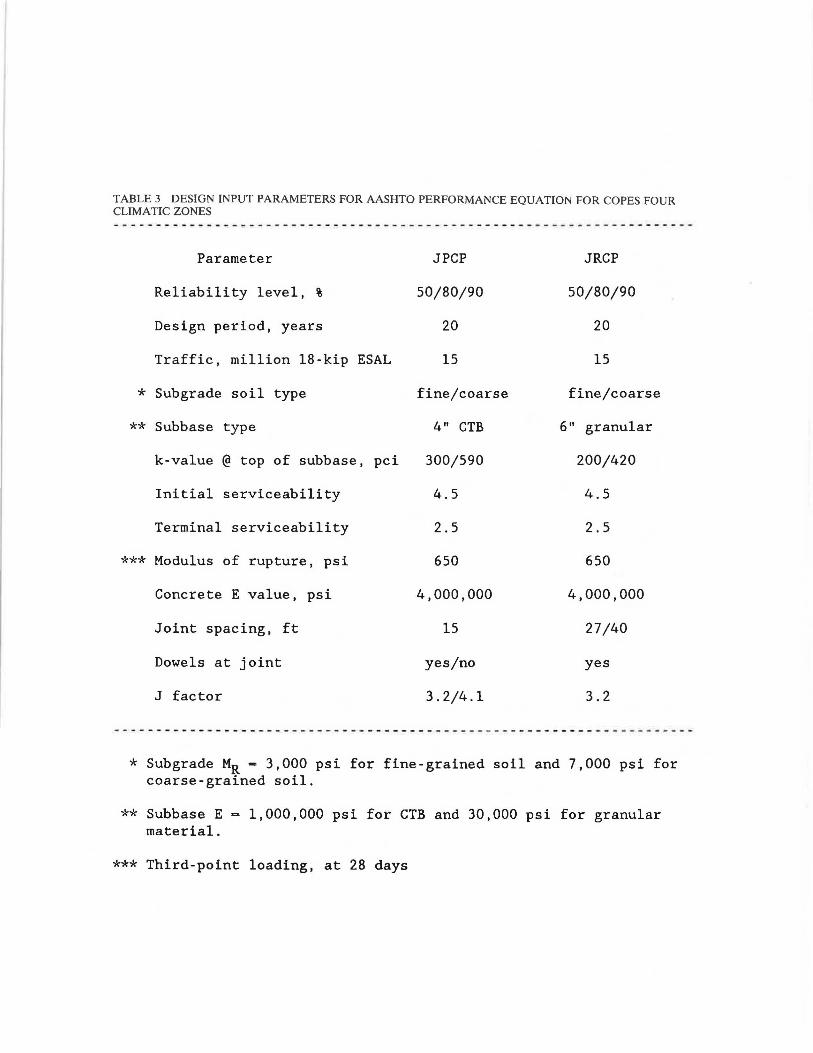
TABLE 3 DESIGN INPUT PARAMETERS FOR AASHTO PERFORMANCE EQUATION FOR COPES FOUR CLIMATIC ZONES
Parameter JPCP JRCP
Reliability level, % 50/80/90 50/80/90
Design period, years 20 20
Traffic, mil lion 18 -kip ESAL 15 15
* Subgrade soil type fine/coarse fine/coarse
** Subbase type 4" CTB 6" granular
k-value @ top of subbase, pci 300/590 200/420
Initial serviceability 4.5 4.5
Terminal serviceability 2.5 2.5
*** Modulus of rupture, psi 650 650
Concrete E value, psi 4,000,000 4,000,000
Joint spacing, ft 15 27/40
Dowels at joint yes/no yes
J factor 3.2/4.1 3.2
* Subgrade MR= 3,000 psi for fine-grained soil and 7,000 psi for coarse-grained soil.
** Subbase E = 1,000,000 psi for CTB and 30,000 psi for granular material.
*** Third-point loading, at 28 days

10 TRANSPOR TATION RESEARCH R ECOR D 1207
TABLE 4 CLIMATIC DESIGN INPUTS FOR AASHTO GUIDE FOR COPES FOUR CLIMATIC ZONES
JPCP Climatic zones Dry - Freeze Wet - Freeze Sub grade soil type fine coarse fine coarse Dowel bars no yes no yes no yes no yes Cd value .95 .95 1.13 1.13 . 85 .85 1. 05 1. 05 LS factor .5 . 5 . 25 . 25 1. 0 1. 0 . 5 .5
* Corrected k-value 175 175 400 400 100 100 290 290 -- -- - -- ... - - - ... - - ------ - .. - ----- .... --- - - - - - ---- - ... ----- - --- .... --- - - - - - .... - -- --Climatic zones Dry - Nonf reeze We t - Nonfreeze Sub grade soil type fine coarse fine coarse Dowel bars no yes no yes no yes no yes Cd value .95 . 95 1.13 1.13 . 8 .8 1. 0 1. 0 LS factor . 5 . 5 .25 . 25 1. 0 1. 0 .5 . 5 Corrected k-value 175 175 400 400 100 100 290 290
JRCP Climatic zones Dry - Freeze Wet - Freeze Subgrade soil type fine coarse fine coarse Dowel bars yes yes yes yes Cd value .95 1.13 .85 1. 05 LS factor . 5 .25 1. 0 .5 Corrected k-value 120 300 70 230
Climatic zones Dry - Nonf reeze Wet - Nonfreez e Sub grade soil type fine coarse fine coarse Dowel bars yes yes yes yes Cd value - ** .8 1.0 LS factor 1.0 .5 Cori:ected k-value 70 230
* k-value in pci.
** No JRCP section is available in dry-nonfreeze climate in COPES.
represent the data base mathematically. They provide average projections with about one-half the actual showing worse deterioration and the other half showing less deterioration.
The critical level for each kind of deterioration mentioned above that normally generates the need for rehabilitation is as follows:
Deterioration
Pumping Faulting (in.) Cracking (ft/mile)
Joint deterioration (joints/mile)
PSI
JPCP
1 (low severity) 0.13 800 (all severities)
55 (mostly medium severity)
3.0
JRCP
1 (low severity) 0.26 850 (medium and high
severity) 27 (mostly high
seve rity) 3.0
These are average values that were determined from the
NCHRP 1-19 data base for sections that were in need of pavement rehabilitation (6).
!PCP
Tables 5 and 6 show the predicted deterioration for each level of reliability for JPCP designs. Figures 5, 6, and 7 illustrate prect1ctect pumpmg seventy , taultmg, ano slab cracking , respectively.
• Increasing design reliability from 50 to 90 percent increases the thickness of the slab by about 1.5 in . The deterioration prediction models indicate that JPCP slab cracking decreases greatly with this increase in reliability . Pumping and joint faulting decrease a small amount , and terminal PSI increases

Liu et al. 11
TABLE 5 PREDICTIONS FOR JPCP DESIGNS USING AASHTO GUIDE FOR FOUR CLIMATIC ZONES: 50 PERCENT RELIABILITY LEVEL
Climatic zones Dry-freeze Wet-freeze
Subgrade soil type fine coarse fine coarse Dowel diameter, in 0 l.12S 0 1. 00 0 1. 2S 0 1. 00 Slab thickness, in 10.6 9.3 9.2 7 . 9 11. s 10.1 9.8 8.S
Pumping * .6 1. 3 . 6 1. 7 2 2.6 1. 9 2.8 Faulting, in .1 .OS .11 .07 . 12 .OS .13 . 09 Cracking, ft/mile lSl 368 249 713 llS 31S 2Sl 853 Joint deter., j ts/mile 12 12 12 12 12 12 12 12 PSI 3.7 3.S 3.6 3 .4 3.3 3.0 3.1 2.8
Climatic zones Dry-nonfreeze Wet-nonfreeze
Subgrade soil type fine coarse fine coarse Dowel diameter, in 0 l.12S 0 1 0 1. 2S 0 l . 12S Slab thickness, in 10.6 9.3 9.2 7.9 11.8 10.4 10 8.7
Pumping 0 .8 0 1.1 .s 1.1 .4 1. 3 Faulting, in . 06 0 . 07 . 03 . 06 0 .07 .01 Cracking, ft/mile Sl 117 72 144 41 80 70 134 Joint deter., j ts/mile 12 12 12 12 12 12 12 12 PSI 4.0 3.8 3.9 3.7 3.6 3.4 3.4 3.2
* Pumping= 1 for low, 2 for medium and 3 for high severity.
Design traffic: 15 million 18-kip ESAL Design period: 20 years Subbase type: 4" CTB Joint spacing: lS ft Level of reliability: SO%
a small amount. Joint deterioration does not change , however. Increasing design reliability is an effective way to reduce slab cracking, but not other types of deterioration.
• The use of dowels in transverse joints results in a decrease of about 1.4 in. of slab thickness. The thinner slab develops more cracking, but joint faulting decreases substantially for designs having dowel bars.
• The required slab thickness is reduced about 1.6 in . when the subgrade soil changes from fine-grained to coarse-grained. Even though a coarse-grained soil improves support and subdrainage, slab thickness is decreased by this extent, which has the overall effect of increasing the amount of slab cracking.
• Pumping is predicted to occur in all climatic regions, but
severe pumping is predicted in the wet-freeze region for these particular designs.
• Transverse joint faulting decreases greatly with the use of dowels. Faulting is greatest in the freeze zones (where without dowels it exceeds the 0.13-in. critical level) and lea t in the nonfreeze zones. Increased design reliability does not improve faulting very much.
• Slab cracking increases whenever slab thickness is decreased. However, even the maximum predicted cracking is below th critical level for JPCP for all designs .
• Transverse joint deterio.ratjon i not affected by design reliability, and joint deterioration for JPC.P i minimal.
• Present serviceability ratings at the end of the design life

TABLE 6 PREDICTIONS FOR JPCP DESIGNS USING AASHTO GUIDE FOR FOUR CLIMATIC ZONES: 90 PERCENT RELIABILITY LEVEL
Climatic zones Dry-freeze Wet-freeze
Subgrade soil type fine coarse fine coarse Dowel diameter, in 0 1. 37S 0 l.12S 0 1. 37S 0 1. 2S Slab thickness, in 12.1 10.7 10.6 9.2 13 .1 11. s 11. 3 9.8
Pumping * 0 .6 0 .6 1. s 2.0 1. 2 1. 9 Faulting, in .09 0 .1 .OS .11 .02 .12 .OS Cracking, ft/mile 70 143 109 249 49 llS 91 251 Joint deter., j ts/mile 12 12 12 12 12 12 12 12 PSI 4.0 3.7 3.8 3.6 3.S 3.3 3.3 3.1
Climatic zones Dry-nonfreeze Wet-nonfreeze
Subgrade soil type fine coarse fine Dowel diameter, in 0 1. 37S 0 l.12S 0 1. s Slab thickness, in 12.1 10.7 10.6 9.2 13.5 11. 9
Pumping 0 0 0 0 0 .4 Faulting, in .OS 0 .06 0 .OS 0 Cracking, ft/mile 25 48 37 72 20 39 Joint deter., j ts/mile 12 12 12 12 12 12 PSI 4.3 4.0 4.1 3.9 3.9 3.6
* Pumping= 1 for low, 2 for medium and 3 for high severity.
Design traffic: lS million 18-kip ESAL Design period: 20 years Subbase type: 4" CTB Joint spacing; 15 ft Level of reliability: 90%
coarse 0 1. 2S
11.6 10.l
0 .4 .06 0 34 67 12 12
3.7 3.4

Liu et al. 13
Pumping (Qalow, 3•high) 3.0 ---~~~~~~~~~~~~~~~~~~~~~~~~~~~~~~~~~~---.
10.1·
2.5
2.0
1.5 10.4'
1.0
0.5
WET-NONFREEZE WET-FREEZE
15 million ESAL/20 years 15 ft joint spacing Doweled joints Fine-grained subgrade soils Label shows design slab thickness
1 in • 2.54 cm, 1 ft c 0.3048 m
Q.3'
critical l evel
10.7'
DRY-NONFREEZE DRY-F.REEZE
Major Climatic Region
~ 50% level ED 80% level • 90% level
FIGURE 5 Pumping severity by climatic regions at various reliability levels for AASHTO JPCP designs.
are all predicted to be above 3.0 (with one slight exception). Increased design reliability increases terminal serviceability by a small amount.
Overall, deterioration of JPCP generally increases as the climate becomes wetter or colder, even though the design procedure attempts to adjust the design for climate. Deterioration differs significantly among climatic regions . The drainage coefficient, Cd, value had a significant influence on the thickness design.
In general, the results show that the AASHTO Guide provides adequate structural designs for JPCP at the higher design reliability level for this example. JPCP in wet- or dry-freeze regions shows more deterioration (particularly pumping) than other regions. Special design improvements may be necessary in freeze areas.
JRCP
Tables 7 and 8 show the predicted deterioration for each level of reliability for JRCP designs . Figures 8, 9, and 10 illustrate predicted pumping severity, cracking, and joint deterioration, respectively.
• Increasing design reliability from 50 to 90 percent increases the thickness of the slab by about 1.4 in. The deterioration prediction models indicate that JRCP slab cracking , faulting, and pumping decrease substantially with this increase in reliability. Terminal PSI increases somewhat. Joint deterioration does not change, however. Increasing design reliability (and hence slab thickness) i · an effectiv way to reduce slab cracking, but probably not the other types of deterioration .
• All the JRCP sections were designed with dowels . The
presence of dowels replaces approximately 1.4 in. of slab thickness. JRCP with dowels did not show excessive joint faulting.
• At every reliability level, the AASHTO Guide requires thinner slabs for the JRCP on coarse-grained subgrade soil than on fine-grained subgrade soil. For example , at the 50 percent reliability level (Table 8), the required slab thickness for shorter and longer joint spacings varies from 1.3 to 1.7 in. between fine- and coarse-grained subgrade soil designs. Even though a course-grained soil improves support and subdrainage , slab thickness is decreased by this extent, which has the overall effect of increasing the amount of slab cracking.
• Pumping is predicted to occur in all climatic regions , but severe pumping is predicted in both freeze regions.
• Faulting is greatest in the freeze zones; however predicted faulting for all designs was less than critical for JRCP (0.26 in.). Increased design reliability does not improve faulting very much.
• Transverse joint deterioration is not affected by design reliability. It is greatest in the freezing climatic zones where the 40-ft designs are predicted to exceed the critical level of 27 joints per mile . The shorter 27-ft designs do not exceed this critical level of deterioration.
• Transverse cracks are predicted to become a severe problem for almost all of the design cases. The increased slab thickness for increased reliability helps, but does not solve the problem.
• The PSI at the end of the design life falls below the critical level of 3.0 in several cases at the 50 percent reliability level , but not at the 80 or 90 percent level . Increased reliability increa es terminal serviceability somewhat.
Overall , deterioration of JRCP increases as the climate becomes wetter or colder, even though the procedure attempts

Joint Faulting (in) 0.16 ;:.._:..:.:_.......:_ ____ .::____: ______ ~----:1~5~m~i7ll~i-on--::E~SAL".":'""':/~20:--y-ea-r-s-~--,
15 ft joint spacing critical~
0.14 J! Doweled joints Fine-grained subgrade •soils
11.6 0.12
0.10
0.08
0.06
0.04
0.02
Label ahows design slab thickness 1 in • 2.54 cm, l ft • 0.3048 m
10.6' 11 .6"
0.00 L-.==.:="-'-'-"""'
0.14
0.12
0.10
0.08
0.06
0.04
0.02
WET-NONFREEZE WET-FREEZE DRY-NONFREEZE DRY-FREEZE
Major Climatic Region
~ 50% level !;::::::::::::I so% level B 90% level
criticall
10.4' 11.4" 11.Q'
(a) undoweled
10.1·
15 million ESAL/20 year• 15 ft joint •pacing Doweled joint• ·Fine-grained aubgrade,1Boila Label •how• design •lab thickne•a 1 in • 2.54 cm, 1 ft • 0.3048 m
g,3•
Q.3' 10.2· 10.7' 10. 7' 0.00 .__ __ ___. ____ ---"'.c;.,,c..""'"'-'"""""'"
WET-NONFREEZE WET-FREEZE DRY-NONFREEZE DRY-FREEZE
Major Climatic Region
~50% level l:~?~tl 80% level g90% level
(b) doweled
FIGURE 6 JPCP faulting predictions by climatic regions for undoweled and doweled pavements at various reliability levels.

Liu et al. 15
Cracking (ft/mile) soo..--~~~~~~~~~~~~~~~~~~~~~~~~~~~
400
15 million ESAL/20 years 15 ft joint spacing Doweled joints Fine-grained subgrade soils 9.3' Label shows design slab thickness
l in • 2.54 cm, l ft • 0.3048 m
300
200
100
WET-NON FREEZE WET-FREEZE DRY-NONFREEZE DRY-FREEZE
Major Climatic Region
~ 50% level m:7-'1 8 O' I I ~ QA) eve • 90% level
FIGURE 7 Predicted slab cracking by climatic regions at various reliability levels for AASHTO JPCP designs.
to adjust the design for climate . Significant differences in performance exist between climatic regions. The drainage coefficient, Cd, value had a significant influence on the thickness design .
In general, the prediction results show that the new Guide provides only fair structural designs for JRCP for the four climatic regions and worse designs for the wet-freeze region . This is evidenced by excessive crack deterioration, pumping, and joint deterioration. The AASHTO Guide does not provide adequate structural designs for JRCP on coarse-grained subgrade soils. However, a comparison of the results from the predicted vs. actual ESAL evaluation, which simulates the original AASHO Road Test performance model , with these results shows that the adjustment factors provided in the new AASHTO Guide are somewhat effective in improving the JRCP designs.
Some components of the pavement , however , showed serious failure and did not improve at the higher levels of reliability . This included joint deterioration with 40-ft or more joint spacing. For example, the JRCP with 27-ft joint spacing has less faulting than with 40-ft joint spacing. The 40-ft joint spacing also results in serious joint deterioration whereas the 27-ft joint spacing gives much better performance . As many as 61 deteriorated joints per mile were predicted for the 40-ft joint spacing in the freeze climates (Figures 8, 9, and 10) . The AASHTO Guide does not provide adequate, coherent guidance on joint design.
CONCLUSIONS
The conceptual evaluation of the 1986 AASHTO Design Guide indicated that, ince the AASHTO structural design model
was empirically derived in a single climate, with a single set of materials, and a short traffic loading period, it has many potential inherent weaknesses and limitations. Major ones include subdrainage consideration, climatic extrapolation, longterm climatic effects, joint design, and reinforcement design.
The analytical evaluation generally supports the conceptual evaluation. There is serious prediction error associated with the original AASHO equations when they are used for differing climates and for different pavement designs. The design adjustment factors included in the new AASHTO Guide are beneficial, particularly the design reliability. However, the joint design, loss-of-support, and drainage coefficient recommendations are still particularly deficient. JPCP designs appear to be much more resistant to the long-term damaging effects of time and climate than JRCP designs.
The overall conclusion is that there are several deficiencies in the new Guide . It is recommended that each agency that adopts the guide conduct an evaluation similar to the example reported herein to determine the general deterioration of pavements existing on their highways. Recommendations for joint design must be developed by each agency since none exist in the Guide. Levels of reliability higher than 50 percent must be considered to provide adequate designs. The 90 percent level studied here showed reasonable results for JPCP. Improved reinforcement design is needed for JRCP to control crack deterioration.
ACKNOWLEDGMENT
This paper was prepared as part of a study entitled "Field Evaluation of Newly Developed Rigid Pavement Design Features," conducted for the Federal Highway Administration by the Department of Civil Engineering, University of Illinois

TABLE 7 PREDICTIONS FOR JRCP DESIGNS USING AASHTO GUIDE FOR FOUR CLIMATIC ZONES: 50 PERCENT RELIABILITY LEVEL
Climatic zones
Subgrade soil type Slab thickness, in Dowel diameter, in Joint spacing, ft Area of steel, sq in/ft
Pumping * Faulting, in Cracking, ft/mile Joint deter., j ts/mile PSI
Climatic zones
Subgrade soil type Slab thickness, in Dowel diameter, in Joint spacing, ft Area of steel, sq in/ft
Pumping Faulting, in Cracking, ft/mile Joint deter., jts/mile PSI
Dry-freeze
fine coarse 9.4 8.1 1.125 1
27 40 27 40 . 047 .069 . 04 .06
1. 6 1. 6 3 3 .07 .12 .16 .17
1322 1300 2932 2904 0 61 0 61
3.1 3.0 2.7 2.6
Dry-nonfreeze
- **
Wet-freeze
fine coarse 10 . 2 8.6 1. 25 1.125
27 40 27 40 . 051 .075 . 043 .064
2.2 2.2 3 3 . 06 _ 11 .09 . 14
1166 1169 2437 2432 0 61 0 61
3.3 2.9 3.2 2.8
Wet-nonfreeze
fine 10.6 1. 375
27 40 .053 .078
1.1 0
942 0
3.3
1.1 .05 944
35 3.2
coarse 8.9 1.125
27 40 .044 .066
2.1 .03
1636 0
2.9
2.1 .08
1639 35
2.9
* Pumping - 1 for low, 2 for medium and 3 for high severity .
** No JRCP section is available in dry-nonfreeze climate in COPES.
Design traffic: 15 million 18-kip ESAL Design period: 20 years Subbase type: 6 11 granular Level of reliability: 50%

TABLE 8 PREDICTIONS FOR JRCP DESIGNS USING AASHTO GUIDE FOR FOUR CLIMATIC ZONES: 90 PERCENT RELIABILITY LEVEL
Climatic zones
Subgrade soil type Slab thickness, in Dowel diameter, in Joint spacing, ft Area of steel, sq in/ft
Pumping * Faulting, in Cracking, ft/mile Joint deter., j ts/mile PSI
Climatic zones
Subgrade soil type Slab thickness, in Dowel diameter, in Joint spacing, ft Area of steel, sq in/ft
Pumping Faulting, in Cracking, ft/mile Joint deter., jts/mile PSI
Dry-freeze
fine coarse 10.8 9.4 1. 375 1.125
27 40 27 40 .054 .08 .047 .069
.5 .5 .9 .9 0 .OS 0 .OS
906 906 126S 1271 0 61 0 61
3.6 3.S 3 . 4 3 . 3
Dry-nonfreeze
- **
Wet-freeze
fine coarse 11. 7 10 1. 5 1. 25
27 40 27 40 .OS8 .086 . OS .074
1. s 1. s 1. 6 1. 6 0 .OS 0 .03
822 822 1099 1100 0 61 0 61
3.S 3 .4 3 . 3 3.2
Wet-nonfreeze
fine 12 1. s
27 .06
40 .089
.6 0
77S 0
3.6
.6
.03 77S
35 3.S
coarse 10.2 1. 25
27 40 .OSl .07S
. 7 0
1017 0
3.4
. 7 0
1020 35
3.3
* Pumping = 1 for low, 2 for medium and 3 for high severity.
** No JRCP section is available in dry-nonfreeze climate in COPES.
Design traffic: 15 million 18-kip ESAL Design period: 20 years Subbase type: 6" granular Level of reliability: 90%

2.&
2
1.&
1
O.&
WET-NONFREEZE WET-FREEZE
15 million ESAL/20 year• 40 ft joint spacing Label shows design slab
thickness
critical
level
NIA
DRY-NONFREEZE
Major Climatic Region DRY-FREEZE
~50% level f::::::=:::::J eo% level B 90% level
(a) coarse-grained subgrade soil
Pumping (O•low, 3•high) 3 .--~~~~~~~~~~~~~~~~~~~~~~~~~~---.,
2.6 10.2·
15 million ESAL/20 years 40 ft joint spacing Label shows design slab thickness
Q.4'
critical
level
NIA
WET-NONFREEZE WET-FREEZE DRY-NONFREEZE DRY-FREEZE
Major Climatic Region
~50% level ft:::::::! so% level B90% level
, - -- - , - - - .s., l;;UUj!,L4UC OV.L.L
FIGURE 8 Pumping severity by climatic regions at various reliability levels for AASHTO JRCP designs.

Liu et al.
Cracking (ft/mile) sooo .--~~~~~~~~~~~~~~~~~~~~~~~----.
2500
2000
1500
1000
500
e.e·
e.1· 15 million ESAL/20 years 40 ft joint spacing Label shows design slab
thickness
critical level
NIA
WET-NONFREEZE WET-FREEZE DRY-NONFREEZE DRY-FREEZE
Major Climatic Region
~50% level f::::::::}=l so% level -90% level
(a) coarse-grained subgrade soil
Cracking (ft/mile) sooo---~~~~~~~~~~~~~~~~~~~~~~~~
2500
2000
1500
1000
500
10.2·
15 million ESAL/20 years 40 ft joint spacing Label shows design slab thickness
0 .4'
, critical level
NIA
WET-NONFREEZE WET-FREEZE DRY-NONFREEZE DRY-FREEZE
Major Climatic Region
~ 50% level I::::::::=:;::! so% level •90% level
(b) fine-grained subgrade soil
FIGURE 9 Predicted slab cracking by climatic regions at various reliability levels for AASHTO JRCP designs.
19

20 TRANSPORTATION RESEARCH RECORD 1207
Joint Deterioration Uts/mile) 100 .----~~~~~~~~~~~~~~~~~~~~~~~~----.
90
80
70
60
50
40
30
20
10 0 1.--1.==i:.~::::;
WET-NONFREEZE WET-FREEZE
15 million ESAL/20 years 40 ft joint spacing Fine-grained subgrade soil Label shows design slab thickness 1 in= 2.54 cm, 1 ft= 0.3048 m
critical level
NIA
DRY-NON FREEZE DRY-FREEZE
Major Climatic Region
~ 50% level E5J 80% level - 90% level
FIGURE IO Predicted joint deterioration by climatic regions at various reliability levels for AASHTO JRCP designs.
at Urbana-Champaign. The authors express their appreciation to Stephen Forster of the Federal Highway Administration for his assistance and comments.
REFERENCES
1. AASHO Interim Guide for the Design of Rigid Pavement Structures. American Association of State Highway Officials, Committee on Design, April 1962.
2. AASHTO Interim Guide for Design of Pavement Structures. American Association of State Highway and Transportation Officials, 1972.
3. AASHTO Interim Guide for Design of Pavement Structures 1972; Chapter Ill Revised, 1981. American Association of State Highway and Transportation Officials , 1981.
4. AASHTO Guide for Design of Pavement Structures. American Association of State Highway and Transportation Officials, 1986.
5. Special Report 61E: The AASHO Road Test, Report 5-Pavement Research. HRB , National Research Council, Washington, D.C., 1962.
6. M. I. Darter, J.M. Becker, M. B. Snyder, and R. E. Smith. Concrete Pavement Evaluation System (COPES). NCHRP Report No. 277, TRB, National Research Council, Washington, D.C., 1985.
7. Special Report 73: Tire AASHO Road Test-Proceedings of a Conference Held May 16-18, 1962, St. Louis, Mo. HRB , National Research Council, Washington, D.C., 1962.
8. M. I. Darter and E. J. Barenberg. Zero-Maintenance Pavement: Results of Field Studies on the Performance Requirements and Capabilities of Conventional Pavement Systems-Interim Report. Report FHWA-RD-76-105, FHWA, U.S . .Department of Transportation, April 1976.
9. N. H. Nie, et al. Statistical Package for the Social Sciences (SPSS), 2nd Ed . McGraw-Hill, Inc., New York, 1975.
10. K. W. Heinrichs, M. Liu, M . I. Darter, S. H. Carpenter, and A. loannides. Rigid Pavements Analysis and Design. Technical Report prepared by the University of Illinois for the Federal Highway Administration, 1987.
This paper reflects the views of the authors, who are responsible for the facts and the accuracy of the data presented herein. The contents do not necessarily reflect the official view or policies of any agency. This report does not constitute a standard, specification, or regulation .
Publication of this paper sponsored by Comrnillee on Rigid Pavement Design.