evaluation of a performance-based standards … 2014 | 2-4 september, south africa evaluation of a...
TRANSCRIPT

SARF/IRF 2014 | 2-4 September, South Africa
Evaluation of a Performance-Based Standards
approach to heavy vehicle design to reduce
pavement wear
Paul Nordengen Research Group Leader
Council for Scientific and Industrial Research
Michael Roux Senior Researcher
Council for Scientific and Industrial Research

www.IRFnews.org
2 SARF/IRF 2014 | 2-4 September, South Africa
1.Background and Introduction
2.Objectives
3.Road Transport Management System (RTMS)
4.Performance-Based Standards Approach
5.Evaluation of Results (Demonstration Project)
2
CONTENTS

www.IRFnews.org
3 SARF/IRF 2014 | 2-4 September, South Africa
BACKGROUND AND INTRODUCTION
South Africa: 1.2 million km2, 750 000
km of roads; 120 000 km paved roads
South Africa’s road network is of a
high standard (from both regional and
international perspectives)
Slide # 3

www.IRFnews.org
4 SARF/IRF 2014 | 2-4 September, South Africa
1. BACKGROUND AND INTRODUCTION
Slide # 4

www.IRFnews.org
5 SARF/IRF 2014 | 2-4 September, South Africa
1. BACKGROUND AND INTRODUCTION
Slide # 5 Slide # 5

www.IRFnews.org
7 SARF/IRF 2014 | 2-4 September, South Africa
1. BACKGROUND AND INTRODUCTION
Slide # 7 Slide # 7

www.IRFnews.org
9 SARF/IRF 2014 | 2-4 September, South Africa
OBJECTIVES
9
Investigate the Performance-Based Standards approach to
heavy vehicles design and operations as researched and
implemented specifically in Australia, Canada and New
Zealand with a view to improving heavy vehicles operations in
South Africa:
• Reduced road wear (per tonne.km)
• Reduced vehicle trips i.e.
• Reduced congestion
• Reduced safety exposure risk
• Improved safety performance
• Improved transport productivity
• Reduced emissions (per tonne.km)

www.IRFnews.org
10 SARF/IRF 2014 | 2-4 September, South Africa 10
THE ROAD TRANSPORT MANAGEMENT SYSTEM
• RTMS is a self-regulation initiative (management systems standard) which aims to address issues such as:
• Road infrastructure protection
• Heavy vehicle safety
• Logistics efficiency
• It achieves this by prescribing minimum standards for:
• Load management (over-loading/under-loading)
• Vehicle maintenance
• Driver training, health, hours
• etc.
• SABS standards: SANS 1395 Parts 1 to 3
• Similar to ISO 39001:2012 Road Traffic Safety Management Systems
• Ensures a level of professionalism in heavy vehicle transport
www.rtms-sa.org

www.IRFnews.org
11 SARF/IRF 2014 | 2-4 September, South Africa 11
PERFORMANCE-BASED STANDARDS
• A PBS scheme for heavy vehicles has been successfully implemented in Australia as a voluntary alternative regulatory framework.
• This is currently the basis for the PBS/”Smart Trucks” demonstration project in SA.
• A set of safety-critical manoeuvres is prescribed, and vehicles must be tested/simulated performing each manoeuvre.
• Selected vehicle performance parameters are measured and compared with the minimum/maximum levels deemed safe.
• Each performance standard addresses a selected aspect of vehicle behaviour deemed critical to vehicle safety.
• RTMS is a non-negotiable pre-requisite for participation

www.IRFnews.org
12 SARF/IRF 2014 | 2-4 September, South Africa 12
PERFORMANCE-BASED STANDARDS APPROACH
Prescriptive Standards Performance-Based Standards
What the vehicle looks like What the vehicle can do
Governs mass and dimensions Governs actual on-road performance
Constrains productivity Allows heavier and/or larger vehicles
Constrains innovation Promotes innovation
Prescriptive Standards Performance-Based Standards
Images courtesy of the Australian National Transport Commission

www.IRFnews.org
13 SARF/IRF 2014 | 2-4 September, South Africa 13
3. PERFORMANCE-BASED STANDARDS
Manoeuvre/Test Performance Standard
Low-speed 90° turn (5 km/h)
Low-speed swept path
Tail swing
Frontal swing
Steer-tyre friction demand
High-speed lane-change (80 km/h) Rearward amplification
High-speed transient offtracking
Rollover Static rollover threshold
High-speed pulse steer (80 km/h) Yaw damping coefficient
High-speed on uneven road (90
km/h) Tracking ability on a straight path
Various (driveability standards)
Startability
Gradeability A
Gradeability B
Acceleration Capability

www.IRFnews.org
14 SARF/IRF 2014 | 2-4 September, South Africa 14
3. PERFORMANCE-BASED STANDARDS
Pavement Vertical Loading Pavement Horizontal Loading Tyre Contact Pressure Distribution
Pavements Bridges
Infrastructure
Bridge Loading

www.IRFnews.org
15 SARF/IRF 2014 | 2-4 September, South Africa
3. PERFORMANCE-BASED STANDARDS: ROLLOVER

www.IRFnews.org
16 SARF/IRF 2014 | 2-4 September, South Africa
3. PERFORMANCE-BASED STANDARDS: ROLLOVER

www.IRFnews.org
17 SARF/IRF 2014 | 2-4 September, South Africa

www.IRFnews.org
18 SARF/IRF 2014 | 2-4 September, South Africa
3. PERFORMANCE-BASED STANDARDS: ROLLOVER

www.IRFnews.org
19 SARF/IRF 2014 | 2-4 September, South Africa 19
3. LOW-SPEED OFFTRACKING

www.IRFnews.org
20 SARF/IRF 2014 | 2-4 September, South Africa 20
3. LOW-SPEED OFFTRACKING

www.IRFnews.org
21 SARF/IRF 2014 | 2-4 September, South Africa 21
3. HIGH SPEED TRANSIENT OFFTRACKING
PBS Lane Change Manoeuvre (SAE J2179)

www.IRFnews.org
22 SARF/IRF 2014 | 2-4 September, South Africa 22
3. HIGH SPEED TRANSIENT OFFTRACKING
baseline PBS

www.IRFnews.org
23 SARF/IRF 2014 | 2-4 September, South Africa 23
3. ROAD WEAR ANALYSIS
• Based on SA Mechanistic-Empirical Design & Analysis
Methodology (SAMDM)
• Combines a stress-strain computational engine and
pavement engineering models (developed at CSIR)
• Design outputs include each pavement layer’s life and
stress/strain plots
• Layer life based on linear-log damage functions
(“transfer functions”) – derived from Heavy Vehicle
Simulator (APT) testing on pavement types since 1975
• “Load Equivalency Factors” are calculated for a vehicle

www.IRFnews.org
24 SARF/IRF 2014 | 2-4 September, South Africa 24
3. ROAD WEAR ANALYSIS
50 AG*
150 G1*
150 C3*
150 C3
SUBGRADE
0.44
0.35
0.35
0.35
0.35
2000
250
2000
1500
90
1800
250
1700
120
90
1500
240
160
110
90
Pavement B:
ES100
50 AG*
150 G1*
150 C3*
150 C3
SUBGRADE
Poisson's
Ratio Phase I Phase II Phase III
Elastic Moduli (MPa)
0.44
0.35
0.35
0.35
0.35
2000
450
2000
1500
180
2000
450
2000
550
180
1500
350
500
250
180
Pavement A:
ES100
40 AG*
120 BC*
450 C3*
200 G7*
SUBGRADE
0.44
0.44
0.35
0.35
0.35
2500
3500
2200
300
150
2500
3500
1000
300
150
Pavement E:
ES30/ES50
S*
100 G4*
125 C4*
SUBGRADE
0.44
0.35
0.35
0.35
1000
200
1000
70
1000
180
120
70
Pavement D:
ES0.1
- - -
S*
100 G4*
125 C4*
SUBGRADE
0.44
0.35
0.35
0.35
1000
300
1000
140
1000
225
200
140
Pavement C:
ES0.1
- - -
30 AG*
150 C3*
300 C4*
SUBGRADE
0.44
0.35
0.35
0.35
2400
2000
1000
180
Pavement G:
ES10
- -
S*
80 BC*
150 C4*
SUBGRADE
0.44
0.44
0.35
0.35
2000
2000
1000
140
1600
1600
300
140
Pavement F:
ES1.0
- - -
S1*
100 C4*
100 C4*
SUBGRADE
0.44
0.35
0.35
0.35
2000
2000
1000
140
Pavement H:
ES0.3
- -
* Classification according to TRH 14 (CSRA, 1985)
8 Pavement Structures-1.ppt
Poisson's
Ratio Phase I Phase II Phase III
Elastic Moduli (MPa)
Poisson's
Ratio Phase I Phase II
Elastic Moduli (MPa)
Poisson's
Ratio Phase I Phase II
Elastic Moduli (MPa)
Poisson's
Ratio Phase I Phase II
Elastic Moduli (MPa) Poisson's
Ratio Phase I Phase II
Elastic Moduli (MPa)
Poisson's
Ratio Phase I Phase II
Elastic Moduli (MPa)
Poisson's
Ratio Phase I
Elastic Moduli (MPa)Poisson's
Ratio Phase I
Elastic Moduli (MPa)
1600
1500
300
200
140
Phase III
2000
1800
300
140
-
Phase II
1600
250
100
100
-
Phase III
1000
1500
300
140
-
Phase II
200
100
100
100
-
Phase III
50 AG*
150 G1*
150 C3*
150 C3
SUBGRADE
0.44
0.35
0.35
0.35
0.35
2000
250
2000
1500
90
1800
250
1700
120
90
1500
240
160
110
90
Pavement B:
ES100
50 AG*
150 G1*
150 C3*
150 C3
SUBGRADE
Poisson's
Ratio Phase I Phase II Phase III
Elastic Moduli (MPa)
0.44
0.35
0.35
0.35
0.35
2000
450
2000
1500
180
2000
450
2000
550
180
1500
350
500
250
180
Pavement A:
ES100
40 AG*
120 BC*
450 C3*
200 G7*
SUBGRADE
0.44
0.44
0.35
0.35
0.35
2500
3500
2200
300
150
2500
3500
1000
300
150
Pavement E:
ES30/ES50
S*
100 G4*
125 C4*
SUBGRADE
0.44
0.35
0.35
0.35
1000
200
1000
70
1000
180
120
70
Pavement D:
ES0.1
- - -
S*
100 G4*
125 C4*
SUBGRADE
0.44
0.35
0.35
0.35
1000
300
1000
140
1000
225
200
140
Pavement C:
ES0.1
- - -
30 AG*
150 C3*
300 C4*
SUBGRADE
0.44
0.35
0.35
0.35
2400
2000
1000
180
Pavement G:
ES10
- -
S*
80 BC*
150 C4*
SUBGRADE
0.44
0.44
0.35
0.35
2000
2000
1000
140
1600
1600
300
140
Pavement F:
ES1.0
- - -
S1*
100 C4*
100 C4*
SUBGRADE
0.44
0.35
0.35
0.35
2000
2000
1000
140
Pavement H:
ES0.3
- -
* Classification according to TRH 14 (CSRA, 1985)
8 Pavement Structures-1.ppt
Poisson's
Ratio Phase I Phase II Phase III
Elastic Moduli (MPa)
Poisson's
Ratio Phase I Phase II
Elastic Moduli (MPa)
Poisson's
Ratio Phase I Phase II
Elastic Moduli (MPa)
Poisson's
Ratio Phase I Phase II
Elastic Moduli (MPa) Poisson's
Ratio Phase I Phase II
Elastic Moduli (MPa)
Poisson's
Ratio Phase I Phase II
Elastic Moduli (MPa)
Poisson's
Ratio Phase I
Elastic Moduli (MPa)Poisson's
Ratio Phase I
Elastic Moduli (MPa)
1600
1500
300
200
140
Phase III
2000
1800
300
140
-
Phase II
1600
250
100
100
-
Phase III
1000
1500
300
140
-
Phase II
200
100
100
100
-
Phase III

www.IRFnews.org
25 SARF/IRF 2014 | 2-4 September, South Africa 25
4. FORESTRY BASELINE AND PBS VEHICLES

www.IRFnews.org
26 SARF/IRF 2014 | 2-4 September, South Africa 26
4. FORESTRY PBS VEHICLES (SMART TRUCKS

www.IRFnews.org
27 SARF/IRF 2014 | 2-4 September, South Africa 27

www.IRFnews.org
28 SARF/IRF 2014 | 2-4 September, South Africa 28
4. MINING PBS ROAD TRAIN
• “BAB quad”
• 42 m
• 185 tonnes
www.IRFnews.org
31 SARF/IRF 2014 | 2-4 September, South Africa
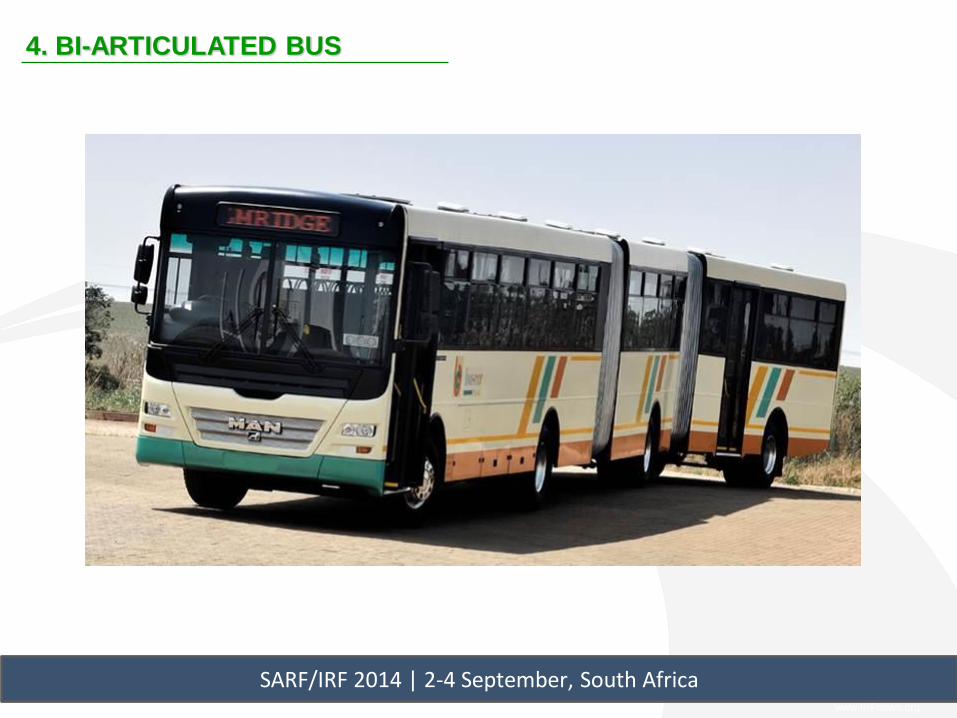
4. BI-ARTICULATED BUS

www.IRFnews.org
32 SARF/IRF 2014 | 2-4 September, South Africa
4. BI-ARTICULATED BUS

www.IRFnews.org
33 SARF/IRF 2014 | 2-4 September, South Africa 33
5. EVALUATION OF RESULTS

www.IRFnews.org
34 SARF/IRF 2014 | 2-4 September, South Africa 34
5. EVALUATION OF RESULTS
• 60 demonstration projects operational during 2013
• 130 car carriers plus 100 others in design phase
• 59 400 trips saved, 1.24 million litres of fuel, 3 250 tons of CO2
• Approx. 22% of pulp timber transported by Smart Trucks in 2013
• On average 14% fuel savings in forestry industry
2013
• Fuel savings: 1.24 million litres
• Emissions: 3 250 tons CO2
• Road freight in SA (2012): 303 billion ton.km
Assuming 10% are PBS vehicles would result in a reduction of 188 000 tons CO2 p.a.

www.IRFnews.org
35 SARF/IRF 2014 | 2-4 September, South Africa 35
5. EVALUATION OF RESULTS
0.0000
0.0050
0.0100
0.0150
0.0200
0.0250
Fue
l Eff
icie
ncy
(Li
tre
s/to
n.k
m)
PBS Baseline

www.IRFnews.org
37 SARF/IRF 2014 | 2-4 September, South Africa 37
5. EVALUATION OF RESULTS: Jan 2008 – May 2014
Crash rate ratio:
Smart Truck : Baseline 1 : 1.79
Timber Logistics Services
Unitrans Timber
Timber-nology
Buhle Betfu Timber24 Supergroup Gaskells Unitrans mining (RBM)
Totals
No of Crashes
Smart Trucks 17 15 5 3 3 8 1 0 52
Baseline 92 2 6 5 51 73 2 0 231
Total 109 17 11 8 54 81 3 0 283
Total Kilometres
Smart Trucks 11 262 165 2 426 555 3 571 410 1 857 239 1 224 438 1 338 743 1 037 815 829 819 29 575 000
Baseline 21 241 994 1 193 603 2 879 347 979 492 20 713 945 16 984 787 1 934 114 1 456 277 75 960 000
Total 32 504 159 3 620 158 6 450 757 2 836 731 21 938 383 18 323 530 2 971 929 2 286 096 90 931 743
Crashes per million kms
Smart Trucks 1.5 6.2 1.4 1.6 2.5 6.0 1.0 0.0 1.79
Baseline 4.3 1.7 2.1 5.1 2.5 4.3 1.0 0.0 3.21
Total 3.4 4.7 1.7 2.8 2.5 4.4 1.0 0.0 3.11
Caused by Third Parties and Pedestrians (included in figures above)
No of Crashes
Smart Trucks 11 3 3 0 0 5 22
Baseline 44 13 2 0 0 28 87
Total 55 16 5 0 0 33 109
% of Total
Smart Trucks 91.7% 33.3% 75.0% 0.0% 0.0% 62.5% 55.0%
Baseline 51.2% 650.0% 100.0% 0.0% 0.0% 39.4% 39.9%
Total 56.1% 145.5% 83.3% 0.0% 0.0% 41.8% 42.2%

www.IRFnews.org
38 SARF/IRF 2014 | 2-4 September, South Africa
6. CONCLUSIONS
38
Potential benefits of a PBS approach to heavy
vehicle design and operations:
• Reduced road wear (per tonne.km)
• Reduced vehicle trips i.e.
• Reduced congestion
• Reduced safety exposure risk
• Improved safety performance
• Improved transport productivity
• Reduced emissions (per tonne.km)
