evaluation of common bean genotypes for phosphorus use
TRANSCRIPT

Bragantia, Campinas, v. 75, n. 2, p.152-163, 2016152
D.A. Silva et al.
Plant Breeding - Article
Evaluation of common bean genotypes for phosphorus use efficiency in Eutrophic OxisolDaiana Alves da Silva*, Jose Antonio de Fatima Esteves, João Guilherme Ribeiro Gonçalves, Cleber Vinícius Giaretta Azevedo, Tamires Ribeiro, Alisson Fernando Chiorato, Sérgio Augusto Morais CarbonellInstituto Agronômico - Centro de Grãos e Fibras - Campinas (SP), Brazil.
*Corresponding author: [email protected]
Received: Mar. 24, 2015 – Accepted: Nov. 19, 2015
DOI: http://dx.doi.org/10.1590/1678-4499.454
aBstract: Common bean is one of the most important legumes
in Latin America, mostly grown in soils with low phosphorus (P)
availability. Thus, this study aimed to evaluate the responses of
20 bean genotypes to P deficiency. The experiment was a completely
randomized design in a 2 × 20 factorial arrangement; the first factor
consisted of P levels and the second factor, of 20 bean genotypes,
with six replications. The substrate was a Red Eutrophic Oxisol with
low P content. For application of the P treatments, it was applied simple
superphosphate, consisting of two levels: restrictive and control, with
the application of 45 and 90 kg∙ha–1 of P2O5, respectively. At 28 days, we
observed the first symptoms of nutrient deficiency, with the decrease
in the relative chlorophyll index in the restrictive level treatment. In
addition, the treatments were effective in differentiating effects of both
factors levels of P and genotypes for most traits evaluated relative to
shoot, root and grain yield. It was possible to classify the genotypes
in relation to use efficiency and responsiveness to P application,
according to their average yield performances. Seven genotypes
presented better performances for both P levels, being classified
as Efficient and Responsive: G 2333, IAC Carioca Tybatã, IAPAR 81,
IAC Imperador, IAC Formoso, BRS Esplendor and IPR Tangará; the first
four genotypes were also classified as Efficient and Responsive under
hydroponic conditions.
Key words: Phaseolus vulgaris, abiotic stress, plant nutrition, genotype
classification.

153Bragantia, Campinas, v. 75, n. 2, p.152-163, 2016
Phosphorus use efficiency in common bean genotypes
intrOdUctiOn
Common bean (Phaseolus vulgaris L.) is the most important food legume in Latin America, where it is extensively grown by small farmers, often in poor soils. In this view, the low fertility of tropical soils is the main cause of the gap between the low crop yield in relation to their potential and the low availability of phosphorus (P) represents the most limiting factor for the development of the crop (Beebe et al. 2012).
Phosphorus plays a key role in plant nutrition. As an essential element, it participates in various physiological and biochemical processes occurring in all living organisms (most crop plants contains 0.2 – 0.5% of P in dry matter). In intensive farming, this nutrient can be applied with the use of inorganic and organic phosphate fertilizers. In this context, phosphorus fertilization is widely used to minimize the risk of phosphorus deficiency in the soil and thereby increase crop yields, improving food safety (Kirkby and Johnston 2008).
Soil P consists of compounds derived mainly from orthophosphoric acid and the element dynamics is associated with environmental factors that control the activity of microorganisms, which can immobilize or release orthophosphate ions (Santos, 2008). In this way, in young and moderately weathered soils, P is mostly found in organic form (Po), or in mineral form (Pi), weakly adsorbed to secondary minerals. In turn, highly weathered soils, such as Oxisol, contain mostly inorganic forms related to the mineral fraction with high energy and organic forms (physically and chemically stabilized).
Most Brazilian soils are weathered and have iron and aluminum oxides as the main components of the clay fraction. In acidic reaction conditions, iron and aluminum oxides preferentially have positive charges, being able to predominantly retain phosphate ions (Valladares et al. 2003). Thus, as this nutrient is adsorbed to the soil in forms little available to plants, the use efficiency of phosphate fertilizers is reduced, and plants use only 10 to 20%, approximately, of the nutrient provided (Santos et al. 2011).
According to Schröder et al. (2011), mineral phosphate fertilizers, intensively used in food production over the last 50 years, are processed from fossil reserves, but due to inefficiencies in the chain of production and consumption of food, only a fifth of that P reaches food consumed by
the global population. Considering the world population increase in the next 40 years and also the reserve depletion for the production of phosphate fertilizers, during the next 50 – 150 years, the efficient use of this resource is required.
Beebe et al. (2012) argued that current efforts to increase the efficiency of acquisition and utilization of nutrients in low fertility soils will certainly contribute to improve the efficiency of fertilizer use, in a sustainable manner. The authors highlight the importance of the recovery of P applied, before being irreversibly fixed by iron and aluminum oxides in tropical soils with high fixing capacity, which involves an efficient root system that aggressively access soil nutrients.
Given the above considerations, the aim of this study was to evaluate the morphological, physiological and productive responses of 20 bean genotypes, previously classified in hydroponics, and grown in Red Eutrophic Oxisol of medium fertility and containing low P content, with application of two levels of P. The genotypes have also been classified in respect to their nutrient use efficiency.
Material and MetHOds
The experiment was conducted in a greenhouse at the Instituto Agronômico (IAC; Farm Santa Elisa, Campinas, State of São Paulo), from May to September, 2014. Twenty bean genotypes were evaluated, previously classified in hydroponics as to the efficient use of P (Silva et al. 2014) (Table 1).
Pots with 5 dm3 volume were filled with a mixture of Red Eutrophic Oxisol and sand at a 3:1 ratio. According to chemical and particle size analysis (Table 2), the soil is considered clayey, with medium fertility, containing 3 mg·dm-3 P, considered a very low content (van Raij et al. 1997).
The experiment was a completely randomized design in a 2 × 20 factorial arrangement. The first factor consisted of two levels of phosphorus and the second factor, of 20 bean genotypes, with six replications. The 20 genotypes were pre-germinated and transplanted to pots, randomly distributed in the greenhouse; three replications were collected at flowering (R6 stage) for biometric assessments, and the other three, were allowed to reach the grain yield.

Bragantia, Campinas, v. 75, n. 2, p.152-163, 2016154
D.A. Silva et al.
Each pot received 500 mg of N as urea (corresponding to 90 kg∙ha–1 of N), and the two treatments received phosphorus as single superphosphate, consisting of: PA
Plot (restrictive level): 45 kg∙ha–1 P2O5 and PB Plot (control level): 90 kg∙ha–1 P2O5. Thus, the PA Plot received 625 mg and PB Plot, 1,250 mg simple superphosphate per pot. The level applied to the PA Plot is restrictive for representing half of the level applied to the PB Plot, called control, recommended for application under conditions of soil fertility (van Raij et al. 1997). With the application of simple superphosphate, it was added 40 kg∙ha–1 of Ca in pots of PA Plot, corresponding to 100 mg per pot and 20 kg∙ha–1 S, corresponding to 50 mg per pot. In PB Plot, 80 kg∙ha–1 of Ca were added, corresponding to 200 mg per pot, and 40 kg∙ha–1 of S, corresponding to100 mg per pot.
At 28 days after transplanting (DAT), the relative chlorophyll index (IRC) was evaluated in the cotyledon leaf, using the non-destructive method (SPAD-502 Plus – Konica Minolta).
At the R6 stage, plant samples were taken for the evaluation of the following biometric characters: plant height (PH) in cm; number of nodes per plant (NNP); leaf area (LA) in cm2; dry matter of leaves (DML) and branches (DMB) in g; and for root traits: surface area
(RSA) in cm2; length (RL) in cm; total volume (RV) in cm3; average diameter (RD) in mm and dry root matter (DRM ) in g.
To determine the total leaf area, it was used an area integrator, Model LI-3100C – LI-COR. To obtain the dry matter of leaves, branches and roots, the samples were dried in an oven with air circulation at 60 °C. Roots were evaluated using the software WinRHIZO® (Regent Instruments Inc., Quebec, Canada).
At physiological maturity, production components were evaluated for the number of pods per plant (NPP); number of seeds per plant (NS), number of seeds per pod (NSP); mass of hundred seed (MHS) in g and grain yield (Y) in g per plant.
To determine the levels of macronutrients, all leaves of the plant were oven-dried and ground in a Wiley mill. Samples of 1.0 g of ground leaves were subjected to nitric-perchloric digestion for extraction of P, K, Ca, Mg and S. In the extracts, the levels of these nutrients were determined by atomic absorption spectrophotometry. For the determination of total N, 0.2-g samples of ground leaves were subjected to sulfuric acid digestion. Total N was determined by distillation and the other elements by UV-VIS spectrometry (Malavolta et al. 1989).
OM = Organic matter; SB = Sum of bases; CEC = Cation exchange capacity; BS = Base saturation.
pH (cacl2)
OM (g∙dm–3)
Presin (mg∙dm–3)
H + al (mmolc∙dm–3)
K (mmolc∙dm–3)
ca (mmolc∙dm–3)
Mg (mmolc∙dm–3)
sB (mmolc∙dm–3)
cec (%) Bs
5.9 14 3 14 2.2 29 8 39.3 53.3 74
clay (g∙kg–1) silt (g∙kg–1) total sand (g∙kg–1) texture
550.0 91.0 359.0 Clayey
table 2. Chemical and particle size characteristics of the Red Eutrophic Oxisol used in the mixture with sand (3 : 1) for filling the pots.
genotypes integument genotypes integument
1 - IAC Alvorada Carioca 11 - BRS Pontal Carioca
2 - IAC Carioca Tybatã Carioca 12 - BRS Estilo Carioca
3 - IAC Diplomata Black 13 - Pérola Carioca
4 - IAC Formoso Carioca 14 - IPR Tangará Carioca
5 - IAC Imperador Carioca 15 - Diamante negro Black
6 - IPR Uirapuru Black 16 - Jalo precoce Yellow
7 - BAT 477 Creme 17 - G 4000 Brown
8 - SEA 5 Creme 18 - DOR 364 Red
9 - Carioca comum Carioca 19 - G 2333 Red
10 - IAPAR 81 Carioca 20 - BRS Esplendor Black
table 1. Genotypes used in the analysis of efficiency of use of phosphorus.

155Bragantia, Campinas, v. 75, n. 2, p.152-163, 2016
Phosphorus use efficiency in common bean genotypes
resUlts and discUssiOn
At 28 DAT, it was possible to observe the onset of leaf abscission in plants that received the restrictive level. There were statistical differences for the relative chlorophyll index – IRC at 1% probability both between P levels, and between genotypes (Table 3).
The application of restrictive P level resulted in a decrease of 12.85% in IRC, with mean values of 31.0 and 35.88 SPAD units, respectively, for restrictive and control levels. Of the 20 genotypes tested, four showed the highest mean values: G 2333, BRS Esplendor, G 4000 and IAC Imperador (Table 4). P deficiency causes changes in leaf color due to changes in chlorophyll and carotenoids content, and, according to Torres Netto et al. (2005), the indirect determination of chlorophyll content can be used to diagnose the integrity of the photosynthetic apparatus, when the plants are subjected to environmental adversities.
Hernández-Domíguez et al. (2012) and Oliveira et al. (2012) also studied the influence of P deficiency on IRC; however, it was found an increased on IRC with reducing levels of P, when the young leaves of the plant were examined. Graham et al. (2006) identified, by in silico analysis, over expressed genes encoding chlorophyll A and B binding protein under P deficiency conditions, being consistent with frequent symptomatic observation of dark green leaf color. The authors point out that new leaves are continuously produced at the expense of older leaves, and these newly formed leaves are an important part of the light-gathering apparatus.
Individual analyses of variance were run for the traits of shoots, roots, yield components and grain yield. It was possible to detect significant effect of P levels on
all traits except for RD and NSP. As for the genotypes, there was a significant effect for DML, DMB, PH, NNP, RV, RD, NPP, NS, NSP, and MHS. For the interaction P level × genotypes, there was no significant effect for any characteristic evaluated. Experimental coefficients of variation were considered satisfactory, ranging from 7.95 to 22.21% (Table 5).
In relation to LA, a reduction of 20.30% was verified with reducing level of P, i.e. treatment with restrictive and control levels, respectively, had mean leaf area of 1,019.22 and 1,278.3 cm², without significant differences between genotypes (Table 6).
There was a reduction of 33.68% in DML with application of the restrictive level compared to the control. Mean values of treatments were 1.91 and 2.88 g,
genotypes Mean
1 - IAC Alvorada 26.22 bcd
2 - IAC Carioca Tybatã 30.77 abcd
3 - IAC Diplomata 24.67 cd
4 - IAC Formoso 30.68 abcd
5 - IAC Imperador 34.16 ab
6 - IPR Uirapuru 28.11 abcd
7 - BAT 477 27.02 abcd
8 - SEA 5 31.59 abcd
9 - Carioca Comum 30.08 abcd
10 - IAPAR 81 31.93 abcd
11 - BRS Pontal 29.45 abcd
12 - BRS Estilo 24.50 d
13 - Pérola 31.88 abcd
14 - IPR Tangará 29.71 abcd
15 - Diamante Negro 30.68 abcd
16 - Jalo Precoce 28.20 abcd
17 - G 4000 34.31 ab
18 - DOR 364 33.02 abc
19 - G 2333 34.85 a
20 - BRS Esplendor 33.44 ab
Plots Mean
Restrictive level 28.19 B
Control level 32.36 A
table 3. Summary of analysis of variance on the relative chlorophyll index of 20 bean genotypes according to levels of 45 and 90 kg∙ha–1 P2O5.
**Significant by F-test at 1% probability; DF = Degrees of freedom; IRC = Relative chlorophyll index; CV = Coefficient of variation.
sources of variation dF irc
P levels 1 1.027.9**
Genotypes 19 113.3**
P x Genotypes 19 39.5
Error 200 33.7
cV (%) 19.19
Mean 30.28
table 4. Performance of 20 common bean genotypes regarding the relative chlorophyll index in cotyledonary leaves 28 days after transplanting, subjected to the application of two levels of P, restrictive and control, with 45 and 90 kg∙ha–1 P2O5, respectively.
*Mean values followed by different lowercase letters are significantly different for genotypes and mean values followed by different uppercase letters are significantly different for P level by Tukey’s test (p < 0.05).

Bragantia, Campinas, v. 75, n. 2, p.152-163, 2016156
D.A. Silva et al.
respectively, for the restrictive and control levels. The genotype G 2333 stood in DML, with a production of 4.73 g; however it was not statistically different from IAC Carioca Tybatã, IAC Diplomata, BAT 477, Pérola and BRS Esplendor (Table 6).
DMB was influenced by both P level and genotypes. Plots that received the restrictive level averaged 1.49 g, while the plot with the control level averaged 1.73 g; in other words, there was a decrease of 13.87% with a reduction in level applied. The genotypes that presented the best performance for DMB were G 2333, Pérola and Jalo Precoce, presenting mean values of: 2.04; 1.91 and 1.9 g, respectively (Table 6).
PH was influenced by both the level of P and the genotypes. The restrictive level caused a reduction of 16.39% in plant height, and the mean values of the
plots were 91.93 and 76.86 cm, respectively, for plots with control and restrictive levels. The genotype G 2333 presented the highest PH, with indeterminate growth habit, with a mean value of 239.83 cm, followed by genotypes: Pérola, IAC Imperador, BRS Pontal and IAC Carioca Tybatã, averaging respectively: 166.16; 126.66; 108.66 and 104.66 cm. The genotypes with the lowest mean values for PH were: IPR Tangará, SEA 5 and DOR 364, respectively with: 35.66; 40.00 and 43.83 cm (Table 6).
As for the NNP, there was a reduction of 6.99% with the application of restrictive level, with a variation in the number of nodes from 13.5 to 7.5. The genotypes IAC Imperador, IAC Alvorada, IAC Carioca Tybatã and BRS Estilo presented the highest mean values, higher than 12.5 nodes per plant, while the worst performances for this trait were registered for SEA 5, IPR Tangará, BRS
sVMean square
dF lat dMlt dMBt PHt nnP
P Levels 1 529.6** 1.96** 1.65** 22.44** 20.83**
Genotypes 19 48.5 0.16** 0.17** 32.10** 11.98**
P x Genotypes 19 46.7 0.11 0.05 1.76 1.27
Error 80 40.9 0.06 0.03 3.00 1.69
cV (%) 19.25 13.95 10.75 19.63 11.34
Mean 1148.78 2.39 1.61 84.39 11.46
sVMean square
dF rlt rsat rVt rd dMrt
P Levels 1 1993.5* 250.50** 2.14** 0.01 0.12**
Genotypes 19 638.7 51.09 0.39* 0.01** 0.01
P x Genotypes 19 247.1 25.53 0.20 0.01 0.01
Error 80 377.3 32.72 0.21 0.01 0.01
cV (%) 20.55 18.92 15.84 7.95 6.7
Mean 9337.94 948.76 7.75 0.33 0.645
sVMean square
dF nPPt nst nsP MHs Yt
P Levels 1 1.2052** 9.008** 1.8915 114.10* 1.0923**
Genotypes 19 0.2154* 1.485* 1.8379* 106.91** 0.2394
P x Genotypes 19 0.1093 0.338 0.7621 19.44 0.1085
Error 80 0.1216 0.745 0.8658 17.24 0.1488
cV (%) 16.36 21.94 22.21 15.6 17.63
Mean 3.68 15.34 4.18 26.61 3.94
table 5. Summary of analysis of variance for traits of shoots, roots, yield components and yield of 20 bean genotypes according to the application of two levels of P, restrictive and control, respectively, with 45 and 90 kg∙ha–1 P2O5.
tTransformed data (√x+1); *,**Significant at 5 and 1% probability; SV = Sources of variation; DF = Degrees of freedom; LA = Leaf area; DML = Dry matter of leaves; DMB = Dry matter of branches; PH = Plant height; NNP = Number of nodes per plant; CV = Coefficient of variation; RL = Root length; RSA = Root surface area; RV = Root volume; RD = Root diameter; DMR = Dry root matter; NPP = Number of pods per plant; NS = Number of seeds per plant; NSP = Number of seeds per pod; MHS = Mass of hundred seed; Y = Grain yield.
157Bragantia, Campinas, v. 75, n. 2, p.152-163, 2016
Phosphorus use efficiency in common bean genotypes
Esplendor and Jalo Precoce, with lower mean values of 10.5 nodes (Table 6).
The use of restrictive level of P reduced all traits related to shoots. According to White and Hammond (2008), many of the responses of plants to P deficiency seem to be initiated or modulated by the reduction of inorganic phosphorus (Pi) transport to shoots and hence reduction in Pi available for metabolism. In this way, in most cases, this condition results in immediate reduction of shoot growth rate, even before affecting root growth. The authors also emphasize that reducing the element at the cellular level directly affects photosynthesis, glycolysis and respiration. Thus, changes in carbohydrate metabolism are enhanced by transcriptional reprogramming, resulting in the synthesis of organic acids, starch and accumulation of sucrose in leaves of deficient plants.
Mean values of P concentration in leaf t issue determined by chemical analysis were 1.49 and 1.24 g∙kg–1, respectively, for the restrictive and control
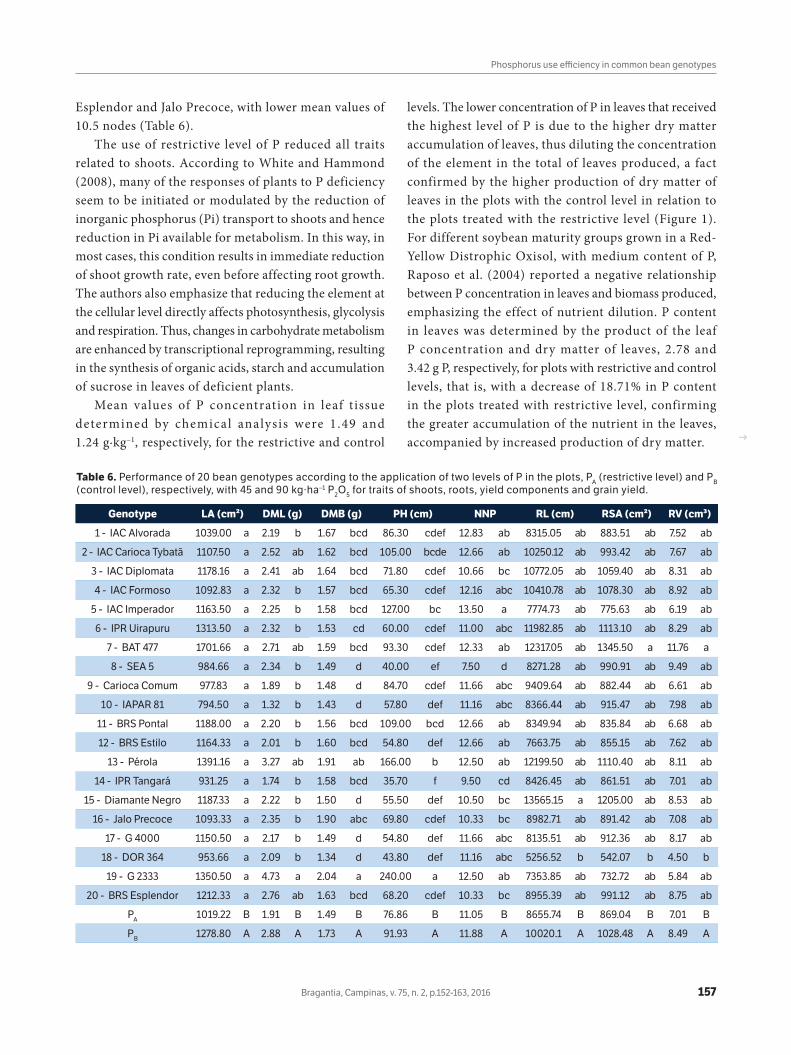
genotype la (cm²) dMl (g) dMB (g) PH (cm) nnP rl (cm) rsa (cm²) rV (cm³)
1 - IAC Alvorada 1039.00 a 2.19 b 1.67 bcd 86.30 cdef 12.83 ab 8315.05 ab 883.51 ab 7.52 ab
2 - IAC Carioca Tybatã 1107.50 a 2.52 ab 1.62 bcd 105.00 bcde 12.66 ab 10250.12 ab 993.42 ab 7.67 ab
3 - IAC Diplomata 1178.16 a 2.41 ab 1.64 bcd 71.80 cdef 10.66 bc 10772.05 ab 1059.40 ab 8.31 ab
4 - IAC Formoso 1092.83 a 2.32 b 1.57 bcd 65.30 cdef 12.16 abc 10410.78 ab 1078.30 ab 8.92 ab
5 - IAC Imperador 1163.50 a 2.25 b 1.58 bcd 127.00 bc 13.50 a 7774.73 ab 775.63 ab 6.19 ab
6 - IPR Uirapuru 1313.50 a 2.32 b 1.53 cd 60.00 cdef 11.00 abc 11982.85 ab 1113.10 ab 8.29 ab
7 - BAT 477 1701.66 a 2.71 ab 1.59 bcd 93.30 cdef 12.33 ab 12317.05 ab 1345.50 a 11.76 a
8 - SEA 5 984.66 a 2.34 b 1.49 d 40.00 ef 7.50 d 8271.28 ab 990.91 ab 9.49 ab
9 - Carioca Comum 977.83 a 1.89 b 1.48 d 84.70 cdef 11.66 abc 9409.64 ab 882.44 ab 6.61 ab
10 - IAPAR 81 794.50 a 1.32 b 1.43 d 57.80 def 11.16 abc 8366.44 ab 915.47 ab 7.98 ab
11 - BRS Pontal 1188.00 a 2.20 b 1.56 bcd 109.00 bcd 12.66 ab 8349.94 ab 835.84 ab 6.68 ab
12 - BRS Estilo 1164.33 a 2.01 b 1.60 bcd 54.80 def 12.66 ab 7663.75 ab 855.15 ab 7.62 ab
13 - Pérola 1391.16 a 3.27 ab 1.91 ab 166.00 b 12.50 ab 12199.50 ab 1110.40 ab 8.11 ab
14 - IPR Tangará 931.25 a 1.74 b 1.58 bcd 35.70 f 9.50 cd 8426.45 ab 861.51 ab 7.01 ab
15 - Diamante Negro 1187.33 a 2.22 b 1.50 d 55.50 def 10.50 bc 13565.15 a 1205.00 ab 8.53 ab
16 - Jalo Precoce 1093.33 a 2.35 b 1.90 abc 69.80 cdef 10.33 bc 8982.71 ab 891.42 ab 7.08 ab
17 - G 4000 1150.50 a 2.17 b 1.49 d 54.80 def 11.66 abc 8135.51 ab 912.36 ab 8.17 ab
18 - DOR 364 953.66 a 2.09 b 1.34 d 43.80 def 11.16 abc 5256.52 b 542.07 b 4.50 b
19 - G 2333 1350.50 a 4.73 a 2.04 a 240.00 a 12.50 ab 7353.85 ab 732.72 ab 5.84 ab
20 - BRS Esplendor 1212.33 a 2.76 ab 1.63 bcd 68.20 cdef 10.33 bc 8955.39 ab 991.12 ab 8.75 ab
PA 1019.22 B 1.91 B 1.49 B 76.86 B 11.05 B 8655.74 B 869.04 B 7.01 B
PB 1278.80 A 2.88 A 1.73 A 91.93 A 11.88 A 10020.1 A 1028.48 A 8.49 A
table 6. Performance of 20 bean genotypes according to the application of two levels of P in the plots, PA (restrictive level) and PB (control level), respectively, with 45 and 90 kg∙ha–1 P2O5 for traits of shoots, roots, yield components and grain yield.
levels. The lower concentration of P in leaves that received the highest level of P is due to the higher dry matter accumulation of leaves, thus diluting the concentration of the element in the total of leaves produced, a fact confirmed by the higher production of dry matter of leaves in the plots with the control level in relation to the plots treated with the restrictive level (Figure 1). For different soybean maturity groups grown in a Red-Yellow Distrophic Oxisol, with medium content of P, Raposo et al. (2004) reported a negative relationship between P concentration in leaves and biomass produced, emphasizing the effect of nutrient dilution. P content in leaves was determined by the product of the leaf P concentration and dry matter of leaves, 2.78 and 3.42 g P, respectively, for plots with restrictive and control levels, that is, with a decrease of 18.71% in P content in the plots treated with restrictive level, confirming the greater accumulation of the nutrient in the leaves, accompanied by increased production of dry matter.
Bragantia, Campinas, v. 75, n. 2, p.152-163, 2016158
D.A. Silva et al.
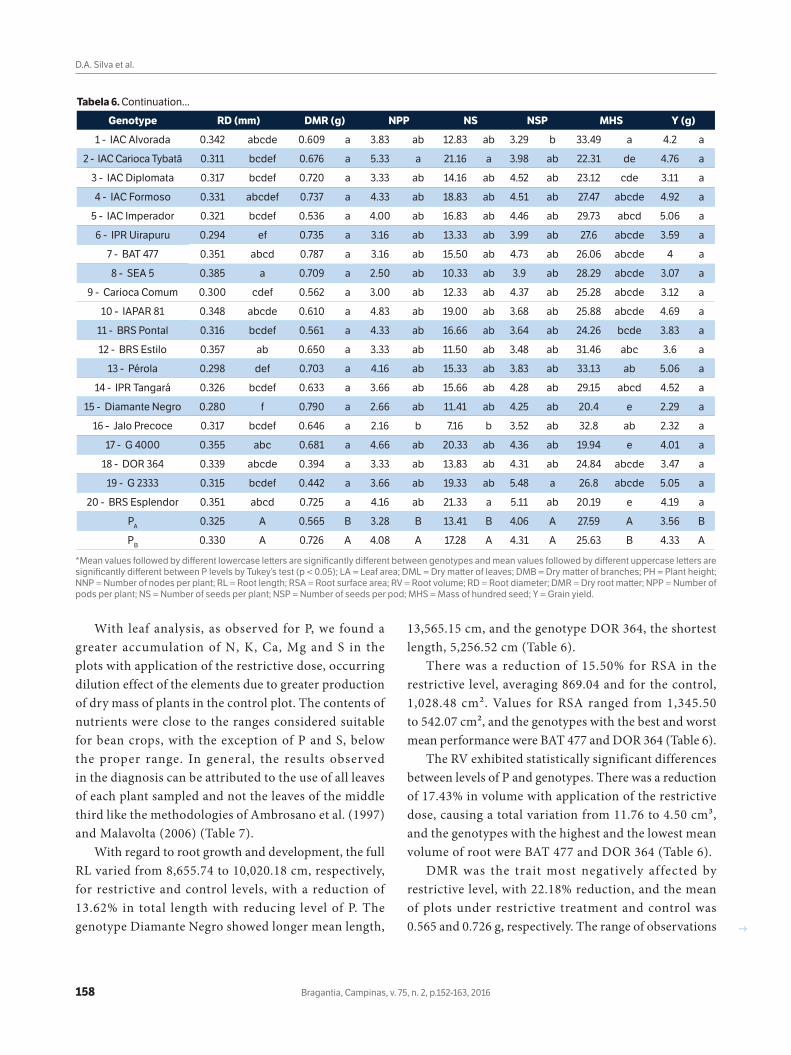
genotype rd (mm) dMr (g) nPP ns nsP MHs Y (g)
1 - IAC Alvorada 0.342 abcde 0.609 a 3.83 ab 12.83 ab 3.29 b 33.49 a 4.2 a
2 - IAC Carioca Tybatã 0.311 bcdef 0.676 a 5.33 a 21.16 a 3.98 ab 22.31 de 4.76 a
3 - IAC Diplomata 0.317 bcdef 0.720 a 3.33 ab 14.16 ab 4.52 ab 23.12 cde 3.11 a
4 - IAC Formoso 0.331 abcdef 0.737 a 4.33 ab 18.83 ab 4.51 ab 27.47 abcde 4.92 a
5 - IAC Imperador 0.321 bcdef 0.536 a 4.00 ab 16.83 ab 4.46 ab 29.73 abcd 5.06 a
6 - IPR Uirapuru 0.294 ef 0.735 a 3.16 ab 13.33 ab 3.99 ab 27.6 abcde 3.59 a
7 - BAT 477 0.351 abcd 0.787 a 3.16 ab 15.50 ab 4.73 ab 26.06 abcde 4 a
8 - SEA 5 0.385 a 0.709 a 2.50 ab 10.33 ab 3.9 ab 28.29 abcde 3.07 a
9 - Carioca Comum 0.300 cdef 0.562 a 3.00 ab 12.33 ab 4.37 ab 25.28 abcde 3.12 a
10 - IAPAR 81 0.348 abcde 0.610 a 4.83 ab 19.00 ab 3.68 ab 25.88 abcde 4.69 a
11 - BRS Pontal 0.316 bcdef 0.561 a 4.33 ab 16.66 ab 3.64 ab 24.26 bcde 3.83 a
12 - BRS Estilo 0.357 ab 0.650 a 3.33 ab 11.50 ab 3.48 ab 31.46 abc 3.6 a
13 - Pérola 0.298 def 0.703 a 4.16 ab 15.33 ab 3.83 ab 33.13 ab 5.06 a
14 - IPR Tangará 0.326 bcdef 0.633 a 3.66 ab 15.66 ab 4.28 ab 29.15 abcd 4.52 a
15 - Diamante Negro 0.280 f 0.790 a 2.66 ab 11.41 ab 4.25 ab 20.4 e 2.29 a
16 - Jalo Precoce 0.317 bcdef 0.646 a 2.16 b 7.16 b 3.52 ab 32.8 ab 2.32 a
17 - G 4000 0.355 abc 0.681 a 4.66 ab 20.33 ab 4.36 ab 19.94 e 4.01 a
18 - DOR 364 0.339 abcde 0.394 a 3.33 ab 13.83 ab 4.31 ab 24.84 abcde 3.47 a
19 - G 2333 0.315 bcdef 0.442 a 3.66 ab 19.33 ab 5.48 a 26.8 abcde 5.05 a
20 - BRS Esplendor 0.351 abcd 0.725 a 4.16 ab 21.33 a 5.11 ab 20.19 e 4.19 a
PA 0.325 A 0.565 B 3.28 B 13.41 B 4.06 A 27.59 A 3.56 B
PB 0.330 A 0.726 A 4.08 A 17.28 A 4.31 A 25.63 B 4.33 A
*Mean values followed by different lowercase letters are significantly different between genotypes and mean values followed by different uppercase letters are significantly different between P levels by Tukey’s test (p < 0.05); LA = Leaf area; DML = Dry matter of leaves; DMB = Dry matter of branches; PH = Plant height; NNP = Number of nodes per plant; RL = Root length; RSA = Root surface area; RV = Root volume; RD = Root diameter; DMR = Dry root matter; NPP = Number of pods per plant; NS = Number of seeds per plant; NSP = Number of seeds per pod; MHS = Mass of hundred seed; Y = Grain yield.
tabela 6. Continuation...
With leaf analysis, as observed for P, we found a greater accumulation of N, K, Ca, Mg and S in the plots with application of the restrictive dose, occurring dilution effect of the elements due to greater production of dry mass of plants in the control plot. The contents of nutrients were close to the ranges considered suitable for bean crops, with the exception of P and S, below the proper range. In general, the results observed in the diagnosis can be attributed to the use of all leaves of each plant sampled and not the leaves of the middle third like the methodologies of Ambrosano et al. (1997) and Malavolta (2006) (Table 7).
With regard to root growth and development, the full RL varied from 8,655.74 to 10,020.18 cm, respectively, for restrictive and control levels, with a reduction of 13.62% in total length with reducing level of P. The genotype Diamante Negro showed longer mean length,
13,565.15 cm, and the genotype DOR 364, the shortest length, 5,256.52 cm (Table 6).
There was a reduction of 15.50% for RSA in the restrictive level, averaging 869.04 and for the control, 1,028.48 cm². Values for RSA ranged from 1,345.50 to 542.07 cm², and the genotypes with the best and worst mean performance were BAT 477 and DOR 364 (Table 6).
The RV exhibited statistically significant differences between levels of P and genotypes. There was a reduction of 17.43% in volume with application of the restrictive dose, causing a total variation from 11.76 to 4.50 cm³, and the genotypes with the highest and the lowest mean volume of root were BAT 477 and DOR 364 (Table 6).
DMR was the trait most negatively affected by restrictive level, with 22.18% reduction, and the mean of plots under restrictive treatment and control was 0.565 and 0.726 g, respectively. The range of observations

159Bragantia, Campinas, v. 75, n. 2, p.152-163, 2016
Phosphorus use effi ciency in common bean genotypes
ranged from 0.790 g for Diamante Negro to 0.394 g for DOR 364 (Table 6).
According to López-Bucio et al. (2003), soil nutrients are critical for plant growth and yield. Bioavailability of nutrients in the soil solution can determine the growth and proliferation of roots; P is a nutrient that can alter the post-embryonic development of the root system. Furthermore, due to low bioavailability and mobility of P in most soils, the ability of the root system to effectively
exploit the soil at a minimum metabolic cost is essential to plant development (Lynch and Brown 2008).
Trindade and Araújo (2014) studied the variability of 24 common bean genotypes considering the root system in a Red-Yellow clay soil, with application of two levels of P per hectare, 20 and 80 kg P2O5, and noted that the highest dose of P promoted a higher development of roots, resulting in increases in the mass of tap, basal and lateral roots; mass of nodules; in the area and length of roots, both at the beginning of development and in the pod filling period. The authors emphasized the importance of selecting cultivars with greater root growth as a strategy to increase P uptake and grain yield, especially in tropical and subtropical environments, where the availability of P in the soil is usually very low.
In relation to the yield components, there was a decrease by 19.61% in the NPP, with the restrictive level of P; the plot treated with such level presented a mean value of 3.28, and the control plot, a mean value of 4.08 podsper plant. Genotypes with the highest number of pods per plant were IAC Carioca Tybatã, IAPAR 81,G 4000, whereas Jalo Precoce, SEA 5 and Diamante Negro had the lowest number (Table 6).
As for the NS, there were significant differences for both P levels and genotypes. The observed mean values were 13.41 and 17.28 seeds per plant, respectively, for plots with restriction of P and control, with 22.40% reduction in the total number of seeds per plant with the restrictive level. Genotypes with the highest number of seeds were BRS Esplendor, IAC Carioca Tybatã and G 4000 (Table 6).
The trait NSP showed no effect of P level, and the restrictive and control plots showed close values, respectively, 4.06 and 4.31 seeds per pod with a reduction of 5.80% in the restrictive level. There was effect of
treatmentn P K ca Mg s
g∙kg–1
Suitable range1 30 – 50 2.5 – 4.0 20 – 24 10 – 25 2.5 – 5.0 2 – 3
Suitable range2 52 – 54 4 – 6 15 – 35 15 – 25 4 – 8 5 – 10
PA 54.27 1.49 23.64 20.61 3.99 1.04
PB 42.50 1.24 20.06 19.05 3.61 0.79
Figure 1. Concentration and content of P in leaves of 20 bean genotypes grown in Red Eutrophic Oxisol, subjected to restrictive and control levels, respectively, with the application of 45 and 90 kg∙ha–1 P2O5. Horizontal and vertical lines represent the overall means of each treatment.
table 7. Content of macronutrients in leaf tissue (g∙kg–1) of 20 bean genotypes grown in Red Eutrophic Oxisol, with application of two levels of P in the plots PA (restrictive level) and PB (control level), respectively, with 45 and 90 kg∙ha–1 P2O5.
Range of macronutrient content considered suitable in bean leaves collected at fl owering; third leaves with petiole and taken at the middle third of 30 plants (1Ambrosano et al. 1997 and 2Malavolta 2006).
Restrictive level
P c
once
ntra
tion
(g·
kg–1
)
Con
trol
leve
l
61015
95
18
7 12
2.0
1.6
1.4
1.2
1.0
0.8
1.51.0
14
1711
13
1420
16
198
32
Restrictive level
P c
onte
nt (g
)
Con
trol
leve
l
6
10
15
9
5
18
712
4.0
5
4
3
2
4.53.0 3.52.0 2.5
1
417
11
13
14
20
16
19
8 3
2

Bragantia, Campinas, v. 75, n. 2, p.152-163, 2016160
D.A. Silva et al.
genotype influencing the trait; the genotypes with the best and worst mean performance were G 2333 and IAC Alvorada, with, respectively, 5.48 and 3.29 seeds per pod (Table 6).
The trait MHS was influenced by both P levels and genotypes; however, there was a 7.65% increase in seed mass in the plot that received the lowest level of P, being the mean values of the plots with restrictive and control levels 27.59 and 25.63 g, respectively. For this trait, the genotypes that showed better mean performance in both conditions of P fertilization, with values greater than 32 g, were: IAC Alvorada, Pérola and Jalo Precoce and genotypes with lower mass were Diamante Negro, IAC Carioca Tybatã and IAC Diplomata (Table 6). For yield and quality of seeds of the cultivar Carioca Precoce subjected to six levels of P fertilization, Zucareli et al. (2011) showed that P levels applied did not influence the MHS, and neither the physiological quality; however, there was a linear increase in yield according to the P level. The authors underline that under nutritional deficiency, plants tend to adjust seed production to available resources, without impairing the vigor.
For Y, statistical differences were detected only between P levels. Mean values of yield of plots treated with the restrictive and control levels were, respectively, 3.56 and 4.33 g per plant, that is, the restrictive P level resulted in 17.78% of reduction. Araújo et al. (2000) evaluated eight bean genotypes in soil with low P content (5 mg∙dm–3 P) using two levels of fertilization, 27.5 and 114.5 kg∙ha–¹ P2O5, and obtained average yields per plant of 3.76 and 4.00 g, respectively. Likewise, Oliveira et al. (2012) assessed 19 genotypes in soil containing4.9 mg∙dm–3 P, using levels of 20 and 120 kg∙ha–1 P2O5, also verified low yield, 2.2 and 5.25 g per plant, respectively, for the lower and higher level of P.
The results for the mean grain yield showed a variation from 5.06 to 2.29 g per plant, and for both levels, the genotypes with the highest mean values were IAC Imperador (5.06 g), Pérola (5.06 g) and G 2333 (5.05 g); the genotypes with worse performances were Diamante Negro (2.29 g), Jalo Precoce (2.32 g) and SEA 5 (3.07 g)(Table 6).
The genotypes were classified and graphically depicted according to their mean yield performances for both levels into the classes: Efficient and Responsive; Efficient and Non-Responsive; Inefficient and Responsive; and
Inefficient and Non-Responsive (Figure 2). Seven genotypes were classified as Efficient and Responsive, whose performances were above the average, at both levels, namely: IAC Formoso, G 2333, IAC Carioca Tybatã, IAPAR 81, IAC Imperador, BRS Esplendor and IPR Tangará. Silva et al. (2014) observed similar results in nutrient solution, by studying the same genotypes according to their response to P use efficiency, and classified five genotypes as Efficient and Responsive:G 2333, IAC Carioca Tybatã, IAPAR 81, IAC Imperador and Carioca Comum, i.e. four of these showed results in common. It should be emphasized that the genotype BAT 477, classified as Efficient and Non-Responsive, besides presenting a good productive performance in the plots with restrictive level of P, demonstrated better performance regarding the root system traits.
Oliveira et al. (2012) classified 19 bean genotypes in Red-Yellow Distrophic Oxisol, with low P content, fertilized with 20 and 120 kg P2O5, and found variability between genotypes, also identifying five of these as Efficient and Responsive, namely IAC Una, IPR Saracura, IPR Juriti, IAC Centauro and IPR Corujinha.
When comparing the relative classification held in the soil and in hydroponics (Silva et al. 2014), 12 genotypes maintained the same classification in both conditions. In addition, genotypes classified as Efficient and Responsive
Yield (g per plant)
Low P
Hig
h P
IR ER13
1117
18
1516
12
INR ENR
14
20 10
191
5
42
7
9
2.0
3
2.5 3.0 3.5 4.0 4.5 5.0
3
8 64
5
6
7
Figure 2. Yield performance of 20 bean genotypes as for the P use effi ciency, classifi ed into four categories: IR = Ineffi cient and Responsive; INR = Ineffi cient and Non-Responsive; ER = Effi cient and Responsive; ENR = Effi cient and Non-Responsive.
The x-axis is represented by grain yield values in the restrictive level of P and the y-axis, by grain yield values in the control level of P.

161Bragantia, Campinas, v. 75, n. 2, p.152-163, 2016
Phosphorus use efficiency in common bean genotypes
in the soil: IAC Carioca Tybatã, IAC Imperador, IAPAR 81 and G 2333, respectively, had the highest percentage increase compared to the mean value in the restrictive condition of P: 39.61; 13.20; 33.99 and 42.98%; in the P restrictive condition, in hydroponics, there were increases of 18.18; 31.02; 42.04 and 1.11% (Table 8).
The genotypes IAC Diplomata, SEA 5, BRS Estilo, Jalo Precoce and DOR 364 were classified, in both growing conditions, as: Inefficient and Non-Responsive, with reductions in grain yield, in relation to the mean values of all treatments; in the restrictive condition of P in soil, reductions were of −18.26; −35.11; −1.69; −1.85 and −10.39%, as well as in hydroponics, with reductions of −32.74; −1.20; −2.10; −11.31 and −26.87% (Table 8).
The results of the assessment of 20 bean genotypes in the soil were consistent and similar to the classification in
hydroponics (Silva et al. 2014). Nevertheless, there was less experimental control in this situation, since the dynamics of P in the interaction with the soil can be influenced with respect to chemical, physical and biological aspects, such as pH, adsorption processes, texture and clay content, microorganisms and other soil factors, changing the dynamics and the availability of the nutrient to the plant.
cOnclUsiOn
P levels were efficient in distinguishing cultivars, resulting in significant differences in plant development and agronomic traits.
It was possible to classify the genotypes considering the P use efficiency in Red Eutrophic Oxisol.
genotypes
red eutrophic Oxisol Hydroponics (silva et al. 2014)
low P High P relative classification
low P High P relative classification (%) (%)
1 - IAC Alvorada –10.39 20.39 IR –5.23 –11.03 IR
2 - IAC Carioca Tybatã 39.61 4.94 ER 18.18 38.32 ER
3 - IAC Diplomata –18.26 –23.66 INR –32.74 –69.00 INR
4 - IAC Formoso 45.22 7.93 ER 0.40 0.85 ENR
5 - IAC Imperador 13.20 40.68 ER 31.02 65.36 ER
6 - IPR Uirapuru –3.93 –13.28 INR –1.51 –3.17 IR
7 - BAT 477 23.31 –16.51 ENR –22.77 –47.98 INR
8 - SEA 5 –35.11 –11.44 INR –1.20 –2.53 INR
9 - Carioca Comum –0.84 –37.50 INR 22.61 47.65 ER
10 - IAPAR 81 33.99 6.32 ER 42.04 88.59 ER
11 - BRS Pontal –23.03 13.70 IR –10.75 –22.65 IR
12 - BRS Estilo –1.69 –14.44 INR –2.10 –4.42 INR
13 - Pérola –11.80 61.21 IR –14.97 –31.54 IR
14 - IPR Tangará 5.90 22.00 ER 12.76 26.88 ENR
15 - Diamante Negro –52.81 –32.89 INR 7.18 15.13 ENR
16 - Jalo Precoce –41.85 –40.27 INR –11.31 –23.83 INR
17 - G 4000 –5.06 7.47 IR –10.37 –21.85 INR
18 - DOR 364 –10.39 –13.51 INR –26.87 –56.62 INR
19 - G 2333 42.98 15.77 ER 1.11 2.34 ER
20 - BRS Esplendor 10.39 3.09 ER 4.55 9.59 ENR
Mean 3.56 4.33 28.95 47.45
table 8. Grain yield of 20 bean genotypes, grown in Red Eutrophic Oxisol with application of two levels of P, 45 and 90 kg∙ha-1 of P2O5 and, in hydroponic system considered the application of 4 and 8 mg∙L–1 P. Productive percentage increased compared to the averages within each dose and cultivation condition and relative ranking as the use of P.
IR = Inefficient and Responsive; INR = Inefficient and Non-Responsive; ER = Efficient and Responsive; ENR = Efficient and Non-Responsive.

Bragantia, Campinas, v. 75, n. 2, p.152-163, 2016162
D.A. Silva et al.
The genotypes IAC Formoso; G 2333; IAC Carioca Tybatã; IAPAR 81; IAC Imperador; BRS Esplendor and IPR Tangará showed the best productive performances in both fertilization conditions, being classified as Efficient and Responsive.
acKnOWledgeMents
To Fundação de Amparo à Pesquisa do Estado de São Paulo (FAPESP) for financial support and scholarship granted.
Ambrosano, E. J., Wutke, E. D., Bulisani, E. A. and Cantarela, H.
(1997). Leguminosas e oleaginosas. In B. van Raij, H. Cantarella, J. A.
Quaggio and A. M. C. Furlani (Eds.), Recomendações de adubação
e calagem para o Estado de São Paulo. 2 ed. rev. atual. Campinas:
Instituto Agronômico/Fundação IAC (Boletim Técnico, 100).
Araújo, A. P., Teixeira, M. G. and Almeida, D. J. (2000). Growth and yield of common bean cultivars at two soil
phosphorus levels under biological nitrogen fixation. Pesquisa
Agropecuária Brasileira, 35, 809-817. http://dx.doi.org/10.1590/
S0100-204X2000000400019.
Beebe, S., Rao, I. M., Mukankusi, C. and Buruchara, R. (2012).
Improving resource use efficiency and reducing risk of common
bean production in Africa, Latin America and the Caribbean. In
C. Hershey (Ed.), Issues in tropical agriculture. I. Eco-efficiency:
from vision to reality. Cali: CIAT.
Graham, M. A., Ramírez, M., Valdés-López, O., Lara, M., Tesfaye,
M., Vance, C. P. and Hernandez, G. (2006). Identification of
candidate phosphorus stress induced genes in Phaseolus
vulgaris through clustering analysis across several plant
species. Functional Plant Biology, 33, 789-797. http://dx.doi.
org/10.1071/FP06101.
Hernández-Domíguez, E. E., Valencia-Turcotte, L. G. and
Rodríguez-Sotres, R. (2012). Changes in expression of soluble
inorganic pyrophosphatases of Phaseolus vulgaris under
phosphate starvation. Plant Science, 187, 39-48. http://dx.doi.
org/10.1016/j.plantsci.2012.01.009.
Kirkby, E. A. and Johnston, A. E. (2008). Soil and fertilizer
phosphorus in relation to crop nutrition. In P. J. White and J.
P. Hammond (Eds.), The ecophysiology of plant-phosphorus
interactions (p. 177-223). Dordrecht: Springer.
López-Bucio, J., Cruz-Ramírez, A. and Herrera-Estrella, L. (2003).
The role of nutrient availability in regulating root architecture.
Current Opinion in Plant Biology, 6, 280-287. http://dx.doi.
org/10.1016/S1369-5266(03)00035-9.
reFerences
Lynch, J. P. and Brown, K. M. (2008). Root strategies for phosphorus
acquisition low soil p availability is a primary constraint. In P. J.
White and J. P. Hammond (Eds.), The ecophysiology of plant-
phosphorus interactions (p. 83-116). Dordrecht: Springer.
Malavolta, E., Vitti, G. C. and Oliveira, S. A. (1989). Avaliação do
estado nutricional das plantas: princípios e aplicações. Piracicaba:
Associação Brasileira para Pesquisa da Potassa e do Fosfato.
Malavolta, E. (2006). Manual de nutrição mineral de plantas.
São Paulo: Editora Agronômica Ceres.
Oliveira, T. C., Silva, J., Salgado, F. H. M., Sousa, A. S. and
Fidelis, R. R. (2012). Eficiência e resposta à aplicação de
fósforo em feijão comum em solos de cerrado. Revista Verde
de Agroecologia e Desenvolvimento Sustentável, 7, 16-24.
Raposo, R. W. C., Muraoka, T., Basso, L. C., Lavres Junior, J.
and Franzini, V. I. (2004). Acid phosphatase activity and leaf
phosphorus content in soybean cultivars. Scientia Agricola, 61,
439-445. http://dx.doi.org/10.1590/S0103-90162004000400014.
Santos, J. Z. L. (2008). Adubação fosfatada, frações de fósforo e
resposta do feijoeiro, em latossolos de cerrado, com diferentes
textura, mineralogia e histórico de uso (PhD thesis). Lavras:
Universidade Federal de Lavras.
Santos, J. Z. L., Furtini Neto, A. E., Resende, A. V., Carneiro, L. F.,
Curi, N. and Moretii, B. S. (2011). Resposta do feijoeiro à adubação
fosfatada em solos de cerrado com diferentes históricos de uso.
Revista Brasileira de Ciência do Solo, 35, 193-202.
Schröder, J. J., Smit, A. L., Cordell, D. and Rosemarin, A. (2011).
Improved phosphorus use efficiency in agriculture: a key
requirement for its sustainable use. Chemosphere, 84, 822-
831. http://dx.doi.org/10.1016/j.chemosphere.2011.01.065.
Silva, D. A., Esteves, J. A. F , Messias, U., Teixeira, A., Ribeiro, J.
G. G., Chiorato, A. F. and Carbonell, S. A. M. (2014). Efficiency
in the use of phosphorus by common bean genotypes. Scientia
Agricicola, 71, 232-239.

163Bragantia, Campinas, v. 75, n. 2, p.152-163, 2016
Phosphorus use efficiency in common bean genotypes
Torres Netto, A., Campostrini, E., Oliveira, J. G. and Smith, R.
E. B. (2005). Photosynthetic pigments, nitrogen, chlorophyll a
fluorescence and SPAD-502 readings in coffee leaves. Scientia
Horticulturae, 104, 199-209.
Trindade, R. S. and Araújo, A. P. (2014). Variability of root traits
in common bean genotypes at different levels of phosphorus
supply and ontogenetic stages. Revista Brasileira de Ciência do
Solo, 38, 1170-1180.
Valladares, G. S., Pereira, M. G. and Anjos, L. H. C. (2003).
Adsorção de fósforo em solos de argi la de at ividade
baixa. Bragantia, 62, 111-118. http://dx.doi.org/10.1590/
S0006-87052003000100014.
van Raij, B., Cantarella, H., Quaggio, J. A. and Furlani, A. M. C. (1997).
Recomendações de adubação e calagem para o Estado de São
Paulo. 2 ed. rev. atual. Campinas: Instituto Agronômico/Fundação
IAC (Boletim Técnico, 100).
White, P. J. and Hammond, J. P. (2008). Phosphorus Nutrition
Of Terrestrial Plants. In P. J. White and J. P. Hammond (Eds.),
The ecophysiology of plant-phosphorus interactions. (p. 51-81).
Dordrecht: Springer. http://dx.doi.org/10.1007/978-1-4020-8435-5.
Zucareli, C., Prando, A. M., Ramos Junior, E. U. and Nakagawa,
J. (2011). Fósforo na produtividade e qualidade de sementes
de feijão Carioca Precoce cultivado no período das águas.
Revista Ciência Agronômica, 42, 32-38. http://dx.doi.org/10.1590/
S1806-66902011000100005.