evaluation of drainage layer alternatives for proposed landfill … · 1997. 6. 17. · 1...
TRANSCRIPT

1
Evaluation of Drainage Layer Alternatives for Proposed Landfill Liner at the E.W. Brown
Generating Station
Nicholas G. Schmitt, PE1, and M. Brian Cole, PE2
1Senior Principal Engineer, AMEC Environment and Infrastructure, Louisville, KY 2Senior Engineer, AMEC Environment and Infrastructure, Louisville, KY KEYWORDS: Fly Ash, Bottom Ash, Gypsum, Geocomposite, Landfill Background
After the client requested an evaluation of drainage layer alternatives of their proposed landfill liner, AMEC proposed a geocomposite prototype specially designed for use with Coal Combustion Products (CCPs). Testing was conducted on samples of this prototype and the plant's CCPs. laboratory testing was performed and results were favorable, however the project team felt a field test would provide additional insight.
In order to conduct a prolonged evaluation of drainage layer combinations, a test pad was constructed utilizing plant-specific CCPs in three discrete cells composed of the following CCPs and drainage layer over a geomembrane:
Gypsum over bottom ash (bottom ash cell);
Gypsum over fly ash over geocomposite (gypsum/fly ash cell); and
Gypsum directly above geocomposite (gypsum only cell).
A water truck was used to simulate rainfall with daily water doses into the test pad. Water doses were applied and flow measurements from the system were observed at about the same time each day. Weekly effluent samples were tested for Total Suspended Solids (TSS), pH, specific conductivity and Dissolved Oxygen (DO).
TSS results for the bottom ash cell were significantly higher than the other two cells. The pH of the bottom ash cell dropped below 4 and the sump stopped discharging altogether. TSS results for the gypsum-only cell were the lowest, its flow stayed high and its sump remained the clearest. When the project was over, geocomposite was sampled from beneath plywood to confirm that it was not clogged.

2
Project Description AMEC designed a 106-acre landfill on top of the Main Ash Pond at E.W. Brown Generating Station. The facility permit is pending. This landfill will provide a storage life in excess of 20 years. The depth of ash within the existing pond varies from 0 to 140 feet. Relevant elevations are as follows:
Toe of Dam Elevation ~760 feet;
Current Dike Crest Elevation 900 feet; and
Proposed Top of Landfill Elevation 970 feet.
Drainage Layer Design
The initial permit application submittal included an 18-inch aggregate material for the drainage layer, expected to consist of either bottom ash generated by the E.W. Brown Station or a sand or river gravel provided from an off-site borrow source. Subsequent to the initial permit application submittal, the availability of sufficient quantity of quality bottom ash became a concern. Permeability testing of bottom ash from an existing on-site stockpile were unsatisfactory (likely due to presence of fly ash and gypsum), with results several orders of magnitude less than the 1x10⁻² cm/sec required by regulations(401 KAR 48:080). In addition, the generation of new bottom ash material (only approximately 7.3% of the total CCP generated at the station) would not provide sufficient quantity of material required for the drainage layer with the existing stockpiled material determined to be unsuitable. The cost and availability of a suitable off-site aggregate material of sufficient quantity was also an issue.
As reported by the Geosynthetic Research Institute, fly ash has been known to present an impediment to drainage systems for some time.1 It has a similar grain size to silt and is also cohesionless , exhibiting the same problematic characteristics as silt (piping, etc.) This is also true of gypsum. There were also site-specific concerns over the facility’s gypsum stemming from its use as fill during a previous project, where a need to encapsulate the material in clay was quickly established in order to prevent fines from washing away.
A geosynthetic manufacturer had developed a geocomposite prototype specially designed for use with CCPs. The upper geotextile layer consists of a non-woven and a woven geotextile needle-punched together. A standard geocomposite had been tested in a research project conducted at the Ohio State University in conjunction with American Electric and Power (AEP), where it was established that CCPs alone yielded higher hydraulic conductivities than the CCPs combined with the geocomposite. Field testing exhibited lower hydraulic conductivities than values measured in the laboratory.1
An additional study at Ohio State University with a geocomposite prototype, specially designed for use with CCPs. The outcome of this study was more favorable. However, the CCP characteristics at the AEP plant were considerably different than the CCPs at EW Brown, and some of the data were inconclusive in the second Ohio State study. So

3
laboratory testing was conducted on a new geocomposite prototype with gypsum and fly ash samples obtained at the E.W. Brown Generating Station.
Preliminary Laboratory Results
The geocomposite flow characteristics were tested with the plant’s gypsum and fly ash by the Austin, Texas laboratory of TRI Environmental Inc. for hydraulic conductivity ratio (HCR) testing per ASTM D 5567 and transmissivity testing per ASTM 4716. As illustrated in Figure 1, the HCR value stabilized within two pore volumes with no further decrease. The geotextile forms a stable filter indicating no further decrease in hydraulic conductivity with time. Test conditions were selected to reflect the proposed landfill configuration: gradient = 0.02, time = 100 hours, boundary conditions = CCP/GDL/GM, pressure = 10,000 psf. Transmissivity results ranged between 4.3x10⁻³ to 6.7x10⁻³ m2/sec.
Figure 1 – HCR Results for Geocomposite with Plant CCPs
Initial laboratory results were favorable and the subsequent HELP model outputs were acceptable. However, AMEC and the Owner wanted field confirmation with plant-specific materials. The facility also wanted to evaluate the option of using bottom ash generated at the plant as the drainage layer, which could constitute a beneficial reuse that would preserve capacity in the Auxiliary Ash Pond. Therefore an on-site test pad was proposed within the footprint of the Main Ash Pond, where the landfill was being proposed.

4
Test Pad Design
The field evaluation of various alternatives for drainage layers involved constructing a test pad in the field to observe performance using plant gypsum, fly ash and bottom ash. The geocomposite prototype consisted of a 300-mil-thick high density polyethylene (HDPE) geonet heat laminated with a non-woven geotextile on the bottom side and a composite geotextile on the top side. This composite geotextile serves as a filter and separator, while the geonet core provides a liquid flow medium. The composite fabric had been previously tested and was confirmed to be effective for filtering CCP. The upper filter geotextile appears to provide adequate filtration without clogging or piping of fine coal ash or gypsum particles.
The evaluation of the drainage layer options included constructing a test pad within the existing main pond to observe performance of three different configurations; two of which included the use of the geocomposite drainage layer and one using bottom ash for the drainage layer. Each of the cells of the tests pad were constructed approximately 40 feet long by 20 feet wide with the following configuration from the bottom to top, as illustrated in Figure 2:
1) South Cell – 60-mil LLDPE liner, geocomposite prototype, 24 inches of CCP gypsum protective cover.
2) Middle Cell - 60-mil LLDPE liner, geocomposite prototype, 12 inches of CCP fly ash, 24 inches of CCP gypsum protective cover.
3) North Cell - 60-mil LLDPE liner, 18-inch thick bottom ash drainage layer, 24-inches of CCP gypsum protective cover.
Figure 2 – Cross Sections of Each Test Pad Cell
Though the gradations of the plant’s gypsum and fly ash were considerably different from each other (as illustrated in Figure 3), both materials had a similar permeability of 1x10⁻⁶ cm/sec.

5
Fly Ash Gradation, k = 10-6
cm/sec Gypsum Gradation, k = 10-6
cm/sec
Figure 3 – Differing CCP gradations, similar permeabilities
Each test pad cell was designed with a bottom shape and slope to match the proposed landfill liner grade, with 2.25% side slopes draining to a central valley. The central valley of each cell drained to a separate sump where the discharge from each cell was sampled over a two-month period. Design diagrams are depicted in Figures 4-6.

6
Figure 4 – Test Pad Plan

7
Figure 5 – Test Pad Profile (Middle Cell)
Figure 6 – Test Pad Cross Section

8
Test Pad Construction
An AMEC technician oversaw construction of the test pad and placement of the CCP
materials. After the subgrade work was completed, geomembrane was installed (see
Figure 7). The geocomposite was then installed in accordance with the landfill
specification, with the bottom geotextile of adjacent panels lapped, the geonet tied off,
and the upper geotextile stitched together with a prayer seam (see Figure 8). Before
the CCPs were spread over the geocomposite, plywood panels were placed over the
geocomposite at the lowest central point inside the South and Middle Cells, just west of
the west toe of the Divider Berm. When the evaluation period was over, this allowed
AMEC to obtain geocomposite samples to check for signs of horizontal solids migration
within the geocomposite. Samples were also obtained outside of the plywood footprint.
The North Cell did not contain geocomposite, but rather an 18-inch layer of bottom ash
deployed directly over the geomembrane. This was the “control cell”, designed for the
purpose of evaluating compatibility of the facility’s gypsum with a drainage layer
constructed from its bottom ash. AMEC obtained a sample of the bottom ash to confirm
that no more than 10% passed a # 100 sieve and no more than 5% passed a # 200
sieve. A layer of fly ash was added over the geocomposite in the Middle Cell, to see if it
would provide a more favorable protective cover layer (see Figure 9).
As shown in Figure 10, two feet of gypsum was then placed in each cell, placed in two
lifts: an 18-inch layer beneath a 6-inch top layer. This upper layer of gypsum was
compacted as necessary to achieve a minimum in-place dry density of 90% Standard
Proctor. CCP material was spread over the liner system with an LGP bulldozer. When
the CCP’s were placed, there was no exposed geocomposite showing, except for an 18
inch wide piece hanging down on the west side of the sump (South Cell and Middle Cell
only). Gypsum was used to seal off the west side of the Divider Berm, with a 12-inch
deep trench filled halfway with # 2 crushed stone running down the middle of the berm
to divert run-off that might happen to flow across from the gypsum in the event of a cell
overflow (this never occurred). The design incorporated 18 inches of standing water in
the sumps, where gypsum or ash that “piped” through the drainage layer could
accumulate. Geotextile sock filters and # 57 crushed stone were placed around the
inlet of each 8-inch pipe spillway, to minimize the amount of gypsum or ash fines that
migrated out via the spillway. Ultimately, these filters were removed when flow rates
declined in a couple of the cells. Each spillway pipe included a standard boot seal
where it penetrated the geomembrane.
After the CCP’s were placed, the contractor placed a 6 to 12 inch layer of # 2 crushed
stone armor on the inner face on the west berm, extending this approximately 6 feet
past the toe of the berm. This rock was intended to minimize scour of the gypsum while
water was being sprayed into the cells.

9
Figure 7- Geomembrane Installation Figure 8 – Geocomposite Installation
Figure 9 – Ash Placement Figure 10 – Gypsum Placement
Test Pad Evaluation
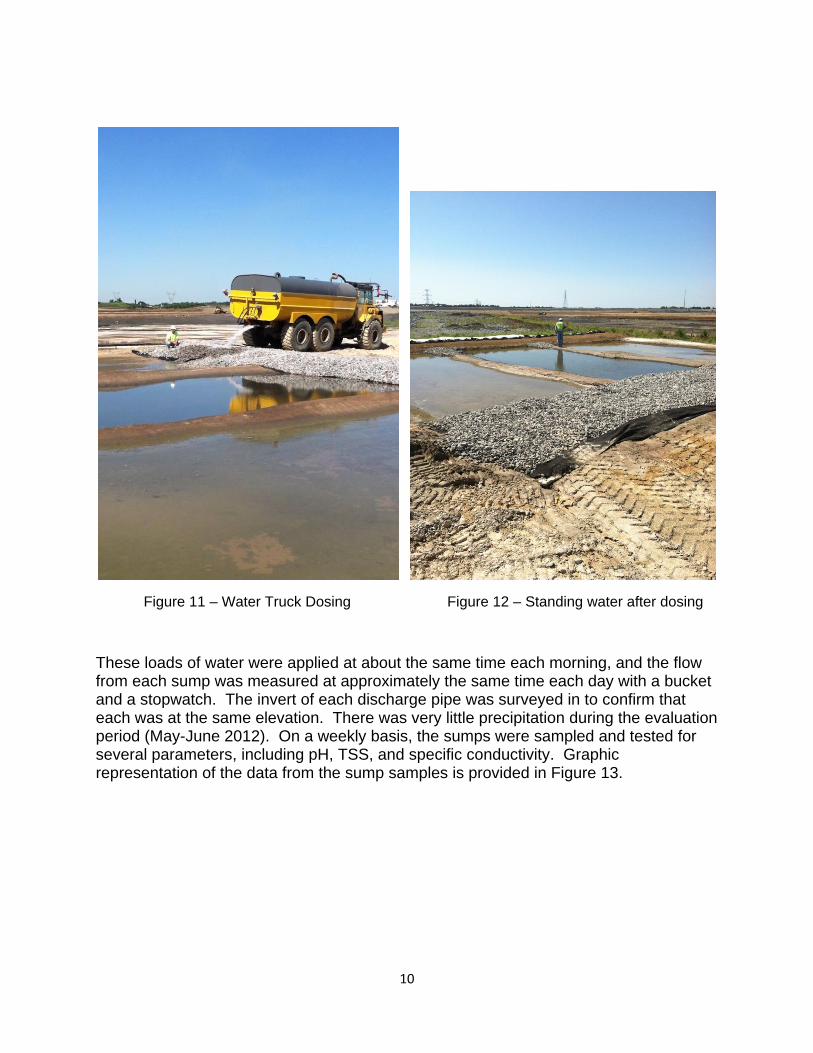
During the two-month test pad evaluation period, two full 4000-gallon loads from a water truck were applied on a daily basis, as shown in Figure 11. More water was applied in the beginning in order to achieve material saturation (accounting for the fact that the permeability of both the fly ash and the gypsum are 1x10⁻⁶ cm/sec. Generally, there would still be standing water over the three cells when the crew went home for the day (see Figure 12), and it seeped into the underlying CCPs by the time they arrived the next morning. Water never topped over any of the perimeter berms surrounding the test pad.
10
Figure 11 – Water Truck Dosing Figure 12 – Standing water after dosing
These loads of water were applied at about the same time each morning, and the flow from each sump was measured at approximately the same time each day with a bucket and a stopwatch. The invert of each discharge pipe was surveyed in to confirm that each was at the same elevation. There was very little precipitation during the evaluation period (May-June 2012). On a weekly basis, the sumps were sampled and tested for several parameters, including pH, TSS, and specific conductivity. Graphic representation of the data from the sump samples is provided in Figure 13.
11
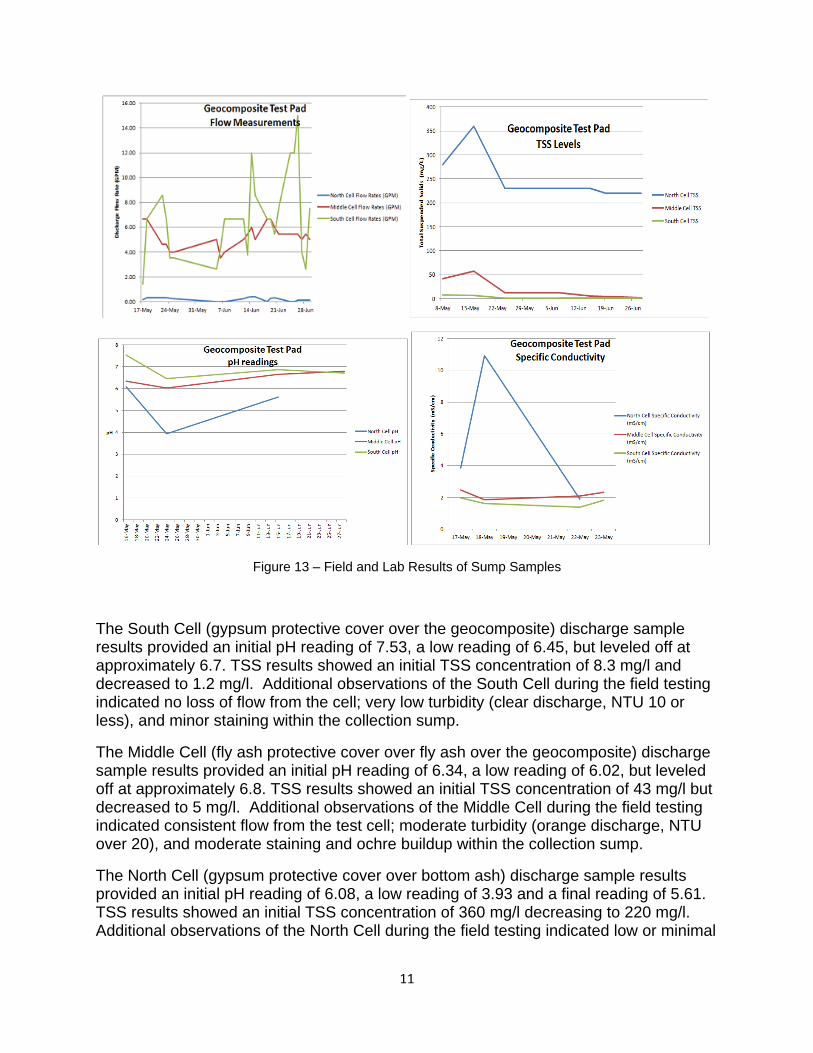
Figure 13 – Field and Lab Results of Sump Samples
The South Cell (gypsum protective cover over the geocomposite) discharge sample results provided an initial pH reading of 7.53, a low reading of 6.45, but leveled off at approximately 6.7. TSS results showed an initial TSS concentration of 8.3 mg/l and decreased to 1.2 mg/l. Additional observations of the South Cell during the field testing indicated no loss of flow from the cell; very low turbidity (clear discharge, NTU 10 or less), and minor staining within the collection sump.
The Middle Cell (fly ash protective cover over fly ash over the geocomposite) discharge sample results provided an initial pH reading of 6.34, a low reading of 6.02, but leveled off at approximately 6.8. TSS results showed an initial TSS concentration of 43 mg/l but decreased to 5 mg/l. Additional observations of the Middle Cell during the field testing indicated consistent flow from the test cell; moderate turbidity (orange discharge, NTU over 20), and moderate staining and ochre buildup within the collection sump.
The North Cell (gypsum protective cover over bottom ash) discharge sample results provided an initial pH reading of 6.08, a low reading of 3.93 and a final reading of 5.61. TSS results showed an initial TSS concentration of 360 mg/l decreasing to 220 mg/l. Additional observations of the North Cell during the field testing indicated low or minimal

12
flow; high turbidity (orange discharge, NTU of 180), and staining within the collection sump.
The test pad cells using the geocomposite (South and Middle) provided the best results, with the South Cell constructed with the gypsum protective cover and geocomposite drainage layer providing the best overall results.
Figure 14 – Early sump status Figure 15 – Later sump status
Final Sampling and Sump Evaluation
When the test pad evaluation period was over, the sumps were pumped down and observed for signs of accumulated sediment. Very little sediment was observed in the South Cell. Some orange sediment had accumulated in the other two cells. Samples of geocomposite were exhumed from the beneath the test pad CCPs in the south and middle cells. The geocomposite samples were sent to TRI Environmental Inc. laboratories and tested under the conditions corresponding to the proposed landfill design, which were the same conditions used in the previous laboratory analysis. The transmissivities ranged from 4.6x10⁻³ to 4.9x10⁻³ m2/sec, reflecting no negative impact on transmissivity. Before and after values are within material variability which is common at those low gradients. The geocomposite samples cut from beneath the gypsum were remarkably clean, as illustrated in Figure 16.

13
Figure 16 – Geocomposite investigation
Geocomposite Hydraulic Conductivity
Following completion of the field testing of the test pads, sections of geocomposite in the South and Middle Cells were uncovered and the top geotextile cut to expose the geonet to observe for solids intrusion. Although some minor orange staining was observed in the geocomposite from the Middle Cell, no CCP sediment intrusion was observed in either geocomposite sample. In addition to the visual observations, samples were cut from the installed geocomposite from both pads and sent to a laboratory for hydraulic conductivity testing using ASTM D 4716 method for a duration of 120 hours. The laboratory testing was conducted using the same project specific setups and materials used for construction of the test pads. The laboratory hydraulic conductivity testing was conducted using 5,000 psf and 10,000 psf confining pressures.
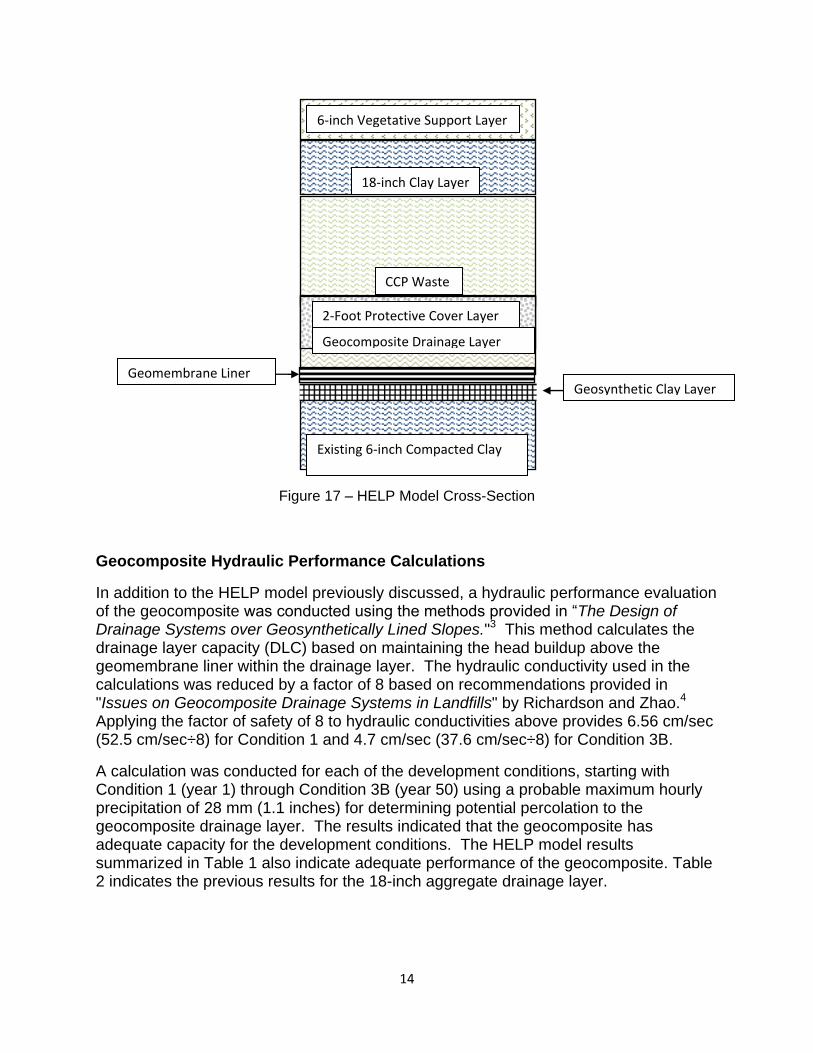
The hydraulic conductivity test results were used in the geocomposite hydraulic performance calculations (see below) as well as the HELP modeling. The hydraulic conductivity test results were plotted versus time and a trend line equation established to allow calculation a hydraulic conductivity associated with the time period for each of the development conditions. This provided a hydraulic conductivity range with a gypsum protective cover of 52.5 cm/sec at the end of year 1 under Condition 1 (5,000 psf pressure) to 37.6 cm/sec for year 50 at the end of Condition 3B (10,000 psf pressure). A HELP model section for the facility’s final cap configuration is depicted in Figure 17.
14
Figure 17 – HELP Model Cross-Section
Geocomposite Hydraulic Performance Calculations
In addition to the HELP model previously discussed, a hydraulic performance evaluation of the geocomposite was conducted using the methods provided in “The Design of Drainage Systems over Geosynthetically Lined Slopes."3 This method calculates the drainage layer capacity (DLC) based on maintaining the head buildup above the geomembrane liner within the drainage layer. The hydraulic conductivity used in the calculations was reduced by a factor of 8 based on recommendations provided in "Issues on Geocomposite Drainage Systems in Landfills" by Richardson and Zhao.4 Applying the factor of safety of 8 to hydraulic conductivities above provides 6.56 cm/sec (52.5 cm/sec÷8) for Condition 1 and 4.7 cm/sec (37.6 cm/sec÷8) for Condition 3B.
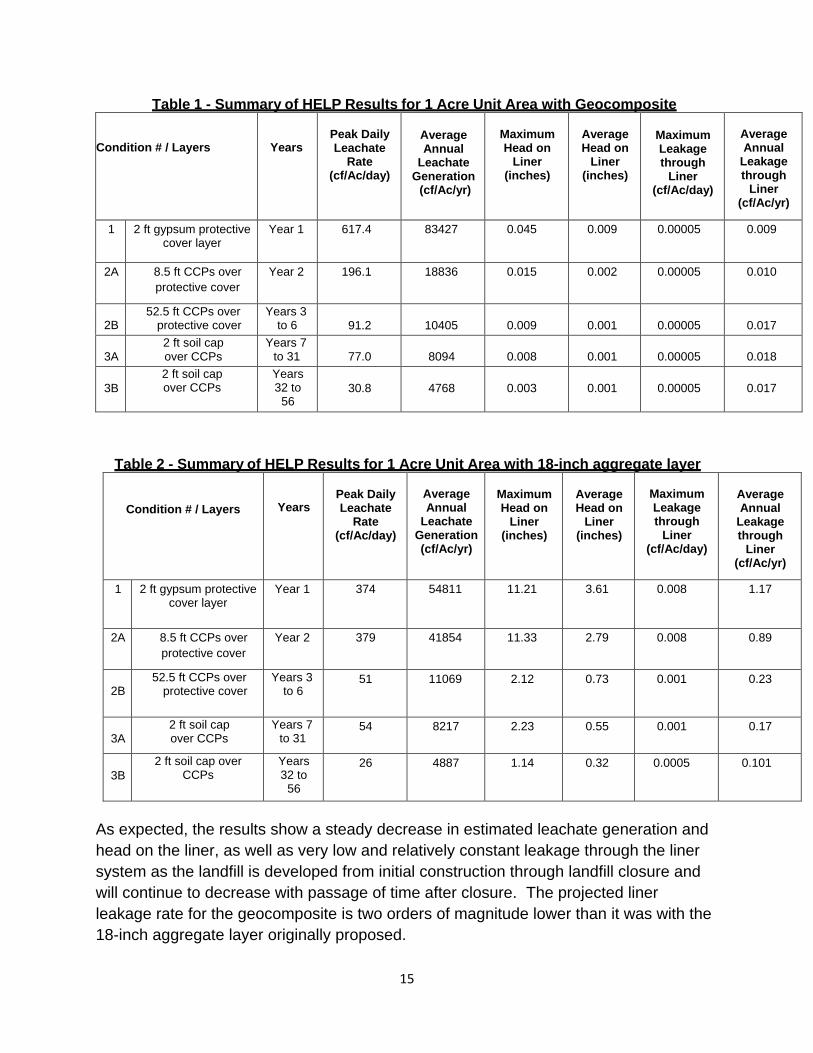
A calculation was conducted for each of the development conditions, starting with Condition 1 (year 1) through Condition 3B (year 50) using a probable maximum hourly precipitation of 28 mm (1.1 inches) for determining potential percolation to the geocomposite drainage layer. The results indicated that the geocomposite has adequate capacity for the development conditions. The HELP model results summarized in Table 1 also indicate adequate performance of the geocomposite. Table 2 indicates the previous results for the 18-inch aggregate drainage layer.
18-inch Clay Layer
Cushion Layer
6-inch Vegetative Support Layer
CCP Waste
2-Foot Protective Cover Layer
Geocomposite Drainage Layer
Geomembrane Liner
Existing 6-inch Compacted Clay
Subgrade Layer
Geosynthetic Clay Layer
LayLiner
15
Table 1 - Summary of HELP Results for 1 Acre Unit Area with Geocomposite
Condition # / Layers
Years
Peak Daily Leachate
Rate (cf/Ac/day)
Average Annual
Leachate Generation (cf/Ac/yr)
Maximum Head on
Liner (inches)
Average Head on
Liner (inches)
Maximum Leakage through
Liner (cf/Ac/day)
Average Annual
Leakage through
Liner (cf/Ac/yr)
1 2 ft gypsum protective cover layer
Year 1 617.4 83427 0.045 0.009 0.00005 0.009
2A 8.5 ft CCPs over
protective cover
Year 2 196.1 18836 0.015 0.002 0.00005 0.010
2B
52.5 ft CCPs over protective cover
Years 3 to 6
91.2
10405
0.009
0.001
0.00005
0.017
3A
2 ft soil cap over CCPs
Years 7 to 31
77.0
8094
0.008
0.001
0.00005
0.018
3B
2 ft soil cap over CCPs
Years 32 to
56
30.8
4768
0.003
0.001
0.00005
0.017
Table 2 - Summary of HELP Results for 1 Acre Unit Area with 18-inch aggregate layer
Condition # / Layers
Years
Peak Daily Leachate
Rate (cf/Ac/day)
Average Annual
Leachate Generation (cf/Ac/yr)
Maximum Head on
Liner (inches)
Average Head on
Liner (inches)
Maximum Leakage through
Liner (cf/Ac/day)
Average Annual
Leakage through
Liner (cf/Ac/yr)
1 2 ft gypsum protective cover layer
Year 1 374 54811 11.21 3.61 0.008 1.17
2A 8.5 ft CCPs over
protective cover
Year 2 379 41854 11.33 2.79 0.008 0.89
2B
52.5 ft CCPs over protective cover
Years 3 to 6
51 11069 2.12 0.73 0.001 0.23
3A
2 ft soil cap over CCPs
Years 7 to 31
54 8217 2.23 0.55 0.001 0.17
3B
2 ft soil cap over CCPs
Years 32 to
56
26 4887 1.14 0.32 0.0005 0.101
As expected, the results show a steady decrease in estimated leachate generation and
head on the liner, as well as very low and relatively constant leakage through the liner
system as the landfill is developed from initial construction through landfill closure and
will continue to decrease with passage of time after closure. The projected liner
leakage rate for the geocomposite is two orders of magnitude lower than it was with the
18-inch aggregate layer originally proposed.
16
Conclusion
Based on the results of the field test pad, the results of the laboratory testing, the geocomposite hydraulic performance calculations, as well as the HELP model results, a drainage layer consisting of a geocomposite is now being proposed for the landfill. The Protective Cover Layer will consist of 2-foot minimum layer of gypsum placed immediately over the installed geocomposite drainage layer. The Protective Cover shall be placed as soon as possible following receipt of approval. Use of geocomposite instead of the 18-inch aggregate layer initially proposed will save the Owner an estimated $ 5.6 million in capital expense and 250,000 cubic yards of storage capacity.
References [1] Koerner, R.M. and Koerner G.R., Geotextile Filter Failures: Examples and Lessons Learned, Proc. Sound Geotechnical Research to Practice, A.W. Stuedlein and B.R. Christopher, Eds., Geotechnical Special Publication Honoring Robert D. Holtz, GeoInstitute of ASCE, March, 2013. [2] Semach, Alexis Caryn, Geotextiles for use in Drainage Systems in Coal Combustion Product Landfills, Masters Thesis for Graduate Program in Civil Engineering, The Ohio State University, 2010. [3] Soong, T.Y. and Koerner, R.M., The Design of Drainage Systems over Geosynthetically Lined Slopes", Geosynthetic Research Institute (GRI) Report No. 19, June 17, 1997. [4] Richardson, G.N. and Zhao, A., Issues on Geosynthetic Drainage Systems in Landfills, 1998. Acknowledgement The authors would like to thank GSE Environmental, who developed the geocomposite prototype and provided the geocomposite material for the test pad. The CoalDrain geocomposite product is no longer a prototype, but a stock item.