evaluation of early implementation of 30 hours free … · evaluation of early implementation of 30...
TRANSCRIPT

Evaluation of Early Implementation of 30 Hours Free Childcare Research report
July 2017
Gillian Paull – Frontier Economics Ivana La Valle – University of East London With Svetlana Speight and Hannah Jones (NatCen Social Research) and Clarissa White

2
Acknowledgments
The authors Gillian Paull is a Senior Associate at Frontier Economics and Ivana La Valle is a Research Consultant and Visiting Scholar at the University of East London. Svetlana Speight is a Research Director, Hannah Jones is a Senior Researcher at NatCen Social Research and Clarissa White is an Independent Researcher.
Acknowledgments First and foremost, the authors wish to thank the Local Authority staff in the early implementer and early innovator areas for their considerable contribution to the evaluation in participating in interviews, delivering data and providing feedback at presentations. We are also grateful to the providers and parents who gave their valuable time to participate in the evaluation surveys. In addition, the authors wish to thank Professor Eva Lloyd at the University of East London for her valuable advice throughout the project and other members of the evaluation team who contributed to the data collection and analysis including Brian Higgins, Allister Langlois and Kate Richards (Frontier Economics), Migle Aleksejunaite and Tom Chadwick (NatCen Social Research) and Chris Farrell. Finally, but not least, the authors would like to acknowledge the extremely efficient and supportive management of the project by Max Stanford at the Department for Education (DfE) and the support given by Rachel Murphy, the Early Years and School Census teams, and other colleagues at DfE.

3
Contents The authors 2
Acknowledgments 2
List of figures 6
List of tables 8
Executive Summary 12
Introduction 12
Findings 14
Limitations on learning from the evaluation 27
Conclusions 27
1. Introduction 29
2. Evaluation methodology 33
2.1 Overview of the evaluation 33
2.2 Collection of evidence 35
2.3 Report terminology, subgroup sample sizes and identification of LAs 42
3. Early implementation of 30 hours free childcare 43
3.1 Policy objectives and risks 43
3.2 Early implementation at the national level 48
3.3 Local models for early implementation 51
3.4 Local programme management arrangements 57
3.5 Early innovators 58
4. Were providers willing to deliver the extended hours? 61
4.1 Delivery during early implementation 61
4.2 Profile of providers delivering extended hours 63
4.3 Providers’ reactions to the policy 69

4
4.4 Supporting providers’ engagement 75
4.5 Summary and recommendations 79
5. Were providers able to deliver sufficient hours? 80
5.1 Sufficiency of delivery and potential for expansion 80
5.2 Impacts on other types of provision 86
5.3 Summary and recommendations 92
6. Did providers work in partnerships? 93
6.1 The development of partnerships during early implementation 93
6.2 Challenges to the further development of partnership working 96
6.3 Summary and recommendations 98
7. How flexible and free were the extended hours? 99
7.1 Opening times 99
7.2 Flexibility for parents 108
7.3 Additional fees and charges 113
7.4 Summary and recommendations 118
8. What was the financial impact for providers? 119
8.1 Financial impacts during early implementation 119
8.2 Summary and recommendations 126
9. Did parents take up places? 127
9.1 Profile of families using the extended hours 127
9.2 Engaging parents 131
9.3 Use of the extended hours among families with different needs 136
9.4 Summary and recommendations 144
10. How did the use of childcare change? 146
10.1 Hours of childcare 146

5
10.2 Mix of providers and shared care 153
10.3 Impacts of longer hours on children 156
10.4 Summary and recommendations 159
11. Did parental work change? 161
11.1 Change in parental work during early implementation 161
11.2 Direct measures to support parents to work 166
11.3 Summary 167
12. What other effects were there on families? 169
12.1 Additional impacts related to work 169
12.2 Impacts on family finances 170
12.3 Summary 171
13. What challenged and what supported implementation? 173
13.1 Implementation challenges and facilitators 173
13.2 Recommendations 177
14. Conclusions 179
14.1 How much can be learnt from early implementation? 179
14.2 Will the policy be a success? 180
Annex A: Additional evaluation methodology details 182
A.1 Preparation of the census data 182
A.2 Further details on the providers’ survey 183
A.3 Further details on the parents’ survey 184
Annex B: Selected tables disaggregated by LA 186
6
List of figures Figure 1: Types of providers delivering extended hours places ....................................... 15
Figure 2: Financial impacts on providers by provider type ............................................... 20
Figure 3: Impacts on childcare use across income levels ................................................ 23
Figure 4: Overview of the early implementation evaluation elements .............................. 34
Figure 5: Overview of the case study data collection ....................................................... 36
Figure 6: Early implementation policy objectives ............................................................. 44
Figure 7: Policy risks ........................................................................................................ 47
Figure 8: LA reasons for being involved in early implementation ..................................... 52
Figure 9: Early innovator themes and activities ............................................................... 59
Figure 10: Types of providers delivering extended hours places ..................................... 64
Figure 11: LA support for delivery of extended hours ...................................................... 75
Figure 12: Key messages to help recruit providers .......................................................... 78
Figure 13: Changes in occupancy due to the extended hours ......................................... 80
Figure 14: Increase in the use of staff to deliver the extended hours ............................... 81
Figure 15: Capacity to offer more places by provider type ............................................... 83
Figure 16: Impact on number of free entitlement three / four year olds ........................... 89
Figure 17: Impact on number of free entitlement two year olds ....................................... 89
Figure 18: Impact on number of children with only paid hours ......................................... 90
Figure 19: Impact on fees for paid hours ......................................................................... 91
Figure 20: Opening in school holidays ........................................................................... 104
Figure 21: Proportions using free entitlement and paid hours in school holidays .......... 105
Figure 22: Provider report of parental choice in using extended hours .......................... 109
Figure 23: Parent report of choice in using free entitlement hours ................................. 109
Figure 24: Provider report of change in flexibility for universal 15 hours entitlement ..... 110

7
Figure 25: Increases in charges by provider type .......................................................... 116
Figure 26: Changes in delivery cost due to the extended hours .................................... 120
Figure 27: Changes in hourly staff pay due to the extended hours ................................ 121
Figure 28: Changes in profits due to the extended hours .............................................. 121
Figure 29: Key messages to help recruit parents ........................................................... 135
Figure 30: Distribution of (adjusted) weekly extended hours ......................................... 148
Figure 31: Distribution of weekly total hours at free entitlement providers for children using extended hours .................................................................................................... 149
Figure 32: Distribution of weekly total hours for children using extended hours ............ 150
Figure 33: Impacts on childcare use across income levels ............................................ 152
Figure 34: Impacts on parental work across income levels ............................................ 165
Figure 35: Financial impacts across income levels ........................................................ 171

8
List of tables Table 1: Evaluation key questions 33
Table 2: Provider and parent survey statistics 40
Table 3: Provider types in the different data sources 41
Table 4: National level policy for early implementation 49
Table 5: Local context of LAs involved in early implementation 52
Table 6: Local models of delivery for the extended hours 54
Table 7: Funding rates during early implementation 55
Table 8: Local additional measures 57
Table 9: Usefulness of early innovator funding 60
Table 10: Numbers of extended hours places by LA 61
Table 11: Numbers of providers delivering extended hours by LA 62
Table 12: Numbers of extended hours places per provider by LA 63
Table 13: Types of providers delivering extended hours by LA 65
Table 14: Distribution of extended hours places across provider types by LA 66
Table 15: Proportions of free entitlement providers delivering extended hours by LA 67
Table 16: Child age profile of providers offering extended hours 68
Table 17: Size of providers offering extended hours 69
Table 18: Reasons providers are offering extended hours 70
Table 19: Reason did not increase number of staff 82
Table 20: Other free entitlement places for providers offering extended hours 87
Table 21: Changes in number of free entitlement places within providers 88
Table 22: Proportion of providers working in partnership 93
Table 23: New partnerships to deliver extended hours 94
Table 24: Weekly opening hours 100

9
Table 25: Annual opening weeks 101
Table 26: Opening times during the day 102
Table 27: Number of days attended by children 103
Table 28: Proportion using extended hours in school holidays by provider type 104
Table 29: Extensions to opening times 106
Table 30: Proportion of children with additional paid hours by provider type 113
Table 31: Payment of fees and additional charges for free entitlement providers by provider type 115
Table 32: Changes in delivery cost and profits due to the extended hours 125
Table 33: Profile of family structure by LA 128
Table 34: Profile of family socioeconomic status by LA 129
Table 35: Profile of family work patterns by LA 130
Table 36: Profile of parents’ weekly work hours 131
Table 37: When started using extended hours by LA 131
Table 38: How heard about the policy by LA 133
Table 39: Relative use of extended hours among children eligible for EYPP 138
Table 40: Relative use of extended hours among children with SEN 139
Table 41: Relative use of extended hours across ethnic groups 142
Table 42: Take-up of extended hours among families in rural areas 143
Table 43: Weekly childcare hours for children using extended hours by LA 147
Table 44: Weekly childcare hours for children using extended hours by provider type 147
Table 45: Change in formal childcare use since started using extended hours 151
Table 46: Perception of impact of extended hours on formal childcare use 151
Table 47: Use of multiple free entitlement providers and providers not delivering the free entitlement 154
Table 48: Change in provider 155

10
Table 49: Opinion on using multiple providers 155
Table 50: Perception of impact of extended hours on school readiness 157
Table 51: Appropriatenss of amount of time in care 157
Table 52: Change in mothers’ work hours 162
Table 53: Perception of impact of extended hours on mothers’ work 162
Table 54: Change in fathers’ work hours 163
Table 55: Increase in weekly hours for mothers and fathers 164
Table 56: Whether extended hours improved flexibility in work decisions 169
Table 57: Impact of extended hours on family finances 170
Table 58: Provider survey response rates by LA 184
Table 59: Parent survey response rates by LA 185
Table 60: Child age profile of providers offering extended hours by LA 186
Table 61: Size of providers offering extended hours by LA 186
Table 62: Reasons providers are offering extended hours by LA 187
Table 63: LA support for delivery of extended hours by LA 188
Table 64: Capacity to offer more places by LA 188
Table 65: Other free entitlement places for providers offering extended hours by LA 189
Table 66: Changes in numbers of free entitlement places within providers by LA 189
Table 67: Impact on free entitlement places for three / four year olds by LA 190
Table 68: Impact on free entitlement places for two year olds by LA 190
Table 69: Impact on paid places by LA 191
Table 70: Changes in fees by LA 191
Table 71: Number of days attended by children 192
Table 72: Proportion using extended hours in school holidays by LA 192
Table 73: Proportions using free entitlement and paid hours in school holidays by LA 193

11
Table 74: Provider report of parent choice in using extended hours by LA 193
Table 75: Parent report of parent choice in using free entitlement hours by LA 194
Table 76: Change in flexibility for universal entitlement by LA 194
Table 77: Proportion of children paying for additional hours by LA 194
Table 78: Fees and charges for free entitlement providers by LA 195
Table 79: Increases in charges by LA 196
Table 80: Changes in delivery cost due to extended hours by LA 196
Table 81: Changes in hourly staff pay due to extended hours by LA 197
Table 82: Changes in profits due to extended hours by LA 197
Table 83: Mix of free entitlement providers 198
Table 84: Use of additional care by LA 199
Table 85: Use of additional care by free entitlement provider type 199

12
Executive Summary
Introduction The Free Early Education Entitlement currently offers 15 hours of early education for 38 weeks each year to all three and four year old children and the most disadvantaged two year olds in England. The universal offer for three and four year olds will be extended to 30 hours for children of working parents in September 2017 when 30 hours free childcare is rolled out nationally. While the universal entitlement is focused on supporting child development, the aim of the extension is that “Additional free childcare will help families by reducing the cost of childcare and will support parents into work or to work more hours should they wish to do so”.1
In preparation for the national rollout in September 2017, the Department for Education (DfE) initiated early implementation in eight Local Authorities (LAs) in September 2016 with the aim of delivering the extended hours to around 5,000 children.2 This involved a universal offer to all eligible children of working parents in one LA and an offer of places to around 400 to 600 children in each of the other seven LAs. In addition to delivering places, early implementer LAs were required3 to:
• Test different approaches that drive market innovation and efficiency, trialling different ways of supporting providers to achieve economies of scale and reduce costs.
• Generate models of flexible provision which match parental working patterns and meet different child needs including those with SEND (special educational needs and disability), in homeless working families and from BME (black and minority ethnic) and rural communities.
• Increase market capacity to secure sufficient places in a range of different geographical areas and local markets, including bringing in new providers.
• Work with Government to test how to maximise parental take-up and employment.
1 Department for Education (2015), Childcare Bill: policy statement, DFE-00177-2015, December, https://www.gov.uk/government/uploads/system/uploads/attachment_data/file/482517/Childcare_Bill_Policy_Statement_12.03.2015.pdf, page 4. 2 Early implementation began prior to the introduction of the EYNFF (Early Years National Funding Formula) in April 2017 (https://www.gov.uk/government/publications/early-years-national-funding-formula-allocations-and-guidance) and before the publication of the Early Years Workforce Strategy in March 2017 (https://www.gov.uk/government/publications/early-years-workforce-strategy). 3 As specified in the Grant Funding Agreements with LAs for early implementation.

13
• Work with Government to test technical delivery systems, including eligibility checking, to ensure a smooth journey for all customers.
• Positively promote the 30 hours childcare offer, to help build momentum and maximise parental take-up on national rollout.
At the same time, the early innovators programme was introduced in 32 LAs (including the eight LAs undertaking early implementation) with funding for LAs to explore innovative approaches to support the national rollout of the 30 hours free childcare.
This report presents the findings from an independent evaluation of these two programmes undertaken by Frontier Economics, NatCen Social Research and researchers from the University of East London. This evaluation has collected a wide range of quantitative and qualitative evidence from:
• A review or the relevant documents.
• Semi-structured interviews with LA policy leads.
• Analysis of Early Years and School Census data.
• A large-scale survey with 561 providers delivering the extended hours (with an 80 percent response rate).
• A large-scale survey with 2,257 parents using the extended hours (with a 69 percent response rate).
• In-depth case studies in all eight LAs undertaking early implementation.
Feedback was also collected from presentations to LA policy leads. The evaluation sought to answer the key questions on sufficient delivery of places, take-up by parents and impacts on childcare use and parental work. It also considered some of the potential risks around financial sustainability for providers, the crowding out of other types of free entitlement places and impacts on the experience of the child.
The eight LAs involved in early implementation had diverse backgrounds in terms of size, urban / rural geography, affluence, ethnicity and type of local childcare provision. Within the seven LAs which had a limited number of extended hours places: two allocated them within a specific geographic area based on childcare hubs (creating a mini-universal approach); two allocated them to certain types of parents (one to parents living in the most rural areas and one to lower income parents); two allocated them solely or primarily through selected employers; and one allocated them to a bespoke selection of providers and parents to test a range of delivery models. The funding rates paid by LAs to providers for the extended hours were generally higher than the rates paid for the universal 15 hours offer because DfE had committed to raising the average funding rate for all free entitlement hours in the Early Years National Funding Formula (EYNFF) from

14
April 2017. All eight LAs planned to introduce additional measures to support improvements in the flexibility of provision, while half planned specific measures to help improve access for children with SEND and half planned direct measures to support parents to enter work.
Findings The evidence from the evaluation is arranged around ten questions.
1. Were providers willing to offer the extended hours?
A high proportion of providers were willing and able to offer the extended hours during early implementation. By the time of the census in January 2017, the numbers of places delivered were close to the allocated number that DfE had provided funding for in the seven LAs with a limited number of places. In the LA offering places to all eligible children, the number of places substantially exceeded the DfE estimate. In this area, 50 percent of three and four year olds using the universal free entitlement took up the extended hours and 80 percent of free entitlement providers delivered extended hours.
Of the 561 providers responding to the evaluation survey, most cited positive reasons for delivering the extended hours, including wanting to support the policy (70 percent) and because they saw it as a good business opportunity (43 percent). Some 75 percent offered the extended hours because they were invited to or encouraged to by the LA, and 68 percent did so because of parent requests. 44 percent also reported they felt parents would choose an alternative provider for the extended hours if they did not offer them.
Most places were delivered by private providers (57 percent), while 14 percent were delivered by voluntary providers and 13 percent were delivered in nursery classes in maintained schools (figure 1). Only a small proportion were delivered by childminders (7 percent) and very small proportions by independent schools, nursery schools and other LA-run provision (including children’s centres).4
4 Further details on these types are provided in section 2.2.

15
Figure 1: Types of providers delivering extended hours places
Sources: Early Years Census, School Census and additional evaluation data collection, January 2017
Note: Sample size is 4,924 places.
Although all types of providers were generally willing to deliver the extended hours, the case studies identified a number of issues which could limit the extent to which different types of providers5 will be able or willing to engage with the offer going forward:
• Day nurseries typically required few if any adjustments to deliver the extended hours and experienced no major difficulties in meeting parental demand. However, their response to full implementation may be different for two reasons. First, following a financial assessment of the early implementation experience some had concluded that they may limit the extended hours places to what was considered a financially viable number. Second, some managers felt that their ability to meet any increase in demand for additional hours would be limited by staff retention and recruitment difficulties.
• Playgroups had to make more adjustments to their offer to deliver the extended hours, but these tended to be modest and sufficient to meet demand during early
5 Providers in the census data and evaluation survey of providers were classified into four groups of: private (including private and independent schools); voluntary; childminders; and maintained (including nursery classes in maintained schools, nursery schools and LA maintained settings including children’s centres). Providers in the evaluation survey of parents and evidence from the case studies considered four approximately corresponding types of providers of day nurseries, playgroups, childminders and schools (see section 2.2 for further details on the comparability of provider types across the evidence sources).
0%
10%
20%
30%
40%
50%
60%Pe
rcen
etag
e of
pla
ces

16
implementation. Going forward, staff recruitment and retention were also expected to limit playgroups’ ability to respond to an increase in demand. In addition, reliance on venues that are low cost but shared with other users (such as community centres) could considerably limit playgroups’ ability to adapt their offer, for example, by opening for longer hours or during holidays.
• Childminders typically required little if any adjustments to deliver the extended hours and did not experience any difficulties in meeting parental demand during early implementation. A challenge faced by this group, particularly in areas where use of childminding provision has traditionally been low, is limited parental demand for childminders to deliver free entitlement hours.
• Some schools were willing and able to adapt their offer to deliver the extended hours, in some cases building on previous efforts to offer a “more modern service” to working parents. For some, declining pupil numbers were a strong motivator to adapt their offer to attract more children. But when this motivator was lacking, there was less incentive to participate in a “childcare” programme which was not seen as part of the school’s core purpose of delivering early education. Furthermore, for schools that were full and could not expand, offering extended hours would mean a decrease in the number of universal free entitlement places, which was viewed as detrimental to the local community.
Overall, however, the main challenge for all types of providers was uncertainty around the business implications in terms of the switch in the balance of income towards free entitlement funding and the costs of any adjustments to provision required to deliver the extended hours. Business support provided or commissioned by LAs was important to give some providers the confidence that the extended hours would not undermine their financial position. Effective support needed to be tailored to the specific needs of individual settings and typically involved:
• Reviewing different options for providing the extended hours – for example, whether a “stretched” or term-time offer would better fit a setting’s business mode; whether it would be financially viable for a setting to adjust its service to deliver the full 30 hours or more prudent to offer fewer hours; or whether options for delivering the 30 hours in partnership with other settings should be considered.
• Supporting providers to understand their operational costs and their breakeven point, which was critical to overcoming their concerns about the offer not being financially viable.
• Helping providers that had operated an all-inclusive rate (and had regarded it as a selling point) to adapt to charging for additional items not covered by the free entitlement funding (for example, for food and outings).

17
It was also evident that any failure in LA processes to deliver a reliable and robust payment system could adversely affect participation by providers in terms of continued delivery or future recruitment of new providers.
This evidence suggests the following recommendations for the national rollout:
(A) Providers of all types are likely to be willing to offer the extended hours, but there is a need to recognise that different types may face different challenges in delivery and the kind of support offered will need to reflect this variation.
(B) An important issue in recruiting providers to deliver the extended hours will be to address the uncertainty about the financial implications which business support at the local level can help to achieve.
(C) The design of local payment processes needs to support the participation of providers by being efficient and reliable.
2. Were providers able to offer sufficient hours and were there any adverse impacts on other provision?
There was sufficient delivery of extended hours places to meet demand during early implementation. By four months after early implementation began, the number of places delivered had basically met or exceeded the allocated numbers. The evaluation survey of providers also showed that:
• 29 percent of providers had increased occupancy due to the delivery of extended hours (that is, had used spare capacity).
• 33 percent had increased staff hours or the number of staff in order to deliver the extended hours.
• 30 percent could definitely offer more free entitlement places, and 33 percent could possibly (but not definitely) offer more places.
There was no evidence of any adverse effects on other free entitlement and paid provision. The census data showed that, on average, each provider had started delivering seven extended hours places and reduced the number of universal 15 hours places by seven. There was almost no impact on free entitlement places for two year olds. This suggests that there had been a conversion of the universal 15 hours free entitlement places into extended hours places rather than any crowding out of other types of free entitlement provision.
However, early implementation was a very limited test of sufficiency because of the limited number of places in seven of the eight LAs and the timing in the earlier part of the school year when there is more spare capacity. Evidence from the case studies (reported above) and from early innovators indicated that if any substantial expansion in capacity is

18
required to meet demand in the national rollout, there are risks that this could be constrained by difficulties in the recruitment of good staff, in finding additional venue space and in obtaining capital funding for investment.
This evidence suggests the following recommendations for the national rollout:
(D) Given the limited test of sufficiency during early implementation, a national level review of sufficiency in the delivery of extended hours places and impacts on other types of provision would be helpful in April 2018 when demand will be peaking for the summer term.
(E) In case a substantial expansion in capacity is required to meet the demand for the extended hours, consideration could be given to how DfE can support the sharing of any learning on facilitating utilisation of existing building space (currently being explored by some early innovators); provision of capital funding for small and large expansion projects; and continued support for increasing the supply of good practitioners through the Early Years Workforce Strategy presented in March 2017.
3. Did providers work in partnerships?
Partnership working can support providers to deliver the extended hours and is also encouraged by the greater need for shared care with the introduction of the extended free entitlement hours. Indeed, some 20 percent of providers reported in the evaluation survey that they had formed new partnerships to offer the extended hours. The case studies showed that this was aided by partnership support mechanisms in several of the LAs. However, there were challenges to partnership working (such as tensions between different types of providers) and there is a potential role for LAs to promote the development of partnerships in order to support the delivery of the extended hours. This suggests the following recommendation for the national rollout:
(F) LAs should consider how best to identify the specific challenges to partnership working in their area and how they can support the development of new and effective partnerships.
4. How flexible and free were the extended hours?
According to the evaluation survey of providers, most providers did not need to extend their opening hours as they were already offering full-day provision (83 percent) and year-round provision (66 percent), but there were indications that some providers had increased their opening times (11 percent). According to the census data, only 17 percent of extended hours places involved the use of the extended hours in the school holidays. This was partly because around one third of the providers did not offer holiday care and partly due to parental choice. However, evidence from the case studies showed that some parents had been told by providers that the extended hours could not be taken during the holidays or were not aware that they could use the extended hours to cover holiday provision. More broadly, 90 percent of providers in the evaluation survey reported

19
that they offered parents a free choice or at least some choice in when they took the extended hours. The case studies showed that there were several ways in which some providers limited parental choice for some parents. For example, some day nurseries offered free entitlement hours only for a short day or during less busy sessions.
According to the evaluation survey, around one in seven providers (14 percent) had introduced or increased additional charges (for items over and above fees) for parents because of the extended hours.6 However, parents reported in the evaluation survey that 55 percent of free entitlement places involved payment for additional charges. Furthermore, the case studies showed that there was confusion among some parents about charges associated with the free hours. While some parents did not make any payments or were clear they were paying for optional extras, others were not sure what they were paying for and trusted their setting to make the correct charges. Some providers had told parents that the funding for the extended hours was insufficient to cover costs and that they needed to recoup these costs in some other way. In some cases, this meant that parents were limited in when the extended hours could be used and had to pay for some provision (such as during more popular sessions) while not using the full 30 free hours. Although parents were unhappy that they could not access the full 30 free hours, their gratitude for the lower childcare bill during early implementation seemed to outweigh their frustrations.
LA early implementation teams were aware that settings’ practices around charging and restrictions limited the extent to which parents could benefit from the offer and there was particular concern for the impact these practices had on lower income families. However, it was very difficult for LA staff to “interfere” with providers’ business decisions particularly as these may reflect parental demand for a particular expensive service and / or interference could threaten a provider’s financial viability. Furthermore, even if they wanted to intervene, there were “grey areas” in the guidance that made it difficult to establish if a setting was contravening the DfE guidance. Even if it were possible to conclusively argue that they were, they did not feel they had the tools to enforce DfE guidance.
This suggests the following recommendation for the national rollout:
(G) Improvements in the guidance for the extended hours could be considered including:
• Greater clarity on parental rights over some aspects of flexibility.
• Creating a balance between allowing some additional charges while ensuring they do not deter take-up of the extended hours.
6 The early implementation guidance for LAs stated that providers were not to levy any additional charges to parents as a condition of taking up the extended hours.

20
• Greater clarity for LAs on what they could do if providers breach the conditions.
• Greater support from DfE to provide prompt and definitive answers when LAs are challenged by providers or parents on how the guidance is being implemented.
5. What was the financial impact for providers?
Providers reported mixed financial impacts from delivering the extended hours, although the tendency was towards higher costs and lower profits. In the evaluation survey of providers:
• 62 percent of providers reported that there had been no impact on costs, while 7 percent reported that delivery costs had decreased due to the delivery of the extended hours and 30 percent reported they had increased.
• 38 percent of providers reported that there had been no impact on profits, while 22 percent reported that profits had increased due to the delivery of the extended hours and 40 percent reported they had decreased.
Figure 2: Financial impacts on providers by provider type
Source: Evaluation Survey of Providers, 2017
Notes: See table 3 in section 2.2 for a description of the provider types. Sample sizes for private, voluntary, childminder and maintained are 219, 68, 162 and 64 in panel (a) and 203, 43,163 and 50 in panel (b).
0%
10%
20%
30%
40%
50%
60%
70%
80%
90%
100%(a) Change in delivery cost
Cost increased No changeCost decreased
0%
10%
20%
30%
40%
50%
60%
70%
80%
90%
100%(b) Change in profit
Profit decreased No changeProfit increased

21
Private providers were most likely to report an impact on costs, while voluntary providers were most likely to report an impact on profits (figure 2). For voluntary and maintained providers, the proportions reporting a positive impact on profits are very similar to those reporting a negative impact.
The financial impacts on providers will depend upon two factors:
(a) The extent of the change in the balance in income source from parental fees to free entitlement payments combined with the relative level of free entitlement funding rates to fees.
(b) The impact on delivery cost, including a potential reduction due to increased occupancy or a potential increase if adjustments to provision which raise costs are required.
Hence, for some providers, delivering the extended hours will be financially sustainable while not for others. Delivery may also be more profitable for some providers and less profitable for others. Drawing conclusions for the national rollout from early implementation is limited by the fact that funding rates will be different for the national rollout with the introduction of the EYNFF. Nevertheless, this evidence suggests the following recommendation for the national rollout:
(H) In future reviews of funding rates in the EYNFF, there is a need to be explicit about the level of service that the funding rates are expected to support in terms of quality and flexibility. In addition, these reviews need to consider the drivers of ongoing changes in delivery costs.
6. Did parents take up places?
The parental work requirement in the eligibility criteria for the extended hours meant that families using the extended hours tended to be more educated and to have higher income than other families. The evaluation survey of parents using the extended hours showed that:
• 52 percent of parents had degrees.
• 34 percent had household annual gross income of less than £31,200; 34 percent had income between £32,000 and £52,000; and 33 percent had income of £52,000 or greater.
Some 85 percent of the families using the extended hours were couple families and 15 percent were single parents (almost all single mothers):
• 46 percent were couples with a father working full time and a mother working part time, while 31 percent were couples with a father working full time and a mother also working full time.
22
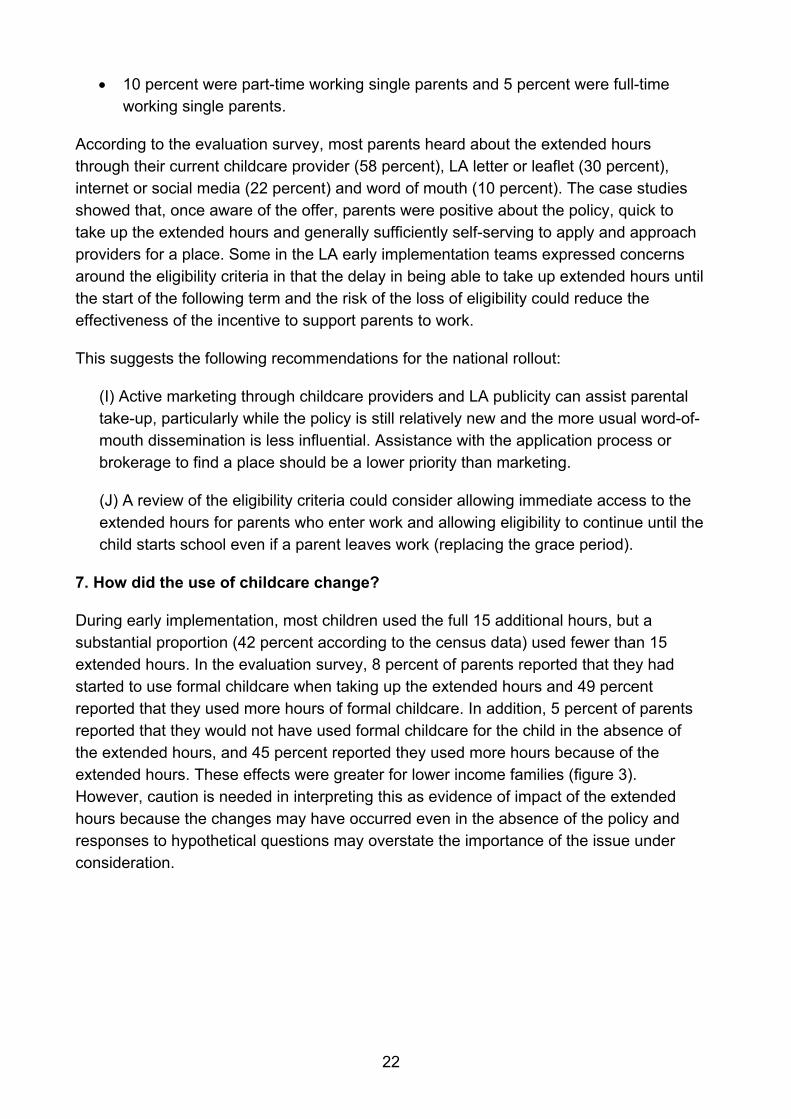
• 10 percent were part-time working single parents and 5 percent were full-time working single parents.
According to the evaluation survey, most parents heard about the extended hours through their current childcare provider (58 percent), LA letter or leaflet (30 percent), internet or social media (22 percent) and word of mouth (10 percent). The case studies showed that, once aware of the offer, parents were positive about the policy, quick to take up the extended hours and generally sufficiently self-serving to apply and approach providers for a place. Some in the LA early implementation teams expressed concerns around the eligibility criteria in that the delay in being able to take up extended hours until the start of the following term and the risk of the loss of eligibility could reduce the effectiveness of the incentive to support parents to work.
This suggests the following recommendations for the national rollout:
(I) Active marketing through childcare providers and LA publicity can assist parental take-up, particularly while the policy is still relatively new and the more usual word-of-mouth dissemination is less influential. Assistance with the application process or brokerage to find a place should be a lower priority than marketing.
(J) A review of the eligibility criteria could consider allowing immediate access to the extended hours for parents who enter work and allowing eligibility to continue until the child starts school even if a parent leaves work (replacing the grace period).
7. How did the use of childcare change?
During early implementation, most children used the full 15 additional hours, but a substantial proportion (42 percent according to the census data) used fewer than 15 extended hours. In the evaluation survey, 8 percent of parents reported that they had started to use formal childcare when taking up the extended hours and 49 percent reported that they used more hours of formal childcare. In addition, 5 percent of parents reported that they would not have used formal childcare for the child in the absence of the extended hours, and 45 percent reported they used more hours because of the extended hours. These effects were greater for lower income families (figure 3). However, caution is needed in interpreting this as evidence of impact of the extended hours because the changes may have occurred even in the absence of the policy and responses to hypothetical questions may overstate the importance of the issue under consideration.

23
Figure 3: Impacts on childcare use across income levels
Source: Evaluation Survey of Parents, 2017
Notes: Lower, middle and higher income are defined as annual gross household income below £32,000, £32,000 or more and below £52,000, and £52,000 or more respectively. Sample sizes are 730, 734 and 639 for the three income groups in panel (a) and 708, 718 and 685 for the three income groups in panel (b).
The evaluation survey showed that some parents changed their childcare arrangements in order to take up the extended hours: 9 percent changed provider and 6 percent began to use an additional provider (meaning that 15 percent made some change). A quarter of children using the extended hours used more than one provider in a typical term-time week, indicating that a not inconsiderable proportion of children would have used multiple providers even in the absence of the extended hours. Many parents (42 percent) combined the use of the extended hours with informal childcare.
Longer hours were generally seen as having positive impacts for the child by providers involved in their delivery and by parents using them: 87 percent of parents using the extended hours reported that they thought that the longer hours improved school readiness in the evaluation survey. The case studies indicated that parents using multiple providers generally did not have concerns about any adverse effects on the child although the evaluation survey showed that two thirds of parents thought that it was better for a child to have just one formal childcare provider.
0%
10%
20%
30%
40%
50%
60%
70%
80%
90%
100%
Lowerincome
Middleincome
Higherincome
(a) Change in childcare use
Started to use More hoursNo change Fewer hours
0%
10%
20%
30%
40%
50%
60%
70%
80%
90%
100%
Lowerincome
Middleincome
Higherincome
(b) Perceived impact on chldcare use
Reason to use More hoursNo impact Fewer hours

24
This evidence suggests the following recommendation for the national rollout:
(K) To help support the use of multiple providers, national or local training and workshops for providers could promote good shared care practice for children using multiple providers. Consideration could also be given to the provision of information and example cases for parents on how to manage a good package of care when using multiple providers.
8. How did parental work change?
Evidence on the potential impact of the extended hours on parental work was collected for mothers and fathers in the evaluation survey of parents:
• Compared to the time prior to taking up the extended hours, 1 percent of mothers reported that they had entered work and 23 percent had increased their work hours.
• Considering the hypothetical scenario of their work choices in the absence of the extended hours, 11 percent of mothers reported that they thought they would not be working, while 24 percent thought they would be working shorter hours.
• Compared to the time prior to taking up the extended hours, less than 1 percent of fathers reported that they had entered work and 9 percent had increased their work hours.
These effects were notably stronger for families with relatively lower incomes.
Again, caution is needed in interpreting this as evidence of impact of the extended hours because the changes in work may have occurred even in the absence of the policy and responses to hypothetical questions may overstate the importance of the issue under consideration. In addition, the timeframe for early implementation may have been too short to have encouraged parents into work. However, the evidence suggests that the extended hours may encourage both mothers and fathers to work longer hours, although mothers are likely to remain working part time rather than full time. In addition, the combination of the findings that few mothers had actually moved into work and a higher proportion reported that they would not be working in the absence of the extended hours suggests that the extended hours may support mothers to remain in work.
9. What other effects were there on families?
In the evaluation survey, some 78 percent of parents reported that the extended hours had given them greater flexibility in their work choices. The case studies showed that increased work flexibility helped parents to obtain more secure employment, enhanced career opportunities and improved their work-life balance. In addition, less reliance on informal care was also reported to reduce stress and the burden on grandparents.

25
According to the evaluation survey of parents, there were positive impacts on family finances: 58 percent of parents reported that they had slightly more money to spend, while 26 percent reported that they had much more money to spend. The financial benefits were slightly greater for higher income families, possibly because these families tend to spend more on childcare than lower income families.
10. What challenged and what supported implementation?
The case studies identified several challenges to implementation that were related to the national programme:
• The name of the policy created some difficulties for reasons related to the evidence described above. First, calling the policy “childcare” made some schools question their involvement as they view their role as delivering education rather than childcare. Second, calling it “30 hours” was seen by some providers and parents as raising false expectations as families using the stretched offer receive just over 20 hours a week. Third, calling it “free”’ was considered misleading by some parents and providers because some parents had to effectively pay something to access the extended hours.
• LAs and providers found the timescale for the programme unrealistic, particularly with very late confirmation from DfE to LAs (and consequently from LAs to providers) of the number of places. There were also protracted negotiations between LAs and DfE about funding with some rates agreed after the programme’s launch. Developing an adequate IT system to monitor and make payments for the extended hours in the time available proved challenging and a drain on resources, sometimes resulting in temporary “make-do” systems that will need to be revised for the national rollout.
• LAs reported difficulties initially engaging some providers because negative national publicity about the 30 hours free childcare had encouraged some to focus on the difficulties rather than to think creatively about how the offer could work for them. Some providers’ views on the financial viability of the offer reflected concerns about the level of funding highlighted in the media, while some expressed a concern about the sector’s ability to respond to an increase in demand which reflected national news stories.
• Lack of robust data on the number of eligible families, where they live and where they may take up the provision created problems as LAs could not give an indication of the likely take-up in providers’ catchment areas.
• The failure to appoint the national business support organisation to support delivery of the extended hours in the initial crucial months of early implementation planning and delivery also proved challenging.

26
Factors at the local and national level that facilitated programme implementation included:
• Early innovator funding was reported to have been critical to provide the LA staffing resources required to enable early implementation.
• Senior executive buy-in and engagement from across the LA, including early years, health, education and finance. As an early implementation manager explained, a supportive leadership had enabled them to think differently and creatively and this helped them to remain positive and motivated.
• The support of a multi-service team to deliver early implementation with input from Family Information Services, communication and business teams and the finance department.
• Help from the IT and data teams was seen as essential for effective planning and the development of digital solutions to deliver and monitor the programme.
• A strong and positive relationship with providers helped LA teams to work through providers’ concerns and reservations. LA teams talked about having open and honest exchanges about the challenges presented by the offer and being there for settings when they needed support.
• An effective model for supporting providers to work in partnership was reported to have facilitated the early implementation in areas where this model already existed or had been developed in order to deliver the extended hours.
• The support provided by DfE officials and the opportunity to meet and share learning with other early implementers were reported to have been helpful.
This evidence suggests the following recommendations for the national rollout:
(L) Consideration should be given to how DfE can most effectively support LAs to implement the policy including ensuring adequate funding for staff resources to fully implement the policy; direct DfE encouragement of senior level sponsorship within the LA; and providing timely information to LAs on the plans for the national communications strategy.
(M) For the national promotion of the policy, it would be useful to consider the need for simple, key positive messages to promote the policy to providers and parents; promotion of some of the additional benefits; robust responses to some well-publicised perceptions of problems; and how to separate out other broader childcare issues such as workforce development from the 30 hours free childcare.

27
Limitations on learning from the evaluation It is important to note that there are limitations on how far lessons can be drawn from early implementation for the national rollout:
• Early implementation involved only partial implementation in seven of the eight LAs which meant that sufficiency of delivery and take-up by parents could not be fully tested. Although there was complete implementation in one LA, a single case is unlikely to be nationally representative.
• Early implementation began at the most favourable time of year in terms of spare capacity in provision. Although the national rollout will begin in the same favourable conditions in September, achieving sufficiency of provision could be more challenging later in the school year.
• Early implementation was an early trial of a policy with a short timeframe and a small number of LAs. In addition, LAs were purposively selected (within a fair and competitive process) including a criterion of “a track record on innovation and delivery of sufficiency and meeting other objectives”, suggesting a more favourable implementation than might occur nationwide.
• Several elements of the policy at both the national and local level will be different in the national rollout, including funding rates, other financial support from DfE (there will be no early innovator funding), the eligibility checking system, and no obligations for LAs to undertake additional supporting measures, for example, measures to promote flexibility or access for specific types of families.
• Early implementation did not provide the opportunity for a robust evaluation of impact on parental work and only proxy measures using changes over time and responses to hypothetical questions could be considered.
Conclusions Overall, the evidence from early implementation suggests that there is no specific reason to believe that 30 hours free childcare will not be a success. In particular:
• A high proportion of providers were willing and able to offer the extended hours places and there was no evidence that financial implications were a substantial barrier to the delivery of the extended hours.
• Parents were keen to take up the extended hours.
• Take-up of the extended hours was associated with increases in the use of formal childcare; longer work hours for mothers and fathers; and some indication of higher work retention for mothers.

28
• There were additional perceived benefits for families in terms of enhanced work opportunities, direct financial support and broader wellbeing.
This report has used the evidence from early implementation to draw out some recommendations that may help a smooth national rollout in September 2017. Summarising across this long list, the key priorities should be:
• To be mindful of the policy technical details (both at the national level and at the local level). Minor points of detail around the eligibility checking and payment processes or in the statutory guidance could be critical to ensuring that the policy is implemented in the way intended and achieves its objectives.
• Sufficient support from DfE to the LAs to adequately implement the policy, including funding for staffing resources; clarity and active assistance on the guidance; and promotion of the policy at senior levels within LAs.
• Positive promotion of the ultimate objectives of encouraging parents to work and supporting working families financially and in broader measures of wellbeing rather than a simple focus on the interim output of delivering more free entitlement hours.

29
1. Introduction The Free Early Education Entitlement currently offers 15 hours of early education for 38 weeks each year to all three and four year old children and the most disadvantaged two year olds in England. The universal offer for three and four year olds will be extended to 30 hours for children of working parents7 in September 2017 when 30 hours free childcare is rolled out nationally. While the universal entitlement is focused on supporting child development, the aim of the extension is that “Additional free childcare will help families by reducing the cost of childcare and will support parents into work or to work more hours should they wish to do so”. 8
In preparation for the national rollout in September 2017, the Department for Education (DfE) has undertaken three “early” programmes which test the policy in different ways:
• Early implementation began in eight Local Authorities (LAs) in September 2016, one year prior to the national rollout.9 Early implementation aimed to deliver the extended hours to around 5,000 children, with a universal offer to all eligible children of working parents in one LA and an offer of places to around 400 to 600 children in each of the other seven LAs. In addition to delivering places, early implementer LAs were required10 to:
o Test different approaches that drive market innovation and efficiency, trialling different ways of supporting providers to achieve economies of scale and reduce costs.
o Generate models of flexible provision which match parental working patterns and meet different child needs including those with SEND (special educational needs and disability), in homeless working families and from BME (black and minority ethnic) and rural communities.
o Increase market capacity to secure sufficient places in a range of different geographical areas and local markets, including bringing in new providers.
7 Working parents are defined as those who earn or expect to earn the equivalent to working 16 hours each week at the national minimum or living wage. This currently equates to earnings of around £120 a week (or around £6,000 per year) for parents aged 25 or older. 8 Department for Education (2015), Childcare Bill: policy statement, DFE-00177-2015, December, https://www.gov.uk/government/uploads/system/uploads/attachment_data/file/482517/Childcare_Bill_Policy_Statement_12.03.2015.pdf, page 4. 9 Early implementation began prior to the introduction of the EYNFF (Early Years National Funding Formula) in April 2017 (https://www.gov.uk/government/publications/early-years-national-funding-formula-allocations-and-guidance) and before the publication of the Early Years Workforce Strategy in March 2017 (https://www.gov.uk/government/publications/early-years-workforce-strategy). 10 As specified in the Grant Funding Agreements (GFAs) with LAs for early implementation.

30
o Work with Government to test how to maximise parental take-up and employment.
o Work with Government to test technical delivery systems, including eligibility checking, to ensure a smooth journey for all customers.
o Positively promote the 30 hours childcare offer, to help build momentum and maximise parental take-up on national rollout.
• The early innovators programme was introduced in April 2016 in 32 LAs (including the eight LAs undertaking early implementation). No extended hours places were delivered under this programme, but funding was provided to LAs to explore innovative approaches to support the national rollout of the 30 hours free childcare and test how best the policy can be supported in different local contexts.
• Early rollout began in four LAs (including one early innovator) in April 2017 with a universal offer of extended hours places to all eligible children in each LA. The focus of the early rollout is to test sufficiency of delivery and take-up by eligible parents and whether there are any early indications of impacts on childcare choices or parental work.
In August 2016, an evaluation team of Frontier Economics, NatCen Social Research and researchers from the University of East London were appointed to undertake an evaluation of the early implementation which was also to include an element for the early innovators programme. In March 2017, this evaluation was extended to include the early rollout. This report presents the findings from the early implementation and early innovators elements of this evaluation and a subsequent report will present findings from the early rollout element.
The evaluation had three sets of objectives:
1. To provide a description of how early implementation was undertaken in each LA answering the question:
• Q1: What was the policy structure in each LA in terms of any rationing of places, funding rates and additional measures to support the policy?
2. To provide robust evidence on implementation and its impacts around three questions:
• Q2: What were the most effective approaches to implementation?
• Q3: How did childcare providers respond?
• Q4: How did parents respond?

31
3. To facilitate the dissemination of the evaluation evidence and lessons in order both to help enable a smooth and efficient implementation of the national rollout and to help build momentum around public awareness of the policy and its ultimate objectives.
In order to meet these objectives, a wide range of quantitative and qualitative evidence was collected using document reviews, semi-structured interviews with LA policy leads, analysis of Early Years and School Census data, large-scale surveys with providers and with parents, and in-depth case studies in all eight LAs undertaking early implementation. Feedback was also collected from presentations to LA policy leads.
It is important to note that there are limitations on how far lessons can be drawn from early implementation for the national rollout:
• Early implementation involved only partial implementation in seven of the eight LAs which meant that the sufficiency of delivery and take-up by parents could not be fully tested in these areas. Although there was complete implementation in one LA, a single LA is unlikely to be nationally representative.
• Early implementation began at the most favourable time of year in terms of spare capacity in provision. Although the national rollout will begin in the same favourable conditions in September, achieving sufficiency of provision could be more challenging later in the school year. However, evidence from the early rollout which began in four LAs in April may help to address this draw back by testing sufficiency and take-up with complete implementation at the least favourable time of year when providers are at highest occupancy and have least spare capacity.
• Early implementation was an early trial of a policy with a short timeframe and a small number of LAs. Major policies like this one typically take more than one year to fully embed and both problems and impacts can often take longer to materialise. In addition, LAs were purposively selected (within a fair and competitive process) including a criterion of “a track record on innovation and delivery of sufficiency and meeting other objectives”, suggesting a more favourable implementation than might occur nationwide.
• Several elements of the policy at both the national and local levels will be different in the national rollout, including funding rates (to be set under the EYNFF), other financial support from DfE (there will be no early innovator funding) and no obligations for LAs to undertake additional supporting measures, for example, measures to promote flexibility or access for specific types of families. A critical element in the national rollout will be the introduction of the Childcare Service system to check parents’ eligibility. Successful implementation of this system will be a necessary (but not sufficient) condition for the policy to successfully operate at all.

32
• Early implementation did not provide the opportunity for a robust evaluation of impact on parental work and only proxy measures using changes over time and responses to hypothetical questions could be considered.
However, in spite of these caveats, early implementation and this evaluation have provided some important and useful insights for the national rollout.
The remainder of this report is structured in the following way. Chapter 2 provides a description of the evaluation methodology and data collection. Chapter 3 describes the objectives and potential risks of the 30 hours free childcare; the structure of local models for early implementation; and the role of the early innovator programme. The following chapters then present the evidence from early implementation which helps inform a series of questions about the national rollout:
• Were providers willing to offer the extended hours? (chapter 4)
• Were providers able to offer sufficient hours and were there any adverse impacts on other provision? (chapter 5)
• Did providers work in partnerships? (chapter 6)
• How flexible and free were extended hours? (chapter 7)
• What was the financial impact for providers? (chapter 8)
• Did parents take up places? (chapter 9)
• How did the use of childcare change? (chapter 10)
• How did parental work change? (chapter 11)
• What other effects were there on families? (chapter 12)
• What challenged and what supported implementation? (chapter 13)
The final chapter concludes with the indications for the likely success of the national rollout and the priorities among the recommendations to support the national rollout.

33
2. Evaluation methodology This chapter describes the evaluation methodology. The first section presents an overview of the elements of the evaluation, while the second section describes the collection of the evidence (with further details provided in Annex A). The third section discusses some important caveats on what can be learnt for the national rollout, while the final section clarifies and defines some specific terminology.
2.1 Overview of the evaluation A summary of the key questions that the evaluation sought to answer and collected evidence to inform on is presented in table 1.
Table 1: Evaluation key questions
Evidence on Key questions
Lessons for implementation
How did LAs prepare for implementation? What was most effective? How did LAs support providers to deliver the extended places and build capacity? What worked well with different types of providers? How did LAs support take-up and access for parents? What worked best? What factors and contexts helped and hindered implementation?
How childcare providers responded
Was there any expansion in capacity within existing providers or from new providers? Were there any changes in the efficiency of delivery or in the flexibility of provision? Were there any unintended consequences on other provision, delivery costs or fees?
How parents responded
Were there any barriers to or enablers for taking up the offer? Did parents change their use of childcare or work choices? Did parents benefit financially?
The evidence collection to answer these questions involved a range of quantitative and qualitative approaches, reflecting both the need to answer questions around process and the drivers of responses, using in-depth interviews and the need for larger-scale statistics on the prevalence of the indicators of impact.
The evaluation also needed to meet the competing demands of allowing sufficient time for early implementation to have taken effect before collecting evidence while also allowing sufficient time to analyse the evidence and disseminate findings in time to be of
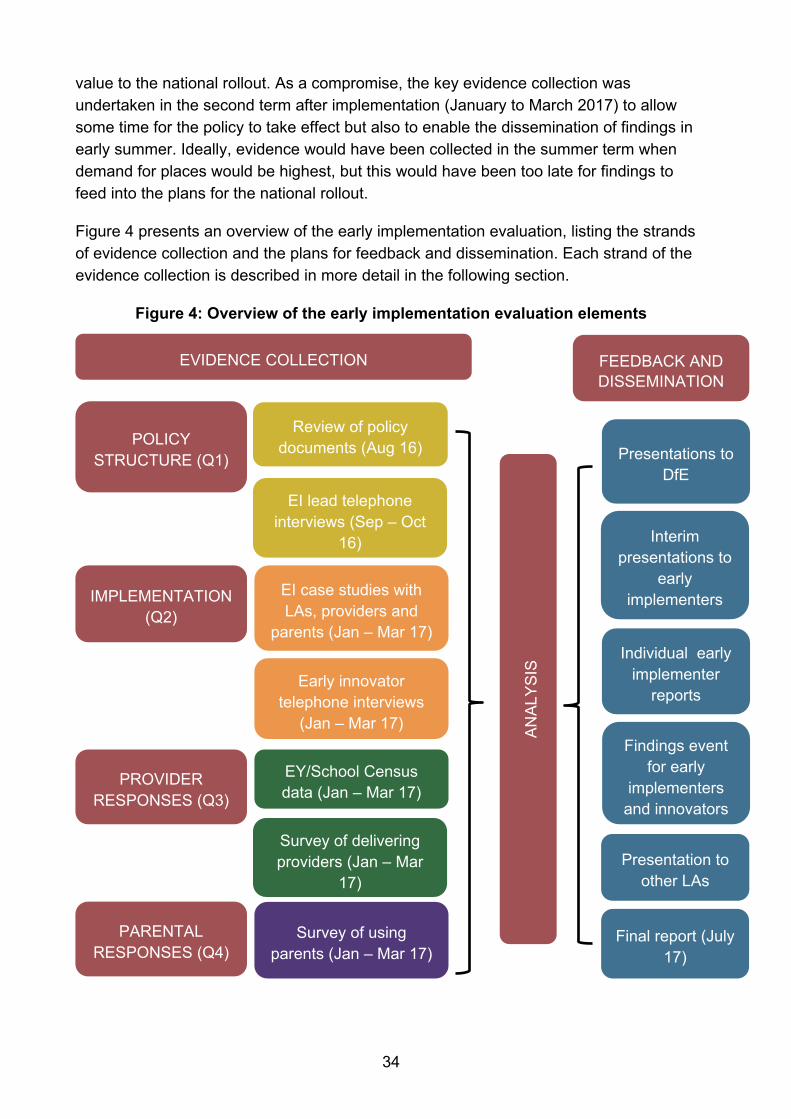
34
value to the national rollout. As a compromise, the key evidence collection was undertaken in the second term after implementation (January to March 2017) to allow some time for the policy to take effect but also to enable the dissemination of findings in early summer. Ideally, evidence would have been collected in the summer term when demand for places would be highest, but this would have been too late for findings to feed into the plans for the national rollout.
Figure 4 presents an overview of the early implementation evaluation, listing the strands of evidence collection and the plans for feedback and dissemination. Each strand of the evidence collection is described in more detail in the following section.
Figure 4: Overview of the early implementation evaluation elements
POLICY STRUCTURE (Q1)
IMPLEMENTATION (Q2)
PROVIDER RESPONSES (Q3)
PARENTAL RESPONSES (Q4)
FEEDBACK AND DISSEMINATION
Review of policy documents (Aug 16)
EI lead telephone interviews (Sep – Oct
16)
EI case studies with LAs, providers and
parents (Jan – Mar 17)
EY/School Census data (Jan – Mar 17)
Survey of delivering providers (Jan – Mar
17)
Survey of using parents (Jan – Mar 17)
Early innovator telephone interviews
(Jan – Mar 17) ANAL
YSIS
Presentations to DfE
Interim presentations to
early implementers
Findings event for early
implementers and innovators
Individual early implementer
reports
Final report (July 17)
EVIDENCE COLLECTION
Presentation to other LAs

35
Each element of the evidence collection is listed under the evaluation area that it was primarily designed to answer, but there is some overlap in that information was also collected to inform on other areas. In particular, the case studies provided additional insights into the responses of providers and parents as well as information on the process issues of implementation.
As well as seeking to present the findings as early as possible, the dissemination elements provided ongoing feedback through a number of presentations throughout the evaluation, with the aim of promoting understanding of the policy and the evaluation objectives as well as encouraging participation in the evaluation. The individual LA reports for those involved in early implementation presented case study and other evaluation evidence for that LA, providing bespoke local implementation lessons as well as giving LAs an opportunity to feed back on the findings in their area. The findings event for early implementers and early innovators also provided opportunities for the LAs to review and comment on the emerging evaluation findings.
2.2 Collection of evidence The policy review collected evidence on the policy structure through two main sources: a desk-based review of policy documents and telephone interviews with the LA leads in the eight early implementer areas. The review of policy documents included national level documentation and guidance for early implementation and local sources including the initial GFAs with DfE, progress reports and the key performance indicator (KPI) statistics from the LAs. The telephone interviews with the LA leads were undertaken in late September and October 2016 and involved a semi-structured interview with questions on:
• Local planning and decision-making processes.
• How extended hours places would be rationed (outside of the LA with a universal offer); which providers would be offering the places; the measures used for parent recruitment; and funding rates.
• Any additional measures to support the delivery of the extended hours.
• Delivery, take-up and any early lessons during initial implementation.
A “light touch” evidence collection was also undertaken for the early innovation programme. This also involved a desk-based review of policy documents, including the delivery arrangements and progress reports, and semi-structured interviews with the 24 leads in areas which were not also involved in early implementation. These interviews were undertaken during January and February 2017 and collected information on:
• The local childcare market and what LAs had learnt about potential delivery and take-up in the national rollout.

36
• Any learning on the effectiveness of the specific innovative activities that they had been testing.
• Any broader learning about how they will approach delivering the extended hours in the national rollout and what type of support would be most useful.
In addition, specific questions in the policy interview for the eight LAs involved in early implementation asked about the role of the early innovation programme.
However, it should be noted that the collection of evidence from the early innovators was undertaken mid-way through the programme and most LAs were not very advanced in implementing or learning from their activities. This limited the lessons that could be drawn from this element of the evaluation, but useful evidence is highlighted throughout the report.
The case studies gathered in-depth data to explore how the programme worked from different perspectives (figure 5). The design of each case study was tailored to the local delivery model and the data collection was flexible, interactive and adapted to specific circumstances.
Figure 5: Overview of the case study data collection
Between January and March 2017, qualitative face-to-face and telephone interviews and mini groups were carried out with:
• LA early years staff and other key stakeholders who supported the programme’s implementation within and outside the LA. A total of 19 early implementation team members (that is, staff who were heavily involved in the programme’s implementation) and 31 other stakeholders took part in these interviews.
• Early years and childcare settings of different types and sizes, and located in different parts of the LAs. A total of 65 providers that delivered the extended hours
Programme
implementation: Interviews with 19 EI
team members and 31 other key stakeholders
Families:
Interviews with 72 parents
Providers:
Interviews with 65 participating providers and 7 non-participating
providers
Across 8 Local Authorities

37
and 7 that did not deliver the offer were interviewed, including: 21 day nurseries; 13 playgroups; 19 childminders; 17 nursery classes / nursery schools, and 2 out-of-school clubs.
• Parents who were purposively selected to cover responses to the programme that were of particular interest (for example, families who had changed their childcare arrangements and / or employment circumstances) and with a diverse socioeconomic profile. A total of 72 parents who had taken up the extended hours were interviewed including 17 single parent families and 14 parents with children with additional needs.
The case studies aimed to collect data on:
• Understanding the different delivery approaches and the rationale underpinning them.
• Key challenges in delivery and capacity building and approaches used to address them.
• Facilitators and barriers to successful implementation in diverse local contexts and for different programme foci.
• Understanding the responses of providers and parents and the drivers of any impacts on provision of childcare and work choices.
The census data analysis used information for the eight LAs involved in early implementation from the regular Early Years Census and School Census data collections in January 2016 and January 2017 and an additional ad hoc data collection for the extended hours during early implementation on the census day in January 2017. The regular census data collection contains information from all settings within the LA delivering any free entitlement hours on:
• The number of free entitlement hours received under the universal 15 hours offer for three and four year olds and under the two year old offer, and the total number of hours at the setting for each child receiving any free entitlement hours.
• Background information on each child receiving any free entitlement hours including age, gender, ethnicity, special educational needs (SEN), whether eligible for the Early Years Pupil Premium (EYPP), and home postcode (from which rurality of residence can be derived).
• Information on type of provider and opening hours and weeks.
The ad hoc additional data collection for children using extended free entitlement hours collected information on:

38
• The number of extended free entitlement hours taken under early implementation.
• Whether the extended hours were being taken only during term time or spread throughout the year.
Children were matched just once between the regular census collection and the ad hoc additional census collection to create a combined “extended hours place” which could be with a single provider or involve shared care across two providers. In the case of shared care, the provider characteristics used in the analysis were those of the provider delivering the extended hours. Even this limited degree of matching presented some substantial challenges and further details on the preparation of the census data are documented in Annex A.
The following caveats on the census data should be noted:
• The background information for 3 percent of children using extended hours was missing because these children could not be matched to the regular census collection, either because of errors in the recording of their details used for matching or, possibly, because they were using a provider in a different LA for the initial hours.
• The provider type was missing for 4 percent of providers delivering extended hours because the provider could not be matched with the regular census collection, most likely because the provider was only delivering extended free entitlement hours and no hours under the universal or two year old offer.
• There was no matching of children beyond two providers which means that (a) there may have been some over-counting of places if children used more than one provider for the extended hours and (b) there may have been some undercounting of the childcare hours for a child if hours at a third (or further) provider were omitted. However, evidence from the evaluation survey of parents suggests that these biases are likely to be small as only 1 percent of children received free entitlement hours from more than two providers. In addition, it should be noted that the total childcare hours for each child in the census data do not include any hours of formal childcare with a provider where none of the hours for that child are free entitlement.
More generally, it should be noted that the statistics from the census data presented in this report may have small discrepancies with those published elsewhere, not only due to the limited matching, but also because LAs may count places and children using extended hours in a slightly different way (for example, including providers delivering only the universal initial 15 hours of an extended hours place) and because the Early Years Census data for 2017 used here were only a preliminary version.

39
The census data were used to analyse several aspects of the delivery of the extended hours:
• They provided a profile of the types of providers delivering the extended hours in terms of type of provider, partnership working and opening times / weeks. They also permitted a comparison of these providers with other free entitlement providers in the LA not delivering extended hours and a comparison of changes in partnership and opening times / weeks since 2016.
• They provided information on other free entitlement provision for the providers of extended hours and changes in other free entitlement provision since 2016 for these providers.
• They provided a profile of the children receiving extended hours in terms of age, gender, eligibility for EYPP, SEN, ethnicity and rural residence.
The evaluation conducted both a survey of childcare providers delivering the extended hours and a survey of parents using the extended hours. The two surveys were conducted separately but in parallel. Providers who did not have children taking up the extended entitlement at their setting and parents who were not (yet) using any extended hours were not eligible to take part in the survey. Both surveys used a mixed mode approach with potential participants initially invited to complete the survey online and subsequently followed up with an option to complete by telephone.
The provider survey was undertaken in February and March 2017, following a pilot of the survey in November and December 2016. It took respondents between 5 and 25 minutes to complete, with the average (median) length being 7 minutes. The survey covered the following areas:
• Background information about the provider.
• Provider’s engagement with the policy.
• Provider’s approach to delivering the extended hours.
• Impacts of the policy on providers.
The parent survey was undertaken in January to March 2017, following a pilot of the survey between November and January. The survey took respondents between 5 and 35 minutes to complete, with the average (median) length being 11 minutes. The survey covered the following areas:
• The use of childcare at different formal providers and with informal carers (that is, care by relatives or friends which is typically unpaid).
• Take-up of free entitlement hours.

40
• Changes in childcare use and in parental employment.
• Impacts of the policy on parents’ childcare use, working hours, financial circumstances and the child.
Key statistics on sample sizes and response rates are presented in table 2. Overall, response rates were high with the exception of the survey of parents in one LA where the response rate was limited because no telephone numbers were available for telephone follow-up. Further details on the conduct of the surveys and survey response numbers and rates by LA are presented in Annex A.
Table 2: Provider and parent survey statistics
Survey Number of responses
(range across LAs)
Response rate (range across LAs)
Proportions of online and telephone responses
Providers delivering the extended hours
561 (20–107)
80% (71%–89%)
45% online 55% telephone
Parents using the extended hours
2,257 (69–746)
69% (68%–83% except one LA with 44%)
64% online 36% telephone
It should be noted that some of the sample sizes for individual LAs are quite low (only 20 providers in one LA for the providers survey and only 69 parents in one LA for the parents’ survey). The low numbers reflect, in part, the number of providers and parents that the LAs would provide contact details for, but the number of providers is also notably lower in some LAs because the extended hours were clustered within a few providers (as will be explained further in the following chapter). For this reason, the breakdowns for the analysis of the survey of providers are only presented in the Annexes and broad descriptions of the variation across LAs are referred to in the main text. In addition, the findings for individual LAs from this survey should be treated with caution when the sample number is low.
It should be noted that the surveys and censuses collect similar information in different ways in three important respects which means that the statistics from the different sources do not always correspond exactly.
First, the sample sizes for providers and parents are lower in the surveys than in the census data because the census data had, by design, complete coverage (rather than a less than 100 percent response rate) and because the survey samples were drawn from lists of delivering providers and parents using the extended hours in autumn 2016, and numbers will have increased by the census day in January 2017.
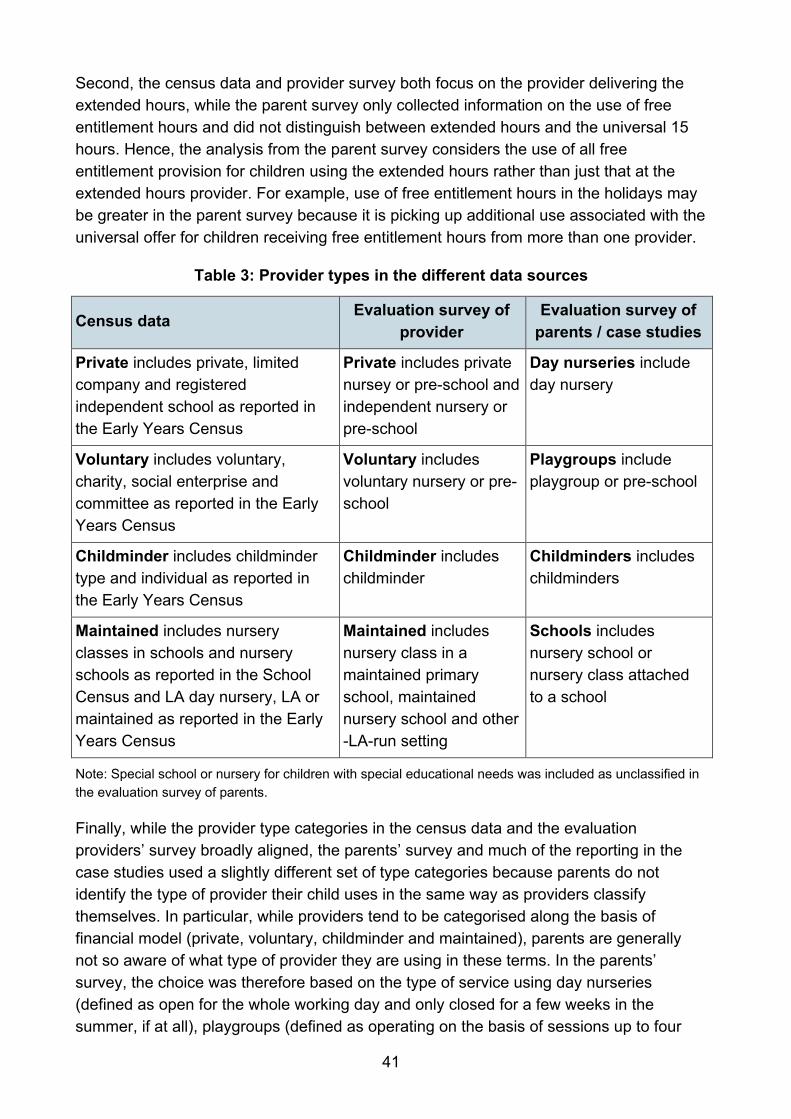
41
Second, the census data and provider survey both focus on the provider delivering the extended hours, while the parent survey only collected information on the use of free entitlement hours and did not distinguish between extended hours and the universal 15 hours. Hence, the analysis from the parent survey considers the use of all free entitlement provision for children using the extended hours rather than just that at the extended hours provider. For example, use of free entitlement hours in the holidays may be greater in the parent survey because it is picking up additional use associated with the universal offer for children receiving free entitlement hours from more than one provider.
Table 3: Provider types in the different data sources
Census data Evaluation survey of provider
Evaluation survey of parents / case studies
Private includes private, limited company and registered independent school as reported in the Early Years Census
Private includes private nursey or pre-school and independent nursery or pre-school
Day nurseries include day nursery
Voluntary includes voluntary, charity, social enterprise and committee as reported in the Early Years Census
Voluntary includes voluntary nursery or pre-school
Playgroups include playgroup or pre-school
Childminder includes childminder type and individual as reported in the Early Years Census
Childminder includes childminder
Childminders includes childminders
Maintained includes nursery classes in schools and nursery schools as reported in the School Census and LA day nursery, LA or maintained as reported in the Early Years Census
Maintained includes nursery class in a maintained primary school, maintained nursery school and other -LA-run setting
Schools includes nursery school or nursery class attached to a school
Note: Special school or nursery for children with special educational needs was included as unclassified in the evaluation survey of parents.
Finally, while the provider type categories in the census data and the evaluation providers’ survey broadly aligned, the parents’ survey and much of the reporting in the case studies used a slightly different set of type categories because parents do not identify the type of provider their child uses in the same way as providers classify themselves. In particular, while providers tend to be categorised along the basis of financial model (private, voluntary, childminder and maintained), parents are generally not so aware of what type of provider they are using in these terms. In the parents’ survey, the choice was therefore based on the type of service using day nurseries (defined as open for the whole working day and only closed for a few weeks in the summer, if at all), playgroups (defined as operating on the basis of sessions up to four

42
hours), childminders or school-based provision. Although both day nurseries and playgroups can be run privately, by voluntary organisations or by the LA, the fact that most day nurseries are private and playgroups tend to be voluntary run provides some correspondence across the groups. Table 3 summarises the provider categories used across the different data sources.
2.3 Report terminology, subgroup sample sizes and identification of LAs
A few points should be noted on the terminology used in this report:
• Free entitlement hours taken over and above the 15 hours taken under the universal Free Early Education Entitlement are referred to as “extended free entitlement hours” or simply “extended hours” (as well as the “30 hours”). This is to recognise that parents may be using less than 30 hours in total under 30 hours free childcare.
• The term “childcare” is applied to all hours taken under the universal 15 hours Free Early Education Entitlement and the 30 hours free childcare and to any additional paid hours of similar provision. However, it is acknowledged that these hours may be better described as “early education” when their primary purpose is to improve child development or school readiness.
• The term “delivering extended hours” is applied to providers who have at least one child in receipt of the extended free entitlement hours at that setting. Providers who are simply willing to deliver the extended hours (and could be said to be offering the extended hours) are not included in the definition of providers actually delivering.
• The term “free entitlement providers” is applied to those providers who have at least one child in receipt of free entitlement hours either under the universal free entitlement or under the 30 hours free childcare.
In a few tables in the report, statistics are reported for subgroups with less than 50 observations. These are indicated in italics to warn that the findings should be treated with caution due to the small sample size.
Finally, the eight LAs involved in early implementation have been assigned a single letter rather than being specifically named in this report. While it is acknowledged that each LA can be identified with sufficient additional knowledge of the LAs involved in early implementation, this identification is not possible purely from the information contained within this report and it was considered beneficial to retain the anonymity of the areas to this degree.

43
3. Early implementation of 30 hours free childcare This chapter describes the national policy and local implementation of the early implementation of the 30 hours free childcare. The first section presents the policy objectives and risks. The second section describes the national elements of early implementation, while the third and fourth section consider the local model developed in each LA and the local management arrangements. The final section describes the role of the early innovator programme and the activities it involved.
3.1 Policy objectives and risks The aim of 30 hours free childcare was stated in the Childcare Bill policy statement:11
“Additional free childcare will help families by reducing the cost of childcare and will support parents into work or to work more hours, should they wish to do so.” (page 4)
The revised statutory guidance for LAs on early education and childcare published in March 201712 indicates that the policy also aims to drive greater flexibility in childcare provision to better meet the needs of working parents:
“Outcome: children are able to take up their full entitlement to a free place … at times which fit with the needs of parents to enable them to work or increase their hours of work if they wish to do so.” (page 14)
“Outcome: parents are able to work because childcare places are available, accessible and affordable and are delivered flexibly in a range of high quality settings.” (page 26)
In addition to delivering places, other objectives for early implementation included: improving flexibility to meet different child needs (including those with SEND, in homeless working families and from BME and rural communities); testing approaches to drive innovation and efficiency; and providing direct support to encourage non-working parents to enter work.
The evaluation developed a logic model to link the immediate policy outcomes to the final objectives for early implementation. This is shown in figure 6.
11 Department for Education (2015), Childcare Bill: policy statement, DFE-00177-2015, December, https://www.gov.uk/government/uploads/system/uploads/attachment_data/file/482517/Childcare_Bill_Policy_Statement_12.03.2015.pdf 12 Department for Education (2017), Early education and childcare: Statutory guidance for local authorities, DFE-00083-2017, March, https://www.gov.uk/government/uploads/system/uploads/attachment_data/file/596460/early_education_and_childcare_statutory_guidance_2017.pdf
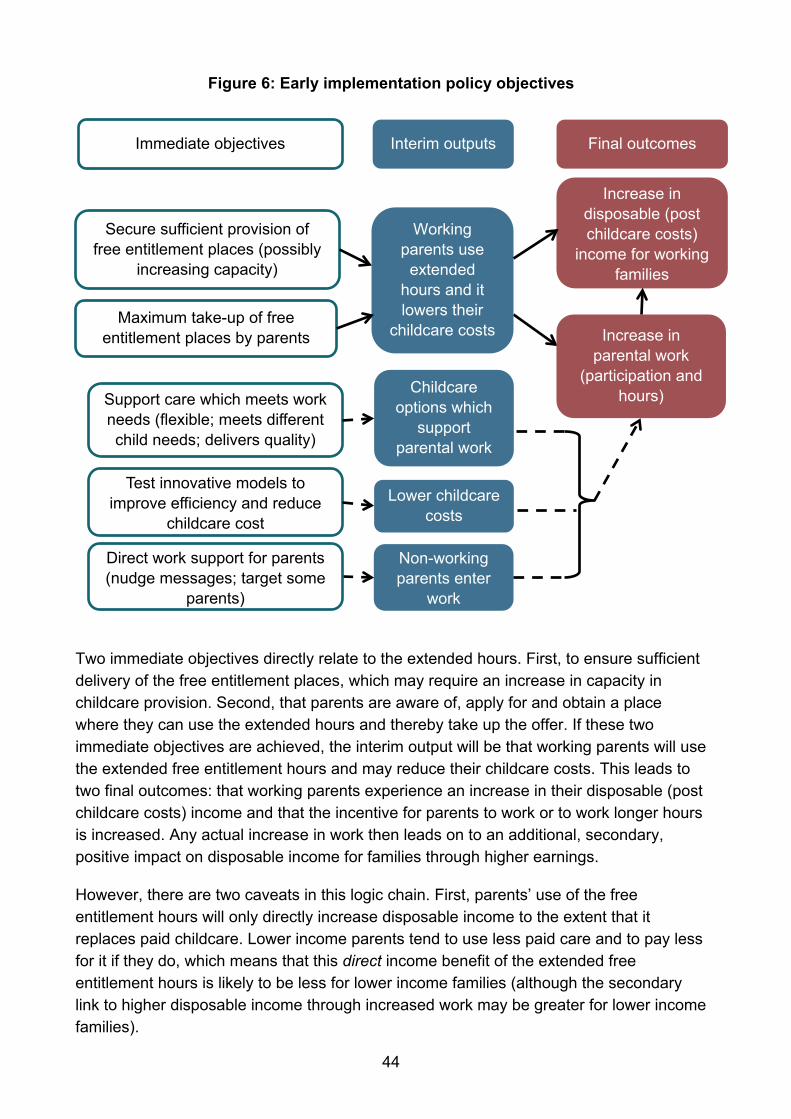
44
Test innovative models to improve efficiency and reduce
childcare cost
Support care which meets work needs (flexible; meets different child needs; delivers quality)
Secure sufficient provision of free entitlement places (possibly
increasing capacity)
Maximum take-up of free entitlement places by parents
Working parents use
extended hours and it lowers their
childcare costs
Increase in disposable (post childcare costs)
income for working families
Increase in parental work
(participation and hours) Childcare
options which support
parental work
Lower childcare costs
Non-working parents enter
work
Immediate objectives Interim outputs Final outcomes
Figure 6: Early implementation policy objectives
Two immediate objectives directly relate to the extended hours. First, to ensure sufficient delivery of the free entitlement places, which may require an increase in capacity in childcare provision. Second, that parents are aware of, apply for and obtain a place where they can use the extended hours and thereby take up the offer. If these two immediate objectives are achieved, the interim output will be that working parents will use the extended free entitlement hours and may reduce their childcare costs. This leads to two final outcomes: that working parents experience an increase in their disposable (post childcare costs) income and that the incentive for parents to work or to work longer hours is increased. Any actual increase in work then leads on to an additional, secondary, positive impact on disposable income for families through higher earnings.
However, there are two caveats in this logic chain. First, parents’ use of the free entitlement hours will only directly increase disposable income to the extent that it replaces paid childcare. Lower income parents tend to use less paid care and to pay less for it if they do, which means that this direct income benefit of the extended free entitlement hours is likely to be less for lower income families (although the secondary link to higher disposable income through increased work may be greater for lower income families).
Direct work support for parents (nudge messages; target some
parents)

45
Second, the lower childcare costs unambiguously create a greater incentive to work, but this does not guarantee that parents will work more. Much of the existing evidence suggests that substantial changes in childcare costs are required to encourage parents (primarily mothers) to work or to work longer hours13 and the extended free entitlement hours may only have a small additional impact on total childcare costs, particularly if the child already receives 15 free hours, or if the family does not pay for any or much additional care, or if the family has other children that require paid care for parents to work. In addition, for parents who are already working, there are potential work disincentives created by extended free entitlement hours. Lower childcare costs may reduce the need for income (earnings) to pay for childcare and could actually mean that parents work fewer hours.14 A second possibility is that if one parent in a couple (most likely the mother) works longer hours because of the lower cost childcare, the other parent may reduce their working hours to obtain a more balanced distribution of work hours with the same total earnings.
On the other hand, there are two timing aspects to this policy which may strengthen the work incentive. First, many mothers decide to return to work when their child starts reception class in school and the child is effectively cared for free for 30 hours during term time. The extended free entitlement hours mean that the child can begin to receive the same level of free hours of care earlier than before,15 which could change the social norm for when mothers consider returning to work, especially if the extended hours are seen as part of early education and preparation for school. However, caution should be exercised in assuming that the effect will be equivalent to an earlier school starting date because the extended free entitlement hours are not effectively compulsory like school attendance16 and the child is physically younger, which some parents may view as inappropriate for spending such long hours in care. The second timing aspect relates to the fact that mothers with young children experience quite a high degree of movement both into and out of work and not only is the birth of a first child a critical time to leave work, but the arrival of a second child for some mothers is also an important point. The offer of additional free entitlement childcare for a first child around the time (or not long after) the end of maternity leave for a younger sibling could be a sufficient additional incentive to tip the balance for mothers in favour of remaining in work.
13 For example, see the summary in table 2 in Hathaway, I., Leicester, A. and Paull, G., (2016), Feasibility study into evaluating the labour and childcare market impacts of Tax-Free Childcare and the Free Early Education Entitlement, HMRC Research Report 406, February. 14 For example, an extension to a universal entitlement to free childcare was estimated to reduce the proportion of mothers in work because of this adverse “income effect” (Paull, G. and Xu, X., (2015), Childcare Policy Options for Wales, Public Policy Institute for Wales, December). 15 As children become potentially eligible for the extended hours in the term after their third birthday and almost all children enter school reception class in the September after they turn four, 30 hours of care during term time will be available three to five terms earlier under the 30 hours free childcare for working parents. 16 Although school attendance is not legally required until the term after the child turns five, there is a strong parental perception that attendance is necessary from the September after the child turns four.

46
Overall, while the links from the use of the extended free entitlement hours to higher disposable family income and an increase in parental work may seem obvious, responses may actually be quite complicated and it is important to empirically test whether, and to what degree, take-up of the extended free entitlement hours does lead to these effects on family income and parental work.
The remaining three immediate objectives in the logic model in figure 6 highlight the additional objectives around the 30 hours free childcare and early implementation which relate more broadly to childcare provision affecting parents beyond those taking up the extended free entitlement hours. Supporting the type of childcare which meets parental work needs primarily focuses on enhancing flexibility in the childcare offer around opening hours, holidays and allowing parents the freedom to choose when they use both free entitlement and paid hours. Meeting different child needs recognises that some types of parents (those with SEND children, BME families or families living in rural areas) may have particular childcare needs in order to be able to work which are not being met. The issue of quality of care is also included here with the type of childcare that meets work needs: even if used primarily to enable parents to work, it is important to explicitly recognise that the experience for the child will affect whether parents are willing to use care in order to work. Supporting flexibility in childcare, recognising the specific needs for some types of families and enhancing the quality of care will all serve to offer the type of care which supports parental work and may lead to an increase in parental work. On the other hand, more flexible and higher quality care or care designed to meet specific needs may prove more expensive to deliver and could require a rise in fees for paid care to be financially sustainable which would create adverse incentives for parental work. Such higher cost care could require higher funding rates to make delivery financially sustainable for providers.
Testing innovative models to improve efficiency in childcare delivery and reduce delivery costs could mean lower childcare costs for all parents, regardless of whether they are working or not, if the provider passes on the savings in lower fees to parents. However, there is no guarantee that greater efficiency or lower costs will result in lower costs to parents: any benefits could accrue to profits, staff salaries or other expenditure to improve the quality of provision. These are not necessarily bad outcomes (and, indeed, the latter two would generally be regarded as good), but will not serve to reduce childcare costs for parents and encourage parental work.
The final element in early implementation was consideration of direct work support for parents including such activities as using nudge messaging and targeting the extended hours offer to particular types of non-working parents. There is some overlap in the targeting of parents facing particular barriers to working and those with particular childcare requirements.
All three of these additional immediate objectives aim to ultimately increase parental work and, as a secondary indirect effect, raise disposable income for families.

47
A broad range of potential risks have been raised about the 30 hours free childcare and these are summarised into three sets of risks in figure 7: a failure to deliver the extended free entitlement hours; negative impacts on other childcare provision; and negative impacts of the childcare experience for the child.
Figure 7: Policy risks
Failure to deliver the
free extended
hours
Funding rates not attractive
Negative impacts on
other childcare provision
Negative impacts on
the childcare
experience for the child
Providers offer places
but risk sustainability
Constraints on capacity expansion
Rise in “extras
charges” → diminishes lower cost for parents
30 hours offer more attractive
to providers
Fewer free entitlement places for two and three/four year olds
Decline in paid places or higher fees for paid hours
Adverse effect on
parental work
Providers do not offer places
Providers cut costs and quality to offer more
(low funded) hours
Short session
providers do not adapt to “30 hours
environment”
Longer hours are bad for
children (or could be
good)
Multiple providers or within-day
transfers are bad for children
Adverse effect on child
outcomes
The first set of risks covers concerns around the delivery of the extended hours. If funding rates are not set at attractive (sufficiently high) levels, providers may not be willing to offer the extended hours (either because it is financially unattractive or because parental fees offer a higher source of income) or providers who do offer the hours may find that it is not financially sustainable to do so, possibly risking going out of business. Another potential risk to delivery is that, if an expansion in the provision of childcare is needed to meet higher demand due to the extended hours, it may be constrained by shortages in the required resources (including staffing or venue space) or a lack of capital to invest in expansion. A final delivery risk is that the hours may not be completely free to parents if the extended hours are only available with additional charges or requirements to purchase accompanying paid hours. In this scenario, parents would be able to access the extended hours, but they would not lower childcare costs to the extent intended.

48
The second set of risks covers concerns that the delivery of the extended free entitlement hours may crowd out provision of other free entitlement hours (including the universal 15 hours for all three and four year olds or the free entitlement for disadvantaged two year olds) or of paid hours (or push up fees for paid hours), particularly if funding for the extended hours is more generous relative to delivery cost than that for other free entitlement hours or higher than parental fees. These may lead to higher childcare costs for parents not using the extended hours with potential adverse effects on their employment choices. In addition, fewer free entitlement places could have an adverse effect on child outcomes.
The final set of risks covers several different issues around the impacts on the childcare experience for the child. There is a risk that if funding rates are low, providers may need to cut costs to the detriment of quality. There are also risks that short session providers will need to adapt to the “30 hours environment” if they care for children for longer periods during the day rather than offering just sessional care (that is, care of just two to four hours for a child each day). In particular, there are worries that such providers may simply repeat activities for children who stay all day and not offer a balance between “learning time” and “down time”. There are also broader risks that the longer hours per se may simply be bad for some children, although there are also arguments that longer hours are good for child development and should be offered to children of non-working parents who are the ones most likely to benefit the most. Finally, there are risks that the extended hours may lead to an increase in the use of shared care where children spend time with two or more providers across the week which may be bad for children if there is inconsistency in provision between providers, or children have a poor experience when transferring between providers during the day.
It is important that these potential risks are fully investigated in evaluating early implementation of the policy, as well as assessing the achievement of the objectives.
3.2 Early implementation at the national level Table 4 summarises the policy at the national level during early implementation in relation to each of the objectives.

49
Table 4: National level policy for early implementation
Objectives Childcare Bill policy statement
Early implementation guidance
Early implementation Grant Funding Agreements
Sufficient provision (raise capacity)
Value for money Encourage new
providers / models of provision
Providers are located in LA
Deliver allocated number of extended hours places
LA funding rates Expect all funding to go to providers / criteria for rate
variation LA specific
Maximise parental take-up
Simple process for parents
Parents reside in LA No parental charges as a condition of taking up
the hours
KPI for % take-up LA specific
Support flexibility
Encourage responsiveness to
work patterns
Allow early / late days and short sessions
Support spread offers LA specific
Support specific needs
For children with SEND
Comply with SEND legislation
LA specific
Maintain quality
Requirements on staff ratios, staff qualifications +
space maintained
Registered providers meeting 2014 statutory
guidance on Ofsted ratings
Maximise parental work
“Main reason” test Work requirements for
eligibility LA specific
Innovation to reduce costs
LA specific
Test technical aspects of delivery
Review payment
processes (ensure prompt)
KPI 15% check for parent self-declaration on
eligibility
Source: Evaluation document review
Note: Further explanations of the policies and measures are given in the text.

50
Table 4 draws specifically from three document sources: the Childcare Bill policy statement published in December 2015,17 the early implementation guidance published in June 201618 and the early implementation GFAs agreed in early autumn 2016). These represent a mixture of policy intent, guidance and requirements that influenced local implementation and also evolved over time in some aspects. Most of the policy objectives were partially or entirely covered by LA-specific agreements in the GFAs (and are discussed below in the context of the local models).
Focusing on the elements which were specified in a uniform manner across all eight LAs, the most important aspects around sufficiency of provision were in the GFAs, covering the requirement to deliver the allocated number of extended hours places and the LA-specific funding rates (which are presented below in the context of the local funding rates). There was an expectation that all funding would be passed on to providers and some criteria were laid down on how the funding rates could be varied across different types of provision. The guidance also stipulated that providers delivering the extended hours should be located within the LA. The policy statement also suggested that the LA-led delivery model should seek value for money including a system that “incentivises a wide range of high quality providers to deliver the entitlement efficiently” and supports the commissioning of “innovative provider models that deliver affordable places to meet the needs of parents” (page 16).
There was also national guidance on maximising parental take-up of the extended hours: the policy statement indicated that the process should be as simple as possible for parents and the guidance was clear that providers were not to levy any additional charges to parents as a condition of taking up the extended hours. There were also KPIs in the funding agreements for take-up rates of the allocated places.
There were a few common requirements across the eight LAs for some of the other objectives. With respect to flexibility, the policy statement indicated a desire to ensure an LA-led system that “is simple and flexible for parents to use and is responsive to parents’ working patterns” (page 16). There were a few relatively minor changes in the guidance on when free entitlement hours could be delivered: in a change to existing statutory guidance, the extended hours were permitted before 7am and after 7pm (and were to be encouraged between 6am and 7am and between 7pm and 8pm) and sessions shorter than 2.5 hours were to be allowed (in order to help facilitate wraparound care). In addition, LAs were guided to support a spread offer (allowing free entitlement hours to be taken during the school holidays) and to encourage providers to be responsive in their
17 Department for Education (2015), Childcare Bill: policy statement, DFE-00177-2015, December, https://www.gov.uk/government/uploads/system/uploads/attachment_data/file/482517/Childcare_Bill_Policy_Statement_12.03.2015.pdf 18 Department for Education (2016), 3 and 4 Year Old Extended Entitlement Early Implementers: Guidance: Departmental advice for local authorities delivering the 3 and 4 year old extended entitlement from September 2016 as part of Early Implementation, June.

51
provision to parents’ work patterns. With respect to supporting families with different needs, the policy statement mentioned only children with SEND and the guidance required that provision should comply with SEND legislation. There were no changes to guidance on the quality of provision: the policy statement emphasised that requirements on staff ratios, staff qualifications and physical space would be maintained under the extended hours, while the guidance required that only registered providers meeting the 2014 statutory guidance on Ofsted ratings should deliver the extended hours.
The main national level policy element to maximise parental work was the work requirement stated in the guidance that both parents are working (or the sole parent is working in a lone parent family) and each parent earns, on average, a weekly minimum equivalent to 16 hours at the national minimum wage or national living wage19 and less than £100,000 per year. In addition, the policy statement stated that the free entitlement “must be restricted to childcare arrangements that enable parents to take up paid work, to continue in paid work or to increase paid work” and stated an intention to introduce a “main reason test” through regulations “to ensure that parents take up the additional hours of free childcare for the purpose of supporting employment” (page 9). However, this element was not implemented.
Finally, the national level policy included some requirements around testing the technical aspects of delivery for all eight LAs. The guidance requested a review of payment processes to ensure that they were prompt and there were KPIs in the GFAs to undertake random checks on the eligibility of parents who had been accepted on a self-declaration basis.
Overall, the main elements of the national level policy which were uniform across the LAs were focused on delivery by providers. Most of the other policy aspects, including parental take-up and meeting the additional objectives beyond just delivery of the extended hours, were LA specific but agreed with DfE. As will be shown in the next section, these were quite varied across LAs which meant that early implementation made best use of testing different approaches within a planned and agreed range of diversity.
3.3 Local models for early implementation The eight LAs selected for early implementation contained a range of local contexts, as summarised in table 5. The LAs varied in size, urban / rural geography, level of affluence, ethnicity and the nature of the local childcare provision.
19 This currently equates to earnings of around £120 a week (or around £6,000 per year) for parents aged 25 or older and around £110 for parents aged 21 to 24.

52
Table 5: Local context of LAs involved in early implementation
LA Key features
A Large LA, mixed urban / rural, mixed areas of affluence / deprivation, diverse childcare provision with partnership culture
B Urban, deprived, ethnically diverse, free entitlement provision mainly in schools
C Rural, prevalent seasonal work in some parts of the LA, mainly private, voluntary or independent (PVI) provision
D Small LA, densely populated, mainly PVI provision
E Large LA, mixed urban / rural, diverse childcare provision with partnerships
F Affluent, urban, mainly PVI provision
G Mainly urban, diverse childcare provision
H Small LA, affluent, urban, mainly PVI provision with established partnerships
Source: Evaluation case studies
Figure 8: LA reasons for being involved in early implementation
Sources: Evaluation document review and interviews with LA leads
To support parents in their childcare needs:
- identify / meet the needs of working parents (C D E H)
- develop flexible care (D E F G H) - develop access for children with
SEND (A B G) - develop childcare in rural
communities (C)
To support providers: - understanding financial
impact / maintaining viability (C G)
- business opportunities for local providers (H)
Broader economic reasons: - maintain stability or improve
childcare market (C D) - support parents into work
(A D E G H) - improve economy / benefit to
employers (D F)
LA perspective: - prepare for national rollout / test delivery models (A B G H) - involvement in policy making
/ on cutting edge of developments (F G)
- have capability to test extended hours (E F)

53
Information on why LAs were involved in early implementation was compiled from the LA expressions of interest, GFAs and telephone interviews with LA leads, representing potentially mixed views from within each LA and at quite an early time during early implementation. These responses are summarised in figure 8. Unsurprisingly, half of the LAs specifically had mentioned a desire to meet the needs of working parents as a reason, but every LA mentioned a more specific aspect in which they wished to support parents with their childcare needs. A few LAs (three) highlighted a desire to support childcare providers, while almost all recognised that there were broader economic reasons for their LA to be involved. Finally, half of LAs specifically mentioned that it would help them prepare for the national rollout (although this may have been a reason for all LAs, but possibly too obvious to mention), while three had reasons related simply to being involved in policy development. Overall, the reasons highlighted that the LAs had a range of local objectives for being involved with early implementation, but most were centred on developing childcare to support working parents in line with the stated national objectives.
The different approaches to delivering the extended hours across the LAs are summarised in table 6. The different methods for the rationing of places provided different types of tests for the national rollout:
• 1 LA with a universal offer (H) – universal test of delivery and take-up, but one of the reasons that the LA was selected for universal delivery was because of the small number of eligible children and this may not be nationally representative.
• 2 LAs using geographic areas (hubs) (A and G) – mini-universal test of sufficiency with a full range of providers and take-up among a full range of parents.
• 2 LAs selecting parents (rural and low income) (C and D) – testing take-up among one type of parent.
• 2 LAs approach via employers (E and F) – testing delivery among a range of providers, but the focus on parents already working means the extended hours are less likely to encourage non-working parents to enter work.
• 1 LA with more bespoke selection (B) – testing a range of providers, but providers and parents “cherry-picked” for more favourable delivery and take-up.
Overall, all LAs allowed a full range of provider types to deliver the extended hours, but the offer was limited to some specific types of parents in some areas.

54
Table 6: Local models of delivery for the extended hours
LA Rationing of places Delivery support plans
A Geographic area: Providers within 5 miles and parents within 2 miles of 4 childcare hubs around 4 nursery schools with mix of communities
Extensive provider support (training, one-to-one consultancy, helpline, workshops); quality support; peer-to-peer support
B Provider and parent selection: Providers selected for range of provider models (single / multiple sites and term / stretched offers); meeting parents’ needs; SEND work; and LA engagement. Parents selected by child eligible for 1+ year and priority to SEND or with a place already
Start-up meetings for providers; ongoing childminder support arrangements used to encourage childminders to deliver
C Rural parents: Parents in rural properties (by postcode), gradually expanded to less rural areas
Workshops for providers; one-to-one support on financial viability; digital solutions to monitor and support delivery
D Lower earning parents: Parents selected by earnings cap of £35k (initially £22.5k and then £28k)
Termly meetings, learning sets and marketing workshops for providers; externally commissioned business support workshops
E a) Via employers: Offer to eligible employees at three large employers b) Via providers: One-week window to register interest for those offering 15 hours
Termly roadshows for providers; tailored business support and financial toolkit; promotion event for employers about the offer
F Via employers: Eligible staff from 12 employers with a focus on workplaces requiring employees to work shifts at weekends
Briefing sessions for providers; drop-in sessions and workshops for parents
G Geographic area: Providers within 1.6 miles of two nursery schools + commitment to quality and demonstration of financial sustainability. Children have a place at provider already
Externally commissioned business support
H Universal: All eligible parents (estimate of 1,480 places)
Business advice, testing provision by out-of-school clubs; development of Childcare Widget to provide information on services
Sources: Evaluation document review, interviews with LA leads and case studies

55
The final column of table 6 indicates some variation in the measures used to support the delivery of the extended hours. The recruitment of providers involved a mixture of using regular communication channels and special events, but there was some variation in intensity across LAs. Almost all LAs offered some business support to providers, including consideration of how to adapt their provision to deliver the extended hours; the implications of the extended hours for financial sustainability; and how to consider building capacity if needed.
Table 7 presents the funding rates across the eight LAs during early implementation. In this table, the LAs have been arranged in an order which allows the funding rates to be classified into particular groups.
Table 7: Funding rates during early implementation
LA National rate to LAs
Local initial 15 hours in
extended offer
Local extended hours in
extended offer
Local universal 15 hours
C £4.01 £3.74 £3.15
E £4.14 £4 £3.16–£3.88
H £4.07 £4 £3.38
D £4.88 £4.88 £3.77
F £4.41 £3.85 / £4 * £4.41
£3.85 / £4 * £4 / £4.35 / £4.70 *
G £3.88 £3.88
£3.36–£4.95 £4.04
A £4.84 £4.59–£7.80
£5.05 ** £4.88 £4.59–£7.80
B £5.17 £3.51–£7.23 £5.17 £3.51–£7.23
Sources: Evaluation interviews with LA leads and case studies
Notes: Some rates also have supplements and ranges are across provider types. * Higher rates for longer days and / or in holidays. ** Plus higher rate for nursery schools. Changes in April are shown in italics.
The national rate paid from DfE to the LAs was a single rate for all 30 hours for children using an extended hours place, ranging from £3.88 to £5.17. Drawing comparisons between these national rates and those then paid to providers (the “local” rates) is complicated by several factors:
• Three LAs paid different rates for the initial 15 hours and the extended hours within a 30 hours place.
• Most LAs paid different rates from those for the universal 15 hours offer.

56
• Several of the rates are ranges because they vary across provider types.
• Most rates have some type of supplement potentially added.
• Three LAs changed their rates in April (shown in italics in the table).
Broadly speaking, there are three points of note:
• There was a mix in the level of the local rate relative to the national rate: three LAs paid a lower rate, two LAs paid an equal rate and one paid a higher rate, while the comparison was not clear cut in the remaining LAs.
• The rate for the extended hours places was generally higher than that for the universal 15 hours only places. This could potentially help sufficiency in the delivery of the extended hours places, but could also potentially lead to negative impacts on the delivery of other types of free entitlement provision.
• Three LAs operated a system with different rates for the initial 15 and extended hours within the extended hours places and needed to address the issue of identifying which was the initial 15 for payment purposes.
The measures undertaken by LAs to support the additional objectives beyond the delivery of the extended places are listed in table 8. The most prevalent area is measures supporting flexibility: indeed, all the LAs had some approach to improving the flexibility of provision. Half of the LAs had specific measures to help improve access for children with SEND while half also had specific measures to support parents to enter work. There were no specific measures for supporting innovation to improve efficiency of delivery (although this may have been implicit in the business support for providers) or for support for BME families or those living in rural areas (outside of the LA with rural focus). There is some variation in the mixture and intensity of these additional measures across LAs, with three LAs only focused on flexibility and three considering three or more themes, while some LAs have several activities within a theme and others very few.
Finally, the LAs were also testing two technical aspects of delivery:
• Local eligibility checking of parents was undertaken using a variety of approaches including requiring evidence of eligibility on application; confirming eligibility with employers; and sample requests for evidence from parents. According to the interviews with LA leads, most LAs saw this process as quite burdensome and there were questions around its robustness, which supports the need for the national system to be introduced in the Childcare Services system.
• Most LAs were using a payment process which involved an initial payment (of 50 percent to 80 percent) near the start of the term with the remaining payment made after the headcount later in the term, while two LAs were making the entire payments later in the term and one LA was making a monthly payment.

57
Table 8: Local additional measures
LA Focus – additional measures
A
Flexibility – development of partnership models building on the hub model SEND – 15+ places for children with SEND and SEND parent champion scheme Quality – quality improvement workshops and CPD Parent work – hub / SSCC offer “return-to-work” training; support places for 2 year old offer children
B
Flexibility – believed would be achieved through inclusion of day nurseries and childminders who provide a flexible offer SEND – 20 priority places; family focus groups; training and professional development; audit of SEND provision to identify areas of support for providers
C Flexibility – broker access for parents and developing partnerships models including exploring childminders working 50% of the week from other premises
D Flexibility – develop partnerships between group and home-based providers Parent work – work incentive group and innovation grant for providers to explore innovative ways to encourage parents back to work
E Flexibility – support parents to access flexible care; developing provider models of flexible care
F
Flexibility – assess parents’ need for and providers’ willingness to deliver provision at atypical hours SEND – ensure 10 places for SEND Parent work – employers using offer to attract new staff and retain staff
G
Flexibility – develop hubs to facilitate partnership working SEND – identify children and support needed; programme of SEND training and coaching Parent work – 25 places and support to re-enter work, working with employment agencies
H Flexibility – pilot of out-of-school clubs; using a well-established partnership model to test flexibility; provider support to increase flexibility
Sources: Evaluation document review, interviews with LA leads and case studies
3.4 Local programme management arrangements LAs had typically set up strategic and operational fora (e.g. advisory, governance and working groups) to oversee and support the implementation of the programme. The number of groups in each LA and its composition varied but they all aimed to:

58
• Involve senior local authority managers from key functions (such as children’s services, education, finance) and in some cases cabinet members for children’s services, as support and involvement at the strategic level was believed to be essential for the success of the programme.
Ensure representation of operational managers from a range of services and functions (such as children’s centres, Family Information Services, communication and business teams) to: “… bring all the stakeholders together from a more strategic point of view to make sure that we're not getting siloed in one way of thinking for Early Years” (early implementation manager).
• Involve representatives of different parts of the early year and childcare sector to ensure local providers were “on board” and had the opportunity to give feedback on key implementation decisions (such as funding level and payment system) and to test out ideas, for example, on effective ways to engage providers and parents.
The team responsible for early implementation typically included a lead with strategic responsibility for the programme development and delivery, as well as a day-to-day manager with responsibility for other early years projects alongside the early implementation.
3.5 Early innovators Under the early innovator programme, funding was provided to 32 LAs, including the eight LAs involved in early implementation, to explore innovative approaches to support the national rollout of the 30 hours free childcare and test how best the policy can be supported in different local contexts. These funding amounts varied from £72k to £150k.
The LAs were required to collect market intelligence around parental demand and sufficiency; test different approaches to generate learning to help implementation of the national rollout of the 30 hours free childcare; and share learning both locally and with other LAs. There was considerable variation in the approaches taken to gather labour market intelligence including a mixture of building on existing data collection processes and ad hoc approaches to collect information in a more direct and specific manner. The number of themes (sufficiency, parent engagement flexibility, back to work support, SEND and targeted support to other types of families) and activities within these themes considered to test innovative approaches also varied considerably across LAs. Some LAs had quite focused activities, while others covered a much broader range. Figure 9 presents the six main themes, a summary of the activities in each theme and the number of LAs undertaking that activity, noting that LAs could be involved with multiple activities both within and across themes.

59
Figure 9: Early innovator themes and activities
Source: Evaluation document review
For the eight LAs involved in early implementation, there was not always a clear distinction between early implementation and the early innovation programme. The early innovator funding was useful to early implementation in different ways across the LAs (as summarised in table 9), but several LAs did not mention a specific innovative activity supported by the early innovator funding. Indeed, as will be shown later, the early innovator funding was most important for these LAs for helping to deliver the early implementation of places rather than testing innovative approaches to support 30 hours free childcare.
0 10 20 30 40
support
SEND
to work
lexibility
gement
ficiency Provider engagement
Delivery support
Capacity expansion
Marketing / take-up
Brokerage / finding places
Identify needs
Provider support Partnerships Hubs /
clusters
Work with agencies
Work with employers
Parent nudge
Needs audit
Provider / delivery support
Parent support
BME
Cost reduction
Building utilisation
Saturday sessions
Out-of-school clubs
Multiple carers’
guidance
Funding review
Rural areas
Low income families Targeted
Back
F
Parent enga
Suf
Number of LAs with activity

60
Table 9: Usefulness of early innovator funding
LA Usefulness of early innovator funding
A Difficult to separate the early implementation and early innovator funding, but latter helped to support SEND and CPD elements
B Used to undertake a SEND audit, focus groups and provide SEND training to PVI settings
C Allowed more provider support and addition of quality support
D Used to cover staffing costs and a communications and development plan
E Funding was critical to running the programme
F Enabled work on parental engagement and helped to cover additional staff costs to run the programme
G Enabled work and co-ordination without taking funding from providers
H Had a positive impact – enabled work on out-of-school clubs and raising provider business awareness
Sources: Evaluation document review, interviews with LA leads and case studies

61
4. Were providers willing to deliver the extended hours? This chapter explores the evidence from early implementation which can inform on the likelihood that providers will be willing to offer the extended free entitlement hours for the national rollout in September 2017. The first section presents the numbers of providers involved in the delivery of the extended hours during early implementation, while the following sections describe the characteristics of these providers and how they were engaged in delivery. Subsequent sections consider providers’ responses to the policy and the key issues which will affect providers’ willingness to deliver extended hours in the national rollout. The final section offers some recommendations on approaches to facilitate provider participation in the national rollout.
4.1 Delivery during early implementation By the time of the census in January 2017, the numbers of places delivered were close to the allocated number that DfE had provided funding for in the seven LAs with a limited number of places (table 10). In the LA offering places to all eligible children, the number of places substantially exceeded the DfE estimated number that would take up the extended hours, with 50 percent of all three and four year olds using the universal free entitlement taking up the extended hours and 80 percent of free entitlement providers delivering extended hours. In some of the larger LAs with a limited number of places, the extended hours places constituted a very small proportion of all three and four year olds using free entitlement hours (just 2 percent in LA A and 3 percent in LA E). Overall, the census data indicate that almost 5,000 extended hours places were delivered in January 2017, exceeding the original total of allocated and estimated number of places.
Table 10: Numbers of extended hours places by LA
A B C D E F G H All LAs
Number of allocated / estimated places
515 455 675 415 415 415 621 1,036 4,547
Number of places delivered in January 2017
480 404 654 385 420 320 583 1,678 4,924
As a percentage of all 3 or 4 year olds using free entitlement hours
2% 6% 15% 11% 3% 8% 12% 50% 8%
Sources: Early Years Census, School Census and additional evaluation data collection, January 2017
Notes: LAs A to G had an allocated number of places, while DfE estimated that LA H with the universal offer would deliver 1,036 places from an estimated 1,480 eligible families (assuming 70 percent take-up).

62
The number of providers delivering extended hours varied considerably across the seven areas with rationed places (from 43 to 136 providers) (table 11), reflecting, to some extent, both the rationing method applied in the area (described in the previous chapter) and the type of providers delivering the extended hours. The rationing by geographic area in LAs A and G would be expected to concentrate the children taking the extended hours into fewer providers and this could explain the lower number of providers in LA G in particular. The proportion of all free entitlement providers offering the extended hours also varied across the seven LAs with rationing, from 9 percent of providers in LA A to 51 percent of providers in LA C, reflecting to some extent the size of the LA as was the case with the proportion of children taking extended hours. In LA H with the universal offer, 80 percent of providers offering any free entitlement hours were delivering the extended hours to at least one child.
Table 11: Numbers of providers delivering extended hours by LA
A B C D E F G H All LAs
Number of providers offering extended places
97 43 133 80 136 114 44 182 829
As a percentage of all providers offering free entitlement places
9% 25% 51% 48% 15% 47% 18% 80% 36%
Sources: Early Years Census, School Census and additional evaluation data collection, January 2017
On average, each provider offered extended hours to six children, constituting an average of 44 percent of the three and four year olds who were receiving any free entitlement hours from them (table 12). However, this number varied from 1 to 60 across providers and some providers delivered the extended hours to all of their three and four year olds with free entitlement places (cases where the proportion was 100 percent). The spread of extended hours places varied across the LAs, with providers in LAs E and F delivering an average of 3 places each, while those in LA G delivered an average of 13 each. In LA H with the universal offer, providers were delivering the extended hours, on average, to 65 percent of the three and four year olds receiving any free entitlement hours.
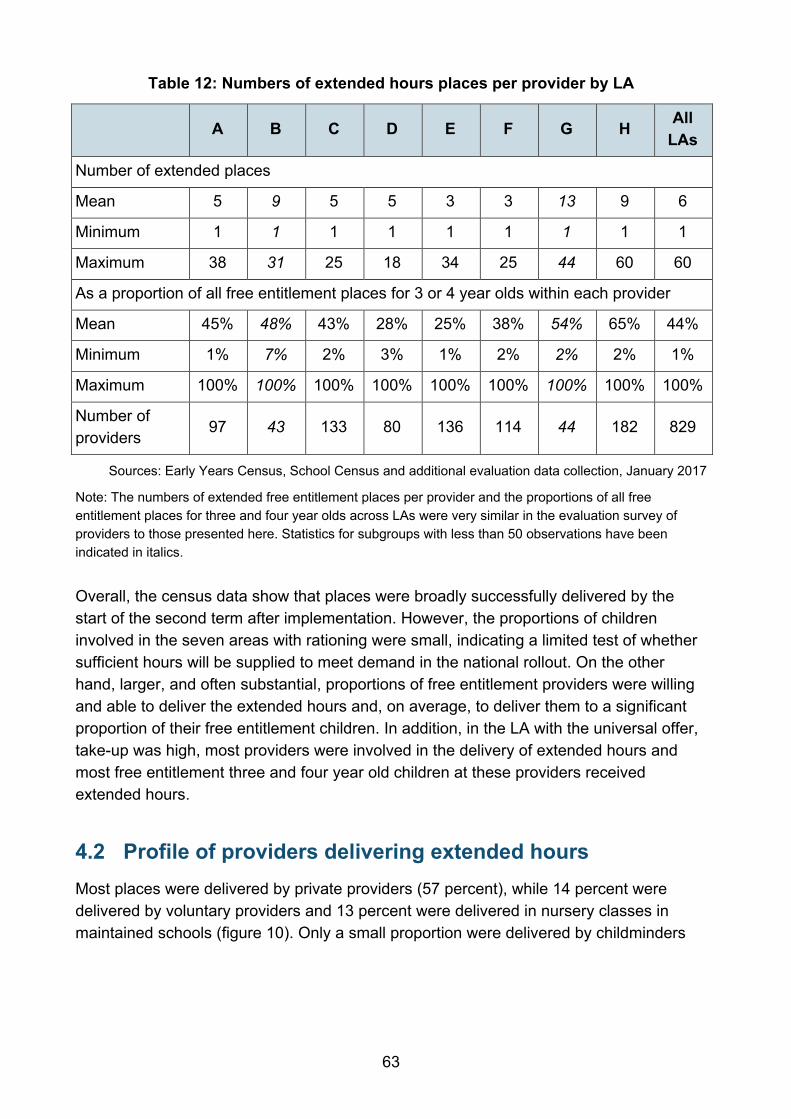
63
Table 12: Numbers of extended hours places per provider by LA
A B C D E F G H All LAs
Number of extended places
Mean 5 9 5 5 3 3 13 9 6
Minimum 1 1 1 1 1 1 1 1 1
Maximum 38 31 25 18 34 25 44 60 60
As a proportion of all free entitlement places for 3 or 4 year olds within each provider
Mean 45% 48% 43% 28% 25% 38% 54% 65% 44%
Minimum 1% 7% 2% 3% 1% 2% 2% 2% 1%
Maximum 100% 100% 100% 100% 100% 100% 100% 100% 100%
Number of providers
97 43 133 80 136 114 44 182 829
Sources: Early Years Census, School Census and additional evaluation data collection, January 2017 Note: The numbers of extended free entitlement places per provider and the proportions of all free entitlement places for three and four year olds across LAs were very similar in the evaluation survey of providers to those presented here. Statistics for subgroups with less than 50 observations have been indicated in italics.
Overall, the census data show that places were broadly successfully delivered by the start of the second term after implementation. However, the proportions of children involved in the seven areas with rationing were small, indicating a limited test of whether sufficient hours will be supplied to meet demand in the national rollout. On the other hand, larger, and often substantial, proportions of free entitlement providers were willing and able to deliver the extended hours and, on average, to deliver them to a significant proportion of their free entitlement children. In addition, in the LA with the universal offer, take-up was high, most providers were involved in the delivery of extended hours and most free entitlement three and four year old children at these providers received extended hours.
4.2 Profile of providers delivering extended hours Most places were delivered by private providers (57 percent), while 14 percent were delivered by voluntary providers and 13 percent were delivered in nursery classes in maintained schools (figure 10). Only a small proportion were delivered by childminders

64
(7 percent) and very small proportions by independent schools, nursery schools and other LA-run provision (including children’s centres).20
Figure 10: Types of providers delivering extended hours places
Sources: Early Years Census, School Census and additional evaluation data collection, January 2017
Note: Sample size is 4,924 places.
The average (mean) number of extended hours places delivered by each provider was higher for private and maintained providers (8 places) and for voluntary settings (6 places) than for childminders (2 places). This meant that, as a proportion of the number of providers delivering the extended hours places rather than as a proportion of the places, childminders were more important, constituting 28 percent of all providers offering the extended hours while private providers constituted 41 percent and voluntary providers and nursery classes in schools each constituted just over 10 percent of providers.
Tables 13 and 14 present the distribution of providers and places across provider types for each of the LAs. The differences between LAs in the patterns across types is very similar for both providers and places, with the proportion of places consistently higher for private providers and lower for childminders than the proportions of providers, reflecting the variation in the number of places per provider described above. Both tables are presented because they highlight how providers are important in different ways: while the
20 Further details on these types are provided in section 2.2.
0%
10%
20%
30%
40%
50%
60%
Perc
enet
age
of p
lace
s

65
proportion by providers shows how the policy needs to engage different numbers of providers of each type, the proportion by places highlights how important some sectors are in their contribution to the number of extended hours places. For example, in LA H, private settings constituted less than one quarter of providers and delivered half of the places, while childminders constituted almost half of providers but delivered less than a tenth of places.
Table 13: Types of providers delivering extended hours by LA
A B C D E F G H All LAs
Private 51% 47% 34% 48% 51% 27% 52% 24% 39%
Voluntary 4% 5% 17% 21% 15% 17% 2% 16% 14%
Independent 2% 0% 0% 1% 4% 0% 0% 3% 2%
Childminder 35% 21% 16% 18% 9% 39% 14% 44% 27%
School nursery class
5% 9% 30% 1% 11% 7% 23% 11% 12%
Nursery school 3% 14% 0% 0% 1% 0% 5% 1% 2%
Other LA-run 0% 0% 1% 8% 0% 1% 0% 0% 1%
Unclassified 0% 5% 3% 4% 9% 9% 5% 2% 4%
Total
100%
100%
100%
100%
100%
100%
100%
100%
100%
Number of providers
97 43 133 80 136 114 44 182 829
Sources: Early Years Census, School Census and additional evaluation data collection, January 2017
Note: Statistics for subgroups with less than 50 observations have been indicated in italics.
Notes: Information for school nursery classes and nursery schools is from the School Census while the information for all other types is from the Early Years Census (with the exception of “governor run” in the Early Years Census in LA E which are included under school nursery classes). The unclassified settings are those which were not included in the main census because they had no children funded by the universal 15 hours and therefore did not have a provider type recorded. LA A had 23 percent of settings unclassified in the census data, but the LA directly reported that these were childminders and they have been re-classified as such. LA E also directly identified two providers in the Early Years Census as nursery schools and they were re-classified as such. The evaluation survey of providers had a similar distribution of providers delivering extended hours with 38 percent private, 13 percent voluntary, 4 percent independent, 30 percent childminders, 7 percent school nursery classes, 4 percent maintained nursery schools, 2 percent other LA-run and 3 percent unclassified.

66
Table 14: Distribution of extended hours places across provider types by LA
A B C D E F G H All LAs
Private 61% 52% 40% 63% 71% 56% 62% 51% 55%
Voluntary 4% 3% 19% 17% 13% 15% 2% 21% 14%
Independent 1% 0% 0% 4% 2% 0% 0% 4% 2%
Childminder 11% 5% 5% 5% 3% 18% 2% 8% 7%
School nursery class
5% 9% 31% 1% 4% 7% 21% 12% 13%
Nursery school 18% 26% 0% 0% 3% 0% 10% 3% 6%
Other LA-run 0% 0% 0% 9% 0% 1% 0% 0% 1%
Unclassified 0% 4% 5% 1% 3% 3% 3% 2% 3%
Total
100%
100%
100%
100%
100%
100%
100%
100%
100%
Number of children
480 404 654 385 420 320 583 1,678 4,924
Sources: Early Years Census, School Census and additional evaluation data collection, January 2017
Note: See notes to previous table.
The patterns across different types of providers appears to reflect a mixture of the economic context, existing patterns of provision and the model used to ration the extended hours places in seven of the LAs. In particular:
• The proportions of providers which are nursery schools and the proportion of places in nursery schools is higher in LAs A, B and G than in other LAs. In the case of A and G, this reflects that extended hours places were only offered at providers or to parents within a specific distance of nursery schools or related hubs (which was driven in turn by the nature of provision in the areas). In the case of LA B, the relative importance of this type of provision reflected the mainly school-based approach to free entitlement provision.
• The delivery of extended hours in nursery classes in schools is particularly prevalent in LAs C and G. In the case of G, this may reflect the rationing model based around nursery schools, but also the quality requirements placed on places and the priority given to children already with a place at that provider.
• Provision of extended hours by childminders is relatively higher in LAs A, F and H, which may be related to the relatively higher affluence in these three LAs. In addition, LA H has a context of strong partnership working which would also

67
support the delivery of extended places by childminders who historically have been more involved with shared care arrangements with other providers.
• A notably higher proportion of extended hours places are delivered in “other” LA-run settings in LA D, reflecting the rationing of places on the basis of an income cap for families, which increases the likelihood of places being taken up at children’s centres or other LA-run providers which are more likely to be located in less affluent areas.
• Finally, although the pattern is not as strong as some of the others just described, in the two LAs where the places were promoted only or initially through employers (E and F), there is a greater tendency than in other LAs for extended hours to be delivered by PVI providers or childminders rather than maintained settings. This may reflect that parents recruited in this way may be more likely to be using the more flexible childcare arrangements available in PVI and childminder settings in order to facilitate work.
A major influence on the type of providers delivering the hours would have been the pattern of existing local provision. Indeed, the patterns across provider types for the delivery of the extended hours may simply reflect the patterns for all free entitlement places across LAs. To explore this, table 15 presents the proportion of free entitlement providers who delivered extended hours for each provider type in each LA. The provider types have been grouped into four broader categories to remove the smaller categories.
Table 15: Proportions of free entitlement providers delivering extended hours by LA
A B C D E F G H All LAs
Private 13% 29% 63% 66% 29% 79% 27% 100% 33%
Voluntary 8% 33% 73% 77% 20% 66% 5% 100% 40%
Childminder 11% 39% 55% 40% 7% 44% 18% 82% 27%
Maintained 2% 14% 35% 15% 5% 15% 12% 45% 10%
All types
9%
25%
51%
48%
15%
47%
18%
80%
36%
Sources: Early Years Census, School Census and additional evaluation data collection, January 2017
Notes: The private category includes independent schools. The maintained category includes school nursery classes, maintained nursery schools and other LA-run.
Across all LAs, maintained providers were substantially less likely to offer the extended hours than other types of providers. On average, one in ten maintained providers offered extended hours compared to just over one third for all provider types. Across the other three provider types, private providers were most likely to deliver the extended hours in

68
half of the LAs and childminders the least likely in just over half of the LAs. Overall, voluntary providers were most likely to be involved in extended hours provision (40 percent), with private providers the second most likely (33 percent) and childminders a close third (27 percent).
These patterns indicate that some types of providers are more likely than other types to deliver the extended hours regardless of the local context and that these patterns are similar across LAs. This implies that differences across LAs in the delivery of the extended hours reflects the local mix of types of provision rather than a local effect per se. For this reason, the subsequent analysis focuses on comparisons across provider types rather than across LAs (with consequent patterns across LAs noted from tables presented in Annex B).
The evaluation survey of providers offers some additional information on the providers which were delivering extended hours at the beginning of 2017. Across all providers delivering extended hours, over half had children under the age of two while only one in ten only had three year olds (table 16). Unsurprisingly, almost half of maintained settings did not have a child under the age of three (and very few under the age of two), while private and childminder settings were very likely to have the full age range of children down to those under age two. Most voluntary providers had a youngest child aged two. Correspondingly, LAs with higher proportions of maintained settings delivering the extended hours tend to have higher proportions with no children under the age of three (LAs B, C and G in table 60 in Annex B).
Table 16: Child age profile of providers offering extended hours
Private Voluntary Childminder Maintained All types
Youngest child aged 3 2% 17% 4% 46% 11%
Youngest child aged 2 28% 64% 9% 41% 29%
Youngest child aged under 2
70% 19% 88% 13% 60%
Total
100%
100%
100%
100%
100%
Number of providers 233 72 171 69 561
Source: Evaluation Survey of Providers, 2017
Note: Maintained settings include school nursery classes, nursery schools and other LA-run settings.
Across all providers, most (57 percent) had 35 or fewer registered places, while a quarter had 36 to 60 registered places and 17 percent had more than 60 registered places (table 17). However, almost all childminders and over half of voluntary providers were in the lowest category and this was reflected in the LAs with higher proportions of these types

69
of providers having higher proportions in the lowest category (LAs A, F and H for childminders and LA C for voluntary providers in table 61 in Annex B).
Table 17: Size of providers offering extended hours
Private Voluntary Childminder Maintained All types
35 places or fewer
36% 54% 99% 29% 57%
36–60 places 35% 39% 1% 36% 25%
More than 60 places
28% 7% 0% 35% 17%
Total
100%
100%
100%
100%
100%
Number of providers
232 72 170 69 559
Source: Evaluation Survey of Providers, 2017
Notes: Maintained settings include school nursery classes, nursery schools and other LA-run settings. The number of places is the number of registered places at the setting. The number of paid staff at each setting indicated a similar pattern in size across the types of providers with the exception that the maintained settings tended to have a lower number of paid staff relative to the number of places than the other types of setting.
4.3 Providers’ reactions to the policy In response to a question in the evaluation survey about their reasons for delivering the extended hours, providers were broadly positive about the policy (table 18). Among the most commonly cited reasons for participating was a desire to support the extended hours offer (70 percent) and because it was seen as a good business opportunity (43 percent). Other reasons for participating showed the importance of the role of LAs (75 percent cited an invitation or encouragement from the LA as a reason) and of parental demand for the extended hours (68 percent cited parental requests as a reason). A final commonly cited reason indicated some competitive pressures as well: 44 percent of providers were concerned that parents would use an alternative provider offering the extended hours if they did not offer them.
The pattern of reasons for delivering extended hours was broadly similar across provider types, except that almost all maintained settings (99 percent) cited an LA invitation or encouragement as a reason compared to 82 percent and 78 percent for private and voluntary providers and only 57 percent of childminders. Across areas, the LA role was more likely to be seen as a reason for participating in LAs B and G (where maintained provision was more prevalent) and less likely in LAs E and F where the rationing approach had been employer led (table 62).

70
Table 18: Reasons providers are offering extended hours
Percentage of settings reporting (multiple) reasons
Private Voluntary Childminder Maintained All types
Invitation / encouraged by LA
82% 78% 57% 99% 75%
Wanted to support the extended hours offer
73% 67% 63% 79% 70%
Parents requested to use extended hours
65% 72% 77% 53% 68%
Concerned parents would use another provider offering extended hours
44% 42% 46% 44% 44%
A good business opportunity
42% 40% 44% 43% 43%
Information / communications from central government
26% 24% 18% 28% 24%
Information / communications from professional organisations
18% 21% 12% 12% 16%
To test the extended hours in the setting
5% 1% 1% 0% 2%
To provide continuity of care to eligible children
0% 3% 4% 0% 1%
Felt obliged to take part <1% 0% 0% 1% <1%
Number of providers
231
72
171
68
558
Source: Evaluation Survey of Providers, 2017
Note: Providers could indicate multiple reasons.

71
While the survey responses gave a broadly positive picture of providers’ reactions to the policy, the case studies21 22 explored in more depth both providers’ motivations and reservations about delivering extended hours.
Providers’ reflections showed that some consideration was given to what the policy meant for families and children:
• What does the programme mean for families? There was a great deal of enthusiasm among providers for what was seen as a long overdue policy to support working families who face large childcare bills. While there were a few dissenting voices who were asking why at a time of austerity very affluent families were given a substantial childcare subsidy, this concern alone did not appear to be a key factor in determining a provider’s decision not to offer the extended hours.
• What does the programme mean for children? It was widely believed that it would potentially benefit children’s development to be in a learning environment for longer than 15 hours each week and a longer day was a good preparation for school. There were a few providers who questioned the benefits for children of a longer day and raised concerns about the possible negative effects on behaviour, but again these concerns did not seem to determine decisions around the delivery of extended hours.
However, perhaps predictably, the factors that shaped providers’ behaviour and intentions were related to views and expectations of how the offer would affect their setting. It was the question of “what does the extended hours offer mean for my setting” that largely shaped reactions to the programme. Across all eight early implementer areas, providers’ views and intentions ranged along a spectrum from being very positive to being very negative about the offer:
• The enthusiasts: At one end of the spectrum were providers who believed that the offer was a very positive development for their setting: at the very least it would help to support demand at times of economic uncertainty, and it was likely to result
21 It should be noted throughout that the prevalence of views across respondents in the case studies is not reported in line with best practice in qualitative data analysis. Specifically, the findings from the case studies are reported without any measure of quantity for a number of reasons. First, respondents for this element of the evaluation were not randomly selected to provide statistical estimates but were purposively selected to ensure sufficient data to explore key topics and sub-groups of interest. Second, the size of the case study samples were not driven by the need to achieve statistical precision, but by the fact that in qualitative research a relatively small number of respondents is sufficient to reach “saturation point”, when analysis of additional cases does not tell you anything new. Finally, the information produced by the case studies is very rich because the data collection methods used were flexible, adapted to the context and responsive to individual cases, but this richness means that answers are not standardised and therefore cannot be aggregated to be counted in a meaningful way. 22 It should also be noted that the case studies included interviews with providers that were not delivering the extended hours in addition to those that were, in contrast to the evaluation survey of providers which was only undertaken with providers delivering the extended hours.

72
in a welcome increase in demand, which could help to fill empty places and even support expansion. These positive views were underpinned by the belief that the extended hours were financially viable because the level of funding was sufficient or because they could be delivered in a way that fitted a setting’s business model (for example, through optional charges for extras and additional paid hours). Among some schools, while financial viability was a consideration, the key attraction of the offer was that it gave them an opportunity to provide a more “modern service” to families, which could help to reverse a trend of declining numbers and boost enrolments to the nursery class, with a positive knock-on effect on the reception intake. These providers did not need any convincing to take part in the programme and they resented the fact that their enthusiasm and positive experiences were not reflected in the publicity the offer had attracted. Some felt unable to share their positive views and experiences with others in the childcare sector, as its more vocal representatives had decided to focus on the “negatives” and it was difficult for providers with positive experiences to make their voices heard.
• The undecided: Somewhere in the middle of the spectrum were providers who were uncertain about the potential effects of the extended funded hours on their setting. Some were delivering the offer while others were not delivering it but had not ruled out doing so in future. These providers were uncertain of the kind of impact the programme would have on parental demand. They thought the level of funding was not sufficient, but they had not yet fully assessed what that meant for their business, particularly when the new national funding rate would be introduced. They also had not yet (fully) considered if and how charging for extras and for additional hours could make the offer financially viable. This group also included schools that were not necessarily opposed to the policy per se, but they were working at or near capacity and could not see the benefits for the setting (nor the local community) of offering extended hours as this would mean reducing the number of places available to local children. Providers in this group needed some help in considering what the offer meant for their setting (including possible consequences of not offering the extended hours), but could generally be persuaded to at least “give it a go” particularly if they had places to fill and early implementation gave them the chance to test the offer and decide if and how to be involved with the offer in future.
• The critics: At the other end of the spectrum were providers who were adamant that it would not be financially viable for their setting to deliver the extended hours. These included private day nurseries and private schools that offered a more expensive service involving higher costs (such as those with small class sizes, specialist lessons or organic food) which was integral to their delivery model and could not be artificially separated out so parents could opt out of paying, as required by DfE guidance. However, the group also included day nurseries and childminders who did not think they were providing a particularly high-cost service,

73
yet believed that the gap between LA funding and their cost to deliver the extended hours was too large and would represent a serious risk for their business. The group also included maintained schools that did not see it as their role to provide “childcare” for working parents. It remains to be seen if and what effect parents demanding the extended hours will have on this group. Some private nurseries that had initially turned down the LA offer to be part of the programme changed their mind when some of their families became eligible for the extended hours. Concerns with declining enrolments may have a similar effect on some schools. However, it could be that settings catering for very affluent families and oversubscribed schools (particularly in areas with rising populations) will continue to opt out or refuse to deliver the extended hours.
• Finally, there was a fourth group: the outsiders. It was hoped that early implementation would help to test the willingness of out-of-school clubs to engage with the offer by co-delivering the extended hours with other settings, particularly schools. However, there seems to have been very limited promotion of the programme to out-of-school clubs. One LA tested a model for involving out-of-school clubs in the programme, but this generated limited interest with one in ten clubs signing up for the scheme, showing that considerable work will be required in future to engage these settings in the policy. It should be noted that some day nurseries also offered out-of-school provision and they could provide useful learning for out-of-school clubs that may want to get involved in future, for example on catering for pre-school and school age children in the same setting.
Many of the themes observed for the LAs involved in early implementation were also apparent among those just involved in the early innovator programme.
Evidence from the early innovator programme indicated a low degree of confidence among the LA leads around the recruitment of providers to deliver the extended hours. Around one third of the LA leads reported in the interviews in January and February 2017 that providers were broadly positive about offering the extended hours, but most reported a more mixed or uncertain set of views. However, the key theme at the time of the interviews was that providers were waiting to hear about the EYNFF and the levels of funding that they might receive before they could decide whether they were willing and able to offer the extended hours.
The early innovators also reported a mixture of reactions from across and within different types of providers:
• Some reported that PVIs see the extended hours as a good business opportunity, but others reported that these providers were concerned about the adequacy of the funding and ability to cover costs. One LA reported that a high proportion of PVIs had said they would not offer the extended hours because they can charge higher rates to parents.

74
• Some providers did not open for 30 hours and thought that they would not have enough eligible parents to make it worth opening for longer.
• Voluntary providers were reported to be often run by committee members who may have little understanding of the business aspects of what they are doing or the financial implications of offering the extended hours.
• Childminders were reported to be concerned that they will not have the capacity to deliver the extended hours.
Schools were typically reported to be less keen to participate, sometimes because they were already full and were offering only morning or afternoon sessions. Growth in school numbers also meant that childcare provision had moved out of the school in some places. Others reported that maintained schools are not sure if parents will want more than 15 hours from them and one LA reported that
“Some schools are frankly telling parents that they do not believe in the 30 hours and so they are not engaging in the offer.”
• On the other hand, a few LAs reported that schools were surprisingly keen, some because they saw it as a good business opportunity and some because they had been losing children due to the lack of a full-day offer. It was also reported that some schools were already offering a full day with payment.
Among the early innovators, there appeared to be some correlation between the political culture of the LA and the emphasis placed on private or maintained settings as principal providers for the policy. Responses from the LA leads suggested that there is greater trust in the private sector in some areas while there is greater trust in the public sector schools in other areas. Clearly this affects the relationship between the two and may have an effect on the ease with which the LA works with different types of providers. It was generally accepted that where schools are the preferred settings, they are generally less flexible than private sector providers. However, it was also noted by one LA that solutions for the delivery of the extended hours will depend upon the mix of provider types within the LA.
The evidence from the early innovators also included:
• LA leads noted that provider responses were complicated by other ongoing factors affecting financial sustainability, including the business rate rise, the living wage and the new regulations around pension contributions.
• Few LAs had close active relationships with employers. The only one to have seen the policy as being marketed through employers reported difficulties with the approach.

75
• LA leads showed a strong belief that there may be a long transition period before the market for extended childcare becomes established.
4.4 Supporting providers’ engagement Responses to the evaluation survey show that most providers (71 percent) felt that they received sufficient support from their LA to deliver the extended hours, while a fifth (19 percent) felt that they would have liked more support and a tenth (10 percent) felt that they did not require any support (figure 11). Interestingly, these patterns were broadly similar across both types of providers and across LAs (table 63 in Annex B), suggesting that there was no great variation in local needs for, or approaches to, supporting providers.
Figure 11: LA support for delivery of extended hours
Source: Evaluation Survey of Providers, 2017
Note: Sample sizes are 224, 71, 169, 67 and 558 for private, voluntary, childminder, maintained and all types of providers.
Evidence from the case studies indicated that in order to engage providers, LAs needed to develop approaches which were flexible and tailored to the range of reactions and expected challenges described above. Plans for engaging providers typically included:
• LA briefings to explain the programme and the different ways in which the offer could be delivered (for example, term time only or stretched into school holidays), what settings can and cannot charge for and the limitations that can be set on how
71%
72%
70%
77%
70%
19%
21%
19%
7%
22%
10%
7%
11%
15%
8%
0% 20% 40% 60% 80% 100%
All types
Maintained
Childminder
Voluntary
Private
Received sufficient support Would have liked more supportDid not require support

76
parents can access the free entitlement hours. The experience during early implementation showed that no opportunity should be missed to communicate these key messages as providers’ readiness to engage and listen varied. While some providers were ready from the first day, it took longer for others (including some of the “undecided” and the “critics”) to be in a “listening mood” (for example, some wanted to see how parents reacted before they decided to offer the extended free entitlement hours).
• One-to-one conversations with providers were often necessary to get down to the “nitty gritty” of what the offer could mean for an individual setting. This involved discussions of optional charges and how the extended hours could be delivered to make the offer work for a setting. LAs provided help with plans to accommodate the offer, such as staff recruitment, changes in staff contracts or staff ratios, shared delivery with other settings, planning permission and lunch arrangements. It was also important to reassure providers that the pace and scale of change was under their control. Rumours that the sector would be overwhelmed and unable to meet a large increase in demand had conjured up images of flood gates opening and irate parents being unable to get a place. However, support to assess if and how the nature of demand could change helped to reassure providers that accommodating the offer was manageable and potentially not very different from changes made in the past to accommodate other policy developments. While previous policy developments, such as the two year old entitlement, had raised different issues and demand for two year old places was easier to predict, they still proved settings’ capacity to successfully adapt their offer in response to a changing policy environment.
• Business support was offered in some areas. This was delivered by LA staff and externally commissioned business support was provided in some cases as it was believed that providers would feel more comfortable and / or have greater confidence in independent business advice. While not all providers felt they needed business support (e.g. well-established profitable businesses and those that were part of a nursery chain), it played an important part in helping others to develop a plan for offering the extended hours which took into account both the need to adjust to the change in the balance in the two different income streams (LA funding and parental fees) and the need to adapt delivery for longer and more flexible hours. Business support also enabled providers to understand their operational costs and their breakeven point, and this understanding was critical to overcoming their concerns about the offer not being financially viable.
Early implementation also showed that some technical aspects of the policy delivery could potentially negatively affect participation if not effectively implemented:
• Views on the LA systems set up for confirming families’ eligibility for the free entitlement hours to providers were mixed. Some providers reported that the

77
system worked well, but others thought it was very time consuming as they had to set up and manage an additional system for the extended hours. The findings also show the importance of settings having confidence in the system for confirming eligibility, as it could be very off-putting for providers to be dealing with a system that may not promptly confirm parents’ eligibility or changes in eligibility status. For example, when providers had to offer free entitlement places on the basis of parents saying they were eligible, with LA confirmation coming later, providers were left wondering who would be paying for the free entitlement hours if it turned out that a family was not eligible.23
• Some of the monitoring and payment systems set up for early implementation were ad hoc and manual. They were reported to be inefficient and unreliable, generating substantial amounts of additional paper work and resulting in late payments and lack of clarity about what providers were being paid for. When the payment system was chaotic some providers had concerns about offering the extended places, given that they could not be certain when they would get paid and they could end up spending a considerable amount of time chasing delayed payments.
• LA systems set up for the 30 hours did not appear to be geared to monitor claims for the same child submitted by different providers. This raised concerns among providers who worried that families may over-claim for free entitlement hours and it would then be their responsibility to recoup the money from these families.
Other elements of the evaluation highlighted further issues about local processes:
• A two tier system of payments with different rates for the universal 15 hours and the extended hours was shown to be problematic due to the need to determine which provider is delivering the initial 15 hours and which is delivering the extended hours for children using multiple providers. These problems were highlighted in the collection of the ad hoc census data for the evaluation and in postings on the Childcare Work (national business support) website. This supports the decision that there will not be differential rates between the initial and second 15 hours in the national rollout.
• The discussion at the event for early implementer and early innovator LAs in May 2017 indicated potential problems around the tracking of hours for children spreading the offer in school holidays or for families who were “banking”24 hours across different time periods, again raising potential concerns around over-claims for free entitlement hours.
23 The new national Childcare Service system will check eligibility in the national rollout. 24 “Banking” is when a parent does not use all the free entitlement hours in a particular week and is allowed by the provider to save them and use them in a future week.

78
It’s happening and it’s not
the 15 hours offer
You can choose a
model that suits your
service
Change can be evolutionary rather than
revolutionary
You will be supported
Keep calm: you’ve
adapted before
Can you afford not to
do it?
You can control the pace of
change
You can experiment and learn from your
experience
Think about numbers and attendance
Think about working with others
You can tinker or transform You will know
when families are eligible
You will be paid on time at the touch of a
button
• It should be noted that the extended hours mean that a larger proportion of providers’ income will come from LA funding which increases the importance of ensuring that payments are prompt, clear and appropriately timed for providers’ business models.
Figure 12 summarises the key messages that could be helpful for the recruitment of providers to deliver the extended hours in the national rollout.
Figure 12: Key messages to help recruit providers
Finally, evidence from the early innovators provided two examples of effective recruitment approaches:
• Effective provider recruitment included the use of regular communications channels such as newsletters and websites with a steady and constant flow of information to build relationships. In addition, regular but short events hosted by LAs to fit in with the working day (such as a bimonthly meeting for one hour) were found to be useful.

79
• Two LAs reported particularly effective recruitment approaches to childminders. In one LA, the stock of free entitlement childminders was raised through a conference to re-engage on training; childminder mentors to provide peer support and target information; and a childminder network. In the other LA, childminder briefings led to a rise in numbers and greater engagement with the childminder community, although it also meant additional work for the LA in dealing with a higher number of providers.
4.5 Summary and recommendations In summary, the evidence from the early implementation showed that:
• A high proportion of providers were willing and able to offer the extended hours for positive reasons around supporting the policy and the business opportunity that it offers.
• Although all types of providers were generally willing to deliver the extended hours, there were a number of issues which could limit the extent to which different types of providers will be able or willing to engage with the offer going forward.
• The main challenge for all types of providers was uncertainty around the business implications, but any failure in LA processes to deliver a reliable and robust payment system could also adversely affect participation by providers in terms of continued delivery or future recruitment.
This evidence suggests the following recommendations for the national rollout:
(A) Providers of all types are likely to be willing to offer the extended hours, but there is a need to recognise that different types may face different challenges in delivery and the kind of support offered will need to reflect this variation.
(B) An important issue in recruiting providers to deliver the extended hours will be to address the uncertainty about the financial implications which business support at the local level can help achieve.
(C) The design of local processes needs to support the participation of providers by being efficient and reliable.

80
5. Were providers able to deliver sufficient hours? This chapter explores the evidence from early implementation which can inform on the likelihood that sufficient extended hours places will be offered to meet demand in the national rollout. The first section considers whether and how demand for the extended hours was met during early implementation and what has been learnt about potential sufficiency and the need for capacity expansion in the national rollout. The second section reviews the evidence on whether other types of provision will be affected by the extended hours. The final section offers recommendations on how to support the delivery of sufficient places in the national rollout.
5.1 Sufficiency of delivery and potential for expansion As shown in the previous chapter, the numbers of extended hours places delivered during early implementation broadly met the allocated numbers and there was no evidence that eligible parents could not obtain a place, even in the LA with a universal offer. This indicates that demand was met during early implementation and there was sufficiency in the delivery of places.
Figure 13: Changes in occupancy due to the extended hours
Source: Evaluation Survey of Providers, 2017
Note: Sample sizes are 227, 69, 169, 68 and 549 for private, voluntary, childminder, maintained and all types of providers.
One explanation for the sufficiency of places is that early implementation may have only involved a switch in funding source from parental fees to free entitlement hours for
29%
44%
12%
41%
34%
66%
50%
80%
58%
62%
5%
6%
7%
1%
4%
0% 20% 40% 60% 80% 100%
All types
Maintained
Childminder
Voluntary
Private
Increased No change Decreased

81
children already using longer hours. However, two pieces of evidence from the evaluation survey of participating providers indicates that more hours were delivered because of the extended hours. First, 29 percent of providers reported that occupancy rose because of the extended hours (figure 13), that is, they used spare capacity to deliver the extended hours. A smaller proportion of childminders reported an increase in occupancy than other types of providers, although this could reflect that occupancy is a more challenging concept for childminders to consider than other provider types.
Figure 14: Increase in the use of staff to deliver the extended hours
Source: Evaluation Survey of Providers, 2017
Note: Sample sizes are 231, 72, 167, 69 and 554 for private, voluntary, childminder, maintained and all types of providers.
Second, 34 percent of providers reported that they had increased staff hours or increased the number of staff to deliver the extended hours, including 14 percent who had just raised hours, 8 percent who had just taken on more staff and 13 percent who had done both (figure 14). The proportion making such changes was greatest among maintained providers and, unsurprisingly, notably lower among childminders who tend not to use additional staff or tend not to have fixed, specific working hours. To some degree, this increase in the use of staff represents a rise in capacity in response to the
66%
49%
84%
63%
59%
14%
12%
10%
21%
15%
8%
20%
2%
6%
9%
13%
19%
4%
11%
17%
0% 20% 40% 60% 80% 100%
All types
Maintained
Childminder
Voluntary
Private
No change in staff hours or number Staff hours increased
Number of staff increased Both staff hours and number increased

82
extended hours, although it is achieved using a flexible resource which does not require a substantial degree of financial investment.25
The survey also explored whether providers who had not increased the number of staff were constrained in their ability to do so. Only 4 percent of these providers reported that they had not increased the number of staff because they were unable to recruit them, although 10 percent reported the reason being that they could not afford more staff (and this reason was given by 23 percent of voluntary providers) (table 19).
Table 19: Reason did not increase number of staff
Private Voluntary Childminder Maintained All types
Did not need more staff 92% 85% 38% 90% 71%
Could not afford more staff 10% 23% 4% 14% 10%
Could not recruit suitable staff
8% 3% 0% 0% 4%
Other specific answer 1% 0% 1% 2% 1%
Not applicable 0% 0% 65% 2% 24%
Total
100%
100%
100%
100%
100%
Number of providers not increasing staff number
172 60 158 42 442
Source: Evaluation Survey of Providers, 2017
Note: Statistics for subgroups with less than 50 observations have been indicated in italics.
Although providers were able to meet demand during early implementation, it is important to note that this was a limited test of sufficiency for the national rollout. In particular, as shown in the previous chapter, demand was severely rationed in seven of the LAs to quite small proportions of children who could be eligible for the extended hours and possibly focused on children who were already using longer hours. Although the evaluation survey found that most providers delivering extended hours definitely or possibly had more capacity to offer more extended hours places (63 percent), over a third did not have the capacity to do so (figure 15). The proportion of providers reporting that they did not have capacity to offer more places was higher among childminders and voluntary providers than private and maintained providers. It also varied across LAs from
25 Hiring staff or increasing staff hours has some fixed costs in terms of administration and (possibly) longer term contracts with additional staff, but does not carry the same costs as acquiring or committing to rental contracts for additional venue space or undertaking other physical capital investment.

83
20 percent to 60 percent (table 64 in Annex B) in a way that is not obviously related to the local pattern of types of provision or context.
Figure 15: Capacity to offer more places by provider type
Source: Evaluation Survey of Providers, 2017
Note: Sample sizes are 232, 72, 170, 68 and 558 for private, voluntary, childminder, maintained and all types of providers.
The case studies also explored if and how providers expanded their service to offer the extended hours as part of the early implementation and what were their expectations and plans for the September 2017 rollout. The responses generally varied across provider type.
For day nurseries, children tended to start well before they became entitled to free entitlement provision and typically families were already at the setting when they became eligible for the extended hours. The extended hours attracted some new families and led to an increase in hours among some existing children. However, there was a sense of “business as usual” or slightly busier than usual. Overall, day nurseries did not experience substantial changes and only small adjustments (for example, a small increase in staff resources or slightly higher occupancy) were required to accommodate the offer; in some cases these had been planned in advance in preparation for the early implementation. There were a few examples of day nurseries that had expanded their capacity or were planning to do so, and the extended hours were one of a number of contributing factors that had led to the decision to expand.
At the time of the case study fieldwork (January to March 2017), day nurseries already had an indication of how many (new and existing) families were likely to be entitled to the
30%
34%
21%
31%
37%
33%
41%
28%
28%
35%
37%
25%
51%
42%
28%
0% 20% 40% 60% 80% 100%
All types
Maintained
Childminder
Voluntary
Private
Definitely have capacity Possibly have capacity Do not have capacity

84
extended hours from September 2017 and, at that point, there was not yet any evidence of difficulties in meeting demand. However:
• Some providers believed it was too early to assess how demand will be affected in September 2017, as they mainly knew about families who were already using or planning to use additional hours regardless of the extended offer. When the offer becomes more widely known it may generate demand from parents who would not otherwise use additional (paid) hours.
• So far, the offer has been tested in the autumn and spring terms which are traditionally quieter times as many children leave in the summer to enter school reception classes. Accommodating additional demand in the summer term could be more challenging as availability is usually more limited.
• Some nurseries were considering limiting the number of extended free entitlement places to what was considered a financially viable number, but at the time of the fieldwork it was not clear if and how many families may be turned away because of this potential limit.
• Their ability to increase or even maintain current levels of provision to support the national rollout will depend on the availability of suitably qualified staff: some had experienced staff recruitment and retention difficulties and expected these to be exacerbated if demand was to increase substantially.
As discussed later on, playgroups who provided sessional care had to make more service adjustments to offer the extended hours. Playgroups had already started planning for the national rollout. Based on the requests they had received by February to March, they could not see any difficulties in meeting demand and some hoped for higher occupancy levels in the autumn term when traditionally they had experienced empty places. However, like day nurseries, some playgroup managers wondered what would happen in the summer term when they were usually busier and what the effect on demand would be when the offer became more widely publicised. Staff recruitment and retention were also reported to be a considerable challenge by some playgroup managers, while expansion was also potentially limited by a lack of the kind of lower cost venues typically used by these settings to keep down costs and the considerable risk involved in moving to a more expensive venue.
Typically, families were already with a childminder when they became entitled to the extended hours and very little had changed. While among some childminders there was the hope that the extended hours would lead to greater involvement with free entitlement provision, there was also disappointment due to a lack of demand from parents. It was difficult for childminders to get a sense of what the offer would mean for them going forward as they worked with a small number of families. Furthermore, they felt that their involvement with the offer may partly depend on other settings, and schools in particular,

85
being willing to signpost parents to childminders and that childminders were not always seen as an equal player by other providers.
As discussed later, some nursery classes and nursery schools had adapted their offer to provide the extended hours. For nursery classes and nursery schools, planning for the September 2017 intake was already well underway at the time of the case study fieldwork, with schools hoping to consolidate changes already made during early implementation for the national rollout. While further adjustments were not ruled out, they may have to wait until September 2018 as schools tended to operate a one-year planning cycle and seemed to have less flexibility to make short-term changes.
Overall, the evidence suggests that sufficient delivery of places to meet demand was not an issue during early implementation because a large proportion of the extended hours would have been used as paid hours anyway and because the required increase in hours could be met through the utilisation of spare capacity and / or by increasing the use of staff. However, it is important to note that early implementation was a limited test of sufficiency in the national rollout for two reasons:
• Demand was rationed in seven LAs to small proportions of potentially eligible children and was also possibly focused on those who would have paid for longer hours anyway. The experience of the single LA with the universal offer is unlikely to be representative of the national rollout.
• The evidence on early implementation was collected relatively early in the school year when there is more spare capacity and was therefore a favourable time for sufficiency to be achieved.
In addition, over one third of providers delivering extended hours during early implementation reported in the evaluation survey of providers that they did not have the capacity to deliver any more places. In the case studies, some providers reported that they would limit the number of free entitlement extended hours for reasons of financial viability, suggesting that there could be constraints for some providers to meet any additional demand during national rollout. More broadly, there were concerns that, if it were required, a more major expansion in delivery could be constrained by difficulties in the recruitment of qualified staff, limited availability of suitable buildings and the challenges of obtaining capital for investment in expansion.
The evidence from the early innovator LA leads also showed:
• In preparing for the national rollout of the extended hours, most LAs did not report any evidence of current unmet demand in their area. However, some added that this did not mean that preferences for specific types of care were being met and that there was high use of informal care which could reflect deficiencies in formal care provision. A small number reported small geographic pockets of unmet demand, while another small number reported specific issues with holiday care,

86
care for older children, gaps around SEND provision and the unusual needs of employees of one particular local employer.
• Good progress was reported on market analysis and data collection. However, there was widespread recognition that this information is speculative about future behaviour. In particular, it was acknowledged that project management at all levels will need to be prepared to make changes to plans based on currently available figures in the coming year.
• The need for expansion in capacity is an unknown until implementation is completed. The responses from LA leads on whether providers would need to expand was quite vague, with some reporting that expansion would not be needed because there was spare capacity and only a few reporting that expansion is likely to happen.
• Over half (14) LAs reported that lack of space was a constraint on expansion, due to limitations from shared use of buildings, finding appropriate space or obtaining planning permission and a lack of capital to invest in buildings.
• Capital support for key projects had been welcomed and there was optimism about their success for provision of new capacity. However many LAs believed that there is an urgent need to identify a funding source for small expansion projects preferably managed at local level.
• One area of general concern was about the lack of availability of qualified staff. This could not be quantified in detail but the feeling was very widespread. Indeed, 14 of the 24 LAs mentioned this as a constraint on expansion, although four LAs reported that they were not aware of any issues around staff availability.
5.2 Impacts on other types of provision One concern around the 30 hours free childcare policy is that providers may reduce delivery of other types of provision in order to deliver the extended hours. A specific worry has been that the extended hours could crowd out places for the two year old free entitlement, but they would also affect the provision of the universal 15 hours entitlement (for children not taking the extended hours) and additional paid hours or provision for children of other ages.
According to the census data, almost all providers other than childminders delivering the extended hours also had children who were receiving only the universal 15 hours entitlement (table 20). Less than half of the childminders delivering the extended hours had such children, but this is not surprising given the small number of children that childminders typically care for. Variation in the proportions across LAs simply reflects the proportion of providers delivering extended hours who were childminders (table 65 in Annex B). One reason why almost all non-childminder providers had a mix of free

87
entitlement three and four year olds both taking and not taking the extended hours could have been due to the rationed nature of the offer in seven LAs during early implementation, although LA H with the universal offer had no distinctive pattern from other LAs.
Table 20: Other free entitlement places for providers offering extended hours
Private Voluntary Childminder Maintained All types
Proportion with universal entitlement 15 hour places
99% 100% 45% 99% 81%
Proportion with free entitlement 2 year old places
83% 68% 21% 32% 53%
Number of providers 333 114 221 124 829
Sources: Early Years Census, School Census and additional evaluation data collection, January 2017
Note: The proportion with free entitlement two year old places was slightly higher (61 percent) in the evaluation survey of providers, but the patterns across the LAs were very similar to those presented here.
Table 20 also shows that just over half of the providers are delivering free entitlement hours to two year olds, but that the proportion is higher for private and voluntary providers than for maintained providers (who are less likely to have two year olds per se) and childminder providers. The proportion of providers with free entitlement two year olds varies across LAs from 40 percent to 72 percent (table 65 in Annex B), but the pattern reflects the different proportions of maintained providers and childminders delivering the extended hours.
In order to consider whether delivery of the extended hours affected provision for other free entitlement children, table 21 presents the average change in the number of places for three and four year olds taking the universal 15 hours entitlement and for two year olds taking the free entitlement within providers delivering the extended hours in 2017 (and, by construction, were offering some free entitlement hours in 201626). On average, providers delivered 6.8 extended hours places in 2017 and reduced the number of universal 15 hours places for three and four year olds between 2016 and 2017 by 6.9, and the number of free entitlement places for two year olds by 0.5, amounting to an overall reduction of 0.6 free entitlement places (table 21). There is a small degree of
26 A modified version of this exercise was also tested considering the average changes in the total numbers of funded places within LAs including providers who only offered funded provision in one of the two years, but it was challenging to robustly identify patterns in the LAs where the proportion of extended places was small and to allow for the potentially higher double counting of children at multiple providers in 2016 than in 2017 (see chapter 2). Considering changes within providers offering the extended hours avoided these issues and focused on more immediate impacts within a setting.
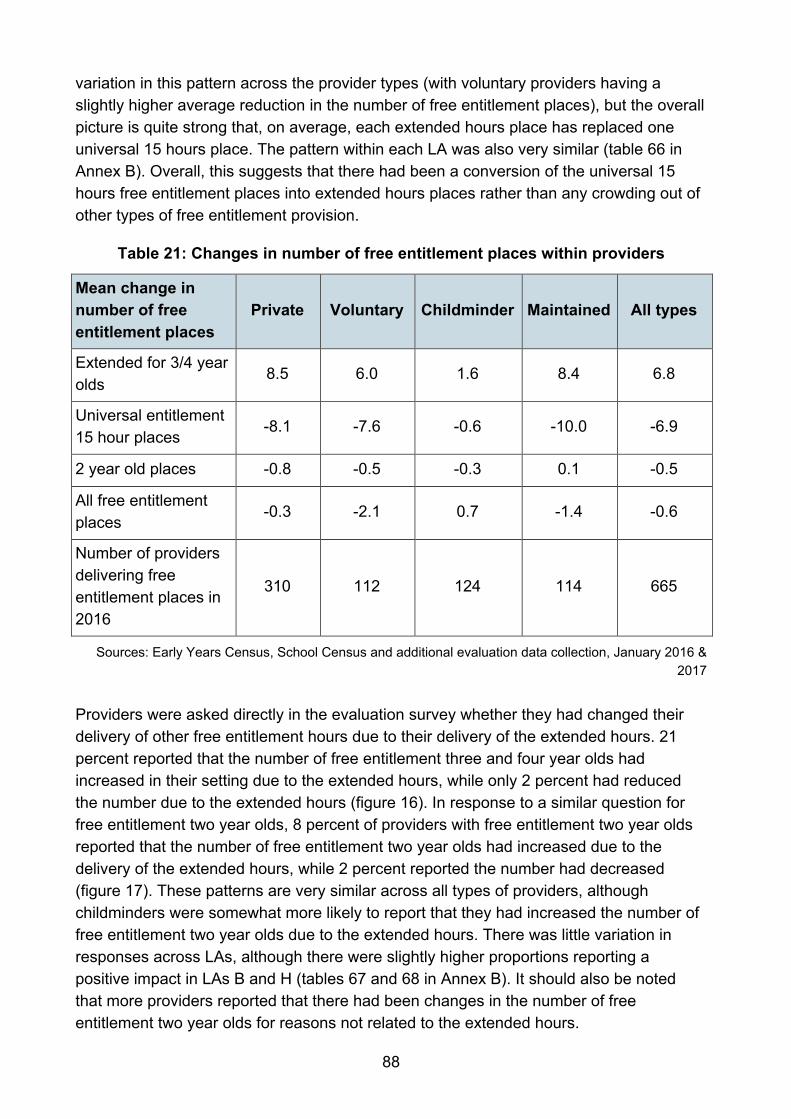
88
variation in this pattern across the provider types (with voluntary providers having a slightly higher average reduction in the number of free entitlement places), but the overall picture is quite strong that, on average, each extended hours place has replaced one universal 15 hours place. The pattern within each LA was also very similar (table 66 in Annex B). Overall, this suggests that there had been a conversion of the universal 15 hours free entitlement places into extended hours places rather than any crowding out of other types of free entitlement provision.
Table 21: Changes in number of free entitlement places within providers
Mean change in number of free entitlement places
Private Voluntary Childminder Maintained All types
Extended for 3/4 year olds
8.5 6.0 1.6 8.4 6.8
Universal entitlement 15 hour places
-8.1 -7.6 -0.6 -10.0 -6.9
2 year old places -0.8 -0.5 -0.3 0.1 -0.5
All free entitlement places
-0.3 -2.1 0.7 -1.4 -0.6
Number of providers delivering free entitlement places in 2016
310 112 124 114 665
Sources: Early Years Census, School Census and additional evaluation data collection, January 2016 & 2017
Providers were asked directly in the evaluation survey whether they had changed their delivery of other free entitlement hours due to their delivery of the extended hours. 21 percent reported that the number of free entitlement three and four year olds had increased in their setting due to the extended hours, while only 2 percent had reduced the number due to the extended hours (figure 16). In response to a similar question for free entitlement two year olds, 8 percent of providers with free entitlement two year olds reported that the number of free entitlement two year olds had increased due to the delivery of the extended hours, while 2 percent reported the number had decreased (figure 17). These patterns are very similar across all types of providers, although childminders were somewhat more likely to report that they had increased the number of free entitlement two year olds due to the extended hours. There was little variation in responses across LAs, although there were slightly higher proportions reporting a positive impact in LAs B and H (tables 67 and 68 in Annex B). It should also be noted that more providers reported that there had been changes in the number of free entitlement two year olds for reasons not related to the extended hours.

89
Figure 16: Impact on number of free entitlement three / four year olds
Source: Evaluation Survey of Providers, 2017 Note: Sample sizes are 231, 72, 171, 67 and 556 for private, voluntary, childminder, maintained and all types of providers.
Figure 17: Impact on number of free entitlement two year olds
Source: Evaluation Survey of Providers, 2017 Notes: Sample sizes of numbers of providers with free entitlement two year olds are 197, 54, 34, 42 and 338 for private, voluntary, childminder, maintained and all types of providers.
21%
25%
20%
19%
22%
8%
9%
6%
11%
8%
68%
58%
72%
69%
68%
2%
6%
1%
1%
2%
1%
1%
1%
0%
1%
0% 20% 40% 60% 80% 100%
All types
Maintained
Childminder
Voluntary
Private
Increase due to extended hours Increase for other or unknown reasonsNo change Decrease due to extended hoursDecrease for other or unknown reasons
8%
6%
17%
4%
8%
12%
12%
7%
9%
15%
73%
79%
71%
83%
69%
2%
0%
2%
0%
3%
5%
3%
2%
4%
7%
0% 20% 40% 60% 80% 100%
All types
Maintained
Childminder
Voluntary
Private
Increase due to extended hours Increase for other or unknown reasonsNo change Decrease due to extended hoursDecrease for other or unknown reasons

90
Smaller and more even proportions of providers reported that they had increased (4 percent) or decreased (6 percent) the number of children with only paid hours because of the delivery of extended hours (figure 18). These proportions were very similar across provider types and LAs, although the proportion reporting an increase and the proportion reporting a decrease in the number of paid places was slightly higher again in LA B (table 69 in Annex B). On the other hand, 9 percent of providers charging fees reported that they had increased fees for at least one age group due to the delivery of the extended hours, while only 3 percent reported that they had decreased fees for at least one age group (figure 19). There was a slightly greater tendency for private providers to have increased fees and for childminders to have decreased fees due to the extended hours, but little discernible pattern in the changes across LAs (table 70 in Annex B).
Figure 18: Impact on number of children with only paid hours
Source: Evaluation Survey of Providers, 2017
Note: Sample sizes of numbers of providers with paid only places are 230, 71, 170, 65 and 552 for private, voluntary, childminder, maintained and all types of providers.
4%
5%
4%
1%
5%
9%
6%
6%
8%
11%
79%
78%
84%
79%
75%
6%
8%
5%
8%
6%
2%
3%
1%
3%
3%
0% 20% 40% 60% 80% 100%
All types
Maintained
Childminder
Voluntary
Private
Increase due to extended hours Increase for other or unknown reasonsNo change Decrease due to extended hoursDecrease for other or unknown reasons

91
Figure 19: Impact on fees for paid hours
Source: Evaluation Survey of Providers, 2017
Notes: Sample sizes of numbers of providers with paid hours are 227, 69, 169, 50 and 530 for private, voluntary, childminder, maintained and all types of providers. A fee increase means that fees rose for at least one age group from three and four year olds, two year olds and under two year olds, and did not decrease for any age group. A fee decrease means that fees decreased for at least one age group and did not increase for any age group. There was also one setting which reported a mixture of increases and decreases across the age groups.
There was relatively little evidence from the case studies on the impact of the extended hours on other types of provision. In general, providers had little to say about the impacts on the childcare market and views were mainly speculative, tentative and vague. However, some providers did report that they were holding back on making changes to their provision until September 2017, after they had seen the business implications of delivering extended hours during early implementation.
Overall, the evidence from early implementation indicated that other free entitlement provision is unlikely to be affected by the extended hours, although there may be some impact on the fees for paid hours. However, it should be borne in mind that, as with sufficiency, early implementation was a limited test of these impacts because extended hours places were rationed in seven of the LAs, the one LA with a universal offer may not be nationally representative and the evidence was recorded at a more favourable time early in the school year. In addition, the point that some providers may have been waiting to adjust their other provision should be noted as this would have reduced the potential impact on other types of provision.
9%
4%
7%
6%
13%
11%
6%
7%
19%
14%
76%
86%
77%
76%
71%
3%
4%
6%
0%
1%
1%
0%
2%
0%
1%
0% 20% 40% 60% 80% 100%
All types
Maintained
Childminder
Voluntary
Private
Increase due to extended hours Increase for other or unknown reasonsNo change Decrease due to extended hoursDecrease for other or unknown reasons

92
5.3 Summary and recommendations In summary, the evidence from the early implementation showed that:
• There were no indications of any insufficiency in the delivery of the extended hours to meet demand or adverse effects on other free entitlement and paid provision.
• However, early implementation was a very limited test of sufficiency because of the limited number of places in seven of the eight LAs and the timing of the evaluation evidence collection in the earlier part of the school year when there is more space capacity.
• If any substantial expansion in capacity is required to meet demand in the national rollout, there are risks that this could be constrained by difficulties in the recruitment of good staff, in finding additional venue space and in obtaining capital funding for investment.
This evidence suggests the following recommendations for the national rollout:
(D) Given the limited test of sufficiency during early implementation, a national level review of sufficiency in the delivery of extended hours places and impacts on other types of provision would be helpful in April 2018 when demand will be peaking for the summer term.
(E) In case a substantial expansion in capacity is required to meet the demand for the extended hours, consideration could be given to the sharing of any learning on facilitating utilisation of existing building space (currently being explored by some early innovators); provision of capital funding for small and large expansion projects; and continued support for increasing the supply of good practitioners through the Early Years Workforce Strategy presented in March 2017.

93
6. Did providers work in partnerships? This chapter explores the evidence from early implementation which can inform on the likely development of partnership working in the national rollout. The first section presents evidence on the development of partnerships during early implementation, while the second highlights some challenges to the building of successful partnerships. The final section offers some recommendations on how partnership working can be supported and the perceived benefits of jointly delivering the 30 hours offer.
6.1 The development of partnerships during early implementation Supporting partnership working was one of the key themes for early implementation and this was reflected in a range of approaches developed to support settings to work together. Local early implementation teams reported that the importance of partnership working was strongly stressed at LA 30 hours briefings and at these events providers were encouraged to start talking to each other about possible collaborative arrangements. Implementation models based on small geographical hubs or clusters were developed partly to support partnership working. In one LA, a long-established partnership model was seen as having played a key role in supporting the delivery of a large number of extended places in very challenging circumstances.
Table 22: Proportion of providers working in partnership
Proportion working in partnership Private Voluntary Childminder All Early Years
Census types
Providers delivering extended hours
11% 23% 20% 16%
Providers not delivering extended hours
5% 4% 8% 6%
Number of providers: - delivering ext. hours - not delivering ext. hours
333 673
114 172
221 586
668
1,431
Sources: Early Years Census and additional evaluation data collection, January 2017
Data from the Early Years Census for private, voluntary and childminder providers27 was used to make two comparisons. First, to compare the proportions of providers with partnership working between those delivering the extended hours during early
27 Information on partnership working was not in the School Census data for maintained settings.

94
implementation and those not in the eight LAs in order to inform on whether those with partnership working are more likely to offer extended hours. As shown in table 22, 16 percent of providers delivering the extended hours were working in partnerships compared to only 6 percent of other providers, reflecting a pattern evident across all three types of provider and strongest for voluntary providers. Second, to compare changes in partnership working between January 2016 and January 2017 for the two groups in order to inform on whether offering the extended hours increased partnership working. As shown in table 22, the proportions both starting and ceasing partnership working since 2016 were almost identical across all providers (around 3 percent) and within each provider type. This suggests that providers with partnership working were more likely to offer extended hours rather than that offering extended hours increased partnership working.
However, evidence from the evaluation survey of providers indicates that 20 percent formed new partnerships in order to deliver the extended hours (table 23). This proportion was lower for private providers than other types, reflecting that private providers are more likely to be offering longer days which do not require partnership working to offer the extended hours.
Table 23: New partnerships to deliver extended hours
Private Voluntary Childminder Maintained All types
Proportion forming new partnerships
14% 26% 23% 26% 20%
Most prevalent types of new partnerships
With private 6% 6% 4% 16% 6%
With school nursery class 4% 8% 11% 3% 6%
With childminder 2% 13% 4% 10% 5%
Number of providers
233
72
171
69
561
Source: Evaluation Survey of Providers, 2017
Notes: The proportions in the most prevalent types can sum to more than the first row because a setting may have formed more than one new partnership. Private does not include independent school settings in this table. Maintained settings include nursery classes in maintained schools, nursery schools and other LA-run settings such as children’s centres. A very small number of new partnerships were formed with other types of providers including voluntary, independent schools, primary schools, nursery schools, out-of-school clubs, and LA-run settings.
The case study interviews with providers and LA early implementation teams showed that different aspects of partnership working were supported by the early implementation programme, as well as the challenges and benefits of partnership arrangements:

95
• Joint delivery of the extended hours: This was encouraged when settings could not deliver the full 30 hours alone and / or could not provide the flexibility parents required. In both 30 hours briefings and in individual discussions with providers, LA early implementation teams were quick to highlight opportunities for joint delivery of the offer. In one LA where providers had to bid to deliver the offer, bids from providers who were planning to jointly deliver the offer were encouraged. While this approach encouraged some new partnerships, it was not as successful as it was hoped largely because it was based on the assumption that childminders would be heavily involved with these arrangements, but parental demand for childminders to deliver the extended hours had been limited.
• Good practice in shared care arrangements: Some providers showed a good awareness of key processes and practices to ensure continuity of care, such as regular information exchanges verbally and / or through “learning journey books” or similar approaches. Some providers were aware of the importance of exchanging information on a child’s progress and planned activities to make sure the inputs from different settings were complementary. It was well understood that collaboration between settings was particularly important when a child had additional needs or was facing difficulties. The early implementation programme was reported to have strengthened existing shared care arrangements in some cases. The anticipation of greater demand for shared care had encouraged some settings to sit down to revisit their arrangements and identify areas for improvements. However, time constraints could mean that the level of information exchange was not always as good as it should have been, although staff were more likely to prioritise the need to talk to their colleagues to support a child when there were difficulties. While there was a good understanding of good practice in shared care, this was not universal and some providers believed it was entirely or mainly up to parents to decide if and what information should be shared between settings and to facilitate the exchange of information
• Signposting: This involved raising awareness among providers of what other local settings were offering so that a provider could signpost families to another nearby setting when they could not offer what a family needed. There was some limited evidence of signposting, mainly by schools that recommended local childminders, day nurseries and out-of-school clubs to parents who needed wraparound provision while other provider types seemed more cautious about signposting.
• Sharing learning: Providers were encouraged to share learning on various aspects of delivering the extended hours, from practical arrangements to children’s experiences of mixing with older children and staying for a longer day. As well as through established networking arrangements, some LA early implementation teams provided additional opportunities to share this learning, for example, a buddying project where providers offering the extended hours could

96
spend up to half a day in another setting to share learning. There was evidence of providers sharing learning, particularly on the limitations they could place on the offer and charging for extras in compliance with DfE guidance.
• Sufficiency: Settings were encouraged to consider how their business plan may (negatively) affect other local providers and sufficiency in the local area. Some schools with well-established and mutually beneficial arrangements with another provider on site considered how their plans to offer longer hours affected the other provider. For example, while some schools started offering (or considered offering) a nine-to-three day, they ruled out providing a longer day as this would significantly reduce business for the day nursery or out-of-school club based on their site. However, this kind of discussion and consideration typically required strong and well-established partnership working mechanisms, and even in these cases, they could prove challenging.
Overall, a considerable number of activities were undertaken as part of early implementation to support partnership working with some evidence that these efforts were resulting in more and a wider range of collaborative arrangements. The benefits of partnership working were widely shared and more work was planned to support greater collaboration – for example, there were plans to set up partnership hubs in two LAs.
6.2 Challenges to the further development of partnership working The case studies also identified evidence of a number of challenges that could undermine efforts to increase collaboration:
• Tensions were emerging as settings that had traditionally provided part-time care were extending their service and entering the “full-time” market, undermining an implicit division of labour that some providers felt had served the local childcare market well in the past.
• Some voluntary playgroups and childminders did not think they could fully benefit from partnership arrangements as they did not have the same opportunity to influence local decisions regarding the 30 hours as other more vocal and organised parts of the sector.
• Some childminders felt that staff in group settings did not treat them as “equal” and this was particularly evident when their efforts to share information about children in shared care were largely ignored by staff in group settings.
• Some settings were not allowing parents to split their free entitlement hours with other providers.
97
• Good shared care practice requires time and providers were already reporting difficulties in finding time to share the kind of information that could support continuity of care. Full rollout in September 2017 is likely to increase these difficulties as more time will be required if the number of children using two providers increases.
• There was concern among some providers about ensuring that parents did not “over-claim” free entitlement hours when they were used in two settings. They had not seen evidence of robust LA processes for ensuring that this did not happen and were concerned that if parents over-claimed they would have to try to recoup the money and may not be able to do so. Providers were typically not aware of what will happen with the national rollout and who will be responsible for ensuring that mechanisms are in place to ensure parents do not over-claim free entitlement hours.
• When the extended hours were used in two settings, providers were not clear how it will be decided which setting could retain the universal entitlement and which would lose the extended hours if a child became ineligible for the latter.
• Parental acceptability of shared care varied across LAs, as did the use of multiple providers. It may take time for areas where use of multiple providers is low to increase parents’ confidence in shared care arrangements. For example, one LA that heavily relied on the maintained sector to deliver provision to three and four year olds was counting on many extended places being jointly delivered by two providers. Despite considerable efforts to support the two-provider model, very few parents opted for shared care arrangements and the level of parental acceptability of shared care was one of the lowest among the LAs. It was suggested by the early implementation team that there was a close link between use of two providers and parents’ confidence in and use of local childminders as many shared care arrangements involve childminders.
The evidence from the early innovators also showed that some LAs were promoting partnerships as they were seen as essential for both flexibility and for sufficiency. However, while some LA leads reported early successes there were also:
• An awareness of the potential for differences of approaches to care between different provider groups and between parents and providers when more than one provider is used.
• Evidence of mutual suspicion between providers as they may see each other as competitors.
Experience from the early innovators suggested some approaches to support the development of partnerships:

98
• Use of the 30 hours offer as a tool to break down some of the competitive element.
• One LA advised that the development of hubs needs to be provider driven and that LAs can help facilitate where there is initial interest and others may follow.
• In one LA, events brought together different types of providers to undertake problem-solving scenarios on types of care arrangements that parents might be looking for which successfully led to further enquiries around forming partnerships.
6.3 Summary and recommendations In summary, the evidence from the early implementation showed that:
• Partnership working can support providers to deliver the extended hours and is also encouraged by the greater need for shared care with the introduction of the extended free entitlement hours.
• There is a potential role for LAs to support the development of partnerships in order to support the delivery of the extended hours.
This evidence suggests the following recommendations for the national rollout:
(F) LAs should consider how best to identify the specific challenges to partnership working in their area and how they support the development of new and effective partnerships.

99
7. How flexible and free were the extended hours? This chapter explores the evidence from early implementation which can inform on how well extended hours places will meet the childcare needs of working parents in the national rollout. The first section considers opening times (including holiday provision) and the adjustments needed by some providers to offer the extended hours during early implementation, while the second section examines the flexibility offered to parents in when they can use the extended hours. The third section presents evidence on additional charges and whether parents were expected to make any payments to access the extended hours. The final section offers some recommendations around supporting the flexibility of the extended hours offer and on the role of additional charges in the national rollout.
7.1 Opening times Providers’ opening times are important both for contributing to the sufficiency of delivery of the extended hours (by determining whether 30 hours can be taken at a single setting) and for allowing parents to take hours at times which can help facilitate work.
Data from the Early Years Census for private, voluntary providers and childminders28 was used to compare the opening times of providers delivering the extended hours during early implementation with those not in the eight LAs (to inform on whether delivery involving more providers might be different) and to compare changes between January 2016 and January 2017 for the two groups (to inform on whether the extended hours had influenced opening times).
Across all three types of providers, those delivering extended hours were less likely to be open for less than 30 hours each week than those not delivering the extended hours (11 percent and 20 percent) (table 24) and were more likely to be open for 50 hours or more each week (62 percent and 53 percent). The difference at the lower end is driven by private and voluntary providers, while the difference at the higher end is driven by private providers alone. In addition, it is important to note that 9 percent of private providers and 35 percent of voluntary providers delivering the extended hours report that their weekly opening hours are less than 30, indicating that children at these settings taking the extended hours are using less than 30 (or are possibly spreading the offer into the school holidays) or are using shared care with another provider for their free entitlement hours.
28 Information on opening hours for maintained settings was not readily available in the School Census data.

100
Table 24: Weekly opening hours
Private Voluntary Childminder All types in EY Census
Proportions of providers delivering extended hours with weekly opening hours: Less than 20 20+ and less than 30 30+ and less than 40 40+ and less than 50 50+ and less than 60 60+
2% 7% 11% 7% 69% 3%
10% 25% 45% 11% 10% 0%
1% 0% 7% 19% 63% 10%
3% 8%
16% 11% 57% 5%
Proportions of providers not delivering extended hours with weekly opening hours: Less than 20 20+ and less than 30 30+ and less than 40 40+ and less than 50 50+ and less than 60 60+
11% 14% 15% 9% 48% 3%
24% 31% 31% 4% 9% 0%
2% 3% 6% 20% 60% 9%
9% 11% 13% 13% 48% 5%
Number of providers: - delivering ext. hours - not delivering ext. hours
333 673
114 172
221 586
668
1,431
Sources: Early Years Census and additional evaluation data collection, January 2017
Comparing opening hours in 2017 with those in 2016 gave one indication that providers delivering extended hours were more likely to have increased their opening times than other providers not delivering the extended hours: 11 percent of voluntary providers offering extended hours had moved up an opening hours category compared with 4 percent of voluntary providers not offering the extended hours. For the other types (and for all types combined), there were no marked differences in the proportions either extending or reducing opening hours. Overall, this suggests that providers delivering the extended hours tended to have slightly longer opening hours than those that did not and that some voluntary providers may have increased their opening hours in response to the policy, but neither the difference nor possible impact are very large.

101
The Early Years Census data also showed little difference in the proportion of providers offering care continuously throughout the day and those offering only sessional care (rather than full day) between those delivering extended hours and those not, although continuous opening was less prevalent and sessional care more prevalent among voluntary providers than other types.29 There was little difference in changes since 2016 in the delivery times between those delivering and those not delivering extended hours in 2017. The evaluation survey of providers showed very similar proportions of providers delivering extended hours with continuous opening for private providers (96 percent) and childminders (100 percent) and a slightly higher proportion for voluntary providers (93 percent) than the census data. The survey also showed that 93 percent of maintained settings had continuous opening.
Table 25: Annual opening weeks
Proportions with annual opening weeks Private Voluntary Childminder
All EY Census types
Providers delivering extended hours: Less than 38 38 exactly 38+ and less than 50 50+
2% 18% 7% 72%
1% 62% 25% 11%
0% 4% 72% 24%
1% 22% 30% 47%
Providers not delivering extended hours: Less than 38 38 exactly 38+ and less than 50 50+
2% 35% 12% 51%
3% 73% 16% 8%
1% 6% 69% 24%
1% 28% 36% 35%
Number of providers: - delivering ext. hours - not delivering ext. hours
333 673
114 172
221 586
668
1,431
Sources: Early Years Census and additional evaluation data collection, January 2017
29 The proportions of providers delivering (not delivering) extended hours with continuous opening were 95% (92%), 82% (81%) and 96% (97%) for private, voluntary and childminder providers respectively. The proportions of providers delivering (not delivering) extended hours with sessional rather than full day care were 17% (24%) and 68% (65%) for private and voluntary providers respectively.

102
The data from the Early Years Census indicate little difference in the number of opening weeks each year between those delivering and those not delivering the extended hours: 77 percent of those delivering the extended hours were open more than 38 weeks (an indicator of provision during school holidays), while 71 percent of those not delivering extended hours were open in excess of 38 weeks each year (table 25). This pattern was similar within each provider type. Considering changes in opening weeks since 2016, there was some tendency across all provider types for those delivering extended hours to be less likely to have decreased opening weeks relative to those not delivering the extended hours (5 percent compared to 9 percent for all provider types), but no difference in the proportions increasing hours.
The evaluation survey of providers considered more closely the opening hours of providers delivering the extended hours (although could not compare with those not delivering the extended hours or with changes since 2016). The dominant pattern was an “extended day”, defined as opening before 9am and / or after 3pm, which was offered by 83 percent of providers, while roughly one in ten offered a “short day” (defined as being only open between 9am and 3pm) (table 26).30 Unsurprisingly, the extended day was more common among private providers and childminders and notably less prevalent among maintained and voluntary providers.
Table 26: Opening times during the day
Private Voluntary Childminder Maintained All types
Morning only 2% 3% 0% 3% 1%
Short day 9% 31% 1% 22% 11%
Extended day 83% 64% 94% 74% 83%
Wraparound only 5% 3% 5% 1% 4%
Other 1% 0% 0% 0% 0%
Total 100% 100% 100% 100% 100%
Number of providers 233 72 171 69 561
Source: Evaluation Survey of Providers, 2017
Notes: Morning only means only open before 12pm; short day means only open between 9am and 3pm; extended day means open before 9am and/or after 3pm; wrap around means only open before 9am and / or after 3pm and other means a different pattern of opening hours.
30 The case study work indicated that it was not unusual for providers to open only 5 to 10 minutes before 9am or to remain open only until 3.30pm, indicating that the “extended day” definition used in the survey should not be interpreted as always meaning substantially longer.

103
The evaluation survey of parents collected information on the days attended at free entitlement providers (those delivering universal and / or extended hours) for children receiving extended hours, which was used to calculate the number of days that children attended (with “weekend” counted as one day). The pattern was quite spread: 39 percent attended on five days and 25 percent on three days, but two days and four days were also quite common (table 27). Perhaps unsurprisingly, a higher proportion of children (57 percent) attended for five days in school settings and a higher proportion (37 percent) attended for only one or two days at childminders, potentially reflecting the broader flexibility offered by these providers. The patterns in the number of days were similar across LAs with the exception of LA H with the universal offer: the proportion using one or two days was much higher (31 percent) and the proportion using five days lower (22 percent) (table 71 in Annex B), which may have been related to the universal offer or to the strong partnership working in this area. Most notably, very few children attended on the weekend: just 0.3 percent with little variation across provider type or LA.
Table 27: Number of days attended by children
Day nursery Playgroup Childminder School All types
Number of days attended each week
1 day 3% 7% 12% 2% 5%
2 days 18% 16% 25% 7% 14%
3 days 35% 18% 25% 19% 25%
4 days 18% 23% 9% 14% 17%
5 days 26% 36% 29% 57% 39%
6 days <1% 0% <1% 0% <1%
Total
100%
100%
100%
100%
100%
Weekend attendance
Proportion attend on weekend
0.1% 0% 0.4% 1.0% 0.3%
Number of places 946 535 985 199 2,719
Source: Evaluation Survey of Parents, 2017
The proportions of providers opening during school holidays as well as term time was very similar in the evaluation survey of providers to those opening for more than 38

104
weeks in the census data:31 overall, 66 percent of providers opened in the school holidays, although much higher proportions of private providers (73 percent) and childminders (95 percent) did so than voluntary providers (26 percent) and maintained providers (20 percent) (figure 20).
Figure 20: Opening in school holidays
Source: Evaluation Survey of Providers, 2017
Note: Sample sizes are 233, 72, 171, 69 and 561 for private, voluntary, childminder, maintained and all types of providers.
Table 28: Proportion using extended hours in school holidays by provider type
Private Voluntary Childminder Maintained All types
Proportion spreading hours across more than 38 weeks
26% 8% 13% 1% 17%
Number of places 2,785 682 351 982 4,924
Sources: Early Years Census, School Census and additional evaluation data collection, January 2017
Even if providers are open during school holidays, it does not automatically mean that parents can spread the use of the extended hours across the holidays or that parents choose to spread the hours. While the numbers above indicate that the majority of
31 Table 25 shows that 79 percent of private providers, 36 percent of voluntary providers and 96 percent of childminders delivering the extended hours were open more than 38 weeks.
34%
80%
5%
74%
27%
66%
20%
95%
26%
73%
0% 20% 40% 60% 80% 100%
All types
Maintained
Childminder
Voluntary
Private
Open term-time only Open during term and school holidays

105
providers delivering extended hours are open during the holidays, the census data and the evaluation survey of parents indicate that most children only used the extended hours during term time. According to the census data, only 17 percent of extended hours places had some of the hours taken during the school holidays, although this proportion was 26 percent for those taking the extended hours at private providers (and as low as 1 percent for those taking extended hours at maintained providers) (table 28). The proportion also varied across LAs, with some, although not strong, relationship to the most prevalent types of provision in each area (table 72 in Annex B).
The evaluation survey of parents captured a slightly different measure of holiday use for any of the free entitlement hours (either the universal or the extended hours) and indicated a higher proportion (33 percent) using free entitlement hours during the holidays, although, again this proportion was higher for private (day nursery) and childminder providers than voluntary (playgroup) and maintained (school) providers (figure 21). The proportion also varied across LAs (table 73 in Annex B), although with a smaller degree of variation than that for the use of extended hours in the holidays in the census data. Overall, around half of the providers delivering the extended hours places offered holiday care, but around one third of parents were using free entitlement hours during the holidays and a smaller proportion were explicitly using the extended free entitlement hours in the holidays.
Figure 21: Proportions using free entitlement and paid hours in school holidays
Source: Evaluation Survey of Parents, 2017
Note: Sample sizes are 891, 492, 195, 907 and 2,525 for day nurseries, playgroups, childminders, schools and all types of providers.
33%
18%
42%
17%
53%
19%
12%
38%
9%
27%
49%
70%
20%
74%
20%
0% 20% 40% 60% 80% 100%
All types
Schools
Childminder
Playgroup
Daynursery
Use free entitlement hours in holidays Use only paid hours in holidays
Do not use in holidays

106
The evaluation survey of providers directly asked providers whether they had extended their opening times. Around one in ten providers had made at least one change and most changes involved extensions to the day or starting to offer care over lunchtime (table 29). Changes were also slightly more prevalent among maintained providers and less so among private providers, which is not surprising given that longer opening was less common among maintained types before the extended hours. Very few providers of all types (just 2 percent) reported that they had begun to open in the school holidays, although 7 percent of voluntary providers reported that they had started to open on more weekdays and 4 percent of childminders reported that they had started to care for children on the weekend.
Table 29: Extensions to opening times
Private Voluntary Childminder Maintained All
Proportion extending opening hours
7% 14% 11% 17% 11%
Proportions starting to open: - earlier in the day - over lunch - later in the day - at the weekend - more weekdays - during holidays
4% 3% 5% 0% 2% 1%
7% 6% 8% 0% 7% 3%
9% 4% 9% 4% 1% 4%
10% 7% 10% 0% 3% 1%
7% 4% 7% 1% 2% 2%
Number of providers 233 72 171 69 561
Source: Evaluation Survey of Providers, 2017
The case studies explored in greater depth how different types of providers had needed to adjust to deliver the extended hours:
• Day nurseries had to do very little, if anything, in terms of service delivery to offer the extended free entitlement hours. They provided a full-time, all year-round service and their opening times were already geared towards meeting the needs of working parents.
• Playgroups generally needed to make more service adjustments to offer the extended hours, for example, some had to increase their opening hours to be able to offer the full 30 hours. These adjustments were typically building on previous moves to become more responsive to families’ needs. While playgroups had traditionally provided term-time sessional care (that is, a morning or afternoon session of around 2 to 3 hours), they had been offering the option of taking two sessions a day in recent years. For example, this meant that some children were

107
taking their universal entitlement over two and half days or paying for additional hours if they attended for more full days. With the extended free entitlement hours, these settings typically saw an increase in families asking for full days, which led to increases in occupancy levels and changes in staff levels and lunchtime arrangements. For example, more children staying for lunch could create difficulties with storing and keeping food cool and some playgroups therefore arranged for lunch deliveries as they correctly anticipated that many parents are happy to pay for lunch. The extended hours meant that some playgroups were more willing to try to extend their service by offering a long day and / or holiday provision even when these had been attempted and failed in the past due to insufficient demand. However, playgroups tended to be in venues shared with others and this limited the hours they could operate. In some cases a change of venue would be required to (further) extend the service. This was generally not seen as feasible in the short term due to a lack of the kind of low-cost venues typically used by these settings to keep down costs and the considerable risk involved in moving to a more expensive venue.
• Childminders were already operating a full-time all year-round service and were reported to be very flexible, possibly the most flexible of all provider types. While some childminders were providing the full 30 hours, they were typically asked to provide only some of the extended hours, for example, to wrap around school nursery provision and / or to cover long days when parents were working, with children attending a group setting on other days.
• Some nursery classes in schools and nursery schools had adapted their offer to provide the extended hours, with some switching from providing one to two sessions a day with lunch cover; increasing their opening hours; and providing breakfast and after-school clubs. As with playgroups, the extended hours were providing a further impetus towards greater flexibility, building on previous efforts to meet parents’ needs. However, it was common for schools who decided to provide wraparound provision to ask external providers to run the breakfast and / or after-school club. This was because some did not really want to get into the “childcare business” with the additional complications and work it involved, but for others because bringing in an external provider gave an opportunity to test the viability of the service without having to make any staff changes that may have to be reversed if there was not sufficient demand. In addition, collaboration with other providers was particularly evident among this type of provider: for example, some schools that could only offer the universal entitlement or could not offer the full 30 hours partnered up with day nurseries and childminders to offer a “childcare package” to families who wanted to take the extended hours and / or needed wraparound provision.
Overall, the extended hours did not generally affect the opening times of full-time providers (primarily private providers and childminders) as these were already reported to
108
be in line with working parents’ needs, according to both providers and the parents who used them. Among these types of providers the extended hours were not always being spread across the school holidays, although it is unclear how much this was desired by parents or affected the benefit of the extended hours to parents. Among settings that did not provide a full-time service (primarily playgroups and schools), the extended hours had encouraged greater flexibility, typically building on previous moves to make the service more responsive to working parents’ needs. There was evidence that, through a series of small steps such as switching from offering one to two sessions a day, increasing opening hours to offer a longer “short day”, providing wraparound and holiday provision, some of these settings were gradually moving towards a full-time service model. Schools had more options for doing this, including partnering with other settings to provide a ‘package of care’, while for some playgroups restrictions on venue use meant that a very big step (moving to a more expensive venue) was required to further increase flexibility. While decisions with substantial cost implications had not been ruled out, at this stage providers were rather cautious, postponing this kind of decision until after the national rollout when they could get a better idea of how parental demand may change.
7.2 Flexibility for parents Information on the flexibility that parents had in choosing when they took extended and free entitlement hours was collected both from providers and from parents in the evaluation surveys. It should be noted that the information from providers was specifically about the extended hours, while that from parents was about the use of free entitlement hours more broadly, including the universal 15 hours. It should also be noted that the responses may not match exactly because larger providers are over-represented in the parents’ responses (or, equivalently, children at larger providers are under-represented in the providers’ survey).
Just over half of providers reported that parents had free choice when they used the extended hours, with 39 percent reporting that parents had flexibility within some restrictions and only 10 percent reporting that the extended hours had to be taken on days or at times specified by the provider (figure 22). A higher proportion of voluntary providers reported they offered more flexibility, while a higher proportion of maintained providers reported that they offered less flexibility.
For all free entitlement hours, 38 percent of parents reported that they had free choice in when they took free entitlement hours, 42 percent that they had flexibility within some restrictions and 21 percent that they had to take the free entitlement hours on the days or at the times specified by the provider (figure 23). Parents reported that schools offered the lowest levels of flexibility, but other types of providers were reported to offer roughly similar levels of flexibility (indicating either greater discrepancies between providers’ and parents’ perceptions of flexibility for voluntary providers and childminders or that these

109
types of providers were more flexible for the extended hours than they were generally for all free entitlement hours).
Figure 22: Provider report of parental choice in using extended hours
Source: Evaluation Survey of Providers, 2017 Note: Sample sizes are 233, 72, 171, 69 and 561 for private, voluntary, childminder, maintained and all types of providers.
Figure 23: Parent report of choice in using free entitlement hours
Source: Evaluation Survey of Parents, 2017 Note: Sample sizes are 944, 534, 199, 983 and 2,714 for day nurseries, playgroups, childminders, schools and all types of providers.
51%
30%
57%
68%
48%
39%
43%
34%
31%
43%
10%
26%
9%
1%
9%
0% 20% 40% 60% 80% 100%
All types
Maintained
Childminder
Voluntary
Private
Free choiceFlexibility but within some restricttionsHours can only be used on specified days or times
38%
32%
37%
41%
42%
42%
38%
51%
45%
42%
21%
30%
12%
14%
16%
0% 20% 40% 60% 80% 100%
All types
Schools
Childminder
Playgroup
Daynursery
Free choiceFlexibility but with some restrictionsDays and times are specified by provider

110
Across LAs, both providers and parents reported a higher degree of flexibility in LA E than in other LAs, reflecting the higher level of private and voluntary provision for the extended hours. There was similar consistency in reports of a lower level of flexibility in LA B where maintained provision of the extended hours was relatively high (tables 74 and 75 in Annex B).
Most providers (75 percent) who had children using only the universal 15 hours free entitlement reported that the extended hours had not affected the flexibility of the universal 15 hours, although 16 percent reported that the offer had become more limited because of the extended hours while 9 percent reported that it had become more flexible (figure 24). A slightly higher proportion of maintained providers than other provider types reported that flexibility had improved, although this may have been due to these types of providers having lower levels of flexibility initially. This pattern was reflected in higher proportions of providers reporting improvements in flexibility in LAs B and C where maintained provision is particularly important in the delivery of the extended hours (table 76 in Annex B).
Figure 24: Provider report of change in flexibility for universal 15 hours entitlement
Source: Evaluation Survey of Providers, 2017
Note: Sample sizes are 231, 70, 126, 67 and 507 for private, voluntary, childminder, maintained and all types of providers.
The case studies illustrated how flexibility could become more limited because of the extended hours. As some settings became busier they became less flexible as an increase in demand allowed them to make offers that maximised staff utilisation. For example, a relatively new day nursery had been working in collaboration with a nearby nursery class that provided only the universal entitlement. The day nursery offered
9%
18%
8%
8%
8%
75%
67%
86%
74%
70%
16%
15%
7%
18%
23%
0% 20% 40% 60% 80% 100%
All types
Maintained
Childminder
Voluntary
Private
Flexibility improved Flexibility stayed the sameFlexibility became more limited

111
parents both the additional half day session the school did not provide, as well as wraparound care. Although this level of flexibility did not maximise occupancy, it was considered necessary while the setting built up its business. Now that the setting had become established and the rollout out of the extended hours was expected to generate more demand, the setting was planning to stop offering the wraparound sessions and only offer parents using the nursery class the option to take half a day session.
Within the same setting, flexibility could vary over time; for example, some settings said they offered more flexibility to their September starters because it was a quieter term, while they were less flexible in the spring and summer terms as they became busier.
There is also considerable evidence of lack of flexibility in how the 30 hours could be accessed by parents. This did not necessarily mean that parents could not use the service when they needed it, but some faced a trade-off between flexibility and being able to access extended free entitlement hours that were truly free, as this mother explained:
“There are settings where the funding covers the costs but they are just less flexible. If you want [the setting] to meet your need for time, if time is a problem, then you have to pay, that’s what I’ve found.”
There were several ways in which limitations could be placed on how free entitlement hours could be accessed. In some cases, the restrictions already applied to the universal 15 hours offer, while in other cases they were introduced specifically for the extended hours. Some providers had not set any limitations for the early implementation, but used the experience to decide whether and what restrictions to impose to make the offer financially viable in the future. Examples of these limitations include:
• Full-time providers who offered the free entitlement hours only during term time and for a short day, so that parents could be charged for wraparound and holiday provision. Because of these limitations some parents who did not use provision every day could not use the full 30 hours entitlement, but still had to pay for wraparound and holiday provision. It is interesting to note that these restrictions were being considered even if it meant losing a flexibility premium that an LA paid when free entitlement hours could be used all year around and to cover a long day.
• The free entitlement hours offer was fixed to either five morning or five afternoon sessions and parents who needed a full day had to pay extra, even if it meant they could not use all the 30 hours because they did not need provision every day.
• Some settings had a requirement for a minimum number of days a week, regardless of whether parents were paying for a place or using the free entitlement offer.

112
• Giving parents the option to take free entitlement hours at less popular times when there was plenty of spare capacity, such as afternoon sessions or Fridays. If these times did not suit parents or were not sufficient to cover all their needs, they had to pay for provision at other more popular times.
• Some providers were asking parents to take all the free entitlement hours in their setting and did not offer places to parents who wanted to split the free entitlement hours with other providers.
• It was common practice for settings to require parents to book for whole sessions, regardless of whether it was free entitlement or paid provision. In settings with very long opening hours, this meant that some parents were “losing” some of their free entitlement hours if they did not need to drop off their child until some time after the session began or collected their child well before closing time. Among these parents, there were some who had to pay for additional hours not covered by these free entitlement sessions.
• Some settings only provided a stretched offer, which meant that some parents using a long day had to use some of their free entitlement hours and pay a retainer or the full cost for care during schools holidays which they did not use.
• Free entitlement hours could not be used for specific sessions which attracted a “premium rate” such as very early opening sessions that parents had to book separately.
It should be noted that not all settings were imposing these restrictions and some did their best to ensure parents could get the most out of the free entitlement hours. Some providers allowed considerable flexibility and supported parents to work out how to optimise use of the free entitlement hours. For example, providers not only worked out the “stretched offer” for parents, but allowed them to “bank” any free unused hours for ad hoc provision that the parents may need at some later stage. Some parents said help from their provider was the key to making the most of the free entitlement hours as they had not realised you could “bank” hours or stretch the extended hours over the holidays. As this mother explained:
“[Childminder] is godsend. She is so friendly and accommodating, and easy-going and flexible, hard-working, loving and caring. And she worked it [how could use free entitlement hours] all out and it’s a big saving for us.”
The evidence from the early innovators also showed that around half of the LAs reported that there was either no evidence on parental demand for greater flexibility or that there was little demand. The other half reported that there was definitely an interest in or need for greater flexibility in care, with a small number each mentioning a need for longer hours, holiday care and more flexibility in schools. In addition, there was little indication of substantial intention on the part of providers to offer more flexible or longer hours, partly

113
because of a feeling that provision is already quite flexible. The main issue (mentioned by around half of the LAs) was a reluctance or inability for schools to extend opening into the holidays because, among other factors, they are limited by teachers’ pay and conditions and the premises they use.
The evidence from the early innovators suggested that what is unknown around flexibility is whether change will be principally demand led by parents or principally supply led by providers. In particular, it was not clear whether providers would respond to any demand for longer days, weekends and school holidays. It was also unclear whether the level of flexibility currently available is already sufficient to meet parental expectations.
7.3 Additional fees and charges It was not unusual for parents using the extended hours during early implementation to be paying for additional hours. This may have been due to the limitations placed on accessing the free entitlement hours described in the previous section or could have been because parents needed more than the 30 hours each week (or more than the spread offer of around 23 hours). It is important to note throughout that these parents were likely to have been paying for additional hours with the universal 15 hours free entitlement prior to taking up the extended hours.
Table 30: Proportion of children with additional paid hours by provider type
Private Voluntary Childminder Maintained All types
Proportion paying for additional hours
29% 14% 21% 9% 23%
Number of places 2,785 682 351 982 4,924
Sources: Early Years Census, School Census and additional evaluation data collection, January 2017
According to the census data, parents were paying for additional hours in 23 percent of extended hours places, with the proportion higher for private and childminder providers (29 percent and 21 percent) than for voluntary and maintained providers (14 percent and 9 percent) (table 30). This proportion varied across the LAs from 16 percent to 33 percent in ways that do not appear to be related to the patterns of types of provision of background context, although the differences are not large.
A larger proportion of parents were paying “additional charges” (that is, payments for items such as lunches, snacks or special activities32 which are not included in the fees) than the proportion paying for additional hours. According to the evaluation survey of
32 The early implementation guidance for LAs stated that providers were not to levy any additional charges to parents as a condition of taking up the extended hours.

114
parents, 61 percent of those using extended hours were paying additional charges to at least one provider from whom they were receiving entitlement hours (although not necessarily the one delivering the extended hours). This proportion was higher for households with higher incomes: 56 percent of those in the lowest income group were paying additional charges, 61 percent in the middle income group and 66 percent in the highest income group.33
The first row of table 31 shows that 55 percent of these free entitlement places involved payment for additional charges. This proportion was somewhat lower for childminder places (32 percent) than for other types of providers. It was also notably lower in LAs B and D than other LAs (28 percent and 33 percent respectively) (table 78 in Annex B) which may be related to LA B being a less affluent area and LA D having rationed extended hours places to lower income families.
The lower panel of table 31 presents the combinations of additional charges with paying fees. In the evaluation survey of parents, parents could report that they paid fees for a minority of the hours; for a majority of the hours; or for all hours. If parents reported paying for all hours they could also report that they received a reduction on their childcare bill because of the universal 15 hours free entitlement or the 30 hours free childcare. The first row in the lower panel in the table is consistent with the finding in the census data that parents were less likely to be paying fees for additional hours to playgroups (voluntary providers) and schools (maintained providers) than other types of providers. The table shows that just over a quarter (27 percent) of parents reported that they did not pay for additional hours or any additional charges, while around one third (32 percent) only paid additional charges. Among those paying some fees, there is a reasonably even split between those also paying additional charges and those not (and the split is also constant within each provider type). Hence, the payment of additional charges does not seem to be related to whether parents are paying fees for additional hours, indicating no evidence that providers might be using additional charges to raise income when they cannot charge fees for additional hours.
33 Lower, middle and higher income are defined as annual gross household income below £32,000, £32,000 or more and below £52,000, and £52,000 or more respectively.

115
Table 31: Payment of fees and additional charges for free entitlement providers by provider type
Day nursery
Play-group
Child-minder School All types
Percentage with additional charges
57% 50% 32% 61% 55%
Combinations of additional charges and fees
No fees: - no charges - charges
15% 23%
39% 35%
27% 11%
31% 44%
27% 32%
Fees for minority of hours: - no charges - charges
18% 25%
6% 11%
23% 16%
5% 12%
11% 17%
Fees for majority of hours: - no charges - charges
3% 3%
2% 1%
11% 3%
2% 2%
3% 3%
Fees for all hours: - no charges - charges
8% 5%
3% 2%
7% 3%
2% 2%
4% 3%
Total
100%
100%
100%
100%
100%
Number of free entitlement places 933 527 198 978 2,690
Source: Evaluation Survey of Parents, 2017 Notes: Fees for a minority or majority of hours indicates that parents are paying for some additional hours. Fees for all hours means that the parents report paying for all hours but receiving a reduction on the bill due to the 15 hours free entitlement or the 30 hours free childcare. In these cases, parents perceive that they are not receiving any free hours, but just a reduction on their childcare bill. Charges are additional charges paid by the parents for lunches, snacks or special activities which are not included in the fees.
Although more than half of parents using the extended hours reported that they paid some additional charges to at least one provider from whom they received free entitlement hours, only 14 percent of providers in the evaluation survey reported that they had introduced or increased charges because of delivery of the extended hours (figure 25). Nevertheless, this is still a notable change and was most prevalent among private providers (19 percent) and least prevalent among voluntary providers (3 percent). In addition, the proportion was notably higher (24 percent) in LA H with the universal offer

116
(table 79 in Annex B). If this was related to the universal nature of the offer, it indicates that the introduction of, or increases in, charges could be more widespread in the national rollout than in the early implementation.
Figure 25: Increases in charges by provider type
Source: Evaluation Survey of Providers, 2017
Note: Sample sizes are 231, 72, 169, 69 and 557 for private, voluntary, childminder, maintained and all types of providers.
In-depth interviews with parents in the case studies showed that there was confusion among some about payments they still had to make after they became entitled to the 30 free hours. Some parents did not have to make any payments or were clear that that they were being asked to pay for optional extras (such as food). Others were not sure what they were paying for but they trusted their setting to do the calculations for them. They seemed particularly unlikely to query the “30 hours discount” if they were making a considerable saving; as a parent put it: “You don’t look at a gift horse in the mouth”.
Some settings told parents that they viewed the funding for the extended hours as insufficient to cover their costs and that they had to find a way of recouping these costs. Some understood settings’ positions and were happy with the charging arrangements. Other parents were not very happy about this, but as their childcare bill was lower than before their gratitude seemed to outweigh any frustrations about the fact that they had to pay even if they did not fully understand what they were paying for.
Other parents were less accepting and resented the fact that they were paying for what they believed should have been “free hours”. Parents seemed particularly frustrated if the
14%
10%
13%
3%
29%
4%
1%
4%
4%
5%
83%
88%
83%
93%
76%
0% 20% 40% 60% 80% 100%
All types
Maintained
Childminder
Voluntary
Private
Introduced or increased charges due to extended hoursIntroduced or increased charges but not due to extended hoursDid not introduce or increase charges
117
saving they were making was marginal and / or their experience contrasted with their expectations when they first heard about the policy. They had believed they would get 30 free hours only to discover that they were not 30 hours a week, they were not free, and the setting imposed considerable restrictions and did not seem very keen to provide the offer. As this parent explained:
“‘What I understand is that nurseries lose money with this scheme, as their hourly rate is higher than what the government gives them ... what I don’t like is that they come to you … as if it was my problem, or if I should feel guilty about it. That’s what I really feel cross about. I feel sorry for them but I am not doing anything illegal.”
Parents were aware that practices varied and that they could get much more for their free entitlement hours in some settings than others, but if a child was … already at a setting they were reluctant to move him / her. One parent, who resented the fact that she was not allowed to stretch the free entitlement hours and had to pay for holiday provision, even though she had not used up her 30 hours entitlement, explained that:
“… I’ve left her [child] where she is, but it leaves a bitter taste in your mouth, to be honest.”
If parents chose a setting after they became eligible for the extended hours, they had generally enquired whether the extended free entitlement hours were offered but seemed to have been less aware of the limitations on the use of free entitlement hours. Their advice to other parents was to:
“… check the setting’s policy on using funding before you sign-up as I didn’t do that and I regret it.”
LA early implementation teams were aware that settings’ practices around charging and limitations on how the free entitlement hours could be used meant that some parents may not fully benefit from the offer and there was particular concern about the impact these practices had on lower income families. However, it was very difficult for LA staff to “‘interfere”’ with providers’ business decisions particularly as these may reflect parental demand for a particular high-cost service and / or interference could threaten a provider’s financial viability. Furthermore, even if they wanted to intervene, they reported “grey areas” in the guidance that made it difficult to establish if a setting was contravening the DfE guidance. Even if it was possible to conclusively argue that they were, they did not feel they had the tools to enforce DfE guidance.
Overall, around 14 percent of providers had introduced or increased additional charges because of the extended hours. But there is also a potential conflict between allowing providers and parents to mutually agree payments for optional extras which not all parents desire or need and ensuring that parents are able to access the extended hours completely freely if they wish and need to.
118
7.4 Summary and recommendations In summary, the evidence from the early implementation showed that:
• Most providers did not need to extend their opening hours as they were already offering full-day, year-round provision, but there were indications that some providers with shorter hours were increasing the length of time that they opened during the day.
• There was limited use of the extended hours during holiday periods, partly because one third of the providers did not offer holiday care and partly due to parental choice. However, there was also evidence that some parents had been told by providers that they could not take the extended hours during the holidays or were not aware that they could use the extended hours to cover holiday provision.
• More broadly, most parents had a free choice or at least some choice in when they took the extended hours, but there were several ways in which some providers limited parental choice for a minority of parents.
• Around 14 percent of providers had introduced or increased additional charges for parents because of the extended hours.34 However, parents reported that the majority (55 percent) of free entitlement places involved payment for additional charges.
• LAs have found it challenging to ensure clarity among providers and parents on the guidance on flexibility and additional charges and to know how to enforce it.
This suggests the following recommendation for the national rollout:
(G) Improvements in the guidance for the extended hours could be considered including:
• Greater clarity on parental rights over some aspects of flexibility.
• Creating a balance between allowing some additional charges while ensuring they do not deter take-up of the extended hours.
• Greater clarity for LAs on what they could do if providers breach the conditions.
• Greater support from DfE to provide prompt and definitive answers when LAs are challenged by providers or parents on how the guidance is being implemented.
34 The early implementation guidance for LAs stated that providers were not to levy any additional charges to parents as a condition of taking up the extended hours.

119
8. What was the financial impact for providers? This chapter explores the evidence from early implementation which can inform on the possible financial impact on providers of delivering the extended hours in the national rollout. The first section presents evidence from early implementation on the impact of delivering the extended hours on providers’ costs and profits, while the second offers some recommendations for considerations in setting funding rates following the national rollout.35
8.1 Financial impacts during early implementation One of the aims of early implementation was to support innovation to reduce costs of childcare delivery. It was also thought that higher occupancy rates driven by the extended hours could reduce hourly costs per child. On the other hand, extending opening hours or offering greater flexibility in when parents could use hours had the potential to raise hourly delivery costs per child, while expanding provision could raise or lower hourly delivery costs.36
In response to the evaluation survey of providers, 7 percent of providers felt that delivery costs had decreased because of the extended hours, while almost two thirds (62 percent) reported there had been no change and almost one third (30 percent) reported that costs had increased as a result of delivering the extended hours (figure 26). Almost half of private providers reported that the extended hours had an impact on their delivery cost, with over a third reporting that costs had increased as a result of the extended hours but almost one in ten reporting costs had decreased. Smaller proportions (around one third) of other types of providers reported an impact, but childminders were most likely to report that costs had declined relative to those reporting rises. However, there was no marked pattern in the degree of changes across LAs (table 80 in Annex B).
35 A description of the funding rates for the free entitlement hours from DfE to LAs and then from LAs to providers is summarised in table 7 in section 3.3. 36 Although small settings have the highest delivery costs, delivery costs do not decline uniformly with setting size and expansion can require the use of higher cost resources such as taking on more expensive venue space or paying higher salaries to obtain additional staff. For example, see table 21 in Blainey, S. and Paull, G., (2017), Study of Early Education and Development (SEED): The cost and funding of early education, Department for Education Research Report DFE-RR552, January, https://www.gov.uk/government/uploads/system/uploads/attachment_data/file/586235/SEED_-_The_cost_and_funding_of_early_education_-_RR552.pdf

120
Figure 26: Changes in delivery cost due to the extended hours
Source: Evaluation Survey of Providers, 2017
Note: Sample sizes are 219, 68, 162, 64 and 529 for private, voluntary, childminder, maintained and all types of providers.
A key cost element in childcare provision is staff cost and one driver of rising costs with delivery of the extended hours could be the need to hire more expensive staff (that is, those with higher hourly costs) due to the use of agency staff or simply the need to attract additional workers. However, only 12 percent of providers reported that hourly staff pay had risen due to delivery of the extended hours (figure 27), indicating that increasing hourly staff costs was not the driver behind any rising costs for most providers. In addition, while there is some similarity in the patterns in changes in costs and changes in hourly staff pay across provider types, the divergence indicates that other factors are also important in explaining the changes in costs due to the delivery of the extended hours.37
37 While quite a high proportion of childminders (15 percent) reported that hourly staff costs had decreased due to delivery of the extended hours, it should be noted that a large proportion of childminders did not answer this question, most likely because few childminders employ additional staff with explicit hourly pay or have a strong sense of the hourly payment to themselves for their time beyond a broader notion of the return to operating the business.
30%
34%
21%
28%
39%
62%
63%
69%
69%
53%
7%
3%
10%
3%
8%
0% 20% 40% 60% 80% 100%
All types
Maintained
Childminder
Voluntary
Private
Increased No change Decreased

121
Figure 27: Changes in hourly staff pay due to the extended hours
Source: Evaluation Survey of Providers, 2017
Notes: Sample sizes are 230, 72, 66, 139 and 522 for private, voluntary, childminder, maintained and all types of providers. A breakdown of this figure by LA is presented in table 81 in Annex B.
Figure 28: Changes in profits due to the extended hours
Source: Evaluation Survey of Providers, 2017
Note: Sample sizes are 203, 43, 163, 50 and 471 for private, voluntary, childminder, maintained and all types of providers.
12%
6%
6%
11%
20%
83%
94%
79%
86%
80%
5%
0%
15%
3%
1%
0% 20% 40% 60% 80% 100%
All types
Maintained
Childminder
Voluntary
Private
Increased No change Decreased
22%
32%
21%
35%
18%
38%
44%
44%
26%
34%
40%
24%
35%
40%
48%
0% 20% 40% 60% 80% 100%
All types
Maintained
Childminder
Voluntary
Private
Increased No change Decreased

122
The impact of delivering the extended hours on providers’ profits reflects a combination of the effect of a switch in income from parental fees to funding payments as well as the effect on delivery costs presented above. Around one fifth (22 percent) of providers reported an increase in profits due to delivering the extended hours, while 40 percent reported that profits had decreased (figure 28). A larger proportion of providers reported an impact on profits than reported an impact on costs (62 percent compared to 38 percent), but the size of the difference indicates that a substantial part of the impact on profit could have been driven by the effects of costs rather than the change in the balance of the income sources.
Around one third of voluntary and maintained providers measuring profits reported a positive impact on profits, although maintained providers may have interpreted the question as asking about “surplus” rather than profit strictly defined. Indeed, voluntary providers were almost as likely to report a positive impact on profits as a negative one and more maintained providers reported a positive effect than a negative one. However, almost half (48 percent) of private providers and around one third (35 percent) of childminders reported a negative impact on profits. Across LAs, LA A stood out as having an unusually low proportion of providers reporting a positive impact on profits and an unusually high proportion reporting a negative impact (table 82 in Annex B), most likely driven by the change in funding source in a relatively affluent area with a higher proportion of private and childminder provision.
The case studies found that providers’ views on the financial impact of the extended hours varied considerably. In very affluent areas within LAs where childcare fees were high the level of the funding rate was critical and it proved hard to persuade providers to engage with an offer that was generating a level of funding substantially below what parents paid for childcare. However, in other areas, views on financial impact seemed to depend much more on the business model operated by individual settings than on external factors (such as the funding rate or the local childcare market) as providers operating in the same market and receiving the same funding rate expressed very different views about the level of funding for the offer. In addition, being able to use spare capacity and / or increase occupancy was not seen as a key determinant of financial viability. While the extended hours were more attractive to providers with spare capacity, this did not appear to be a “deal breaker” in influencing views about the financial viability of the offer. Providers who considered the funding to be insufficient did not think an increase in occupancy would make up for the shortfall between what it cost them to deliver a free entitlement place and the funding rate. Even in cases where, during the early implementation, the increase in occupancy had made up for the shortfall, this was not seen as making the offer financially sustainable in the longer term because settings were not planning to regularly operate with a low level of occupancy and would expect to find other ways of filling places. Providers who thought the funding was adequate, saw the potential for increasing occupancy as an additional benefit but not essential to make the offer financially viable.

123
The case studies found that views on financial viability did not seem to closely align with provider type, although the gap between what the rate was and should be to be viable seemed smaller among playgroups and childminders who reported that the funding rate was inadequate than among day nurseries who considered the funding insufficient. However, different provider types did face different issues in adjusting their funding model:
• For day nurseries, the extended hours could result in a considerable change in the balance between income from different sources, with more money coming from free entitlement provision and a corresponding decrease in income from parent fees. This meant that they had to negotiate a sustainable way of making this switch with the LA if they did not think that LA funding was sufficient to deliver the extended hours. Some found the DfE guidance confusing and needed help to decide what they could and could not do to make the offer work for their setting. Others typically had already worked out how they wanted to do this, but they needed the LA’s approval and reassurance that it was in line with DfE guidance. Alternatively, they could limit the number of free entitlement places to maintain what they considered to be a financially viable split between the two funding sources.
• Playgroups were typically already relying largely on LA free entitlement provision and the main issue was to consider whether the funding was sufficient to cover the additional costs associated with longer and more flexible provision so that it would be financially sustainable. LA support in working out a sustainable business model was important for playgroups, particularly voluntary ones that had limited business expertise and resources. If they concluded that they needed to raise more money from parents to be financially viable, they needed support with introducing charges and conditions as they typically had limited experience of doing this.
• For childminders, the key adjustment was (greater) involvement with funding provision. For some this was a welcome switch to a more stable funding source, but for others it represented a loss of income. Again some childminders needed business support from the LA to work out the financial implications of delivering the extended hours. Compared with day nurseries, childminders appeared less aware of options for charging and less confident in negotiating with the LA a sustainable way of delivering the extended hours.
• For nursery classes and nursery schools, the extended hours did not appear to raise insurmountable funding challenges, apart from those receiving a considerably higher funding rate than other providers for the universal entitlement in recognition of the higher delivery costs of teacher-led provision. For these settings, the funding rate for the extended offer was considerably lower than for the universal offer (for example, there was a difference in the hourly rate of £2 in one LA) and it was not clear how the funding shortfall will be covered when the

124
numbers involved may substantially increase. This was a particular issue for nursery schools as they did not have the kind for room for manoeuvre that primary schools with much bigger budgets could have.
This evidence suggests that the financial impact on providers is influenced by two sets of factors:
a) The extent of the change in the balance in income sources from parental fees to free entitlement funding, combined with the relative level of free entitlement funding rates to fees. The financial impact of this change will depend upon whether funding rates are higher or lower than parental fees which, in turn, depend upon the level of affluence and parental demand in the local area and the actual or perceived “quality” of the provision for which parents are willing to pay more.
b) The impact on delivery cost degree, including a potential reduction due to increased occupancy or a potential increase if costly adjustments to provision are required. However, although delivering the extended hours could increase occupancy and reduce delivery costs per child, it was generally felt that this was not a substantial effect. On the other hand, for providers not currently offering full-day, year-round, flexible provision, there could be substantial cost impacts in adjusting their provision, both around shorter-term adjustment costs and longer-term ongoing costs.
Table 32 considers the relationship between the change in profits and change in delivery cost using data from the evaluation survey of providers. One third of providers reported no change in profits or cost due to the delivery of the extended hours, while almost another third who reported no change in cost were evenly divided between those reporting an increase in profits and those reporting a decrease in profits (15 percent and 14 percent). This suggests that change in the balance of the funding source, in the absence of any impact on cost, may benefit as many providers as it has a negative impact on. As might be expected, most providers who reported an increase in the delivery cost because of the extended hours also reported a decline in profits (19 percent of the 30 percent with a rise in cost), although a small proportion (6 percent) still reported an increase in profit in spite of the increase in cost. Interestingly, almost all providers who reported a decrease in cost also reported a decrease in profits (7 percent of the 8 percent reporting a decrease in cost), supporting the case study evidence that even when costs decreased it was not sufficient to outweigh any losses from the change in income source.

125
Table 32: Changes in delivery cost and profits due to the extended hours
Private Voluntary Childminder Maintained All types
No change in cost: - profits increased - profits decreased - no change in profit
10% 16% 28%
26% 14% 26%
17% 12% 39%
18% 6%
41%
15% 14% 33%
Cost increased: - profits increased - profits decreased - no change in profit
7%
24% 8%
7%
21% 0%
4%
13% 4%
12% 16% 4%
6%
19% 5%
Cost decreased: - profits decreased - no change in profit
7% 1%
5% 0%
10% 1%
2% 0%
7% 1%
Total
100%
100%
100%
100%
100%
Number of providers measuring profits
196 42 157 49 456
Source: Evaluation Survey of Providers, 2017
Note: Statistics for subgroups with less than 50 observations have been indicated in italics.
The patterns across provider types in table 32 should be treated with caution given the small sample sizes for some of the types (particularly voluntary and maintained providers). However, one distinctive feature is that, for providers which report no change in cost, private providers are more likely to report a decrease in profits, and voluntary and maintained providers are more likely to report an increase in profits. This suggests that private providers are more likely to be adversely affected by the change in the balance of the income stream from parental fees to entitlement funding.
It is important to note that there are some limitations on applying the evidence on financial impact from early implementation to the national rollout. In particular:
• During early implementation, some providers were waiting until September 2017 to make changes to fees and additional charges.
• The critical element in the national rollout will be the funding rates paid from LAs to providers following the introduction of the EYNFF in April 2017. In addition, funding rates for the extended hours were generally higher than for the universal 15 hours during early implementation (see section 3.3), but a uniform rate will be set for both the initial and extended hours in the national rollout.

126
• There are a collection of other ongoing factors (such as changes in the living wage, pension contributions and business rates) that may impact on provider finances and also mean greater uncertainty for providers in their business planning and ability to assess the financial impact of delivering the extended hours.
8.2 Summary and recommendations In summary, the evidence from the early implementation showed that:
• Delivery of the extended hours had mixed financial impacts on providers, although the tendency was towards higher delivery costs and lower profits.
• The financial impact on providers depends upon two sets of factors:
(a) The extent of the change in the balance in income source from parental fees to free entitlement payments combined with the relative level of free entitlement funding rates to fees.
(b) The impact on delivery cost, including a potential reduction due to increased occupancy or a potential increase if costly adjustments to provision are required.
• Drawing conclusions on the financial impacts for the national rollout from early implementation is limited by the fact that funding rates will be different for the national rollout with the introduction of the EYNFF.
This evidence suggests the following recommendation for the national rollout:
(H) In future reviews of funding rates in the EYNFF, there is a need to be explicit about the level of service that the funding rates are expected to support in terms of quality and flexibility. In addition, these reviews need to consider the drivers of ongoing changes in delivery costs.

127
9. Did parents take up places? This chapter explores the evidence from early implementation which can inform on the likelihood that parents will be willing and able to take up the extended hours during national rollout. The first section presents a profile of the type of families using the extended hours during early implementation, while the second section examines how parents were engaged with the policy. The third section examines take-up among the families with different needs that were a particular focus during early implementation, beginning with low income families and then considering families with children with SEND or a health problem, BME families and families living in rural areas. The final section offers some recommendations on approaches to facilitating parental take-up in the national rollout.
9.1 Profile of families using the extended hours Data from the Early Years Census and School Census showed that the take-up of the extended hours during early implementation was roughly equal between children aged three and four and between boys and girls. Around 8 percent of three year olds and around 10 percent of four year olds eligible for the universal entitlement used the extended hours, resulting in 31 percent of children using the extended hours being aged four. Take-up was very slightly higher among boys than girls (9 percent for boys compared to 8 percent for girls), resulting in 53 percent of the children using the extended hours being male.
Detailed information about the background of families using the extended hours was collected in the evaluation survey of parents. This allowed an analysis of the profile of families using the extended hours (that is, the proportions of users with different characteristics), but an examination of take-up among different groups (that is, the proportion of users in each characteristic group) was not possible in the absence of information on families not using the extended offer.
Table 33 shows that 15 percent of families using the extended hours were single parents. Most families had two children under the age of 12 and the majority had only one child under the age of five. The proportions of single parents were higher in LA B (reflecting the socioeconomic background of the LA) and in LA D (reflecting the rationing of extended hours places to lower income families). Correspondingly, these two LAs also had the highest proportions of families using the extended hours with just one child under age 12 and just one child under age five (although the difference with other LAs was not large).
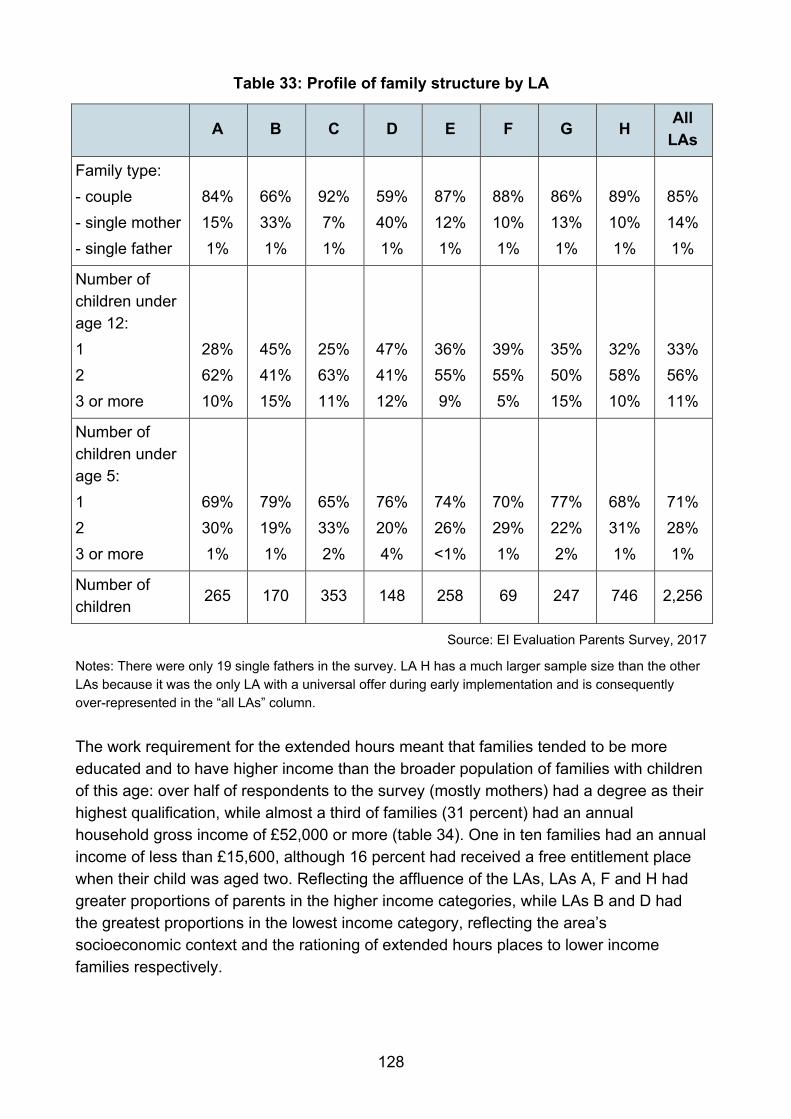
128
Table 33: Profile of family structure by LA
A B C D E F G H All LAs
Family type: - couple - single mother - single father
84% 15% 1%
66% 33% 1%
92% 7% 1%
59% 40% 1%
87% 12% 1%
88% 10% 1%
86% 13% 1%
89% 10% 1%
85% 14% 1%
Number of children under age 12: 1 2 3 or more
28% 62% 10%
45% 41% 15%
25% 63% 11%
47% 41% 12%
36% 55% 9%
39% 55% 5%
35% 50% 15%
32% 58% 10%
33% 56% 11%
Number of children under age 5: 1 2 3 or more
69% 30% 1%
79% 19% 1%
65% 33% 2%
76% 20% 4%
74% 26% <1%
70% 29% 1%
77% 22% 2%
68% 31% 1%
71% 28% 1%
Number of children
265 170 353 148 258 69 247 746 2,256
Source: EI Evaluation Parents Survey, 2017
Notes: There were only 19 single fathers in the survey. LA H has a much larger sample size than the other LAs because it was the only LA with a universal offer during early implementation and is consequently over-represented in the “all LAs” column.
The work requirement for the extended hours meant that families tended to be more educated and to have higher income than the broader population of families with children of this age: over half of respondents to the survey (mostly mothers) had a degree as their highest qualification, while almost a third of families (31 percent) had an annual household gross income of £52,000 or more (table 34). One in ten families had an annual income of less than £15,600, although 16 percent had received a free entitlement place when their child was aged two. Reflecting the affluence of the LAs, LAs A, F and H had greater proportions of parents in the higher income categories, while LAs B and D had the greatest proportions in the lowest income category, reflecting the area’s socioeconomic context and the rationing of extended hours places to lower income families respectively.
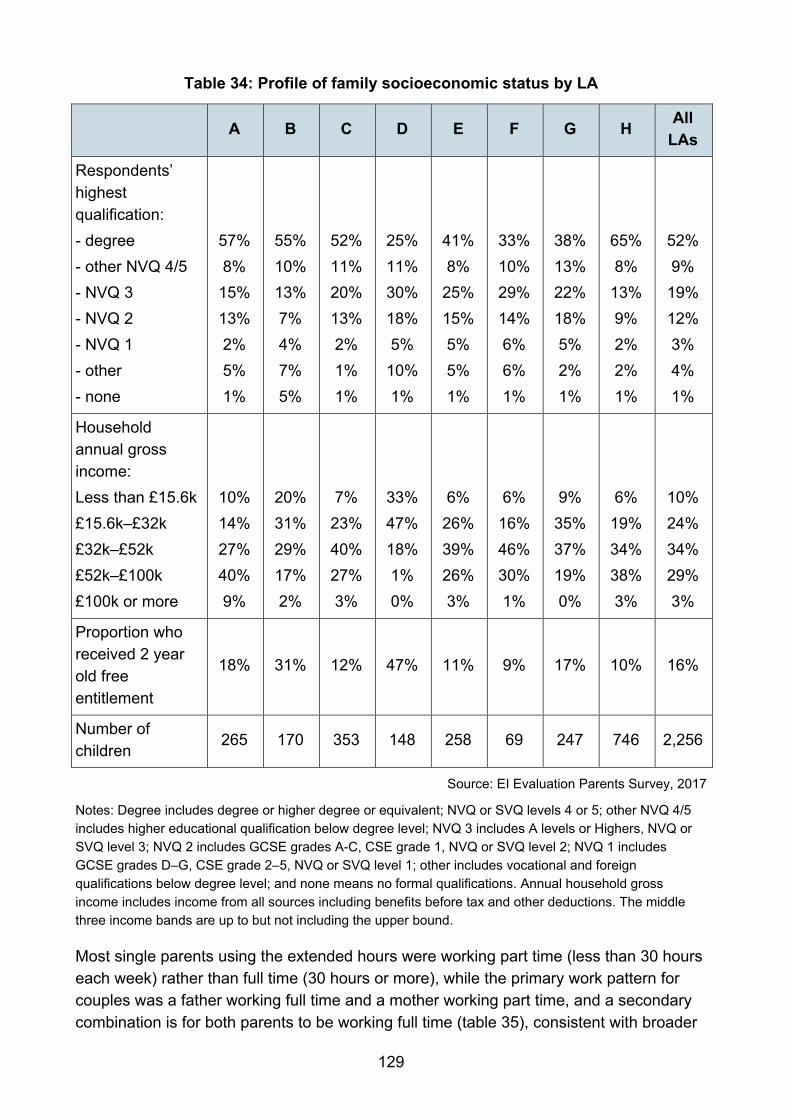
129
Table 34: Profile of family socioeconomic status by LA
A B C D E F G H All LAs
Respondents’ highest qualification: - degree - other NVQ 4/5 - NVQ 3 - NVQ 2 - NVQ 1 - other - none
57% 8% 15% 13% 2% 5% 1%
55% 10% 13% 7% 4% 7% 5%
52% 11% 20% 13% 2% 1% 1%
25% 11% 30% 18% 5%
10% 1%
41% 8%
25% 15% 5% 5% 1%
33% 10% 29% 14% 6% 6% 1%
38% 13% 22% 18% 5% 2% 1%
65% 8%
13% 9% 2% 2% 1%
52% 9% 19% 12% 3% 4% 1%
Household annual gross income: Less than £15.6k £15.6k–£32k £32k–£52k £52k–£100k £100k or more
10% 14% 27% 40% 9%
20% 31% 29% 17% 2%
7% 23% 40% 27% 3%
33% 47% 18% 1% 0%
6% 26% 39% 26% 3%
6% 16% 46% 30% 1%
9% 35% 37% 19% 0%
6% 19% 34% 38% 3%
10% 24% 34% 29% 3%
Proportion who received 2 year old free entitlement
18% 31% 12% 47% 11% 9% 17% 10% 16%
Number of children
265 170 353 148 258 69 247 746 2,256
Source: EI Evaluation Parents Survey, 2017
Notes: Degree includes degree or higher degree or equivalent; NVQ or SVQ levels 4 or 5; other NVQ 4/5 includes higher educational qualification below degree level; NVQ 3 includes A levels or Highers, NVQ or SVQ level 3; NVQ 2 includes GCSE grades A-C, CSE grade 1, NVQ or SVQ level 2; NVQ 1 includes GCSE grades D–G, CSE grade 2–5, NVQ or SVQ level 1; other includes vocational and foreign qualifications below degree level; and none means no formal qualifications. Annual household gross income includes income from all sources including benefits before tax and other deductions. The middle three income bands are up to but not including the upper bound.
Most single parents using the extended hours were working part time (less than 30 hours each week) rather than full time (30 hours or more), while the primary work pattern for couples was a father working full time and a mother working part time, and a secondary combination is for both parents to be working full time (table 35), consistent with broader

130
patterns for working families. The only notable variation across LAs is that LA D has a higher proportion of both parents in a couple working part time and a corresponding lower proportion with both working full time, again, reflecting the rationing of places to lower income parents.
Table 35: Profile of family work patterns by LA
A B C D E F G H All LAs
Single parents
Part-time 13% 18% 6% 31% 9% 6% 9% 7% 10%
Full-time 3% 15% 3% 11% 5% 6% 4% 4% 5%
Couples
Both part-time 4% 5% 2% 9% 2% 1% 3% 3% 3%
Mother part time, father full-time
37% 26% 55% 27% 48% 32% 44% 53% 46%
Mother full-time, father part-time
2% 7% 3% 3% 3% 1% 1% 2% 3%
Both full-time 39% 28% 29% 18% 32% 54% 35% 29% 31%
At least one not working
3% 2% 2% 1% 1% 0% 4% 3% 2%
Total
100%
100%
100%
100%
100%
100%
100%
100%
100%
Number of children
263 168 351 146 256 69 245 740 2,238
Source: EI Evaluation Parents Survey, 2017
Notes: Part-time work means less than 30 hours each week. Couple families could be eligible with one parent not working if the non-working parent met one of the other eligibility criteria such as being in receipt of Disability Living Allowance.
Even within those working part time, there was a tendency for single mothers to work fewer hours each week than mothers in couples, although almost one in ten of both types of mothers are working 40 or more hours each week (table 36). Overall, 39 percent of mothers of children receiving the extended hours are working full time, while 92 percent of the fathers work full time.

131
Table 36: Profile of parents’ weekly work hours
Weekly work hours Single mothers
Mothers in couples All mothers Fathers
1–15 hours 2% 4% 3% <1%
16–20 hours 39% 17% 20% 2%
21–30 hours 29% 38% 37% 5%
31–40 hours 22% 32% 30% 52%
More than 40 hours 8% 9% 9% 40%
Total
100%
100%
100%
100%
Number of parents in work
1,865 320 2,185 1,913
Source: EI Evaluation Parents Survey, 2017
9.2 Engaging parents Most parents started to take up the extended hours in the initial months of early implementation: three quarters were using the extended hours in September 2016 and another 8 percent in October (table 37).
Table 37: When started using extended hours by LA
A B C D E F G H All LAs
Before September 2016
5% 3% 3% 4% 4% 0% 4% 5% 4%
September 2016 83% 84% 65% 52% 77% 16% 82% 69% 71%
October 2016 7% 11% 10% 19% 14% 10% 6% 3% 8%
November 2016 3% 2% 1% 13% 4% 19% 2% 1% 3%
December 2016 <1% 0% 1% 1% 1% 13% 2% 1% 1%
January 2017 or later 2% 0% 19% 11% 1% 40% 4% 21% 13%
Total
100%
100%
100%
100%
100%
100%
100%
100%
100%
Number of children 261 170 346 142 251 67 245 736 2,218
Source: EI Evaluation Parents Survey, 2017

132
While almost all children in four of the LAs began taking up the extended hours during the autumn term, there was a second wave of new starters with the new term in January 2017 in three of the LAs and a larger new intake at the same time in one LA, which had been slower to get the programme started.
Evidence collected in the case studies indicated how recruitment of parents in the seven LAs with rationing of places had to strike a fine balance between selectively promoting the offer to parents who met local eligibility criteria, while also not raising expectations among other working parents with three and four year olds. However, targeted promotion was made difficult because of national announcements about the 30 hours free childcare and because in some cases local eligibility criteria had to be changed to fill places. This caused confusion and some frustration among parents who were not eligible but thought they may be.
The seven LAs that had applied for full implementation but were only given funding for partial implementation had very limited time to revise their plans for delivering rationed places. In some LAs, the initial eligibility criteria did not always work as intended. For example:
• Three LAs had to revise their eligibility criteria a number of times. In LA C the definition of rurality had to be expanded a number of times to fill all allocated places. Targeting low income families proved particularly problematic. LA D had to raise the earnings cap twice (from 22.5K, to £28K and eventually £35K). LA A, which provided the offer in four geographical areas, initially tried to target the extended hours at families who had previously received the two year olds offer, then added families who worked in excess of 30 hours a week. Neither of these criteria generated enough applications and were abandoned with the offer made available to all parents meeting the national eligibility criteria in the selected areas.
• The two LAs that engaged employers in the programme experienced considerable difficulties in recruiting parents via this route. LA E had to develop a second recruitment route via providers, while LA F had to add employers to the programme a number of times and in the spring term had not yet allocated all the places.
• LA G limited eligibility to a very small geographical area but there were no data available to accurately estimate the number of eligible parents who would take up the offer and ended up with more applications than available places.
Social media, local newspapers and the LA website were used to advertise the extended hours and some LAs wrote to parents. Providers were also expected to promote the offer and many did so, playing an important part in encouraging and supporting parents to apply. However, some providers were said to be far less enthusiastic and, for example, emphasised to parents that they were not obliged to offer free entitlement hours and showed some reluctance before finally agreeing to offer the extended free entitlement

133
hours. In two areas (E and F), employers were engaged with the programme and promoted the offer to their employees. However, considerable time had to be invested to involve employers, and promotion via the workplace was most effective when the LA early implementation team arranged drop-in sessions to explain about the offer hours and help parents to apply.
The evaluation survey of parents showed that most parents (58 percent) heard about the policy from their current or previous childcare providers (table 38), while an LA letter or information leaflet, the internet and social media, and word of mouth were also important sources for parents to learn about the policy. Schools were also important sources in the areas where school-based provision was important for the extended hours (LAs B, C and G). Unsurprisingly, large proportions of parents had heard about the offer in the two LAs with the employer-led models via their employer (23 percent in LA E and 42 percent in LA F), although, given the employer-based approach, these proportions may seem quite low.
Table 38: How heard about the policy by LA
A B C D E F G H All LAs
Current or previous childcare provider
45% 54% 42% 71% 72% 41% 70% 60% 58%
LA letter or information leaflet
37% 24% 39% 33% 8% 9% 22% 36% 30%
Internet or social media
12% 14% 22% 19% 12% 25% 20% 32% 22%
Word of mouth 24% 13% 26% 18% 9% 16% 15% 30% 22%
School 5% 14% 24% 3% 3% 3% 15% 7% 10%
Media (TV radio newspaper)
4% 8% 8% 10% 7% 6% 12% 15% 10%
Employer 1% 0% 3% 5% 23% 42% 2% 2% 6%
Children's centre 9% 6% 3% 5% 1% 1% 3% 4% 4%
Other way 3% 1% 2% 1% 0% 0% <1% 1% 1%
Number of children (multiple responses recorded)
265 170 353 148 258 69 247 744 2,254
Source: EI Evaluation Parents Survey, 2017

134
Evidence from the case studies showed that parents were generally positive about the offer: the extended hours were very popular and once parents received the information about the offer, they did not need any persuading to apply for it. Parents were described as being “over the moon” and nearly “biting their provider’s hand off” for a place. They were also very appreciative and described themselves as lucky. As a mother of eligible twins put it, when she heard they got the extended free entitlement hours:
“… it honestly felt like we’d won the lottery, it really did.”
Some parents reflected that this was the first time that working parents were being given something, a particular issue for families who did not receive child benefit. Indeed, it was a welcome surprise for those on higher incomes:
“Great to be getting something for a change.”
The application process was generally described as being straightforward and parents appreciated receiving the outcome very quickly. They described having to tick a few boxes to declare their working arrangements and provide information about their child, and were pleasantly surprised by the simplicity of the process.
Once they were aware of the offer, eligible parents were generally sufficiently self-serving to apply and approach providers for a place without further assistance. However, there were some specific issues which inhibited access for some parents:
• Some parents were concerned about the potential impact of the extended free entitlement hours on their tax credits and wanted to be certain that they would not be expected to pay something back.
• To make best use of the extended hours, some parents would have found it helpful to have received support in the form of a list of providers offering the extended hours so they could narrow the search (only some parents had been given this information) and an explanation of the conditions different providers applied to the offer. While parents were given some generic information about spreading the offer during holidays and top-up fees, this was not always sufficient to understand the complex arrangements some settings had for accessing the offer and associated charges.
• Some parents were reluctant to change providers in order to take up the extended hours, although this may be less of an issue going forward as parents become more aware of the offer when the child is younger.
Figure 29 summarises the key messages that could be helpful for the recruitment of parents to apply for the extended hours in the national rollout.

135
Figure 29: Key messages to help recruit parents
There were also concerns around some elements of the eligibility criteria and the design of the process for parents:
• There was some confusion about which parents are eligible (for example, single parent carers).
• The delay between obtaining work and access to the extended hours at the start of the following term was considered to be a potential barrier to work entry, particularly for those on lower incomes who could not afford to temporarily cover the childcare costs.
• There were some indications that, in the limited number of cases when parents did stop working, they were able to return to work again quite quickly. However, concerns were raised by LAs about the loss of eligibility if a parent stops working as it could reduce continuity in care for the child and create uncertainty in business planning for the provider.
• Some parents (and providers) appeared to have little awareness of what they should do if their circumstances changed.
• There was a risk that parents might “over-spend” hours when using multiple providers.
Evidence from the case studies showed that there were also concerns that any delays in the Childcare Services system when it comes into full operation with the national rollout could discourage parental take-up (and provider participation).
The evidence from the early innovators LA leads also showed:
• Predictions of take-up for the extended hours are generally reasonably high: these ranged from 72 percent to 94 percent across LAs, based mainly on survey analysis, although the definition of take-up and degree of certainty about the behaviour varied.
Almost all working
parents are eligible (it is
for you)
Most providers will
offer the extended
hours (here’s a list)
You have choices about how you take
the hours (here are some options)
Here’s what you need to know about additional
charges and paid hours
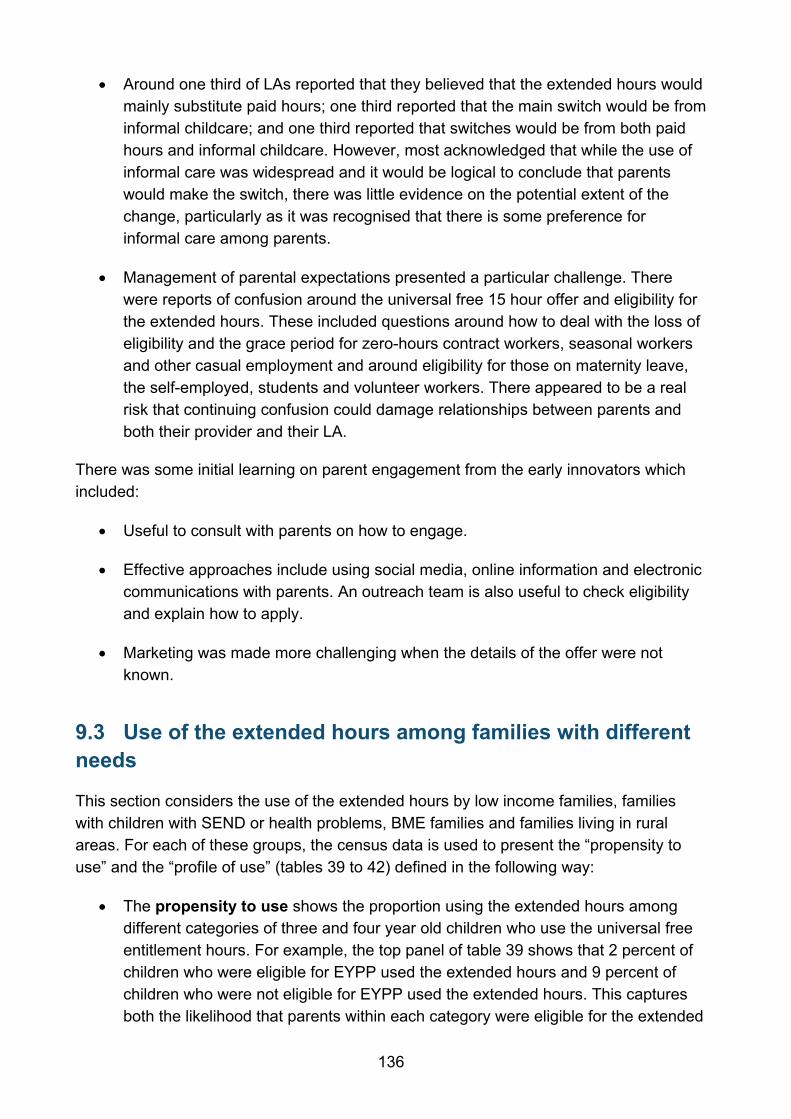
136
• Around one third of LAs reported that they believed that the extended hours would mainly substitute paid hours; one third reported that the main switch would be from informal childcare; and one third reported that switches would be from both paid hours and informal childcare. However, most acknowledged that while the use of informal care was widespread and it would be logical to conclude that parents would make the switch, there was little evidence on the potential extent of the change, particularly as it was recognised that there is some preference for informal care among parents.
• Management of parental expectations presented a particular challenge. There were reports of confusion around the universal free 15 hour offer and eligibility for the extended hours. These included questions around how to deal with the loss of eligibility and the grace period for zero-hours contract workers, seasonal workers and other casual employment and around eligibility for those on maternity leave, the self-employed, students and volunteer workers. There appeared to be a real risk that continuing confusion could damage relationships between parents and both their provider and their LA.
There was some initial learning on parent engagement from the early innovators which included:
• Useful to consult with parents on how to engage.
• Effective approaches include using social media, online information and electronic communications with parents. An outreach team is also useful to check eligibility and explain how to apply.
• Marketing was made more challenging when the details of the offer were not known.
9.3 Use of the extended hours among families with different needs
This section considers the use of the extended hours by low income families, families with children with SEND or health problems, BME families and families living in rural areas. For each of these groups, the census data is used to present the “propensity to use” and the “profile of use” (tables 39 to 42) defined in the following way:
• The propensity to use shows the proportion using the extended hours among different categories of three and four year old children who use the universal free entitlement hours. For example, the top panel of table 39 shows that 2 percent of children who were eligible for EYPP used the extended hours and 9 percent of children who were not eligible for EYPP used the extended hours. This captures both the likelihood that parents within each category were eligible for the extended

137
hours (the eligible proportion) as well as the likelihood that eligible parents within each category used the extended hours (the take up rate).38 In the case of early implementation, it also reflects any structure in the local model which limited or targeted the extended hours to one or more specific categories.
• The profile of use shows the proportion of children using the extended hours in each category. For example, the bottom panel of table 39 shows that 3 percent of children using the extended hours were eligible for the EYPP while 97 percent were not. This reflects both the distribution of all three and four year old children across categories and any differential rate in the propensity to use across categories. For example, the 3 percent proportion of children using the extended hours reflects both that EYPP eligible children were a minority (around 13 percent) of all three and four year olds and that the propensity to use was lower among those eligible for EYPP than those not eligible for EYPP (2 percent compared to 9 percent).
Both of these measures are presented because they inform on different points: the propensity to use is a combined measure of eligibility and take-up across different types of children, while the profile of use shows how important different types of children are in the use of the extended hours.
Using census data, table 39 compares use of the extended hours among families who are eligible for the EYPP with those who are not as a proxy measure for use among lower income families. Eligibility for EYPP is based on parental receipt of specified out-of-work benefits or in-work tax credits or if a child is “looked after” by the LA. The propensity to use was considerably lower among EYPP eligible children: just 2 percent use the extended hours compared to 9 percent for children not eligible for EYPP. Only 3 percent of children who used the extended hours are eligible for EYPP. This pattern is consistent across all LAs and very likely reflects that parents of EYPP eligible children are less likely to meet the work requirement for the extended hours.
Two LAs (A and D) sought to target lower income families for the extended hours. In LA D, the table in section 9.1 showed that a higher proportion of families than in other LAs using the extended hours were low income directly due to the rationing of places to lower income families. However, table 39 shows that the propensity to use the extended hours among children eligible for EYPP was lower than among those not eligible in this LA.
38 The data do not provide any information on the eligibility for the extended hours among three and four year olds using entitlement places which means that it is not possible to separate out the take-up rate.

138
Table 39: Relative use of extended hours among children eligible for EYPP
A B C D E F G H All LAs
Propensity to use: proportion of all children in each category using extended hours
EYPP eligible Not EYPP eligible
1% 2%
3% 6%
3% 16%
2% 12%
1% 3%
1% 8%
5% 12%
16% 53%
2% 9%
Profile of use: proportion of users in each category
EYPP eligible Not EYPP eligible Total
4% 96%
100%
3% 97%
100%
2% 98%
100%
3% 97%
100%
2% 98%
100%
1% 99%
100%
4% 96%
100%
2% 98%
100%
3% 97%
100%
Number of extended hours places
480 404 654 385 420 320 583 1,678 4,924
Sources: Early Years Census, School Census and additional evaluation data collection, January 2017 Notes: EYPP is the Early Years Pupil Premium. See text for explanation of the propensity to use and profile of use. The propensity to use in LA H is higher than in other LAs for all categories because LA H had the universal offer for all eligible children.
LA A also targeted lower income families via those who used the two year old entitlement, but appears to have been less successful given that the proportions of lower income families using the extended hours are similar to those in other LAs not using the same targeting. However, this may have been because LA A is generally a more affluent LA (and without the targeting, the proportions of low income families using the extended hours would have been even lower) or because targeting those who had used the two year old entitlement is not very effective because these parents are less likely to be working and eligible for the extended hours. The LA team believed that it takes time to engage the most vulnerable parents and to support them to find work, and this had not been fully appreciated when their approach was developed. At the time of the case study visit they were starting to see more enquiries from these parents, confirming their views that more time was needed to engage this group, as they explained:
“I think we were probably a bit naïve how quickly we would get people from one minute accessing free early education for two-year olds and not having a job, to, 'Here you go, you've got a childcare place for 30 hours'. It's brilliant. It's almost like we … we missed the middle bit that, just because they've accessed two-year old funding, it doesn't mean they've suddenly got a job.”

139
Table 40: Relative use of extended hours among children with SEN
A B C D E F G H All LAs
Propensity to use: proportion of all children in each category using extended hours
With SEN No SEN
3% 2%
6% 6%
4% 15%
4% 11%
<1% 3%
3% 8%
6% 11%
29% 51%
4% 8%
Profile of use: proportion of users in each category
With SEN No SEN Total
6% 94%
100%
5% 95%
100%
1% 99%
100%
2% 98%
100%
<1% <100%
100%
1% 99%
100%
2% 98%
100%
1% 99%
100%
2% 98%
100%
Number of extended hours places
480 404 654 385 420 320 583 1,678 4,924
Sources: Early Years Census, School Census and additional evaluation data collection, January 2017 Notes: SEN is defined as having an Education, Health and Care (EHC) plan or SEN statement or receiving SEN support. <1% denotes a percentage between 0% and 0.5%. The proportion of children reported as having a long-standing health condition in the survey was higher than the proportion with SEN reported here (4 percent overall, with 3 percent in LAs F and H; 4 percent in LAs B, G and D, 5 percent in LA A and 6 percent in LAs E and G). See text for explanation of the propensity to use and profile of use. The propensity to use in LA H is higher than in other LAs for all categories because LA H had the universal offer for all eligible children.
One of the aims of early implementation was to explore how the extended hours could be made accessible to children with additional needs and three LAs (A, B and G) focused on this theme. The census data showed that the propensity to use the extended hours among children with SEN was as high or higher than those without SEN in LAs A and B, but considerably lower in the other LAs (including LA G39) (table 40). Consequently, the proportion of children using the extended hours with SEND in these two LAs was notably higher than for the other LAs (6 percent and 5 percent respectively compared to 2 percent or less in the other LAs). While the propensity to use the extended hours among parents with children with SEN might be expected to be lower because additional caring needs might inhibit parents’ ability to work or to find a suitable childcare place for their
39 This may have been because LAs A and B had a dual strategy of supporting providers with SEND training and coaching and promoting the offer to families with SEND children, while the focus in LA G was only on the former which on its own is unlikely to result in an increase in take-up in the short term.

140
child, the evidence from LAs A and B suggests that a focus on SEND may have helped to address some of that disadvantage.
The case studies in the three LAs focused on SEN provided some useful learning on engaging these families:
• Professional gatekeepers (such as LA Special Educational Needs Coordinators (SENCOs)) were used to promote the offer to families with children with additional needs and it proved important to give parents the opportunity to discuss concerns about a child being in a setting for longer before they made the decision to take up the extended hours.
• Parents who had to enter work to be eligible for the extended hours40 needed help to explore how this would work and how they could combine paid employment with the substantial support their child needed.
• One LA was planning to ask parents with children with additional needs who had taken up the extended hours to become parent champions and support other parents in future. At the time of the case study visit, they were setting up the scheme and had received a good response, with 11 of the 18 parents approached agreeing to be contacted to discuss the possibility of becoming a champion.
• The suitability of using multiple settings for children with additional needs requires sensitive handling and may not always be appropriate, as some children with additional needs may find it hard to get used to two different settings, different staff and different peers.
• While parents may need additional support to engage with the programme, it should not be assumed that the extended hours are “not for them”. Interviews with parents showed that when they had confidence in a setting’s ability to adequately support their child’s needs, they were delighted that their child had the opportunity to be in a setting for longer where she / he could receive more specialist input, while parents had more time to “recharge their batteries”. However, ultimately, it needs to be down to parents to decide if extended hours are suitable for them and their child.
In addition, there were some useful lessons in supporting providers to include children with additional needs:
● Settings’ business models need to take into account the training and development required to support children with moderate needs. This can be supported by LAs in the form of training, mentoring and coaching for non-specialist settings.
40 Some parents were not in work because they were in receipt of the Carer’s Allowance.

141
● LA SENCOs have a major role to play in supporting settings to meet specific needs.
● Settings with specialist knowledge and skills are the key to supporting children with complex needs and providing a “hub” of resources and expertise that others can access.
● Additional funding to support children with complex needs who require one-to-one support must be paid in a timely fashion and be sufficient to cover the costs of the extended hours. Without such funding, there were concerns that mainstream settings may have to turn these children away and specialist units may not have enough places to cater for all these children.
The experience of the LAs focused on this theme have shown that it is possible to deliver extended places to children with additional needs, including those with very complex needs, but the right level and type of support is required to achieve this:
• The process of applying for funding to support children with additional needs could be very time consuming and the outcome may not be known for several weeks. During this time a provider had to find additional resources without knowing if their costs will be covered by the LA or had to somehow manage without additional resources – for example, one setting had to ask the parent to come and feed her child at lunchtime because they did not have sufficient staff at lunchtime to do that.
• As demand for places was increasing (or expected to increase) settings were less likely to have spare capacity, which had been used in the past to support children with additional needs.
• Settings had been very creative in maximising staff utilisation to provide adequate support to children with additional needs (e.g. a member of staff may be used to support a child(ren) who came for the morning session and then a different child(ren) who came for the afternoon session), but some felt they had stretched resources to the limit, and could not cover more hours without additional resources (if children came both to the morning and afternoon sessions the number of staff had to be doubled).
• Not all settings had received the kind of training, support and coaching from the LA which was needed to give them the confidence and skills to support children with additional needs, particularly as LA SEND teams were reported to be very stretched.
• Some settings which were not specialist SEND settings, but were very committed to include children with additional needs and had considerable experience in supporting them, were overwhelmed with requests because of their reputation. As this setting manager explained:

142
“… [how to meet this demand] keeps me awake at night because these children have a right to the 30 hours but the additional costs are disproportionate for a small setting like ours.”
Another target group for early implementation was to support BME families to take up the extended hours. The census data showed that families of white ethnicity (8 percent) had a slightly higher propensity to use the extended hours than other ethnic groups (6 percent for black, 3 percent for Asian and 6 percent for other / mixed) (table 41). The propensity to use the extended hours among BME families was higher than families of white ethnicity only in LAs B and F, although it should be noted that the numbers of BME families in some of the LAs are very small and the proportions may reflect a high degree of randomness. Nevertheless, the overall picture is that BME families only constituted a substantial proportion of families using the extended hours in three LAs, one of which was because the pool of potentially eligible families was ethnically diverse (LA B) and the other two because BME families were almost as likely to use the extended hours as white families (LAs A and F).
Table 41: Relative use of extended hours across ethnic groups
A B C D E F G H All LAs
Propensity to use: proportion of all children in each category using extended hours
White Black Asian Other / mixed
2% 2% 3% 2%
8% 9% 2%
10%
15% 0%
11% 7%
11% 5% 2% 9%
3% 0% 1% 2%
8% 9% 4% 4%
11% 7% 5% 9%
44% 29% 13% 29%
8% 6% 3% 6%
Profile of use: proportion of users in each category
White Black Asian Other / mixed Total
76% 4% 9% 11%
100%
27% 27% 20% 27%
100%
98% 0% 1% 1%
100%
91% 1% 1% 7%
100%
96% 0% 1% 3%
100%
87% 3% 6% 4%
100%
96% 1% 1% 3%
100%
96% <1% 1% 3%
100%
87% 3% 4% 6%
100%
Number of extended hours places
408 365 650 361 382 291 519 875 3,851
Sources: Early Years Census, School Census and additional evaluation data collection, January 2017 Notes: <1% denotes a percentage between 0% and 0.5%. See text for explanation of the propensity to use and profile of use. The propensity to use in LA H is higher than in other LAs for all categories because LA H had the universal offer for all eligible children.

143
Very little evidence on engaging BME families could be obtained in the case studies. Some LAs with BME communities mentioned (when specifically asked) that they had promoted the programme to these communities (LAs A and F), while the issue did not seem relevant in the LA which was broadly ethnically diverse (LA B). When providers were specifically asked about BME families, they could not mention anything that directly related to the extended hours and their practice to promote diversity tended to be more generic covering a broader range of groups.
A final target group for early implementation was to support the provision and use of extended hours in rural areas. One LA (C) rationed places specifically to families living in the most rural areas within the LA which resulted in just over half (51 percent) of families using the extended hours having homes located in officially rural postcodes (see table note) (table 42). Indeed, the propensity to use the extended hours among families living in “rural” areas was notably higher than among families living elsewhere in this LA (40 percent compared to 9 percent). The propensity to use in rural areas was the same or lower than in urban areas in the other LAs, contributing to small proportions of children using the extended hours being from rural areas. However, it is important to note that most of the other LAs had few or, in two cases, almost no, families living in rural areas.
Table 42: Take-up of extended hours among families in rural areas
A B C D E F G H All LAs
Propensity to use: proportion of all children in each category using extended hours
Rural areas Urban areas
1% 2%
0% 6%
40% 9%
0% 11%
3% 3%
8% 8%
11% 12%
32% 52%
13% 8%
Profile of use: proportion of users in each category
Rural areas Urban areas Total
2% 98%
100%
0% 100%
100%
51% 49%
100%
0% 100%
100%
10% 90%
100%
3% 97%
100%
1% 99%
100%
5% 95%
100%
10% 90%
100%
Number of extended hours places
480 404 654 385 420 320 583 1,678 4,924
Sources: Early Years Census, School Census and additional evaluation data collection, January 2017 Notes: Rural is defined as having a home postcode in a “village” or “hamlet and isolated dwelling” as defined by the urban / rural indicator for England and Wales (URINDEW), while urban includes postcodes defined as “urban” or “town and fringe”. See text for explanation of the propensity to use and profile of use. The propensity to use in LA H is higher than in other LAs for all categories because LA H had the universal offer for all eligible children.

144
Although LA C was focused on rurality and a high level of engagement was achieved with parents in rural areas, the evidence collected in the case study suggested that this was due simply to effective implementation and the approach, while adapted to local context, had not included anything that had been rural specific.
In the early innovator programme, most LAs were not developing childcare options for specific types of families (although most mentioned the local inclusion fund for children with SEND). A few LAs mentioned specific issues and measures for rural areas and for BME families (3 LAs each), but did not have well-defined approaches. Indeed, several LAs had undertaken reviews of SEND support and surveys with parents to identify needs, but the interviews with early innovators were too early to report on findings or the effectiveness of approaches. In general, it was too early for the early innovator LAs to comment on the effectiveness of the approaches being developed to support particular types of families. The only initial finding was that one LA reported that most parents from rural areas are accessing childcare in market towns where they work rather than in villages where they live, which has shed light on the demand for childcare in rural areas.
9.4 Summary and recommendations In summary, the evidence from the early implementation showed that:
• The work requirement for the extended hours meant that families tended to be more educated and to have higher income than the broader population of families with children of this age.
• Once aware of the offer, parents were positive about the policy, quick to take up the extended hours and generally sufficiently self-serving to apply and approach providers for a place.
• Parents had few concerns about the process of applying for the extended hours. Some parents were unhappy that they could not access the full 30 free hours because of the limitations introduced by some settings, but their gratitude for the lower childcare bill during early implementation seemed to outweigh their frustration. However, this may change when the offer is more widespread and parents’ expectations increase.
• Some in the LA early implementation teams expressed concerns around the eligibility criteria. Specifically, there were concerns that the delay in being able to take up extended hours until the start of the following term and the risk of the loss of eligibility could reduce the effectiveness of the incentive to support parents to work.
• Take-up among children with SEND was lower than for their peers and barriers to take-up among this group were reported by both parents and providers. However,

145
the evidence from areas that had put in place measures to support the participation of SEND children shows that it is possible to deliver extended places to children with additional needs, including those with very complex needs if the right support is in place.
This suggests the following recommendations for the national rollout:
(I) Active marketing through childcare providers and LA publicity can assist parental take-up, particularly while the policy is still relatively new and the more usual word-of-mouth dissemination is less influential. Assistance with the application process or brokerage to find a place should be a lower priority than marketing.
(J) A review of the eligibility criteria could consider allowing immediate access to the extended hours for parents who enter work and allowing eligibility to continue until the child starts school even if a parent leaves work (replacing the grace period).

146
10. How did the use of childcare change? This chapter explores the evidence from early implementation which can inform on the likelihood that the use of childcare will change in the national rollout. The first section considers how many extended hours children received while the following one examines the combinations of providers used for the extended hours offer. The third section reviews whether the longer hours have been beneficial or harmful for children, while the final section summarises the findings and offers some recommendations for the national rollout.
10.1 Hours of childcare This analysis of the hours of childcare primarily focuses on the use of formal childcare as reported in the census data.41 According to the census data, children received an average 12.0 extended hours in each extended hours place which was combined with an average 13.2 hours from the universal offer (either at the same provider or a different provider) (table 43). On average, each child also used an additional 2.1 hours (assumed to be paid) with one of the free entitlement providers (although this was derived from only 22 percent using any additional hours for an average 10 hours). Overall, children using the extended hours were receiving a total of 27.3 hours of formal childcare. As shown above in section 7.1, children were spreading the extended hours across the holidays in 17 percent of the extended places. In these cases, the number of hours can be adjusted to a term-time only equivalent by multiplying by 51/38, but this adjustment only increased the average number of extended hours in each place from 12.0 to 12.3.
The pattern in weekly hours is fairly uniform across LAs with the exception that hours are lower in LAs C and H. This may reflect that children took fewer hours in these two LAs, possibly related to LA C having a rural focus and LA H having a universal offer. Or it could reflect that children were more likely to be using the extended hours at more than one provider which meant that the hours were unusually understated in these LAs, consistent with the model of strong partnership working in LA H. The other slightly unusual pattern is in LA D where the average number of term-time only adjusted extended hours is notably higher than the raw average (13.9 compared to 12.5), reflecting the higher proportion of extended hours places being spread across the school holidays in this LA.42
41 As explained in section 2.2, due to limitations in the matching of children across providers, this measure may understate total hours for children using multiple providers, but this is unlikely to have a substantive impact on the findings. 42 The relationship between the adjustment in the hours and the proportion of places being spread is not a uniform one because there appeared to be some reporting of the term-time only equivalent in cases when the hours were being spread (including accounts of 15 hours in the census week while also being spread). Consequently, the adjusted term-time equivalent hours were not permitted to exceed 15.

147
Table 43: Weekly childcare hours for children using extended hours by LA
Mean weekly hours A B C D E F G H All
LAs
Universal 15 13.9 14.1 14.0 14.4 13.7 13.3 13.7 11.9 13.2
Extended 13.4 15.0 9.7 12.5 12.8 12.4 13.7 10.7 12.0
Paid 3.4 3.7 1.4 1.6 1.9 2.4 2.4 1.5 2.1
Total
30.8
32.8
25.1
28.6
28.5
28.1
29.8
24.2
27.3
Adjusted extended hours
13.5 15.0 10.0 13.9 13.3 12.5 13.7 11.1 12.3
Number of places
480 404 654 385 420 320 583 1,678 4,924
Sources: Early Years Census, School Census and additional evaluation data collection, January 2017 Notes: Adjusted mean weekly free entitlement hours multiply the weekly free entitlement hours by 51/38 in cases where the child is spreading the hours throughout the year to obtain the term-time only equivalent. The total hours are for free entitlement providers and do not include any paid hours with providers not delivering the free entitlement hours and in informal care. The mean total hours of formal care (with free entitlement and providers not delivering the free entitlement) for children using extended hours is 30 in the evaluation survey of parents.
Table 44: Weekly childcare hours for children using extended hours by provider type
Mean weekly hours Private Voluntary Childminder Maintained All types
Universal 15 13.6 12.1 11.0 14.0 13.2
Extended 12.6 9.5 11.8 12.3 12.0
Paid 2.9 0.7 1.7 0.7 2.1
Total
29.1
22.4
24.5
27.0
27.3
Adjusted extended hours
13.1 9.7 12.0 12.3 12.3
Number of places 2,785 682 351 982 4,924
Sources: Early Years Census, School Census and additional evaluation data collection, January 2017 Notes: Adjusted extended hours means the extended hours have been multiplied by 51/38 in cases where the child is spreading the hours throughout the year to obtain the term-time only equivalent. The total hours are for free entitlement providers and do not include any paid hours with providers not delivering free entitlement hours and in informal care.
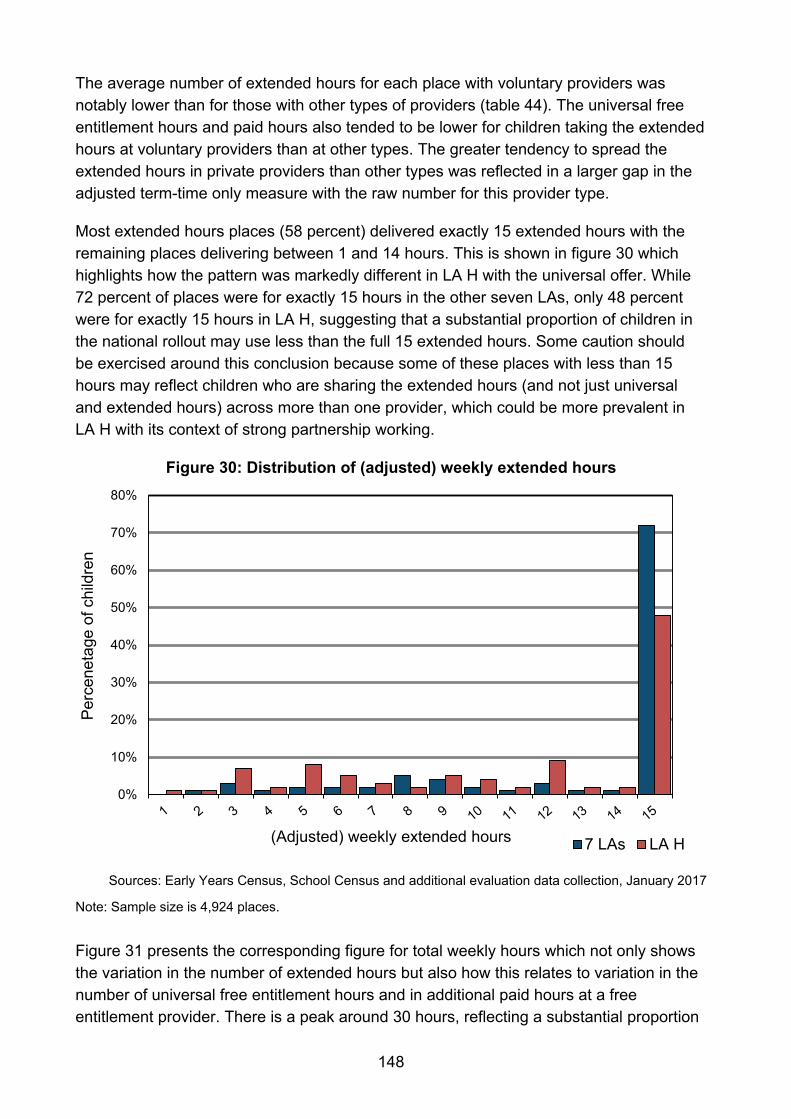
148
The average number of extended hours for each place with voluntary providers was notably lower than for those with other types of providers (table 44). The universal free entitlement hours and paid hours also tended to be lower for children taking the extended hours at voluntary providers than at other types. The greater tendency to spread the extended hours in private providers than other types was reflected in a larger gap in the adjusted term-time only measure with the raw number for this provider type.
Most extended hours places (58 percent) delivered exactly 15 extended hours with the remaining places delivering between 1 and 14 hours. This is shown in figure 30 which highlights how the pattern was markedly different in LA H with the universal offer. While 72 percent of places were for exactly 15 hours in the other seven LAs, only 48 percent were for exactly 15 hours in LA H, suggesting that a substantial proportion of children in the national rollout may use less than the full 15 extended hours. Some caution should be exercised around this conclusion because some of these places with less than 15 hours may reflect children who are sharing the extended hours (and not just universal and extended hours) across more than one provider, which could be more prevalent in LA H with its context of strong partnership working.
Figure 30: Distribution of (adjusted) weekly extended hours
Sources: Early Years Census, School Census and additional evaluation data collection, January 2017
Note: Sample size is 4,924 places.
Figure 31 presents the corresponding figure for total weekly hours which not only shows the variation in the number of extended hours but also how this relates to variation in the number of universal free entitlement hours and in additional paid hours at a free entitlement provider. There is a peak around 30 hours, reflecting a substantial proportion
0%
10%
20%
30%
40%
50%
60%
70%
80%
Perc
enet
age
of c
hild
ren
(Adjusted) weekly extended hours 7 LAs LA H

149
of children using exactly 30 free entitlement hours, but there are notable proportions of children with less than 30 hours (particularly in LA H) or using paid hours to receive more than 30 hours each week. It could be because so many mothers of these children are working part time43 that only a small proportion are receiving more than 30 hours each week at these providers (although, as will be shown below using the evaluation survey of parents, a large proportion also spend time in informal childcare and some use formal childcare at providers from whom they are not receiving any free entitlement hours).
Figure 31: Distribution of weekly total hours at free entitlement providers for children using extended hours
Sources: Early Years Census, School Census and additional evaluation data collection, January 2017
Note: Sample size is 4,534 places.
To illustrate this last point, figure 32 presents the distributions of total hours of formal childcare at all providers for children using the extended hours using data from the evaluation survey of parents. The mean number of hours for all formal childcare is 30.3 in the parents’ survey (compared to 27.3 hours for formal childcare with a maximum of two providers in the census data) and the distribution of hours is generally higher with a lower peak at around 30 hours. This difference reflects both the use of formal care with providers not delivering the free entitlement and the potential undercounting of hours with
43 As shown in section 9.1, 59 percent of mothers of children using the extended hours in the evaluation survey of parents were working part time.
0%
10%
20%
30%
40%
50%
60%
Perc
enet
age
of c
hild
ren
Weekly total hours (rounded to nearest 5) 7 LAs LA H

150
free entitlement providers in the census data, but suggests that neither has a large impact on the overall pattern.
Figure 32: Distribution of weekly total hours for children using extended hours
Source: Evaluation Survey of Parents, 2017
Note: Sample size is 1,504 for 7 LAs and 741 for LA H.
The potential impact of the extended hours on the use of formal childcare was considered in two ways using the evaluation survey of parents:
a) Parents were asked whether they used any formal childcare for the child before they started to use the extended hours and, if they did, whether they used more, the same or fewer hours (referred to as “change in formal childcare use”).
b) Parents were asked a hypothetical question of whether, if they were not receiving the extended free hours, they thought they would be using the same hours, more hours, fewer hours or not using any formal childcare for the child (referred to as “perception of impact on formal childcare use”).
Both measures may capture the impact of the extended hours to some extent, but they also have considerable drawbacks. The first measure of change may capture changes over time that would occur even without the policy, particularly if a child would have become eligible for the universal offer or if the mother had decided to return to work or increase working hours over the same period. The second measure of the hypothetical
0%
10%
20%
30%
40%
50%
60%
Perc
enet
age
of c
hild
ren
Weekly total hours (rounded to nearest 5) 7 LAs LA H

151
scenario may lead parents to overstate the importance of the policy to their current choice or they may simply consider what they did when they did not have the extended hours (defaulting to the same response as for the change question). Nevertheless, the responses provide some guide to the potential, possibly maximum, size of the impact.
Table 45: Change in formal childcare use since started using extended hours
A B C D E F G H All LAs
Started to use formal childcare
8% 14% 7% 8% 5% 4% 13% 6% 8%
Use more hours 46% 42% 62% 66% 46% 44% 51% 44% 49%
No change 44% 35% 29% 27% 48% 50% 32% 47% 40%
Use fewer hours 3% 9% 2% 1% 2% 3% 4% 3% 3%
Total
100%
100%
100%
100%
100%
100%
100%
100%
100%
Number of children 263 170 351 146 256 68 247 742 2,243
Source: Evaluation Survey of Parents, 2017
Table 46: Perception of impact of extended hours on formal childcare use
A B C D E F G H All LAs
Reason to use formal childcare
5% 8% 6% 4% 3% 3% 8% 4% 5%
Use more hours 40% 36% 54% 60% 41% 47% 50% 41% 45%
No change 52% 51% 39% 34% 56% 50% 41% 54% 48%
Use fewer hours 3% 4% 1% 1% 0% 0% 2% 1% 2%
Total
100%
100%
100%
100%
100%
100%
100%
100%
100%
Number of children 261 162 345 144 254 64 238 728 2,196
Source: Evaluation Survey of Parents, 2017
Tables 45 and 46 present the responses to both questions, with the options in a similar order and format to facilitate comparisons. Responding to the change in use question, 8 percent of parents reported that they had started to use formal childcare for the child and 49 percent reported that they were using more hours of formal childcare since they had started to use the extended hours. The hypothetical question generated similar magnitudes of responses: 5 percent reported that the extended hours were the reason

152
they were using any formal childcare for the child and 45 percent reported that they used more hours because of the extended hours.44 These patterns were broadly similar across the LAs.
Differences in the actual change in childcare use and the perceived impact on childcare use were examined across different types of families. There were clear distinctions across the level of household income: those with lower (although not low in absolute terms) and middle income levels were more likely to have started to use formal childcare or to have increased their childcare hours and were also more likely to perceive that the extended hours had a positive impact on their childcare use, as shown in figure 33.
Figure 33: Impacts on childcare use across income levels
Source: Evaluation Survey of Parents. 2017
Notes: Lower, middle and higher income are defined as annual gross household income below £32,000, £32,000 or more and below £52,000, and £52,000 or more respectively. Sample sizes are 730, 734 and 639 for the three income groups in panel (a) and 708, 718 and 685 for the three income groups in panel (b).
44 For 72 percent of parents, the response to the hypothetical question was the same as that for the actual change. The largest differences were a hypothetical response of no change and actual change of more hours (11 percent); a hypothetical response of more hours and an actual change of no change (6 percent); and a hypothetical response of more hours and an actual change of starting to use formal childcare (3 percent). Although the high degree of consistency does not provide direct evidence that either measure is recording impact, it is consistent with both measures capturing an indication of impact.
0%
10%
20%
30%
40%
50%
60%
70%
80%
90%
100%
Lowerincome
Middleincome
Higherincome
(a) Change in childcare use
Started to use More hoursNo change Fewer hours
0%
10%
20%
30%
40%
50%
60%
70%
80%
90%
100%
Lowerincome
Middleincome
Higherincome
(b) Perceived impact on chldcare use
Reason to use More hoursNo impact Fewer hours

153
There was a marked difference in the change in childcare for parents with a child with a health condition: 69 percent used more hours of formal childcare compared to 48 percent of parents of children without a health condition. Similarly, 10 percent of parents with a child with a health condition reported that the extended hours were the reason they were using formal childcare and 56 percent reported that they were using longer hours of childcare because of the extended hours compared to 5 percent and 45 percent for other parents. This suggests that, when taken up, the extended hours may have a larger impact on childcare use for parents with a child with a health problem than other parents.
10.2 Mix of providers and shared care One key question around use of the extended hours is the extent to which parents will need to combine hours from different providers to make full use of the free entitlement hours.
The evaluation survey of parents highlighted several aspects of the mix of providers used by children taking up the extended hours (full findings disaggregated by LA are presented in tables 83 to 85 in Annex B):
• Most parents (80 percent) used only a single provider for the free entitlement hours, covering both the universal offer and the extended hours. This was typically either a day nursery (33 percent) or a school (30 percent), with the use of just a playgroup rarer (15 percent) and just a childminder very unusual (2 percent).
• Around one in five children used two providers for the free entitlement hours, with 12 percent using a combination of centre type settings (that is, not childminders) and 7 percent using a childminder in combination with a centre type setting (most usually a playgroup or school). The use of three or more providers was rare.
• While 55 percent of free entitlement places were not used with additional paid or any informal care, 42 percent were combined with use of informal care and 5 percent with paid care from providers not delivering free entitlement hours.
• The pattern in the use of informal care was very similar across provider types, except when some free entitlement hours were used with childminders: informal care was then used more rarely (by 26 percent of parents).
• Lower income families were less likely to be using multiple providers (13 percent for those in the lower income group compared to 22 percent and 27 percent for those in the middle and higher income groups). Higher income families were more likely to be paying for additional hours at a free entitlement provider (66 percent in the higher income group compared to 44 percent and 37 percent for those in the middle and lower income groups).

154
Table 47 extends this analysis to consider the mix of formal providers including those where the child does not receive any free entitlement hours and to whether care is shared across days or within days. Adding in care with providers delivering only paid hours raises the proportion of children using multiple providers to 25 percent, with 11 percent using the different providers on different days and 14 percent using different providers within the same days. There is considerable variation in the proportions using multiple providers across LAs, with LAs A, C and H having the highest proportions and LAs D and G particularly low proportions.
Table 47: Use of multiple free entitlement providers and providers not delivering the free entitlement
A B C D E F G H All LAs
Single provider 70% 87% 59% 95% 84% 75% 92% 68% 75%
Different providers across days
3% 2% 14% 3% 8% 10% 4% 18% 11%
Different providers within days
27% 11% 26% 2% 7% 14% 4% 14% 14%
Total
100%
100%
100%
100%
100%
100%
100%
100%
100%
Number of children 264 168 353 147 257 69 246 741 2,245
Source: Evaluation Survey of Parents, 2017 Note: Different providers within days means that the child uses at least two different providers on at least one day while different providers across days means that the child never uses more than one provider on any given day.
Most parents (85 percent) who were using formal childcare prior to taking up the extended hours did not change their provider in order to use the extended hours, while 9 percent simply changed provider and 6 percent began to use more providers in order to use the extended hours (table 48). In LA B, the proportion making changes was unusually high, possibly because only a small number of providers were selected to offer the extended hours and parents moved providers to take up the hours.

155
Table 48: Change in provider
A B C D E F G H All LAs
No change in provider
80% 68% 85% 91% 94% 89% 83% 87% 85%
Changed provider but same number
12% 23% 9% 5% 5% 6% 14% 6% 9%
Use more providers
8% 10% 6% 4% 1% 5% 3% 7% 6%
Total
100%
100%
100%
100%
100%
100%
100%
100%
100%
Number of children previously using formal care
245 146 328 137 244 66 216 703 2,085
Source: Evaluation Survey of Parents, 2017
Exactly one third of parents using the extended hours reported that they thought it was fine for a child to have more than one provider, while the remaining two thirds thought it was better for a child to have only one formal provider (table 49). These proportions varied across the LAs, although not in any systematic way.
Table 49: Opinion on using multiple providers
A B C D E F G H All LAs
It's fine for a child to have more than one formal childcare provider
33% 15% 46% 22% 25% 35% 13% 44% 33%
Better for a child to have only one formal childcare provider
67% 85% 54% 78% 75% 65% 87% 56% 67%
Total
100%
100%
100%
100%
100%
100%
100%
100%
100%
Number of children 245 163 325 139 248 65 234 702 2,121
Source: Evaluation Survey of Parents, 2017

156
Opinion on the use of multiple providers did vary by whether the parent was currently using multiple providers: the proportion who thought it was fine was 20 percent among those using only one formal provider and 73 percent among those using multiple providers. Whether this discrepancy arose because those who felt more comfortable about using multiple providers were more likely to do so or whether experience of using multiple providers made parents feel more comfortable about the arrangements could not be discerned from the survey. However, interviews with parents in the case studies showed that those who were using multiple providers not only had no negative impact on their children but also believed there could be benefits from these arrangements. For example, a combination of a pre-school and a childminder provided a good balance, with the former offering plenty of stimulation and learning activities and the latter an opportunity for a quiet time, more akin to a home environment. For others, the use of two providers was largely driven by the belief that their child needed to go to pre-school to get ready for school, but as their pre-school did not offer all the provision required, they needed to use an additional provider. While this was not seen as ideal, it was not believed to have any adverse effects on the child.
Extended hours added to the complexity of arrangements in some cases. This was related to the increase in use of multiple providers and tended to happen when parents started using more hours because they were free or cheap but could not use them all at the same setting (for example, because the setting was not open for 30 hours or did not have enough space to accommodate additional hours or was not open for a long day). But typically they would have faced the same issues if they had used more paid hours.
10.3 Impacts of longer hours on children Both concerns and hopes have been raised around the effects that more hours in formal childcare may have on children: while some fears have been expressed that longer days may have adverse impacts, others have contended that longer hours could benefit child development, particularly for children from lower income families (see the logic model in section 3.1).
The vast majority of parents using the extended hours reported that they thought that the extended hours improved school readiness (87 percent) and that the amount of time that their child spent in formal care was about the appropriate amount (89 percent) (tables 50 and 51). However, it should be borne in mind that these views were among parents who had chosen for their child to spend longer hours in formal childcare.
Lower income families were more likely to report that they thought the extended hours made their child better prepared for school (95 percent in the lower income group compared to 88 percent and 76 percent in the middle and higher income groups respectively). The lower income group was also less likely to report that the time in care was too much for their child (4 percent in the lower income group compared to 7 percent and 11 percent in the middle and higher income groups). The variation in these

157
proportions across LAs reflected these differences across income groups, with parents in the more affluent LAs (A, F and H) being less likely to report that they thought the extended hours improved school readiness and more likely to say the time in formal care was too much for their child.
Table 50: Perception of impact of extended hours on school readiness
A B C D E F G H All LAs
Extended hours improve school readiness
88% 93% 91% 95% 87% 84% 93% 79% 87%
Extended hours do not make any difference
12% 7% 9% 5% 13% 16% 7% 21% 13%
Total
100%
100%
100%
100%
100%
100%
100%
100%
100%
Number of children 260 166 345 145 254 67 245 727 2,209
Source: Evaluation Survey of Parents, 2017
Table 51: Appropriatenss of amount of time in care
A B C D E F G H All LAs
Too much time for the child
11% 8% 7% 7% 5% 14% 4% 7% 7%
Too little time for the child
4% 8% <1% 3% 3% 8% 5% 4% 4%
About the right amount of time for the child
85% 83% 93% 90% 92% 79% 91% 90% 89%
Total
100%
100%
100%
100%
100%
100%
100%
100%
100%
Number of children 260 165 348 146 255 66 242 737 2,219
Source: Evaluation Survey of Parents, 2017
The case studies explored in greater depth the acceptability of children spending longer hours in a setting and also found that typically both parents and providers were positive about the longer hours. Again, it must be born in mind that these were settings that were

158
offering extended hours and parents who were using them and were therefore unlikely to believe these were damaging children in any way.
Settings stressed that good quality provision has proven benefits for children and therefore giving children the opportunity to spend more than the current universal hours must be a positive, particularly as children get ready to start school. These views were echoed by parents who felt that if a child was happy and settled, the opportunity to spend extended hours in a setting would be positive for their development and a good preparation for school.
Specific benefits of the extended hours identified by parents who had increased their hours included:
• Continuity of care: When the extended hours enabled a child to access a setting every day rather than being used for two and a half days under the universal entitlement to fit with working hours.
• More development opportunities: From being in a learning environment for longer. For example, a mother said her son had struggled with his speech, but since he had been spending more time at the playgroup:
“… you can tell daily that he’s becoming clearer and saying more things. I think with him playing more with other kids of his own age has helped.”
• More opportunities to socialise: In rural areas where families can be isolated and opportunities to meet children are limited, being able to spend more time in a nursery was considered important to meet friends and socialise more, which in turn could increase a child’s confidence.
• Child’s mood: Some parents felt that being in a setting for a longer day meant that when the child got home she / he was calmer and less “hyper”, although others thought their child was now more tired and irritable when she / he came home, as the nursery was full on and the child did not get a chance to have a nap.
• More support with specific needs: Parents with children with additional needs thought it was very beneficial for their child to spend more time in a setting when they received more of the specialised input they needed:
“When he started the nursery he didn’t say a word, he didn’t make eye contact and didn’t recognise his name. Now he uses single words, makes eye contact quite often … responds to his name and has learnt to play with other children.”
“I’m absolutely delighted with the progress he has made. He would be stuck with me in the house [otherwise] and we don’t have any friends and family near here … so it’s brilliant.”

159
Providers’ views echoed those of parents:
• They highlighted the benefits of having longer to work and develop routines with children:
“It helps you to really sustain concentration for longer time with the child, gives you more opportunities for longer sessions, longer input, longer exploration.”
• In relation to children with additional needs the manager of a specialist setting explained:
“It is a benefit because those children [with complex needs] often require things like physiotherapy programmes and we do a lot of specialist interventions here, so if they're here for a whole school day that's really good because we can make sure everything's incorporated in the day as well as that time out with their playmates in the nursery. Sometimes it's easy to just whip them from one group to the next, and they’re not included in other activities with their peers because there's no time in the three-hour session to do that. So having them here for the full day has meant it's much more inclusive.”
However, there were also reports of providers being concerned that the long day may be affecting the behaviour of a handful of children. It was observed that at the end of a long day, and towards the end of the week, there was more low-level disruption, among mostly boys, as they started to get a bit boisterous or a bit frustrated and argumentative because they were tired.
Finally, there was no evidence that cost-cutting to improve efficiency had led to a detrimental impact on quality of care. However, there was evidence from the case studies that the additional funding enabled parents to choose or move their child to a more expensive setting.
10.4 Summary and recommendations In summary, the evidence from the early implementation showed that:
• Most parents used the full additional 15 hours for their child, but a substantial proportion (42 percent) used fewer hours.
• The indications are that the hours of formal childcare were higher than they would otherwise have been in the absence of the extended hours for a substantial proportion of children, although caution is needed in interpreting this as evidence of impact because only proxy measures of impact could be considered.

160
• A quarter of children using the extended hours used more than one provider in a typical term-time week and many parents (42 percent) combined the use of extended hours with informal childcare.
• Longer hours were generally seen as having positive impacts for the child by providers involved in their delivery and by parents using them.
This evidence suggests the following recommendation for the national rollout:
(K) To help support the use of multiple providers, national or local training and workshops for providers could promote good shared care practice for children using multiple providers. Consideration could also be given to the provision of information and example cases for parents on how to manage a good package of care when using multiple providers.

161
11. Did parental work change? This chapter explores the evidence from early implementation which can inform on the likelihood that parental employment will change in the national rollout. The first section presents evidence on the impacts of the extended hours on parental work patterns during early implementation, while the second section considers the effectiveness of the specific approaches to support parents to enter work. The final section summarises the findings.
11.1 Change in parental work during early implementation As with the use of childcare, the potential impact of the extended hours on parental employment was considered in two ways using the evaluation survey of parents:
a) Parents were asked whether they were working before they started to use the extended hours and, if they were, whether they now worked for more, the same or fewer hours (referred to as “change in work”).
b) Parents were asked a hypothetical question of whether, if they were not receiving the extended free hours, they thought they would be working the same hours, more hours, fewer hours or not working at all (referred to as “perception of impact on work”).
Again, both measures may capture the impact of the extended hours to some extent, but they have some drawbacks. The first measure of change may capture changes over time that would occur even without the policy, particularly if the mother would have decided to return to work or increase working hours over the same period even without the extended hours. The second measure of the hypothetical scenario may lead parents to over-rate the importance of the policy to their current choice or they may simply consider what they did when they did not have the extended hours (defaulting to the same response as for the change question).
Compared to the time prior to taking up the extended hours, very few mothers (2 percent) reported that they had entered work, but almost a quarter reported that they had increased their work hours (table 52). On the other hand, 5 percent had reduced their work hours, possibly because they had less need of income to pay for childcare.45 These changes were similar across the LAs, with only slightly lower proportions entering work or increasing work hours in LA F (possibly explained by the higher level of affluence in the LA and the employer-based approach to the rationing of extended hours during early
45 There was little difference in the changes in work hours for single mothers and mothers in couples: 2 percent, 24 percent and 7 percent of single mothers had entered work, increased their hours and decreased their hours respectively, while 1 percent, 23 percent and 5 percent of mothers in couples had entered work, increased their hours and decreased their hours respectively.

162
implementation) and slightly higher proportions entering work and increasing work hours in LA D (possibly explained by the targeting of the policy to lower income families).
Table 52: Change in mothers’ work hours
A B C D E F G H All LAs
Entered work 2% 2% 2% 3% <1% 0% 2% 1% 2%
More hours 29% 24% 26% 31% 19% 12% 23% 19% 23%
No change 63% 66% 67% 63% 77% 81% 69% 74% 70%
Fewer hours 6% 7% 4% 3% 3% 7% 6% 6% 5%
Total
100%
100%
100%
100%
100%
100%
100%
100%
100%
Number of mothers in work
256 164 344 144 253 68 236 722 2,187
Source: Evaluation Survey of Parents, 2017
Note: Table includes mothers’ own reports as the survey respondent and proxy reports from partners when the mother was not the survey respondent.
Table 53: Perception of impact of extended hours on mothers’ work
Perceived impact A B C D E F G H All LAs
Reason in work 16% 23% 8% 18% 11% 4% 12% 8% 11%
More hours 26% 21% 31% 28% 21% 21% 28% 21% 24%
No impact 55% 52% 57% 52% 65% 75% 55% 69% 61%
Fewer hours 3% 3% 4% 2% 3% 0% 5% 3% 3%
Total
100%
100%
100%
100%
100%
100%
100%
100%
100%
Number of mothers in work
193 117 289 123 185 48 194 578 1,727
Source: Evaluation Survey of Parents, 2017
Notes: Table includes only mothers’ own reports as the survey respondent. Statistics for subgroups with less than 50 observations have been indicated in italics.

163
On the other hand, some 11 percent of mothers reported that they thought they would not be working in the absence of the extended hours and 24 percent reported they would be working fewer hours (table 53).46 The difference between 2 percent having entered work and 11 percent reporting that they would not otherwise be working suggests that the extended hours may have helped mothers to remain in work, particularly as there is considerable churning in mothers’ work participation when children are this age.47 The proportions reporting that they would not otherwise be working are highest in LAs B and D, which may, as shown above, reflect the higher proportions of lower income families using the extended hours in these LAs.
Table 54: Change in fathers’ work hours
A B C D E F G H All LAs
Entered work 2% 0% 0% 0% 0% 0% 0% <1% <1%
More hours 8% 18% 9% 19% 12% 8% 4% 8% 9%
No change 90% 77% 90% 79% 88% 92% 95% 91% 89%
Fewer hours 1% 5% 2% 2% <1% 0% 1% 1% 1%
Total
100%
100%
100%
100%
100%
100%
100%
100%
100%
Number of fathers 224 113 325 89 227 62 214 662 1,916
Source: Evaluation Survey of Parents, 2017
Note: Table includes fathers’ own reports as the survey respondent and proxy reports from partners when the father was not the survey respondent.
Compared to the time prior to taking up the extended hours, the proportions changing work participation or hours were much smaller for fathers than mothers: less than 1 percent reported that they had entered work and only 9 percent reported that they had increased their work hours (table 54). The hypothetical question on the perception of impact of the extended hours was only asked of respondents about their own work behaviour and the number of male respondents answering this question was only 342.48 However, 5 percent reported that they thought that the extended hours meant that they
46 For 72 percent of mothers, the response to the hypothetical question was the same as for the response to the question about the change. The largest differences were a hypothetical response of an increase in hours when there had been no change (9 percent) and a hypothetical response of being in work rather than not working when there had been an increase in hours (5 percent) or no change in hours (5 percent). 47 For example, see Paull, G., (2006), “The Impact of Children on Women’s Paid Work”, Fiscal Studies, vol. 27, no. 4, December, 473–512. 48 While it was reasonable to ask respondents the factual question about the change in their partner’s work behaviour, robust answers would not have been solicited by a respondent answering a hypothetical question about their partner’s behaviour in an alternative scenario.

164
were working rather than not working, 16 percent that they were working more hours, 70 percent that they were working the same hours and 9 percent that they were working fewer hours.49 Although the sample is small, this suggests that the extended hours meant that fathers, like mothers, were less likely to stop working or reduce their work hours because of the extended hours and may, possibly, increase work. However, the 9 percent answering that they worked fewer hours because of the extended hours suggest that they may have otherwise worked longer hours (possibly, again, because they had less need of additional earnings to pay for childcare). The largest proportions reporting an increase in work hours are in LAs B and D, reflecting the higher proportion of lower income families using extended hours in these LAs.
Table 55 shows the number of hours that parents moved into or up to if they entered work or increased their working hours since taking up the extended hours. Most mothers who entered work did so into work of 20 hours or less, while most fathers entered full-time work of over 30 hours. Similarly, most mothers increasing their hours moved up to 30 hours or less, while most fathers increasing their hours moved up to working 31 hours or more.
Table 55: Increase in weekly hours for mothers and fathers
Current work hours
Mothers Fathers
Entered work Increased hours Entered work Increased
hours
1–15 hours 18% 3% 0% 1%
16–20 hours 38% 21% 33% 6%
21–30 hours 24% 48% 17% 15%
31–40 hours 18% 22% 33% 38%
More than 40 hours 3% 6% 17% 40%
Total 100% 100% 100% 100%
Number of mothers or fathers in work
34 494 6 174
Source: Evaluation Survey of Parents, 2017
Notes: Table includes parents’ own reports as the survey respondent and proxy reports from partners when the parent was not the survey respondent. Statistics for subgroups with less than 50 observations have been indicated in italics.
49 Similar to that for mothers, 77 percent of fathers gave the same response to the hypothetical question as for the change, but the largest differences were a hypothetical response of an increase or decrease in hours when there had been no change (7 percent and 8 percent respectively).
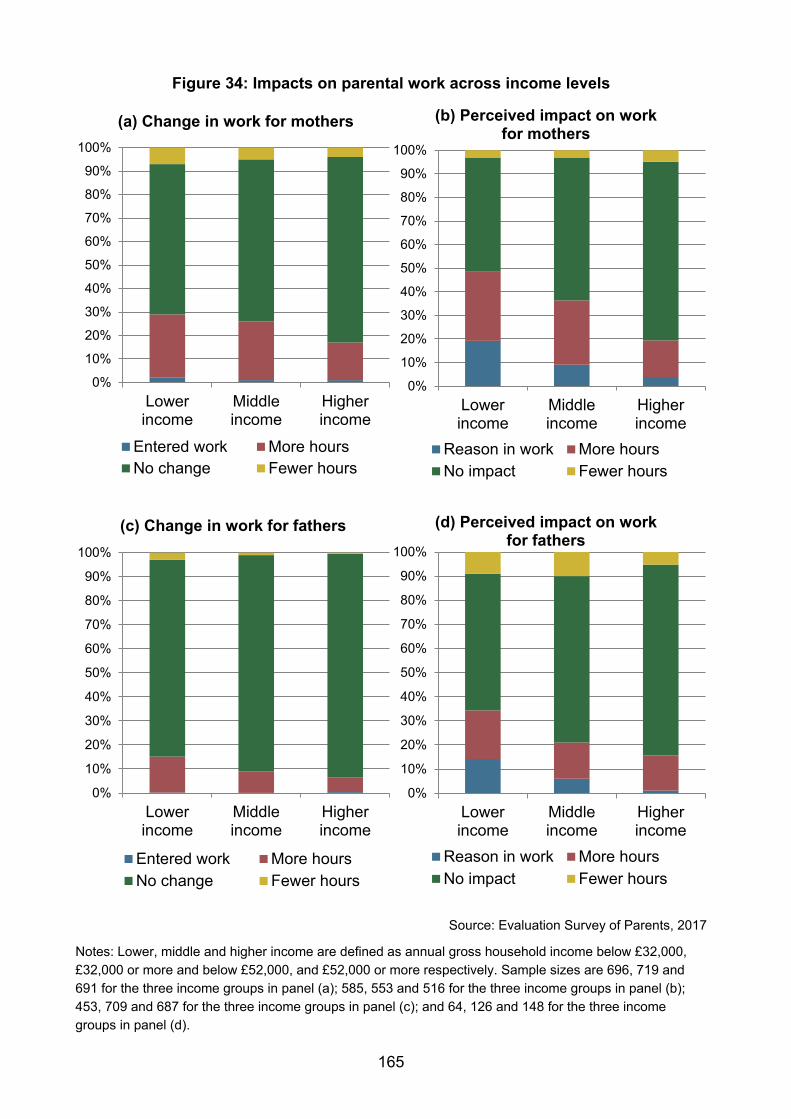
165
Figure 34: Impacts on parental work across income levels
Source: Evaluation Survey of Parents, 2017
Notes: Lower, middle and higher income are defined as annual gross household income below £32,000, £32,000 or more and below £52,000, and £52,000 or more respectively. Sample sizes are 696, 719 and 691 for the three income groups in panel (a); 585, 553 and 516 for the three income groups in panel (b); 453, 709 and 687 for the three income groups in panel (c); and 64, 126 and 148 for the three income groups in panel (d).
0%
10%
20%
30%
40%
50%
60%
70%
80%
90%
100%
Lowerincome
Middleincome
Higherincome
(a) Change in work for mothers
Entered work More hoursNo change Fewer hours
0%
10%
20%
30%
40%
50%
60%
70%
80%
90%
100%
Lowerincome
Middleincome
Higherincome
(b) Perceived impact on work for mothers
Reason in work More hoursNo impact Fewer hours
0%
10%
20%
30%
40%
50%
60%
70%
80%
90%
100%
Lowerincome
Middleincome
Higherincome
(c) Change in work for fathers
Entered work More hoursNo change Fewer hours
0%
10%
20%
30%
40%
50%
60%
70%
80%
90%
100%
Lowerincome
Middleincome
Higherincome
(d) Perceived impact on work for fathers
Reason in work More hoursNo impact Fewer hours

166
Both the changes in work hours and the responses to the hypothetical question of work hours in the absence of the extended hours varied across household income levels (figure 34). In both cases, the potential impacts on work behaviour are greater for households at lower levels of income. For example, the proportion of mothers reporting that they would not be working in the absence of the extended hours is 19 percent for the lower income group, 9 percent for the middle income group and 3 percent for the higher income group.
In-depth interviews with parents in the case studies illustrated how the extended hours offer had affected their work decisions and attitudes towards work:
• Parents appreciated the way the offer was “rewarding you for going to work”. Previously parents on lower incomes had questioned the value of going to work as the cost of childcare resulted in negligible financial benefits. A parent reflected that she no longer had to begrudge going out to work and using the money she earnt to pay someone else to look after her children; another said:
“Now I go to work and have some money left rather than go to work and not have … that much left.”
• The offer had persuaded some parents to go to work, as this mother explained when asked if she would have gone back to work without the extended hours:
“Not a chance! Otherwise I would be working for free, if I had to pay for childcare. And I like my job but not that much.”
• Other parents increased their working hours or were doing some overtime which they would not have done without the extended hours because it would not have been worth paying for additional childcare.
In just over half of the early innovator LAs, the LA leads reported that they thought the key driver for parents to use the extended hours was the direct financial benefit rather than because it allowed any change in work choices. However, the balance between the two motivations was broadly seen as more even in four LAs, and the work incentive was seen as the dominating factor in six LAs.
11.2 Direct measures to support parents to work The approaches of four LAs (A D F and G) included measures to directly support parents in work.
In LA A, return-to-work training to parents of three and four year olds was delivered in the four geographical areas where the extended hours were available. The initial plan was to target parents who had previously received the two year olds entitlement with a combination of training and extended free entitlement hours which would support them to

167
enter work. However, progress had been very slow and the experience showed the need to allow more time (at least six to nine months) to support parents on their journey back to work than the early implementation programme was allowing:
“We realised actually we've got to support the parents on a journey. This isn't a matter of one minute they're not in a job, the next minute they've got a job; I think there are a lot of steps in between. You've got to raise their confidence, you've got to make them realise that getting to work is a possibility because there are not many parents who need a quick fix and then suddenly they will get into employment.”
In LA D the work element of the programme consisted primarily of targeting the offer to low income families. This approach was supported by a Work Incentives Group (including Jobcentre Plus, national careers service and a charity that works with families) to establish links and look at ways of getting families that are not in work to be “work ready”. This LA also provided an innovation grant (of around £300) to providers to cover the cost of releasing staff to enable them to explore innovative ways of working that would encourage parents back to work.
The work element of LA F’s approach focused on supporting parents who work atypical hours and allowing employers to use the offer to attract new staff and retain current staff. The LA wanted to assess demand for childcare at atypical times and providers’ willingness to deliver a service at these times. However, very little progress was made in relation to provision at atypical times. Two reasons for this were mentioned by the LA. First, the lack of additional funding to support the higher costs of weekend provision. Second, the ten hours a day limit for free entitlement meant that the LA could not test the use of emergency overnight provision as planned. At the time of the visit, information was not (yet) available on if and how the offer had affected staff retention and recruitment among employers involved in the programme.
LA G reserved 25 places for parents of three and four year olds taking part in a local employment trial and worked with employment agencies to identify eligible parents.
Direct measures to assist parents to return to work are all in the initial stages in the early innovators programme and it is too early to judge the effectiveness.
11.3 Summary In summary, the evidence from the early implementation showed that:
• Compared to the time prior to taking up the extended hours, 1 percent of mothers reported that they had entered work and 23 percent had increased their work hours.

168
• Considering the hypothetical scenario of their work choices in the absence of the extended hours, 11 percent of mothers reported that they thought they would not be working while 24 percent thought they would be working shorter hours.
• Compared to the time prior to taking up the extended hours, less than 1 percent of fathers reported that they had entered work and 9 percent had increased their work hours.
• These effects were notably stronger for families with relatively lower incomes.
However, caution is needed in interpreting this as evidence of impact of the extended hours because this evidence is based on proxy measures of impact.

169
12. What other effects were there on families? This chapter explores the evidence from early implementation which can inform on the likelihood that there will be other effects on families in the national rollout. The first section presents evidence of additional impacts related to work, while the second section examines the impacts on family finances. The final section summarises the findings.
12.1 Additional impacts related to work Most parents (78 percent) reported in the evaluation survey that the extended hours had improved flexibility in their work decisions (table 56). This proportion was quite consistent across the LAs. A higher proportion of parents in the lower income group reported that work flexibility had been improved than in the middle and higher income groups (85 percent compared to 81 percent and 67 percent respectively).
Table 56: Whether extended hours improved flexibility in work decisions
A B C D E F G H All LAs
Proportion with improved flexibility
78% 83% 83% 84% 80% 77% 84% 71% 78%
Proportion with no change
22% 17% 17% 16% 20% 23% 16% 29% 22%
Total
100%
100%
100%
100%
100%
100%
100%
100%
100%
Number of children 257 167 349 145 255 69 243 729 2,214
Source: Evaluation Survey of Parents, 2017
In-depth interviews with parents in the case studies illustrated how the offer had affected life more broadly around work:
• Some parents reported it gave them more opportunities to find more secure employment, as they were able to work longer hours and because they could be more flexible in terms of when they were available to work.
• Some felt their career prospects had benefited, for example, as they were able to be more flexible in accommodating their employer’s needs or because they had been able to do some training / studying.
• Improved their work / life balance by being able to manage their working hours or running their business during the day, rather than having to work during the evening and weekends to save on childcare costs.

170
• Shift-workers who had previously gone with little sleep after some night shifts to minimise childcare costs, were now able to get more sleep.
• More family time as parents were able to change their shift patterns and were at home in time to see their children every day.
• Less reliance on informal childcare arrangements with families. This had reduced stress and worry for parents and the burden on working or elderly grandparents. For example, the extended hours had enabled a grandparent to return to work as she / he no longer needed to care for her / his grandchild.
12.2 Impacts on family finances Most families reported that the extended hours meant they were better off financially: 58 percent reported that they had slightly more money to spend, while 26 percent reported that they had much more money to spend (table 57). There was some variation in this pattern across the LAs, but without a particular explanation.
Table 57: Impact of extended hours on family finances
A B C D E F G H All LAs
No difference 13% 18% 19% 19% 9% 16% 24% 15% 16%
Slightly more money to spend
62% 56% 58% 64% 62% 53% 52% 56% 58%
Much more money to spend
25% 25% 23% 17% 30% 31% 24% 29% 26%
Total
100%
100%
100%
100%
100%
100%
100%
100%
100%
Number of children 264 158 348 145 257 68 243 739 2,222
Source: Evaluation Survey of Parents, 2017
The proportions reporting a financial benefit were slightly higher among families in the higher and middle income groups than in the lowest income group (figure 35). Other evidence suggests that this may be because higher income families tend to spend more on childcare and therefore save more from using additional free entitlement hours.

171
Figure 35: Financial impacts across income levels
Source: Evaluation Survey of Parents, 2017
Notes: Lower, middle and higher income are defined as annual gross household income below £32,000, £32,000 or more and below £52,000, and £52,000 or more respectively. Sample sizes are 712, 733 and 691 for the three income groups.
In the in-depth interviews with parents, the extended hours were reported to have made a difference to family finances when parents had previously paid for those hours. In these cases, parents reported that it had resulted in considerable financial savings and reduced the stress, worry and burden on families struggling to make ends meet. As a result, they had more money to spend on their children, to go on more family activities and trips at the weekend, to reduce their debts, to contribute to a deposit for a new home, or to go on holiday. As a father explained:
“… we have started putting money back into the bank account rather than just draining it. Before … we were pretty much in our overdraft almost every month, whereas now there is actually a few pounds left over … It makes such a difference to stress levels.”
12.3 Summary The evidence from the early implementation suggests that families benefited from the extended hours in a number of ways:
• Increased work flexibility helped parents to obtain more secure employment, enhanced career opportunities and improved work-life balance.
• Less reliance on informal care reduced stress and the burden on grandparents.
0%
10%
20%
30%
40%
50%
60%
70%
80%
90%
100%
Lower income Middle income Higher income
Per
cena
tge
of fa
mili
es
Much more money tospend
Slightly more money tospend
No financial impact

172
• A positive impact on family finances, with slightly greater benefits for higher income families, possibly because these families tend to spend more on childcare than lower income families.

173
13. What challenged and what supported implementation? This penultimate chapter considers some of the wider implementation issues. The first section summarises some of the overarching challenges and facilitators in the administration of the extended hours during early implementation, while the second section suggests some broader recommendations on how the policy can be successfully supported and promoted in the national rollout.
13.1 Implementation challenges and facilitators This section summarises some overarching issues arising from early implementation of the 30 hours free childcare. It uses evidence collected from several evaluation strands including from the interviews with early implementer and early innovator LA leads, the case studies and the national event for LA leads to discuss the evaluation findings.
The early implementation LA teams identified challenges in implementing the programme that were related to the design, implementation and promotion of the national programme, including:
• The name of the policy created some difficulties for reasons related to the evidence described above. First, calling the policy “childcare” made some schools question their involvement as they view their role as delivering education rather than childcare. Second, calling it “30 hours” was seen by some providers and parents as raising false expectations as families using the stretched offer receive a little over 20 hours a week. Third, calling it “free”’ was considered misleading again by both some parents and providers because some parents had to effectively pay something to access the extended hours.
• LAs and providers found the timescale for the programme unrealistic, particularly with very late confirmation from DfE to LAs (and consequently from LAs to providers) of the number of places. There were also protracted negotiations between LAs and DfE about funding, with some rates agreed after the programme’s launch. Developing an adequate IT system to monitor the delivery of the offer and make payments in the time available proved challenging and a drain on resources, sometimes resulting in temporary “make-do” systems that will need to be revised for the national rollout.
• LAs reported difficulties in initially engaging some providers because negative national publicity about the 30 hours free childcare had encouraged some to focus on the difficulties rather than to think creatively about how the offer could work for them. Some providers’ views on the financial viability of the offer reflected concerns about the level of funding highlighted in the media, while some expressed a concern about the sector’s ability to respond to an increase in

174
demand which reflected national news stories. However, some providers reported that in spite of their initial scepticism, with advice from the LA, they had identified options for offering the 30 hours that worked for their setting.
• Lack of robust data on the number of eligible families, where they live and where they may take up the provision created problems, as LAs could not give an indication of the likely take-up in providers’ catchment areas.
• The failure to appoint the national business support organisation for the delivery of the extended hours in the initial crucial months of early implementation planning and delivery also proved challenging:
“In the lead up time we were left really working in isolation and it was extremely challenging and frustrating ….” (LA early implementation lead)
• A further drain on resources was the amount of information required by DfE, Childcare Works and the evaluation team, sometimes asking for the same information, particularly at a time when LAs needed to focus on delivering places.
• While the programme was meant to test the delivery of the extended hours to children with additional needs, no funding was made available to cover the additional costs associated with the delivery of these places. This problem was compounded by some school fora's resistance to making inclusion funding available for a “childcare” programme.
Local level challenges were also reported, including:
• Despite efforts to involve all parts of the local childcare sector, it proved difficult to ensure that all had an equal chance to inform the local programme as some voices (for example, schools and private day nurseries) were louder and more organised than others (for example, childminders and voluntary playgroups).
• Preserving the mixed economy of provision to deliver the extended hours was harder in very affluent areas where childcare fees were high and providers were difficult to engage as they were not persuaded that their parents would go elsewhere if they did not offer the extended free entitlement hours.
There were also challenges relating to specific local delivery models for early implementation, for example:
• There were difficulties targeting disadvantaged groups (for example, families that had received the two years old offer and low income families) due to low eligibility among these groups and the considerable time required to combine the extended hours offer with the support to enable these parents to return to work.

175
• Delivering the offer via employers proved very time consuming, as this added a layer of complexity to the implementation plan that was difficult to fit with the tight timetable. The fact that employees who did not live in the LA were excluded made some employers reluctant to take part due to concerns about making a benefit available only to some employees. This exclusion also considerably reduced the number of eligible employees as employers involved were reported to have many employees coming from neighbouring authorities.
• Testing provision of childcare at atypical hours proved very challenging as no additional funding was made available to cover the higher costs of delivering childcare at the weekend and because rules about the maximum number of free entitlement hours to be taken in one day could not be relaxed.
• Where different funding rates for the universal and extended free entitlement hours were used, they created difficulties when the hours were jointly delivered be two providers.
Factors at the local and national level that facilitated programme implementation included:
• Early innovator funding was reported to have been critical to provide the LA staffing resources required to enable early implementation.
• Senior executive buy-in and engagement from across the LA, including early years, health, education and finance. As an early implementation manager explained, a supportive leadership had enabled them to think differently and creatively: the early implementer team was “given a license to be really brave, to take some risks”’ and this helped them to remain positive and motivated.
• The support of a multi-service team to deliver early implementation with input from Family Information Services, communication and business teams and the finance department.
• Help from the IT and data teams was seen as essential for effective planning and the development of digital solutions to deliver and monitor the programme.
• A strong and positive relationship with providers helped LA teams to work through providers’ concerns and reservations. LA teams talked about having open and honest exchanges about the challenges presented by the offer and being there for settings when they needed support “… they [providers] know we would do our upmost to support them”.
• An effective model for supporting providers to work in partnership was reported to have facilitated the early implementation in areas where this model already existed or had been developed in order to deliver the extended hours.

176
• The support provided by DfE officials and the opportunity to meet and share learning with other early implementers were reported to have been helpful.
The evidence from the early innovators LA leads also identified several facilitators:
• Among those interviewed, there was an overall tone of confidence, enthusiasm and determination to make the policy work well. The responses of the LA leads indicated that the preparation for the 30 hours free childcare at the operational level was being handled by teams with a firm knowledge and appreciation of the challenges being faced by the many stakeholders.
• Communication and information exchange within regional clusters was seen as being very effective. This may partly have been because of the regional and cultural links, but this cannot have been the whole rationale because within each region there is significant variation in the character of each LA. As one LA lead reported:
“The cluster meetings give you confidence but also enable you to share ideas and to steal some good ones!”
Examples of shared learning related to a toolkit for sufficiency, SEND training, upskilling of the workforce and support software to calculate costs. However, the regional interactions carried an unusual risk of undue influence of single experiences. For example, one LA reported of limited success working with employers and this led other LAs, especially in the same cluster to largely dismiss work with employers as an option. This suggests that such reactions to what may be an unusual case need to be managed carefully.
• There were mixed views on the support from DfE. Some found the individual contact access useful and that DfE representation at the regional meetings was good. However, others found that the relationship with DfE had been more limited and were unhappy that DfE representation at regional meetings had involved a turnover in individuals who sometimes lacked experience of the sector and were unable to answer questions.
• The Childcare Works initiative was viewed very positively but was seen as having come too late and as providing only some of the answers. There were also requests for more regional meetings rather than in London.
• Several LAs mentioned that the partnership toolkit and other resources from the Family and Childcare Trust had been extremely helpful.
However, the evidence from the early innovator LA leads also identified some challenges, many of which reflected the views of the early implementers:
• The change in name for the policy had been confusing.
177
• The national objective is focused on parental work, but the LA teams charged with implementation are mainly accustomed to delivering educational outcomes for pre-school children rather than influencing parental work through childcare provision.
• There were clear differences between LAs who regard the policy as being demand led by parents and those who see the policy as being supply led by providers. These differences lead to more emphasis being put on one set of relationships than the other, a variation that may be hard to explain and manage later.
• In some areas of the country, resources to implement the extended hours will be limited because the timing of the policy follows on from an aggressive cost-cutting period. As with early implementers, this suggests that additional funding will be required to implement the offer with the national rollout in September 2017.
• There was a common view that information from DfE is usually "too little too late", which has created a perception that those issuing the information have limited appreciation of operational realities and a need for timely release of specific information. In particular, this referred to funding rates, a contract template and statutory guidelines on charging and capital funding decisions. At the time of interviews, there was an ongoing need for LAs to know the timeline for the national campaign in order to be able to align their local campaign plans and avoid duplication of work.
• There were several comments around how the national promotion of the policy could be more effective. First, a more active response by DfE to counterbalance some of the negative media messages. Second, greater clarity on the work requirement in the eligibility criteria to counterbalance the media publicity of simply “more free hours” as this had led to many pointless enquiries from ineligible parents. Third, a greater emphasis more broadly on promoting the benefits of supporting parental work rather than simply “free childcare”.
13.2 Recommendations This evidence suggests the following recommendations for the national rollout:
(L) Consideration should be given to how DfE can most effectively support LAs to implement the policy, including ensuring adequate funding for staff resources to fully implement the policy; direct DfE encouragement of senior level sponsorship within the LA; and providing timely information to LAs on the plans for the national communications strategy.
(M) For the national promotion of the policy, it would be useful to consider the need for simple, key positive messages to promote the policy to providers and parents; promotion of some of the additional benefits; robust responses to some well-

178
publicised perceptions of problems; and how to separate out other broader childcare issues such as workforce development from the 30 hours free childcare.

179
14. Conclusions This chapter summarises the key findings from early implementation. The first section begins by noting the limitations on the evaluation and the caveats around the findings. The second section summarises the evidence on the indications of the likely outcomes during the national rollout and the final section reviews the recommendations.
14.1 How much can be learnt from early implementation? This report has presented a wealth of evidence on the early implementation of the 30 hours free childcare, but it is important to appreciate that there are serious limitations on how much the evaluation can predict about what will happen in the national rollout. These limitations centre around five features of the early implementation.
First, early implementation involved only partial implementation in seven of the eight LAs which meant that sufficiency of delivery and take-up by parents could not be fully tested. On the sufficiency side, complete rollout will mean higher demand for places with a greater risk that demand for places will exceed capacity or that providers will not find it financially attractive to deliver the number of places required. On the take-up side, complete rollout may draw parents into eligibility who are less aware of the policy, less willing to complete the application process or less able to find a suitable place than during early implementation. Although there was complete implementation in one LA, a single case is very unlikely to be representative of a much broader scope of diverse conditions.
Second, early implementation began at the most favourable time of year in terms of spare capacity in provision. Although the national rollout will begin in the same favourable conditions in September 2017, achieving sufficiency of provision could be more challenging later in the school year. However, evidence from the early rollout which began in four LAs in April may help to address this drawback by testing sufficiency and take-up with complete implementation at the least favourable time of year when providers are at highest occupancy and have least spare capacity.
Third, early implementation had the drawback that being an early trial of a policy does not fully replicate the conditions of broader implementation. In particular, the short timeframe meant that there may have been insufficient time for the policy to embed and for any effects (both positive and negative) to materialise. The LAs were also purposively selected (within a fair and competitive process), including a criterion of “a track record on innovation and delivery of sufficiency and meeting other objectives”, suggesting a more favourable implementation than might occur nationwide. In addition, the small number in a trial brings the risk that not all potential issues will be identified. One example issue has already arisen in the ongoing evaluation of the early rollout in the case of an LA considering reducing childcare hours that the LA was funding in schools for children in disadvantaged areas in response to the 30 hours free childcare national policy, an issue

180
which had not arisen in the eight areas with early implementation. Finally, simply being part of a national trial can bring support to a policy within an LA, particularly at the strategic level, which may not be present in a national rollout.
Fourth, several elements of the policy at both the national and local level will be different in the national rollout, including:
• The funding levels from DfE to the LAs will be set under the new EYNFF rather than the GFAs. The rates paid from LAs to providers may also be affected in uncertain ways by the higher number of places: on the one hand, the local rates may be higher to encourage greater provider participation or expansion in capacity, but, on the other hand, they may be lower because the LA is less able to subsidise the rate from other sources.
• Other financial support from DfE will be different in the national rollout: in particular, there will be no early innovator funding to help support implementation, although the national capital funding support may help build capacity.
• Eligibility checking for parents will be undertaken by the Childcare Services system. This will be a critical element for the success of the national rollout: serious issues or delays in the system will be a substantial barrier to implementation, both if parents are unable to establish eligibility for the extended hours or if providers are unable to establish the right to payment for the extended hours.
• LAs will not be under any obligation to undertake the additional supporting measures in the GFAs for early implementation.
Finally, it should be noted that early implementation did not provide any opportunities for a robust evaluation of impact on the final objectives of supporting parental work. There was no available comparison group to identify what parents might have done in the absence of the extended hours and the timeframe may not have been sufficiently long for employment responses to have materialised. The indications of the potential impacts on parental work are based on changes over time (without any control for changes that would have occurred anyway over this period) and parents’ views on a hypothetical scenario that they had not actually experienced.
14.2 Will the policy be a success? Overall, the evidence from early implementation suggests that there is no specific reason to believe that 30 hours free childcare will not be a success. In particular:
• A high proportion of providers were willing and able to offer the extended hours places and there was no evidence that financial implications were a substantial barrier to the delivery of the extended hours.

181
• Parents were keen to take up the extended hours.
• Take-up of the extended hours was associated with increases in the use of formal childcare; longer work hours for mothers and fathers; and some indication of higher work retention for mothers.
• There were additional perceived benefits for families in terms of enhanced work opportunities, direct financial support and broader wellbeing.
This report has used the evidence from early implementation to draw out some recommendations that may help a smooth national rollout in September 2017. Summarising across this long list, the key priorities should be:
• To be mindful of the policy technical details (both at the national level and at the local level). Minor points of detail around the eligibility checking and payment processes or in the statutory guidance could be critical to ensuring that the policy is implemented in the way intended and achieves its objectives.
• Sufficient support from DfE to the LAs to adequately implement the policy including funding for staffing resources; clarity and active assistance on the guidance; and promotion of the policy at senior levels within LAs.
• Positive promotion of the ultimate objectives of encouraging parents to work and supporting working families financially and in broader measures of wellbeing rather than a simple focus on the interim output of delivering more free entitlement hours.

182
Annex A: Additional evaluation methodology details
A.1 Preparation of the census data Children in the ad hoc additional data were matched to the regular census data in a series of nine steps where the matching criteria were successively weakened for children not matched in previous steps. These criteria were combinations of unique provider identifier, child forename and surname, date of birth, gender and child’s home postcode.
Of the 98,504 (99,613) cases in the Early Years and School Census in 2017 (2016):
• 29,594 (29,636) children of reception class age were dropped, of which 92% (87%) were in schools.
• 428 (204) cases with zero free entitlement hours were dropped, of which 424 (all) were in the School Census and 88% (75%) were aged two.
Of those remaining, there were 3,860 cases with missing numbers of free entitlement hours in 2017 which could not be included in any analysis involving the number of hours.
There were 5,287 children reported to be using extended hours in the ad hoc additional data collection. 363 of these had zero additional hours and were dropped (86 in LA C, 12 in LA D, 1 in LA E, 8 in LA F and 256 in LA H).
Of the 4,924 children with additional hours used in the analysis:
• 4,296 (87 percent) were matched to the same provider for their initial free entitlement hours in the main census with a positive number of initial free entitlement hours.
• 145 (3 percent) were matched with a different provider for their initial free entitlement hours in the main census.
• 99 children (2 percent) were matched to a different provider for their initial free entitlement hours in the main census, but the extended hours provider was not in the main census (presumably because these providers were not delivering any initial free entitlement hours or were not in the same LA). This meant that these children were missing information on provider type and other provider characteristics for the provider of the extended hours.
• 230 children (222 in LA H) (5 percent) were matched to the same provider in the main census but had zero initial free entitlement hours and could not be matched to other providers with non-zero initial hours in the main census. In addition, all bar two children using extended hours in LA H were matched to the same providers in the main census, suggesting that those with zero initial hours in the main census may have been spuriously included in the main census. Consequently, these children were

183
categorised as having a different provider for the initial hours which was not in the main census. This meant that these children were missing information on initial free entitlement hours and total hours.
• 120 children (2 percent) could not be matched with the main census but the extended hours provider could be matched with a provider in the main census. This meant that these children were missing information on the number of initial free entitlement hours and total hours and on ethnicity, SEN and EYPP status.
• 34 children (1 percent) could not be matched and the extended hours provider could not be matched with any cases in the main census. This meant that these children were missing information on the initial number of free entitlement hours and total hours; on ethnicity, SEN and EYPP status; and on provider type and other provider characteristics for the provider of the extended hours.
Overall, this meant that in the analysis:
• 8 percent of children using extended hours were missing data on the number of initial free entitlement hours and total hours; 3 percent were missing data on ethnicity, SEN and EYPP status; and 3 percent were missing data on the type and other characteristics of the provider of the extended hours.
• 56 of the 829 providers of extended hours (7 percent) had no provider type or other provider data. This was most prevalent in LA A (23 percent), with the proportions missing this information ranging from 1 percent to 9 percent in the other LAs.
In addition:
• In LA B, none of the extended hours were recorded as being spread over the year, although the LA later reported directly that 26 percent of the children using extended hours were spreading over the year.
• In LA H, there were a large number of missing values for ethnicity in the Early Years Census (56 percent).
A.2 Further details on the providers’ survey LAs invited childcare providers to take part in delivering the extended entitlement and gave providers the opportunity to opt out of the research. Details of those providers who did not opt out of the research were then passed on to NatCen Social Research. Providers then received a letter and email from NatCen, giving them details about the survey and providing a second opportunity to opt out.

184
During the first phase of fieldwork, providers were invited to take part in an online survey only. Following a number of reminder emails, letters and text messages, those providers who had not yet responded were invited to complete the survey over the phone.
In total, 561 childcare providers completed the survey from a sample of 991 providing an overall response rate of 80 percent. 45 percent of questionnaires were completed online and 55 percent were completed by telephone. Response rates are given in table 58.
Table 58: Provider survey response rates by LA
A B C D E F G H Total
Number of responses
Fully productive 78 38 92 71 74 81 20 107 561
Refusals 2 1 10 2 4 5 0 7 31
Other unproductive 0 1 1 0 0 1 0 1 4
Not contacted 15 3 60 10 25 13 6 20 152
Ineligible 30 5 124 25 28 12 1 18 243
Total in sample 125 48 287 108 131 112 27 153 991
Standard measures of response
Full response rate 86% 89% 71% 88% 77% 82% 78% 81% 80%
Co-operation rate 98% 95% 89% 97% 95% 93% 100% 93% 94%
Contact rate 88% 94% 79% 91% 81% 88% 78% 87% 85%
Refusal rate 2% 2% 8% 2% 4% 5% 0% 5% 4%
Eligibility rate 73% 89% 45% 74% 74% 88% 95% 86% 71%
A.3 Further details on the parents’ survey LAs signed parents up to the extended free childcare offer and obtained opt-out consent from parents to pass their details on to NatCen Social Research. Parents who did not opt out of the research were then sent a letter and an email from NatCen, providing details on the survey and a second opportunity to opt out of the research.
During the first phase of fieldwork, parents were invited to take part in an online survey only. Following a number of reminder emails, letters and text messages, those parents who had not yet responded were invited to complete the survey over the phone.
In total 2,257 parents completed the survey from a sample of 3,514 providing an overall response rate of 69 percent. 64 percent of questionnaires were completed online and 36 percent were completed by telephone. Response rates are given in table 59.

185
Table 59: Parent survey response rates by LA
A B C D E F G H Total
Number of responses
Fully productive 265 170 353 148 259 69 247 746 2,257
Refusals 8 0 8 5 7 0 2 25 55
Not contacted 47 216 166 62 62 17 111 353 1,034
Ineligible 5 3 56 5 8 11 14 66 168
Total in sample 325 389 583 220 336 97 374 1,190 3,514
Standard measures of response
Full response rate 83% 44% 70% 69% 79% 82% 70% 68% 69%
Co-operation rate 97% 100% 98% 97% 97% 100% 99% 97% 98%
Contact rate 86% 44% 72% 72% 82% 82% 70% 70% 71%
Refusal rate 3% 0% 2% 2% 2% 0% 1% 2% 2%
Eligibility rate 98% 98% 87% 97% 97% 86% 95% 92% 93%

186
Annex B: Selected tables disaggregated by LA It is important to note that that some of the sample sizes are very small in the following tables when the data is disaggregated by LA, and caution should be exercised in drawing conclusions from them for individual LAs. As in the main body of the report, subgroups with less than 50 observations have been indicated in italics for this reason.
The following tables 60 to 63 correspond to those presented in chapter 4.
Table 60: Child age profile of providers offering extended hours by LA
A B C D E F G H All LAs
Youngest child aged 3
9% 16% 16% 1% 9% 12% 20% 8% 11%
Youngest child aged 2
33% 34% 29% 32% 41% 21% 25% 22% 29%
Youngest child aged under 2
58% 50% 54% 66% 50% 67% 55% 70% 60%
Total
100%
100%
100%
100%
100%
100%
100%
100%
100%
Number of providers 78
38 92 71 74 81 20 107 561
Source: Evaluation Survey of Providers, 2017
Table 61: Size of providers offering extended hours by LA
A B C D E F G H All LAs
35 places or fewer 63% 39% 65% 37% 46% 61% 50% 73% 57%
36–60 places 22% 29% 24% 46% 27% 18% 20% 20% 25%
More than 60 places
15% 32% 11% 17% 27% 21% 30% 8% 17%
Total
100%
100%
100%
100%
100%
100%
100%
100%
100%
Number of providers
78 38 92 71 74 80 20 106 559
Source: Evaluation Survey of Providers, 2017
Notes: The number of places is the number of registered places at the setting. The number of paid staff at each setting indicated a similar pattern in size across the LAs.

187
Table 62: Reasons providers are offering extended hours by LA
Percentage of settings reporting (multiple) reasons
A B C D E F G H All LAs
Invitation / encouraged by LA
78% 97% 79% 77% 61% 64% 100% 75% 75%
Wanted to support the extended hours offer
56% 76% 74% 70% 77% 62% 65% 75% 70%
Parents requested to use extended hours
62% 61% 69% 61% 72% 78% 50% 69% 68%
Concerned parents would use another provider offering hours
34% 34% 58% 49% 34% 37% 25% 56% 44%
A good business opportunity
34% 58% 46% 40% 42% 41% 40% 46% 43%
Information / communications from central government
22% 24% 31% 23% 24% 20% 25% 22% 24%
Information / communications from professional organisations
27% 16% 13% 10% 20% 12% 10% 15% 16%
To test the extended hours in the setting
5% 3% 0% 3% 4% 4% 0% 0% 2%
To provide continuity of care to eligible children
1% 3% 0% 0% 0% 1% 0% 5% 1%
Felt obliged to take part
0% 0% 0% 0% 0% 1% 5% 0% <1%
Number of providers
77
38
91
70
74
81
20
107
558
Source: Evaluation Survey of Providers, 2017
Note: Providers could indicate multiple reasons.

188
Table 63: LA support for delivery of extended hours by LA
A B C D E F G H All LAs
Received sufficient support
68% 82% 71% 74% 65% 66% 89% 71% 71%
Would have liked more support
18% 11% 18% 20% 24% 19% 11% 21% 19%
Did not require any support
13% 8% 11% 6% 11% 15% 0% 8% 10%
Total
100%
100%
100%
100%
100%
100%
100%
100%
100%
Number of providers
77
38
91
70
74
81
20
107
558
Source: Evaluation Survey of Providers, 2017
The following tables 64 to 70 correspond to those presented in chapter 5.
Table 64: Capacity to offer more places by LA
A B C D E F G H All LAs
Definitely have capacity to offer more places
17% 24% 42% 32% 47% 28% 20% 23% 30%
Possibly have capacity to offer more places
23% 41% 32% 32% 32% 40% 45% 32% 33%
Do not have capacity to offer more places
60% 35% 26% 35% 20% 32% 35% 45% 37%
Total
100%
100%
100%
100%
100%
100%
100%
100%
100%
Number of providers 77 37 92 71 74 81 20 106 558
Source: Evaluation Survey of Providers, 2017

189
Table 65: Other free entitlement places for providers offering extended hours by LA
A B C D E F G H All LAs
Proportion with universal entitlement 15 hour places
72% 81% 86% 91% 90% 80% 82% 73% 81%
Proportion with free entitlement 2 year old places
46% 72% 40% 76% 65% 49% 61% 44% 53%
Number of providers 97 43 133 80 136 114 44 182 829
Sources: Early Years Census, School Census and additional evaluation data collection, January 2017 Notes: The proportion with free entitlement two year old places was slightly higher (61 percent) in the evaluation survey of providers, but the patterns across the LAs were very similar to those presented here.
Table 66: Changes in numbers of free entitlement places within providers by LA
Mean change in number of free entitlement places
A B C D E F G H All LAs
Extended for 3 / 4 year olds
5.8 10.5 5.3 5.3 3.3 3.1 14.9 11 6.8
Universal entitlement 15 hour places
-5.4 -8.5 -5.5 -6.3 -4.1 -4.7 -16.3 -9.7 -6.9
2 year old places -1 -3 -0.3 -1 -0.1 -0.1 0 -0.2 -0.5
All free entitlement places
-0.6 -1 -0.6 -2.1 -0.9 -1.6 -1.4 1.1 -0.6
Number of providers delivering free entitlement places in 2016
72 35 109 71 108 87 35 148 665
Sources: Early Years Census, School Census and additional evaluation data collection, January 2016 & 2017

190
Table 67: Impact on free entitlement places for three / four year olds by LA
Percentage of settings A B C D E F G H All
LAs
Increase due to extended hours 14% 36% 24% 14% 15% 20% 15% 28% 21%
Increase for other or unknown reasons 5% 6% 5% 15% 5% 10% 5% 9% 8%
No change 76% 56% 67% 69% 80% 68% 75% 59% 68%
Decrease due to extended hours 3% 3% 1% 1% 0% 2% 5% 3% 2%
Decrease for other unknown reasons 1% 0% 2% 0% 0% 0% 0% 1% 1%
Total
100%
100%
100%
100%
100%
100%
100%
100%
100%
Number of providers
76
36
91
71
74
81
20
107
556
Source: Evaluation Survey of Providers, 2017
Table 68: Impact on free entitlement places for two year olds by LA
Percentage of settings A B C D E F G H All
LAs
Increase due to extended hours 3% 25% 6% 5% 5% 10% 0% 10% 8%
Increase for other or unknown reasons 3% 11% 26% 18% 8% 8% 17% 8% 12%
No change 90% 54% 61% 70% 83% 73% 83% 73% 73%
Decrease due to extended hours 0% 7% 0% 4% 0% 3% 0% 2% 2%
Decrease for other unknown reasons 5% 4% 7% 4% 3% 8% 0% 6% 5%
Total
100%
100%
100%
100%
100%
100%
100%
100%
100%
Number of providers
39
28
54
57
59
40
12
49
338
Source: Evaluation Survey of Providers, 2017
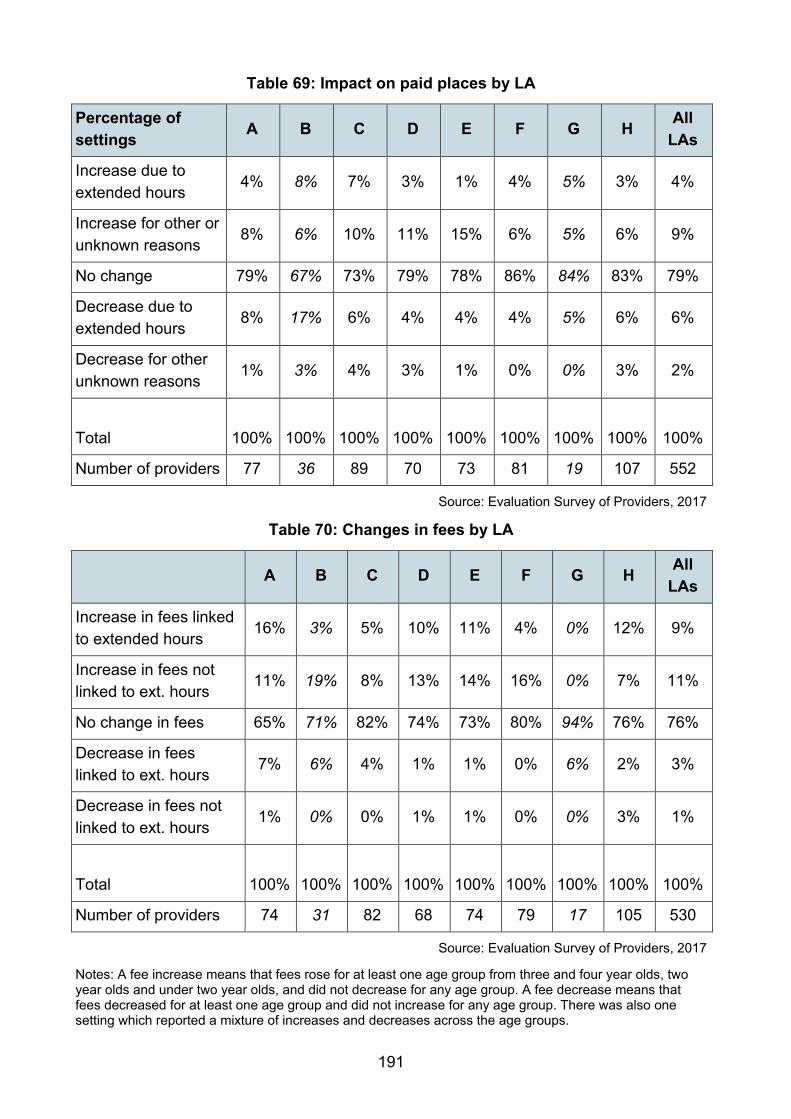
191
Table 69: Impact on paid places by LA
Percentage of settings A B C D E F G H All
LAs
Increase due to extended hours
4% 8% 7% 3% 1% 4% 5% 3% 4%
Increase for other or unknown reasons
8% 6% 10% 11% 15% 6% 5% 6% 9%
No change 79% 67% 73% 79% 78% 86% 84% 83% 79%
Decrease due to extended hours
8% 17% 6% 4% 4% 4% 5% 6% 6%
Decrease for other unknown reasons
1% 3% 4% 3% 1% 0% 0% 3% 2%
Total
100%
100%
100%
100%
100%
100%
100%
100%
100%
Number of providers 77 36 89 70 73 81 19 107 552
Source: Evaluation Survey of Providers, 2017
Table 70: Changes in fees by LA
A B C D E F G H All LAs
Increase in fees linked to extended hours
16% 3% 5% 10% 11% 4% 0% 12% 9%
Increase in fees not linked to ext. hours
11% 19% 8% 13% 14% 16% 0% 7% 11%
No change in fees 65% 71% 82% 74% 73% 80% 94% 76% 76%
Decrease in fees linked to ext. hours
7% 6% 4% 1% 1% 0% 6% 2% 3%
Decrease in fees not linked to ext. hours
1% 0% 0% 1% 1% 0% 0% 3% 1%
Total
100%
100%
100%
100%
100%
100%
100%
100%
100%
Number of providers 74 31 82 68 74 79 17 105 530
Source: Evaluation Survey of Providers, 2017
Notes: A fee increase means that fees rose for at least one age group from three and four year olds, two year olds and under two year olds, and did not decrease for any age group. A fee decrease means that fees decreased for at least one age group and did not increase for any age group. There was also one setting which reported a mixture of increases and decreases across the age groups.

192
The following tables 71 to 79 correspond to those presented in chapter 7.
Table 71: Number of days attended by children
A B C D E F G H All LAs
Number of days attended each week
1 day 1% 1% 4% 2% 3% 1% 1% 9% 5%
2 days 5% 2% 16% 5% 10% 18% 9% 22% 14%
3 days 16% 18% 23% 24% 29% 19% 27% 31% 25%
4 days 18% 9% 18% 29% 17% 23% 11% 16% 17%
5 days 60% 69% 40% 41% 41% 39% 51% 22% 39%
6 days <1% 1% 0% 0% 0% 0% 0% <1% <1%
Total
100%
100%
100%
100%
100%
100%
100%
100%
100%
Weekend attendance
Proportion attend on weekend
0.6% 1.1% 0.0% 0.0% 0.3% 1.2% 0.0% 0.3% 0.3%
Number of places
328
184
475
153
286
83
260
950
2,719
Source: Evaluation Survey of Parents, 2017
Table 72: Proportion using extended hours in school holidays by LA
A B C D E F G H All LAs
Proportion spreading hours across more than 38 weeks
25% 0% 15% 37% 18% 27% 16% 13% 17%
Number of extended hours places
480 404 654 385 420 320 583 1,678 4,924
Sources: Early Years Census, School Census and additional evaluation data collection, January 2017
Note: LA B subsequently reported that the number of children accessing a stretched offer was 106 of the 404 places in January (26 percent) rather than none as reported in the census.

193
Table 73: Proportions using free entitlement and paid hours in school holidays by LA
A B C D E F G H All LAs
Use free entitlement hours in holidays
23% 33% 25% 45% 35% 34% 30% 37% 33%
Use only paid hours in holidays
25% 19% 14% 14% 23% 29% 15% 18% 19%
Do not use in holidays
52% 48% 61% 40% 42% 37% 55% 44% 49%
Total
100%
100%
100%
100%
100%
100%
100%
100%
100%
Number of free entitlement places 306 156 439 132 268 79 242 903 2,525
Source: Evaluation Survey of Parents, 2017
Table 74: Provider report of parent choice in using extended hours by LA
A B C D E F G H All LAs
Free choice 45% 34% 42% 49% 59% 51% 65% 62% 51%
Flexibility but with some restrictions
44% 42% 48% 41% 34% 41% 15% 33% 39%
Hours can only be used on specified days or times
12% 24% 10% 10% 7% 9% 20% 6% 10%
Total
100%
100%
100%
100%
100%
100%
100%
100%
100%
Number of providers 78 38 92 71 74 81 20 107 561
Source: Evaluation Survey of Providers, 2017

194
Table 75: Parent report of parent choice in using free entitlement hours by LA
A B C D E F G H All LAs
Free choice 29% 31% 39% 42% 54% 31% 33% 38% 38%
Flexibility but with some restrictions
45% 31% 39% 44% 35% 54% 47% 43% 42%
Days and times are specified by provider
26% 38% 22% 14% 12% 14% 20% 19% 21%
Total
100%
100%
100%
100%
100%
100%
100%
100%
100%
Number of free entitlement places
328 184 474 153 284 83 258 950 2,714
Source: Evaluation Survey of Parents, 2017
Table 76: Change in flexibility for universal entitlement by LA
A B C D E F G H All LAs
Flexibility improved 3% 18% 19% 1% 7% 4% 10% 7% 8%
Flexibility stayed the same
64% 55% 64% 79% 76% 80% 65% 58% 68%
Flexibility became more limited
17% 21% 11% 17% 15% 10% 15% 19% 15%
No 15 hours only places
16% 5% 7% 3% 3% 6% 10% 17% 9%
Total
100%
100%
100%
100%
100%
100%
100%
100%
100%
Number of providers 76 38 91 71 74 81 20 107 558
Source: Evaluation Survey of Providers, 2017
Table 77: Proportion of children paying for additional hours by LA
A B C D E F G H All LAs
At provider delivering extended hours
33% 23% 16% 31% 21% 22% 25% 20% 23%
Number of places 480 404 654 385 420 320 583 1,678 4,924
Sources: Early Years Census, School Census and additional evaluation data collection, January 2017

195
Table 78: Fees and charges for free entitlement providers by LA
A B C D E F G H All LAs
Percentage with charges
48% 28% 65% 33% 73% 63% 60% 54% 55%
Combinations of charges and fees for additional hours
No fees: - no charges - charges
31% 27%
45% 12%
26% 48%
47% 18%
14% 39%
14% 26%
16% 45%
27% 27%
27% 32%
Fees for minority of hours : - no charges - charges
10% 15%
16% 10%
7% 13%
16% 11%
8% 27%
11% 23%
16% 13%
12% 19%
11% 17%
Fees for majority of hours: - no charges - charges
5% 3%
4% 4%
1% 3%
3% 1%
1% 3%
5% 3%
3% 1%
3% 3%
3% 3%
Fees for all hours: - no charges - charges
5% 3%
8% 2%
2% 1%
2% 3%
3% 5%
9%
10%
6% 1%
5% 4%
4% 3%
Total
100%
100%
100%
100%
100%
100%
100%
100%
100%
Number of free entitlement places 327 183 474 151 280 80 257 938 2,690
Source: Evaluation Survey of Parents, 2017 Notes: Fees for all hours means that the parents report paying for all fees but receive a reduction on the bill due to the 15 hours free entitlement or the 30 hours free childcare policies. Charges are additional charges paid by the parent for lunches, snacks or special activities which are not included in the fees.

196
Table 79: Increases in charges by LA
A B C D E F G H All LAs
Introduced or increased charges due to extended hours
13% 13% 13% 10% 11% 7% 10% 24% 13%
Introduced or increased charges but not due to extended hours
1% 3% 5% 4% 5% 5% 5% 2% 4%
Did not introduce or increase charges
86% 84% 81% 86% 84% 88% 85% 75% 83%
Total
100%
100%
100%
100%
100%
100%
100%
100%
100%
Number of providers 76 38 91 71 74 81 20 106 557
Source: Evaluation Survey of Providers, 2017
The following tables 80 to 85 correspond to those presented in chapter 8.
Table 80: Changes in delivery cost due to extended hours by LA
A B C D E F G H All LAs
Increased 22% 41% 34% 28% 31% 24% 24% 37% 30%
No change 67% 50% 55% 65% 65% 69% 71% 59% 62%
Decreased 11% 9% 11% 7% 4% 7% 6% 4% 7%
Total
100%
100%
100%
100%
100%
100%
100%
100%
100%
Number of providers 73 34 89 68 74 75 17 99 529
Source: Evaluation Survey of Providers, 2017

197
Table 81: Changes in hourly staff pay due to extended hours by LA
A B C D E F G H All LAs
Increased 10% 16% 13% 13% 14% 12% 0% 13% 12%
No change 77% 81% 82% 86% 83% 84% 94% 83% 83%
Decreased 13% 3% 4% 1% 3% 4% 6% 4% 5%
Total
100%
100%
100%
100%
100%
100%
100%
100%
100%
Number of providers 71 37 89 69 72 73 17 94 522
Source: Evaluation Survey of Providers, 2017
Table 82: Changes in profits due to extended hours by LA
A B C D E F G H All LAs
Increased 9% 29% 26% 29% 18% 26% 27% 23% 22%
No change 34% 39% 30% 32% 41% 46% 45% 42% 38%
Decreased 57% 32% 45% 39% 41% 29% 27% 35% 40%
Total
100%
100%
100%
100%
100%
100%
100%
100%
100%
Number of providers measuring profits
68 28 74 56 68 70 11 96 471
Source: Evaluation Survey of Providers, 2017

198
Table 83: Mix of free entitlement providers
A B C D E F G H All LAs
One provider
Day nursery 30% 43% 14% 40% 46% 29% 35% 33% 33%
Playgroup 8% 4% 11% 19% 15% 22% 17% 18% 15%
Childminder 1% 2% 1% 1% 1% 12% 2% 2% 2%
School 38% 39% 38% 34% 26% 17% 40% 18% 30%
Unclassified 0% 2% 1% 1% <1% 0% 2% 1% 1%
Two providers
Neither a childminder
7% 5% 27% 2% 9% 7% 3% 16% 12%
One a childminder
15% 4% 6% 2% 2% 13% 1% 9% 7%
Three plus providers
Any combination
1% 0% 2% 0% 0% 0% 1% 2% 1%
Total
100%
100%
100%
100%
100%
100%
100%
100%
100%
Number of children
264 168 353 147 257 69 246 741 2,245
Source: Evaluation Survey of Parents, 2017 Notes: The school category combines both nursery schools and nursery classes. The unclassified includes specialist providers for SEN.

199
Table 84: Use of additional care by LA
A B C D E F G H All LAs
None 62% 67% 48% 64% 56% 61% 45% 55% 55%
Paid only 5% 3% 4% 1% 3% 3% 1% 3% 3%
Paid only + informal 2% 1% 3% 0% 2% 1% 2% 2% 2%
Informal only 31% 30% 45% 35% 40% 35% 52% 39% 40%
Total
100%
100%
100%
100%
100%
100%
100%
100%
100%
Number of children
264
168
353
147
257
69
246
741
2,245
Source: Evaluation Survey of Parents, 2017
Note: Paid only is care with a provider for which the parent pays fees for all the hours and does not receive any reduction on the bill due to the 15 hours free entitlement or the 30 hours free childcare policies.
Table 85: Use of additional care by free entitlement provider type
Only day nursery
Only playgroup
Only childminder
Only school
Mix of types All
None 61% 53% 72% 51% 53% 55%
Paid only 2% 4% 3% 5% 1% 3%
Paid only + informal
1% 2% 8% 3% 1% 2%
Informal only 36% 42% 18% 40% 45% 40%
Total
100%
100%
100%
100%
100%
100%
Number of children
733 327 39 663 461 2,245
Source: Evaluation Survey of Parents, 2017

200
© Frontier Economics 2017
Reference: DFE-RR708
ISBN: 978-1-78105-791-9
The views expressed in this report are the authors’ and do not necessarily reflect those of the Department for Education.
Any enquiries regarding this publication should be sent to us at: [email protected] or www.education.gov.uk/contactus
This document is available for download at www.gov.uk/government/publications