evaluation of early intervention in washington state · infant toddler early intervention program....
TRANSCRIPT

Evaluation ofEarly Interventionin Washington State
Options and Issues
Washington State Department of Social and Health ServicesResearch and Data AnalysisInfant Toddler Early Intervention Program
Evaluation of Early Interventionin Washington State:
Options and Issues
Janet Campbell, Ph.D.Laurie Cawthon, M.D., M.P.H.
Trisha Keenan, M.A.Dorothy Lyons, M.P.A.Laura Schrager, M.A.
July 1998
Research and Data AnalysisDepartment of Social and Health Services
Olympia, Washington 98504-5204
ii
DEPARTMENT OF SOCIAL AND HEALTH SERVICES
Lyle Quasim, Secretary
MANAGEMENT SERVICES ADMINISTRATION
Kennith Harden, Assistant Secretary
RESEARCH AND DATA ANALYSIS
Elizabeth Kohlenberg, Ph.D., Acting Director
DIVISION OF DEVELOPMENTAL DISABILITIES
Timothy R. Brown, Ph.D., Director
INFANT AND TODDLER EARLY INTERVENTION PROGRAM
Sandy Loerch, Program Director
ADVISORY GROUP
Nancy Anderson, M.D., M.P.H., DSHS/Medical Assistance AdministrationNancy Fisher, R.N., M.D., M.P.H., DSHS/Medical Assistance AdministrationJean Kelly, Ph.D., University of WashingtonKaty Middleton, B.S., ParentPaulette Mills, Ph.D., Washington State University, PullmanJudith Moore, M.A., Boyer Children’s ClinicCharles Peck, Ph.D., Washington State University, VancouverSusan Sandall, Ph.D., University of WashingtonKristine Slentz, Ph.D., Western Washington UniversityJohn Stull, M.D., M.P.H., Oregon Health Sciences University
PROGRAM STAFF
Lou Colwell, Ed.D., Office of Superintendent of Public InstructionDeborah Lee, Ph.D., R.N., Department of HealthBabs Roberts, Infant Toddler Early Intervention Program
When ordering, please refer toReport Number 7.95a

iii
ACKNOWLEDGMENTSThis report was prepared for and funded by the Infant Toddler Early Intervention Program(ITEIP), Division of Developmental Disabilities (DDD), Department of Social and HealthServices (DSHS).
Sincere thanks go to the members of the Child and Family Early Intervention OutcomeMeasures Planning Project Advisory Group who provided careful, thoughtful review,commentary, and direction. While Research and Data Analysis (RDA) is grateful for theassistance of the Advisory Group, RDA researchers are primary authors and assume fullresponsibility for any omissions or misstatements contained in the report.
Special thanks go to the individuals from child developmental programs, CountyInteragency Coordinating Councils, Educational Service Districts, Infant Toddler EarlyIntervention Program Lead Agencies and additional contractors, neurodevelopmentalcenters, school district Special Education Directors for schools who currently servechildren, tribal authorities, University Affiliated Programs, and University SpecialEducation Teacher Preparation Programs who completed the local assessment survey forms.Appreciation goes to the research investigators who responded to the request forinformation on research studies being conducted on early intervention in Washington Stateincluding Kathryn Barnard, Cathryn Booth, Rodd Hedlund, Coleen Morisset Huebner,Susan Janko, Jean Kelly, and Susan Spieker.
For information, materials, and feedback, special thanks goes to Myriam Baker, Researcher,Colorado Foundation for Families and Children; Maryanne Barnes, Executive Director,Tacoma Learning Center; Michael Conn-Powers, Institute for the Study of DevelopmentalDisabilities, Indiana University-Bloomington; Ellen Frede, The School of Education, TheCollege of New Jersey; Michael Gamel-McCormick, Center for Disabilities Studies,University of Delaware; Kathy Hebbeler National Early Intervention Longitudinal Study,Stanford Research Institute (SRI) International; Susan Janko, College of Education-SpecialEducation, University of Washington; Deborah Montgomery, American Institutes forResearch; Jeff Priest, Early Childhood Research Institute on Measuring Growth andDevelopment, University of Minnesota; Richard N. Roberts, Director, Early InterventionResearch Institute, Utah State University; Beppie Shapiro, University of Hawaii at Manoa.
Elizabeth Kohlenberg, Acting Director of RDA, DSHS, provided oversight and overallproject management.
Sincere thanks go to Karen Thorson, who designed the cover of the report, and helped withthe layout, details, and organization of the report; Jason Fry, Francia Reynolds and GregKirkpatrick for maintaining the RDA computer network, a system that meets the diversedemands of RDA’s managers, researchers, analysts, programmers, and talented supportstaff.

iv
v
TABLE OF CONTENTS
EXECUTIVE SUMMARY ........................................................................................................... ix
CHAPTER 1: INTRODUCTION................................................................................................ 1 Background........................................................................................................... 1
CHAPTER 2: METHODS............................................................................................................ 9Preliminary Background Research........................................................................ 9Input from Stakeholders ........................................................................................ 10State Interagency Coordinating Committee.......................................................... 11
CHAPTER 3: DEVELOPMENT OF FAMILY AND CHILD OUTCOME MEASURESAT THE FEDERAL LEVEL................................................................................ 13Introduction............................................................................................................ 13National Early Intervention Longitudinal Study (NEILS).................................... 13Early Childhood Research Institute on Measuring Growthand Development (ECRI-MGD)........................................................................... 17Consortiums........................................................................................................... 20Early Intervention Research Institute (EIRI) 1986-1995...................................... 24Summary................................................................................................................ 26
CHAPTER 4: DEVELOPMENT OF FAMILY AND CHILD OUTCOME MEASURESAT THE STATE LEVEL...................................................................................... 29Introduction............................................................................................................ 29Implementation Studies......................................................................................... 31Research Studies.................................................................................................... 32Feasibility/Exploratory Studies ............................................................................. 34Summary................................................................................................................ 36
CHAPTER 5: LOCAL ASSESSMENT IN WASHINGTON STATE ....................................... 37Local Assessment Activities ................................................................................. 37Research Studies.................................................................................................... 39
CHAPTER 6: DATA INVENTORY............................................................................................ 45Data from Office of Superintendent of Public Instructions/Student Files ........... 45Data from Division of Developmental Disabilities Files ..................................... 46Data from Department of Health Files.................................................................. 46First Steps Database .............................................................................................. 46
CHAPTER 7: STUDY DESIGNS................................................................................................ 51General Literature Review .................................................................................... 51Methodological Challenges................................................................................... 55Study Design Options............................................................................................ 62
vi
CHILD/FAMILY SERVES AS OWN CONTROL-LARGE SCALELONGITUDINAL STUDY .................................................................................. 63CHILD/FAMILY SERVES AS OWN CONTROL-SMALL SCALELONGITUDINAL STUDY .................................................................................. 81COMPARISON GROUP-LONGITUDINAL STUDY ....................................... 92PRE-POST STUDY.............................................................................................. 100RETROSPECTIVE CROSS-SECTIONAL STUDY .......................................... 108KEY INFORMANT SURVEY STUDY.............................................................. 122
CHAPTER 8: DISCUSSION AND RECOMMENDATIONS ................................................... 137Recommendations ................................................................................................. 138Discussion.............................................................................................................. 139
CHAPTER 9: FUTURE DIRECTIONSRECOMMENDATIONS FOR WASHINGTON STATE................................... 145Introduction............................................................................................................ 145Discussion.............................................................................................................. 146Washington State Recommendations ................................................................... 149
REFERENCES............................................................................................................................... 157
APPENDICES................................................................................................................................ 169
Appendix A Biosketches .................................................................................. 173Appendix B Child and Family Characteristics (Background Variables) ........ 177Appendix C Local Assessment Survey............................................................. 179Appendix D State and National Early Intervention Goals................................ 181Appendix E Statistical Models for Using Subjects as Their Own Control...... 195
The LITERATURE SUMMARY is available upon request from Research and Data Analysis,Department of Social and Health Services, (360) 902-0713

vii
viii
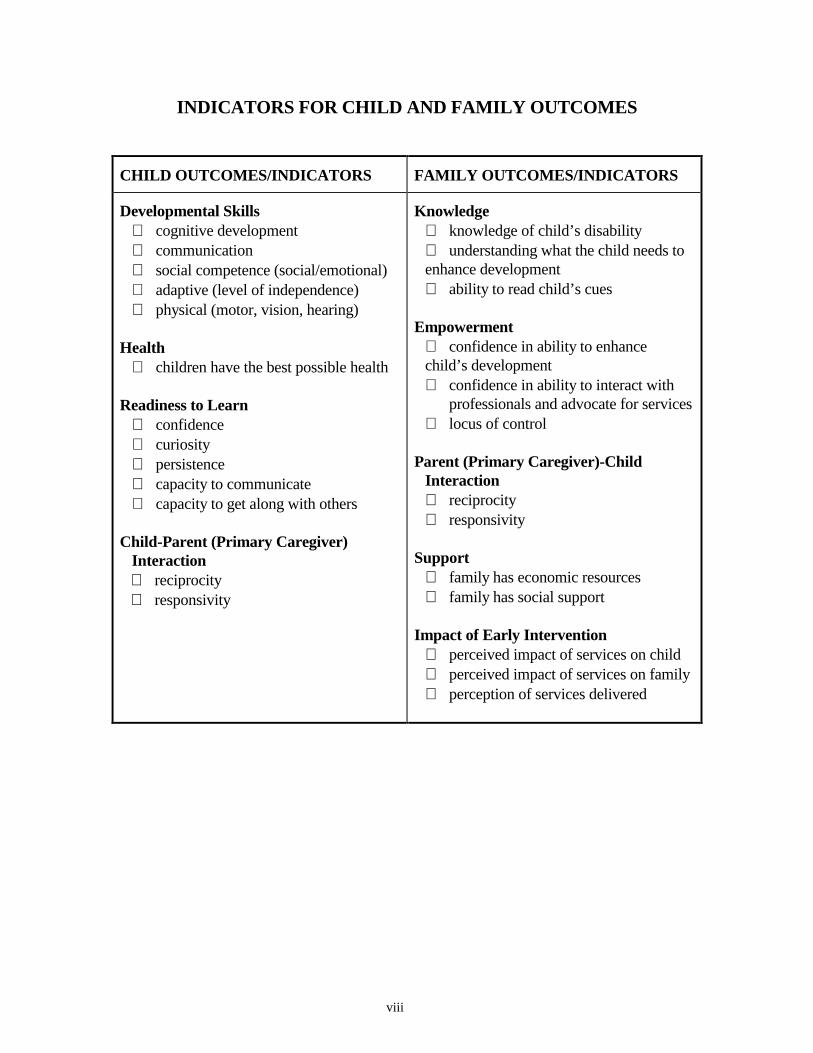
INDICATORS FOR CHILD AND FAMILY OUTCOMES
CHILD OUTCOMES/INDICATORS FAMILY OUTCOMES/INDICATORS
Developmental Skills∗ cognitive development∗ communication∗ social competence (social/emotional)∗ adaptive (level of independence)∗ physical (motor, vision, hearing)
Health∗ children have the best possible health
Readiness to Learn∗ confidence∗ curiosity∗ persistence∗ capacity to communicate∗ capacity to get along with others
Child-Parent (Primary Caregiver)Interaction∗ reciprocity∗ responsivity
Knowledge∗ knowledge of child’s disability∗ understanding what the child needs to enhance development∗ ability to read child’s cues
Empowerment∗ confidence in ability to enhance child’s development∗ confidence in ability to interact with
professionals and advocate for services∗ locus of control
Parent (Primary Caregiver)-ChildInteraction∗ reciprocity∗ responsivity
Support∗ family has economic resources∗ family has social support
Impact of Early Intervention∗ perceived impact of services on child∗ perceived impact of services on family∗ perception of services delivered
ix
EVALUATION OF EARLY INTERVENTION INWASHINGTON STATE: OPTIONS AND ISSUES
EXECUTIVE SUMMARY
This report describes options for study designs to evaluate the impact of early interventionon infants and toddlers, birth to three, with disabilities or developmental delays and theirfamilies, one of Washington State’s most vulnerable populations.
Information was gathered from an extensive literature review, a survey of local assessmentefforts in Washington State, a technical data inventory, and consultation with stakeholderssuch as service providers, agency personnel (Department of Health, Department of Socialand Health Services, and the Office of Superintendent of Public Instruction), parents, andcommunity supporters. Research and Data Analysis convened an advisory group to provideprofessional expertise in reviewing and commenting on materials prepared for this project.
The project was funded by the Department of Social and Health Services (DSHS), InfantToddler Early Intervention Program (ITEIP). Its intent was to develop study designs tomeet the evaluation goals of parents, the Joint Legislative Audit and Review Committee(JLARC), ITEIP, and stakeholders.
OUTCOMES
The study designs, and their associated child and family outcomes, are intended to addressthe question: what is the impact of early intervention services on children, birth to three,with disabling or delaying conditions and their families in Washington State? The range ofoutcomes chosen for the child and the family and indicators are listed on the previous page.The particular design of the study determines which outcomes are selected for that study.
STUDY DESIGN OPTIONS
Research on the effectiveness of early intervention involves a variety of methodologicalchallenges. The absence of a control group presents the greatest problem. If subjectscannot be randomly assigned to treatment (early intervention) and non-treatment (no earlyintervention), it is difficult to conclude that changes in child/family outcomes are duespecifically to early intervention. To control for effects on outcomes from factors other thanearly intervention, characteristics which affect child/family outcomes must be taken intoaccount.
x
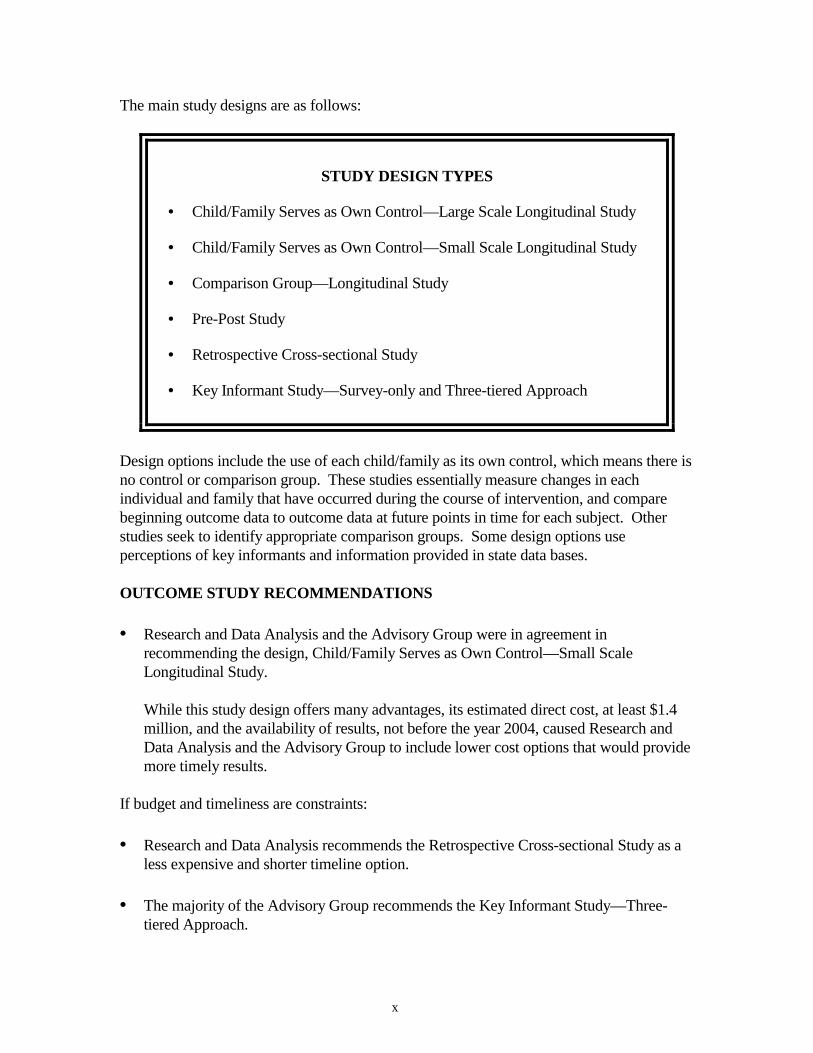
The main study designs are as follows:
STUDY DESIGN TYPES
• Child/Family Serves as Own Control—Large Scale Longitudinal Study
• Child/Family Serves as Own Control—Small Scale Longitudinal Study
• Comparison Group—Longitudinal Study
• Pre-Post Study
• Retrospective Cross-sectional Study
• Key Informant Study—Survey-only and Three-tiered Approach
Design options include the use of each child/family as its own control, which means there isno control or comparison group. These studies essentially measure changes in eachindividual and family that have occurred during the course of intervention, and comparebeginning outcome data to outcome data at future points in time for each subject. Otherstudies seek to identify appropriate comparison groups. Some design options useperceptions of key informants and information provided in state data bases.
OUTCOME STUDY RECOMMENDATIONS
• Research and Data Analysis and the Advisory Group were in agreement inrecommending the design, Child/Family Serves as Own Control—Small ScaleLongitudinal Study.
While this study design offers many advantages, its estimated direct cost, at least $1.4million, and the availability of results, not before the year 2004, caused Research andData Analysis and the Advisory Group to include lower cost options that would providemore timely results.
If budget and timeliness are constraints:
• Research and Data Analysis recommends the Retrospective Cross-sectional Study as aless expensive and shorter timeline option.
• The majority of the Advisory Group recommends the Key Informant Study—Three-tiered Approach.
xi
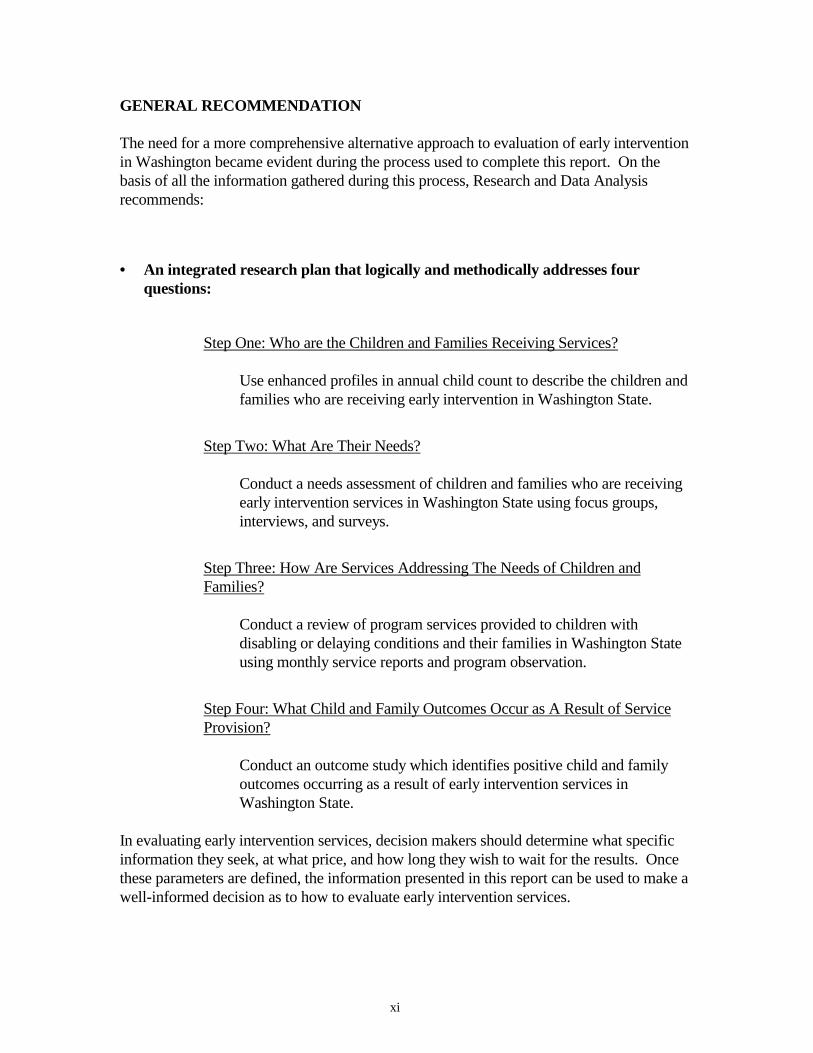
GENERAL RECOMMENDATION
The need for a more comprehensive alternative approach to evaluation of early interventionin Washington became evident during the process used to complete this report. On thebasis of all the information gathered during this process, Research and Data Analysisrecommends:
• An integrated research plan that logically and methodically addresses fourquestions:
Step One: Who are the Children and Families Receiving Services?
Use enhanced profiles in annual child count to describe the children andfamilies who are receiving early intervention in Washington State.
Step Two: What Are Their Needs?
Conduct a needs assessment of children and families who are receivingearly intervention services in Washington State using focus groups,interviews, and surveys.
Step Three: How Are Services Addressing The Needs of Children andFamilies?
Conduct a review of program services provided to children withdisabling or delaying conditions and their families in Washington Stateusing monthly service reports and program observation.
Step Four: What Child and Family Outcomes Occur as A Result of ServiceProvision?
Conduct an outcome study which identifies positive child and familyoutcomes occurring as a result of early intervention services inWashington State.
In evaluating early intervention services, decision makers should determine what specificinformation they seek, at what price, and how long they wish to wait for the results. Oncethese parameters are defined, the information presented in this report can be used to make awell-informed decision as to how to evaluate early intervention services.

xii
CHAPTER 1
INTRODUCTION
This report describes options for study designs to evaluate the impact of earlyintervention on infants and toddlers, birth to three, with disabilities or developmentaldelays and their families, one of Washington State’s most vulnerable populations.
The Child and Family Early Intervention Outcome Measures Planning Project is fundedby the Department of Social and Health Services (DSHS), Infant Toddler EarlyIntervention Program (ITEIP). This project’s intent was to develop study designs to meetthe evaluation goals of parents, the Joint Legislative Audit and Review Committee(JLARC), ITEIP, and stakeholders. This report presents a range of study designs withoutcome measures, data sources and methods needed to accomplish them, and theirapproximate costs.
It is hoped that the outcome measures and study designs presented here will enhanceplanning and discussion at the state and local levels, and facilitate decision making andpriority setting for Washington’s early intervention programs for infants and toddlers andtheir families. In addition to the outcome measures and study designs, summaries of ourpreliminary background research are presented in the separate appendix, LiteratureSummary, and in this report. These include the literature summary (separate appendix),local assessment (Chapter 5), and data inventory (Chapter 6).
BACKGROUND
With the passage of the Education for All Handicapped Children Act (Public Law 94-142) in 1975, later retitled the Individuals with Disabilities Education Act (IDEA), theeducational rights for all school-age children with disabilities, ages 6 through 18, wereensured. Within this law were incentives for including preschool-age children. Thislegislation evolved from various state statutes and federal court cases based on the UnitedStates Constitution (Martin et al., 1996).
Policy makers at the federal level, recognizing the importance of early referral andintervention for children with disabilities and developmental delays ages birth to five,passed the 1986 amendments to Public Law 99-457 later known as the Individuals withDisabilities Education Act (IDEA). Part B of IDEA extends rights to children withdisabilities, ages three to six.* Part H of IDEA offers states federal incentive funds toplan, develop, and implement a statewide system of coordinated interagency programs forinfants and toddlers with disabling or delaying conditions, birth to three years of age, andtheir families. The Part H program in Washington State is named the Infant ToddlerEarly Intervention Program (ITEIP). The Governor designated DSHS as the lead agencyfor Part H federal funds. The five participating state agencies include DSHS; Departmentof Community, Trade and Economic Development; Department of Health; Department of * In this report, three to six indicates children who are three years or older, and less than six years of age.(Office of Superintendent of Public Instruction refers to these children as 3 to 5 year olds.)

2
Services for the Blind; and Office of the Superintendent of Public Instruction. In October1994, Washington State began full implementation of Part H. As of July 1998, Part Hwill be titled Part C.
In Washington State, 5,007 infants and toddlers under three years of age were determinedto be enrolled in public early intervention services for delaying or disabling conditions asof December 1, l997 (Lyons et al., 1998). Infants and toddlers with disabilities and theirfamilies are eligible to receive an array of public early intervention services although allmay not seek enrollment in state programs. Public early intervention services for childrenbirth to three with delaying or disabling conditions are provided by child developmentcenters, county health and human service agencies, educational service districts,neurodevelopmental centers, school districts, tribal programs, and other local and stateagencies. The Individuals with Disabilities Education Act (IDEA), Part H program actsas an umbrella and provides linkages and enhancement of these services to ensure astatewide system of comprehensive, multi-disciplinary, coordinated services to infantsand toddlers with disabilities and their families.
In the Birth to Three Years Study (Harding and Keating, 1995), the Legislative BudgetCommittee (now called the Joint Legislative Audit and Review Committee, JLARC) andthe Washington State Institute for Public Policy (WSIPP) recommended that thelegislature conduct an evaluation of the Part H program and that the Department of Socialand Health Services and the State Interagency Coordinating Council develop outcomemeasures and begin tracking the necessary data to document these measures.
Measurement of Impact of Part H and Early Intervention Services
In the early stages of this project many long discussions including those with theAdvisory Group revolved around whether the most appropriate response to JLARC’srecommendation was to measure the impact of Part H or the public early interventionservices. It was decided that these questions could not be separated, in that Part H is anintegral part of early intervention services in Washington State.
Measures of Success
Neurophysiological Basis of Future Development
A new consensus about the importance of intervening in the first months and years of lifeis emerging in the field of early intervention for children with established disabilities ordevelopmental delays and those at risk biologically or environmentally (Guralnick, 1998).In 1997 House Resolution 131 was submitted entitled Zero to Three Resolution for EarlyChildhood Development, expressing the consensus of the House of Representatives thatsufficient funding should be provided to meet the needs of infants and toddlers throughfive programs including Part H of Individuals with Disabilities Education Act (IDEA).This resolution acknowledged the critical nature of the first three years of life:“groundbreaking scientific research shows that children’s experiences during their firstthree years of life determine how the intricate circuitry of their brains are ‘wired’ and laythe foundation for their future development.”
3
This statement is indeed borne out in the research literature which shows that duringinfancy and early childhood the connections between neurons in the brain, or neuralsynapses, reach their highest density, well above that of adults, and remain at that leveluntil late childhood (Chugani et al., 1987; Huttenlocher, l990). This is a period of greatpotential, for it is sensory experience that helps determine the pattern of wiring betweenthe neurons in the brain (Greenough and Black, 1992; Weiler et al., 1995). This linkbetween brain activity and brain structure points to the importance of the critical earlyyears of life.
Child Development and Parent-Child Relationship
What the brain learns determines the individual child’s responses to the environment.The sensory experience that embodies success to an infant or toddler and lays thefoundation for future learning may be the gentle and kind touch of her mother, theextended gaze of his father, the soft, soothing voice of his caregiver, and never beingtaught to feel less than her full potential. Research studies report the long-termsignificance of the early parent-child relationship and its power to facilitate a child’ssuccessful development (Ainsworth, 1973; Bowlby, 1969; Lyons-Ruth and Zeanah, 1993;Tjossem, 1976). Feeling loved and valued and knowing that their needs matter and willbe met foster the development of trust, self-confidence, curiosity, and empathy (CarnegieTask Force on Meeting the Needs of Young Children, 1994). With this foundation, theseinfants and toddlers are then free to explore and discover. Understanding a child’sresponses and development is necessary for families to actively support the child in theseendeavors.
Part H
This concept of the critical importance of parents and other caregivers is reflected in thevision and goals of Individuals with Disabilities Education Act (IDEA), Part H. Thedelivery of family-centered early intervention services required by Part H relates to thenew direction in early intervention which focuses on enhancing the quality of earlyparent-infant interactions (Bennett and Guralnick, 1991). One of the general stateprogram goals per the national legislation for IDEA, Part H (1997) is “a family-directedassessment of the resources, priorities, and concerns of the family and the identificationof the supports and services necessary to enhance the family’s capacity to meet thedevelopmental needs of the infant or toddler.”
The general goals of Washington’s Infant Toddler Early Intervention Program (Part H)include the coordination of development and implementation of interagency andmultidisciplinary delivery of early intervention services which enhance the developmentof each infant and toddler with disabilities; provide services that the child’s familydefines according to the family’s concerns, priorities, and resources; and provide familysupport for enhancing the child’s development.
4
Family Measures of Success
Underlying the focus on a family-centered approach is the established fact that the qualityof the early parent-child relationship is related to child development and will affect childoutcomes whether they are measured at three years of age or at six years of age. Formany researchers the focus has shifted to determining what the family outcomes in earlyintervention would be from this family-centered approach. Bailey and his colleagues(1998) are among the principal investigators for the National Early InterventionLongitudinal Study (NEILS) involving twenty states. Their recent publication suggestseight questions as a framework for the assessment of family outcomes from earlyintervention. These questions focus on family perceptions of the early interventionexperience and on the impact on the family. Questions designed to assess the impact onthe family include focus on the extent to which early intervention fosters parents’:1) perceived competence as caregivers; 2) ability to work with professionals and advocatefor services (empowerment); 3) informal social and community support systems; 4)quality of life; and 5) optimism for a positive future, which Turnbull and Turnbull (1997)point out requires early interventionists’ promotion of an optimistic perspective byacknowledging positive possibilities for the toddler and encouraging “great expectations.”
Measures of success that emerged from input we received from individual parents andfamily members of children with delaying or disabling conditions were quality of parent-child interaction, information about child’s disability, a sense of hope, adequateinformation to make decisions, inclusion of parent’s perspectives of the outcomes on theIndividualized Family Service Plan (IFSP), and knowledge of specific techniques toenhance their child’s development at home.
Child Measures of Success
Traditionally, changes in cognitive development, measured by standardized tests, werebelieved to be the most important measure of success. A general decline in theintellectual development of children with established disabilities and those at risk occursin the absence of early intervention. Unequivocal evidence now exists that this declinecan be substantially reduced by interventions implemented during the first 5 years of life(Guralnick, 1998).
Outcome measures from the primary domains of cognitive, language, affective, and motordevelopment should be expanded to include measures that reflect a broader vision of thegoals of early intervention such as social competence and improvement of children’shealth status (Guralnick and Neville, 1997). Peck et al. (1993) and Billingsley et al.(1996) suggest a more global measure participation in valued roles, activities, andsettings which includes the related and more specific outcomes of memberships,relationships, and skills.
Children’s capacity for development is facilitated in the context of secure attachments;consistent, warm nurturing relationships with caregivers; stimulating environments,including a variety of developmentally appropriate toys and materials; quality socialcontact with other adults and children; a general state of health; and a safe environment
5
(Guralnick, 1998). Parents and other adult caregivers play critical roles in the child’sdevelopment during these early years (Carnegie Task Force on Meeting the Needs ofYoung Children, 1994; Shonkoff et al., 1992). Measuring success requires a frameworkwhich includes both child and family outcomes and considers the factors in theconceptual model presented on the following two pages.
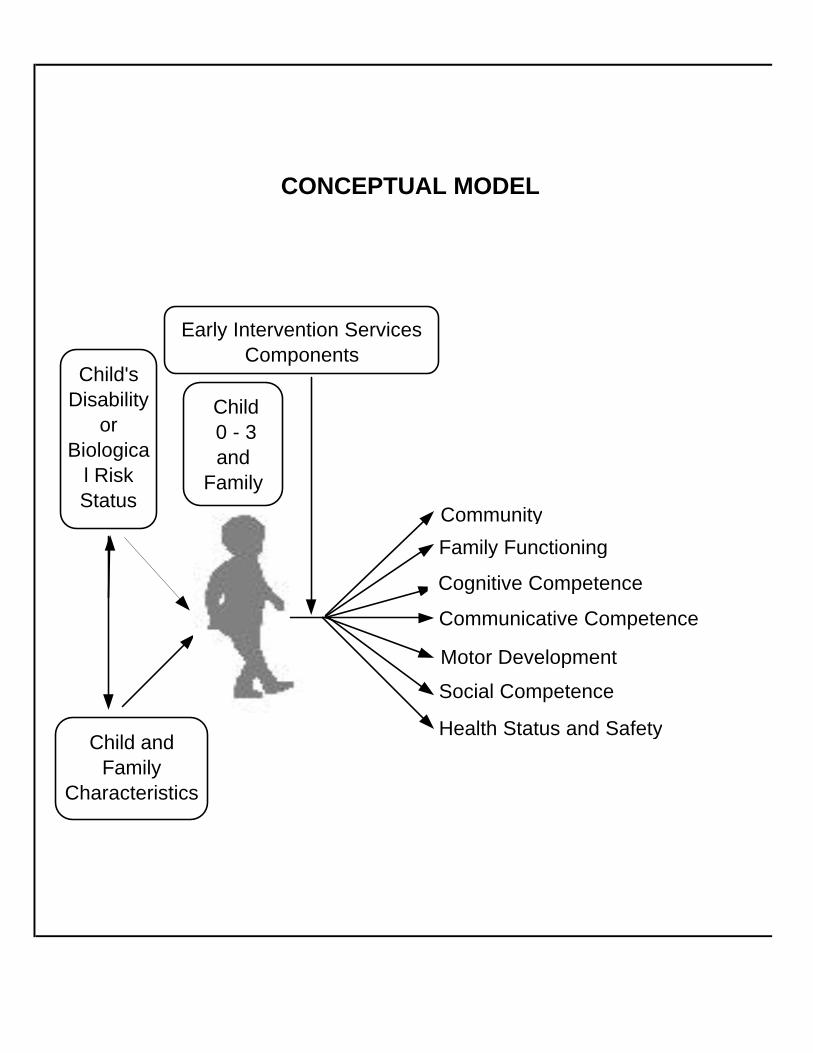
CONCEPTUAL MODEL
Child and Family
Characteristics
Early Intervention ServicesComponents
Child 0 - 3and
Family
Cognitive Competence
Communicative Competence
Social Competence
Child's Disability
or Biologica
l Risk Status
Family Functioning
Health Status and Safety
Community
Motor Development
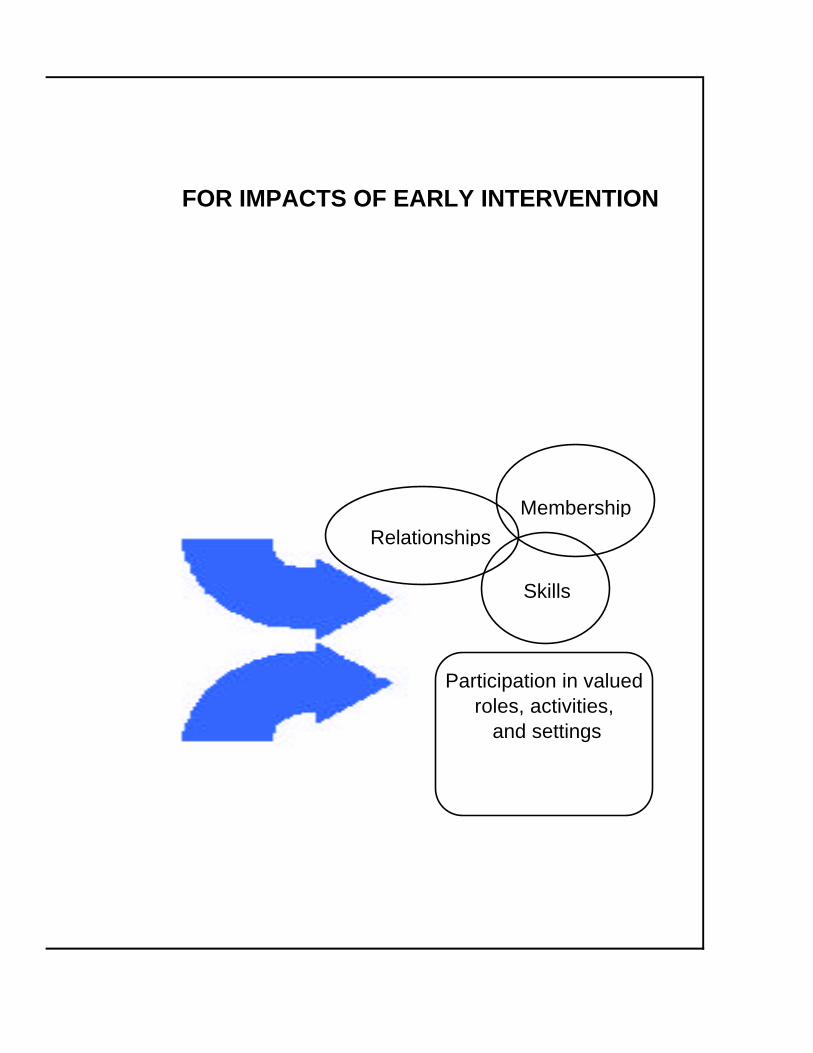
FOR IMPACTS OF EARLY INTERVENTION
RelationshipsMembership
Skills
Participation in valued roles, activities,
and settings

8
9
CHAPTER 2
METHODS
The study designs and outcome measures presented in this report were based onpreliminary background research, input from key informants, and the combined years ofresearch experience of the project team.
PRELIMINARY BACKGROUND RESEARCH
Preliminary Background Research included the literature review, local assessment anddata inventory.
Literature Review
A literature review of evaluation methods and measures in the child development/earlyintervention field was performed. This review’s intent was to help identify the questionswhich are most critical, the evaluation methods and measures which have been mostsuccessful in assessing the impact of early intervention programs, the currently preferredmethodologies in the child development/early intervention field, and major difficultieswith alternative evaluation strategies. Over 250 published papers on evaluation of earlyintervention/child development were reviewed.
The bibliography and literature summary table resulting from this literature review can befound in a separate publication, Evaluation of Early Intervention in Washington StateLiterature Summary. The bibliography notes a wide variety of articles useful inunderstanding issues of evaluation methodologies and outcomes for children withdisabilities and their families. The literature summary table includes some key sources ofinsight into current evaluation and outcome recommendations and strategies, andexamples of recent studies and those currently underway. Lists of child, family, andprogram characteristics from this literature review were made and are included inAppendix B.
The outcome, parent-child interaction, comes from a specific body of research literature.In this report the use of the word parent refers to the primary caregiver if other than theparent.
Local Assessment
The Local Assessment Survey (Appendix C) was developed to provide knowledge ofprocedures being used by communities and programs in Washington State for assessinglocal early intervention efforts. The survey was mailed to child development centers,County Interagency Coordinating Council (CICC) chairs, Infant Toddler EarlyIntervention Program (ITEIP) contractors, neurodevelopmental centers, school districts,tribal authorities, and universities requesting information on assessment, tracking, orresearch efforts being undertaken. Chapter 5 describes this process in greater detail.
10
Technical Data Inventory
A technical inventory was done to identify available statewide data which could be linkedat the individual level to study the impact of early intervention programs. Assessment ofthe feasibility of collecting this information was investigated.
INPUT FROM STAKEHOLDERS
Advisory Group
The Research and Data Analysis project team convened an Advisory Group to provideprofessional expertise in reviewing and commenting on materials prepared for thisproject, developing study designs, and assessing their feasibility. Membership in theAdvisory Group included expertise in the areas of genetics, nursing, pediatrics, preventivemedicine, research, and Special Education (please see Appendix A for biosketches onindividual Advisory Group members).
Parents
Unstructured interviews were conducted with individual parents of children withdisabling or delaying conditions, including Cassie Johnston, Parent ParticipationCoordinator for Washington State. Participation in one of the four State InteragencyCoordinating Council Conversations with Families and summative information from theother three provided another source of data.
Additional input was received from one of our Advisory Group members who is both aparent of a child who was enrolled in early intervention services and a Family ResourceCoordinator.
Service Providers
One of the data sources for the development of outcome measures and study designs wasa site visit to the Tacoma Learning Center. Research and Data Analysis staff met withMaryanne Barnes, M.Ed., executive director.
Input was additionally received from a member of the Advisory Group, Judith Moore,M.A., executive director of Boyer Children’s Clinic and former Chair of the StateInteragency Coordinating Council.
Agency Personnel
Representative input from public agencies in Washington State included members of theAdvisory Group from the Department of Health (DOH), Department of Social and HealthServices (DSHS), and the Office of Superintendent of Public Instruction (OSPI).
Background research concerning available data in Washington State included informantinterviews with potential data sources such as the Department of Health and the Office ofSuperintendent of Public Instruction.

11
THE STATE INTERAGENCY COORDINATING COUNCIL (SICC)
The State Interagency Coordinating Council (SICC) for Infants and Toddlers withDisabilities and Their Families was involved in the development of this project beginningwith the presentation of the proposal for the Child and Family Early InterventionOutcome Measures Planning Project in July 1997, received a status report in April 1998,and reviewed the draft for this report in June 1998.

12

13
CHAPTER 3
DEVELOPMENT OF FAMILY AND CHILD OUTCOMEMEASURES AT THE FEDERAL LEVEL
INTRODUCTION
This section examines steps taken by the Federal Government to develop earlyintervention outcome measures for children with disabling and delaying conditions andtheir families. The Federal Government funds both national studies, which focus onspecific outcomes developed by national committees, and state and individual researchprojects which focus on specific topics in early intervention.
The Federal Government monitors state implementation of early intervention programs.As a condition of state participation in Part H, the lead agency in each state is required tosubmit annual state data and performance reports which include information on thefollowing: the number of children served under Part H; the number of infants under oneyear served under Part H; the settings in which services are provided; funding sources;and state monitoring activities [U.S. Department of Education Program PerformancePlans (FY1999), 1998]. The Federal Government also has funded implementationresearch such as the Early Childhood Research Institute’s Service Utilization projectwhich described the services provided to infants, toddlers, and preschool children withdisabilities and their families across nine communities in three states (Colorado,Pennsylvania, and North Carolina) (Gloria Harbin, Thomas Kochanek, cover letter toreport, September 1997, Frank Porter Graham Child Development Center).
At this time, the Federal Government does not require participating Part H states toinclude child and family outcomes in their annual reports. The Government is, however,developing child and family outcome measures to include as part of a list of Part Hindicators through its national longitudinal study, National Early InterventionLongitudinal Study (NEILS) funded by the Office of Special Education Programs, U.S.Department of Education. It can also draw from results of other federally funded projectsto determine which child and family outcomes might be appropriate for monitoring longterm.
The following federally funded projects include family and child outcomes as an integralpart of their studies.
NATIONAL EARLY INTERVENTION LONGITUDINAL STUDY (NEILS)Status: In progress
General Description
The National Early Intervention Longitudinal Study (NEILS) is a five year longitudinalstudy designed to provide both descriptive and explanatory information regarding processoutcomes and family and child outcomes using the following main study questions:

14
• Who are the children and families receiving early intervention services?• What early intervention services do participating children and families receive, and
how are those services delivered?• What outcomes do participating children and families experience?• How do outcomes relate to variations in child and family characteristics and services
provided?
Data will be collected from the following sources:
NEILS: SOURCES AND TYPES OF DATA INFORMATION
DATA SOURCE DATA TYPES
Telephone interviews with families child and family characteristics
child functioning
families’ perception of services
Semi-annual reports from service providers services provided to children and families
information on children’s transitions
Survey of service providers their background
their training
ways they deliver services
Profiles of local state early interventionsystem elements
elements of delivery system
costs
Survey of teachers progress of NEILS children at age 5
services being provided at age 5
Survey of early intervention programdirectors
program description
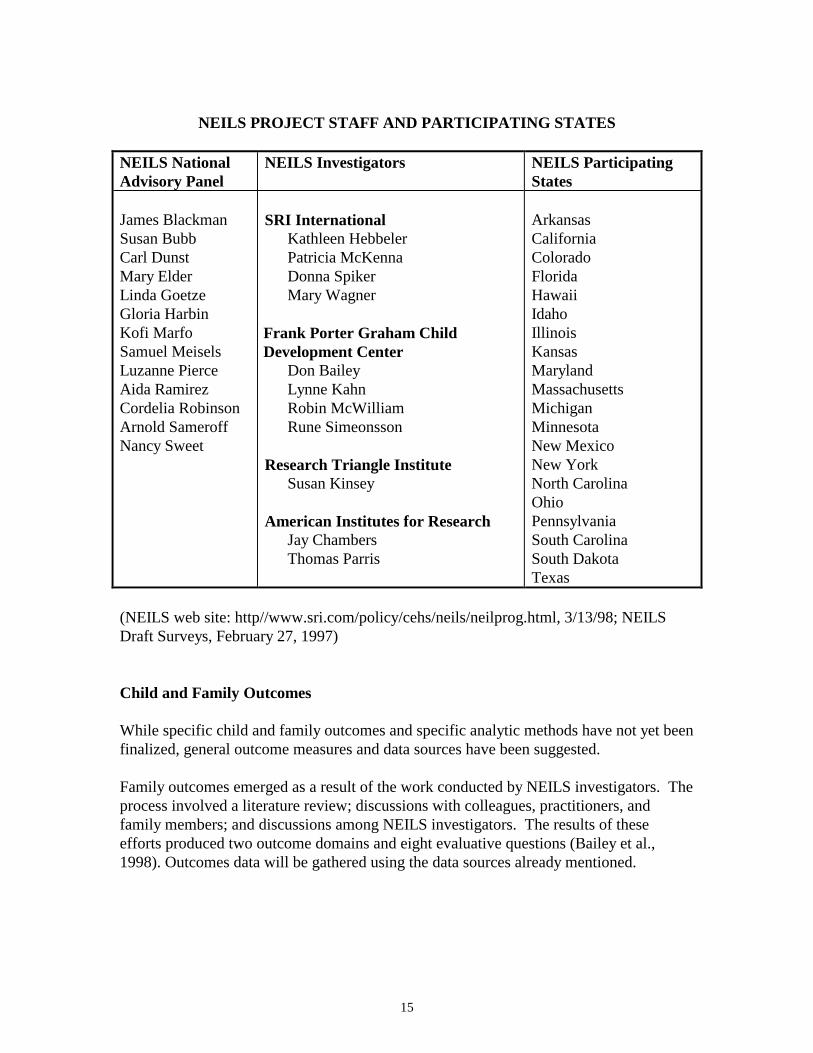
The study will include a nationally representative sample involving three to five countiesin twenty states. Approximately 3,800 children will be included. Children between birthand 31 months who are newly entering early intervention will be recruited (1997-1998).The project is being conducted by a national investigative team (Stanford ResearchInstitute International, Frank Porter Graham Child Development Center, ResearchTriangle Institute, American Institute for Research) and a national advisory panel.
15
NEILS PROJECT STAFF AND PARTICIPATING STATES
NEILS NationalAdvisory Panel
NEILS Investigators NEILS ParticipatingStates
James BlackmanSusan BubbCarl DunstMary ElderLinda GoetzeGloria HarbinKofi MarfoSamuel MeiselsLuzanne PierceAida RamirezCordelia RobinsonArnold SameroffNancy Sweet
SRI InternationalKathleen HebbelerPatricia McKennaDonna SpikerMary Wagner
Frank Porter Graham ChildDevelopment Center
Don BaileyLynne KahnRobin McWilliamRune Simeonsson
Research Triangle InstituteSusan Kinsey
American Institutes for ResearchJay ChambersThomas Parris
ArkansasCaliforniaColoradoFloridaHawaiiIdahoIllinoisKansasMarylandMassachusettsMichiganMinnesotaNew MexicoNew YorkNorth CarolinaOhioPennsylvaniaSouth CarolinaSouth DakotaTexas
(NEILS web site: http//www.sri.com/policy/cehs/neils/neilprog.html, 3/13/98; NEILSDraft Surveys, February 27, 1997)
Child and Family Outcomes
While specific child and family outcomes and specific analytic methods have not yet beenfinalized, general outcome measures and data sources have been suggested.
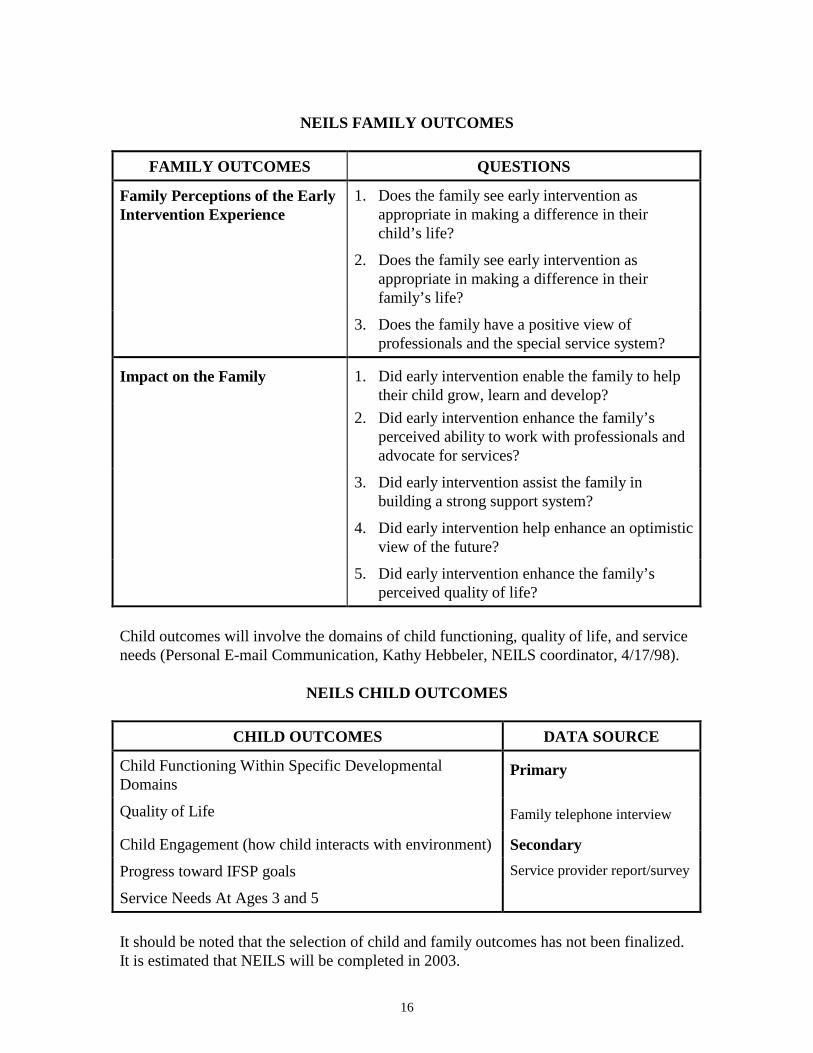
Family outcomes emerged as a result of the work conducted by NEILS investigators. Theprocess involved a literature review; discussions with colleagues, practitioners, andfamily members; and discussions among NEILS investigators. The results of theseefforts produced two outcome domains and eight evaluative questions (Bailey et al.,1998). Outcomes data will be gathered using the data sources already mentioned.
16
NEILS FAMILY OUTCOMES
FAMILY OUTCOMES QUESTIONS
Family Perceptions of the EarlyIntervention Experience
1. Does the family see early intervention asappropriate in making a difference in theirchild’s life?
2. Does the family see early intervention asappropriate in making a difference in theirfamily’s life?
3. Does the family have a positive view ofprofessionals and the special service system?
Impact on the Family 1. Did early intervention enable the family to helptheir child grow, learn and develop?
2. Did early intervention enhance the family’sperceived ability to work with professionals andadvocate for services?
3. Did early intervention assist the family inbuilding a strong support system?
4. Did early intervention help enhance an optimisticview of the future?
5. Did early intervention enhance the family’sperceived quality of life?
Child outcomes will involve the domains of child functioning, quality of life, and serviceneeds (Personal E-mail Communication, Kathy Hebbeler, NEILS coordinator, 4/17/98).
NEILS CHILD OUTCOMES
CHILD OUTCOMES DATA SOURCE
Child Functioning Within Specific DevelopmentalDomains
Primary
Quality of Life Family telephone interview
Child Engagement (how child interacts with environment) SecondaryProgress toward IFSP goals Service provider report/survey
Service Needs At Ages 3 and 5
It should be noted that the selection of child and family outcomes has not been finalized.It is estimated that NEILS will be completed in 2003.
17
EARLY CHILDHOOD RESEARCH INSTITUTE ON MEASURING GROWTHAND DEVELOPMENT (ECRI-MGD)Status: In Progress
General Description
This study is funded by Early Education Programs for Children with Disabilities at theOffice of Special Education and Rehabilitative Services (OSERS), U.S. Department ofEducation. The goal of the measurement and growth project is to produce acomprehensive, individualized measurement system for children with disabilities frombirth to eight years of age. The system will include the following: 1) indicators formonitoring progress and 2) solutions-oriented assessments to allow family and educatorsthe opportunity to optimize child development outcomes.
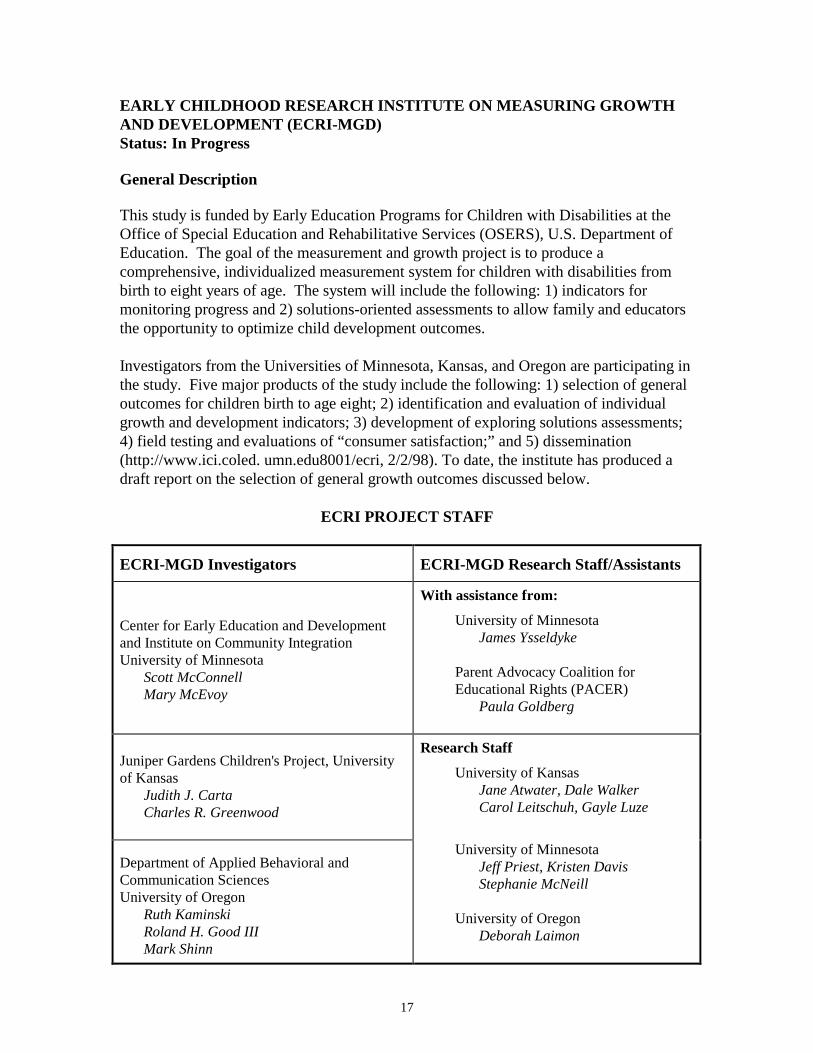
Investigators from the Universities of Minnesota, Kansas, and Oregon are participating inthe study. Five major products of the study include the following: 1) selection of generaloutcomes for children birth to age eight; 2) identification and evaluation of individualgrowth and development indicators; 3) development of exploring solutions assessments;4) field testing and evaluations of “consumer satisfaction;” and 5) dissemination(http://www.ici.coled. umn.edu8001/ecri, 2/2/98). To date, the institute has produced adraft report on the selection of general growth outcomes discussed below.
ECRI PROJECT STAFF
ECRI-MGD Investigators ECRI-MGD Research Staff/Assistants
Center for Early Education and Developmentand Institute on Community IntegrationUniversity of Minnesota
Scott McConnellMary McEvoy
With assistance from:
University of MinnesotaJames Ysseldyke
Parent Advocacy Coalition forEducational Rights (PACER)
Paula Goldberg
Juniper Gardens Children's Project, Universityof Kansas
Judith J. CartaCharles R. Greenwood
Research Staff
University of KansasJane Atwater, Dale WalkerCarol Leitschuh, Gayle Luze
Department of Applied Behavioral andCommunication SciencesUniversity of Oregon
Ruth KaminskiRoland H. Good IIIMark Shinn
University of MinnesotaJeff Priest, Kristen DavisStephanie McNeill
University of OregonDeborah Laimon
18
Child and Family Outcomes
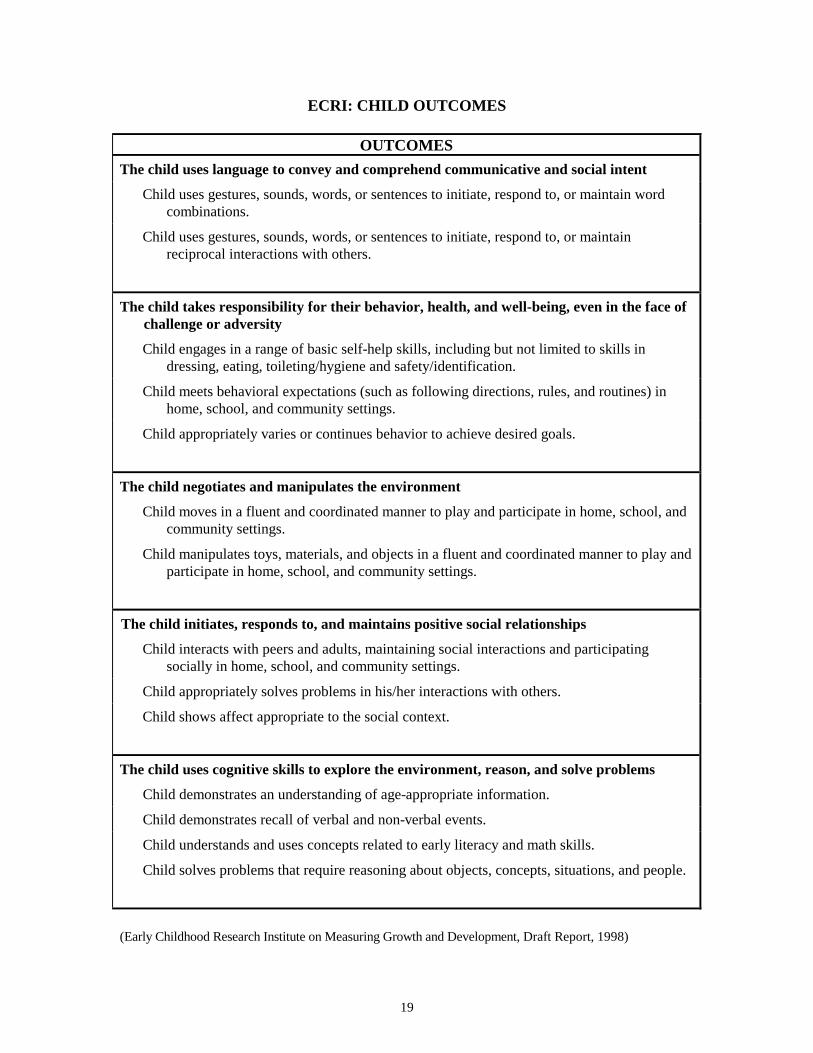
The focus of ECRI’s first technical report is the selection of outcomes for children withdisabilities from birth to eight. Family outcomes are beyond the purview of this technicalreport. Investigators approached the selection of child outcomes by seeking to validateoutcomes after a “comprehensive review and synthesis of existing outcome statements”(Early Childhood Research Institute on Measuring Growth and Development, Draft Report,1998). While the aim of the research team was to produce general outcomes for the agegroup of birth to eight years, they divided this age group into three subgroups: birth totwo, three to five, and five to eight years. After developing specific outcome lists foreach age group, these lists were then cross-referenced to produce a list of commonoutcomes for children aged birth to eight.
The research team formulated outcomes within the parameters of the social contextwithin which they would be evaluated. These parameters included two main elements: 1)“the impact of outcomes on understanding and enhancing the development trajectories ofyoung children with and without disabilities;” and 2) “how early childhood constituencieswould perceive the appropriateness and usefulness of these outcomes” (Early ChildhoodResearch Institute on Measuring Growth and Development, Draft Report, 1998). Theinvestigators especially kept in mind the fact that “the future use of the general growthoutcomes would hinge greatly on acceptance by families, teachers, administrators, andother individuals involved in early childhood education” (Early Childhood ResearchInstitute on Measuring Growth and Development, Draft Report, 1998). The research teamplans to submit the outcomes to early childhood constituencies for review.
(see ECRI Outcomes Table, Next Page)
The research team is in the process of testing various indicators and measuring processesfor the above outcomes using a series of formative pilot studies employing different datacollection formats such as naming pictures, playing with a peer, telling a story, as well asdifferent scoring techniques. Investigators “expect to continue evaluating promisingindicators empirically over the next two years, at least” (Personal E-mail Communication,Jeff Priest, ECRI research staff, 4/3/98).
The general aim of the project is to produce a set of outcomes for children and familieswith delaying or disabling conditions that can be monitored over time (specifically birthto age eight) and measured reliably. If the project is successful, it will address two of themost pressing problems in early childhood education research—measurement reliabilityand comprehensive outcomes conducive to longitudinal monitoring.
19
ECRI: CHILD OUTCOMES
OUTCOMESThe child uses language to convey and comprehend communicative and social intent
Child uses gestures, sounds, words, or sentences to initiate, respond to, or maintain wordcombinations.
Child uses gestures, sounds, words, or sentences to initiate, respond to, or maintainreciprocal interactions with others.
The child takes responsibility for their behavior, health, and well-being, even in the face ofchallenge or adversity
Child engages in a range of basic self-help skills, including but not limited to skills indressing, eating, toileting/hygiene and safety/identification.
Child meets behavioral expectations (such as following directions, rules, and routines) inhome, school, and community settings.
Child appropriately varies or continues behavior to achieve desired goals.
The child negotiates and manipulates the environment
Child moves in a fluent and coordinated manner to play and participate in home, school, andcommunity settings.
Child manipulates toys, materials, and objects in a fluent and coordinated manner to play andparticipate in home, school, and community settings.
The child initiates, responds to, and maintains positive social relationships
Child interacts with peers and adults, maintaining social interactions and participatingsocially in home, school, and community settings.
Child appropriately solves problems in his/her interactions with others.
Child shows affect appropriate to the social context.
The child uses cognitive skills to explore the environment, reason, and solve problems
Child demonstrates an understanding of age-appropriate information.
Child demonstrates recall of verbal and non-verbal events.
Child understands and uses concepts related to early literacy and math skills.
Child solves problems that require reasoning about objects, concepts, situations, and people.
(Early Childhood Research Institute on Measuring Growth and Development, Draft Report, 1998)
20
CONSORTIUMS
Several federal projects have involved the compilation of results from individual stateefforts to develop family and child outcome measures for children with disabling ordelaying conditions. Two such consortiums will be discussed in this section. By WhatOutcomes Should Part H Be Evaluated at the State Level? is the result of the gathering ofstate Part H program evaluators invited by the Subcommittee on Service Integration andContinuity of Services of the Federal Interagency Coordinating Council to address theabove question. Longitudinal Studies of the Effects of Alternative Types of EarlyIntervention for Children with Disabilities: Follow-Up Institute is the final reportproduced by the Early Intervention Research Institute (EIRI) regarding a federally-sponsored longitudinal project that took place from 1990-1995. Summary results will bepresented, and individual state projects will be discussed in Chapter 4 (Development ofFamily and Child Outcomes at the State Level).
By What Outcomes Should Part H Be Evaluated at the State Level?May, 1997
General Description
The consortium focused on six main issues regarding the evaluation of Part H at the statelevel. These topics include the following: 1) service integration; 2) eligibility; 3) fundingmodels and coordinating payment; 4) cost-effectiveness; 5) outcomes; and 6) measures.Since the focus of this chapter is on child and family outcomes, discussion will berestricted to the results regarding outcomes and measures.
Ten states participated in the conference. The production of the final report was fundedby the Maternal and Child Health Bureau, Health Resources and Services Administration,Department of Health and Human Services and written at the Early Intervention ResearchInstitute at Utah State University. Participants were invited to two meetings inWashington D.C. (August and November 1996) by the Federal Interagency CoordinatingCouncil to discuss the results of Part H evaluation efforts by individual states. Most ofthe individual projects were funded by state legislatures or Part H programs. As a result,some states emphasized implementation or funding issues more than child and familyoutcomes, depending on the interests and requirements of the funding agency. Throughdiscussions of participants, however, focus questions involving all of the six areasemerged as well as general recommendations.
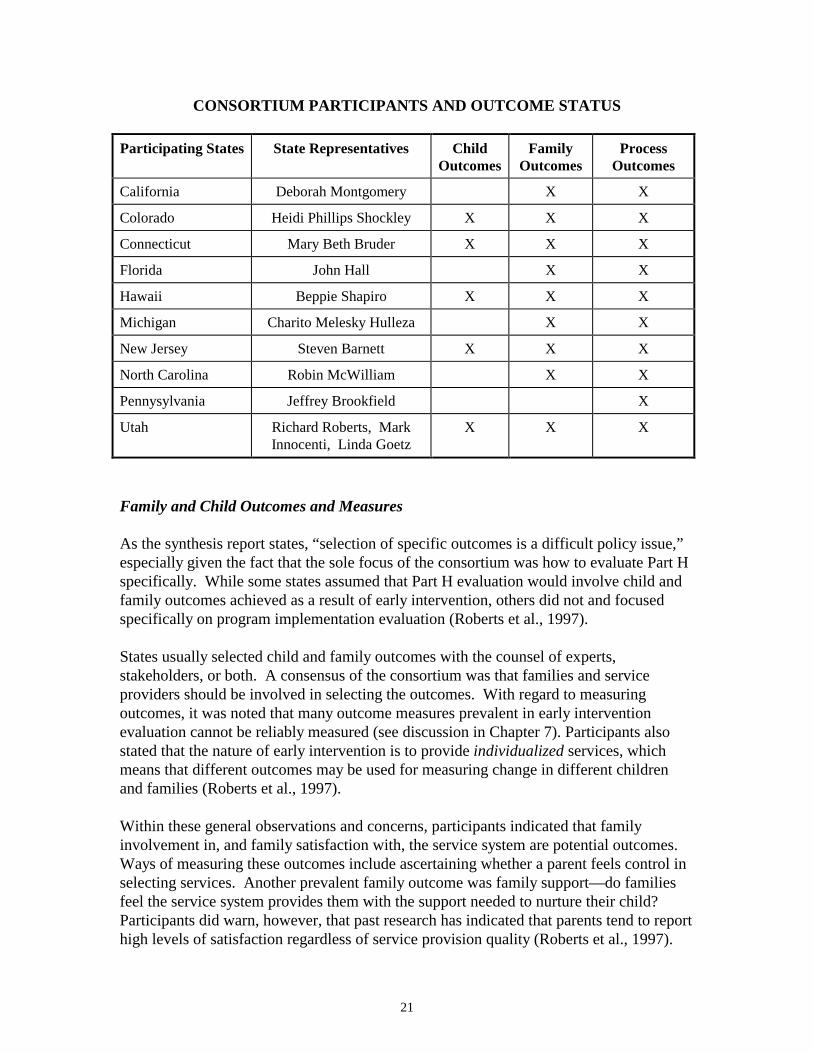
21
CONSORTIUM PARTICIPANTS AND OUTCOME STATUS
Participating States State Representatives ChildOutcomes
FamilyOutcomes
ProcessOutcomes
California Deborah Montgomery X X
Colorado Heidi Phillips Shockley X X X
Connecticut Mary Beth Bruder X X X
Florida John Hall X X
Hawaii Beppie Shapiro X X X
Michigan Charito Melesky Hulleza X X
New Jersey Steven Barnett X X X
North Carolina Robin McWilliam X X
Pennysylvania Jeffrey Brookfield X
Utah Richard Roberts, MarkInnocenti, Linda Goetz
X X X
Family and Child Outcomes and Measures
As the synthesis report states, “selection of specific outcomes is a difficult policy issue,”especially given the fact that the sole focus of the consortium was how to evaluate Part Hspecifically. While some states assumed that Part H evaluation would involve child andfamily outcomes achieved as a result of early intervention, others did not and focusedspecifically on program implementation evaluation (Roberts et al., 1997).
States usually selected child and family outcomes with the counsel of experts,stakeholders, or both. A consensus of the consortium was that families and serviceproviders should be involved in selecting the outcomes. With regard to measuringoutcomes, it was noted that many outcome measures prevalent in early interventionevaluation cannot be reliably measured (see discussion in Chapter 7). Participants alsostated that the nature of early intervention is to provide individualized services, whichmeans that different outcomes may be used for measuring change in different childrenand families (Roberts et al., 1997).
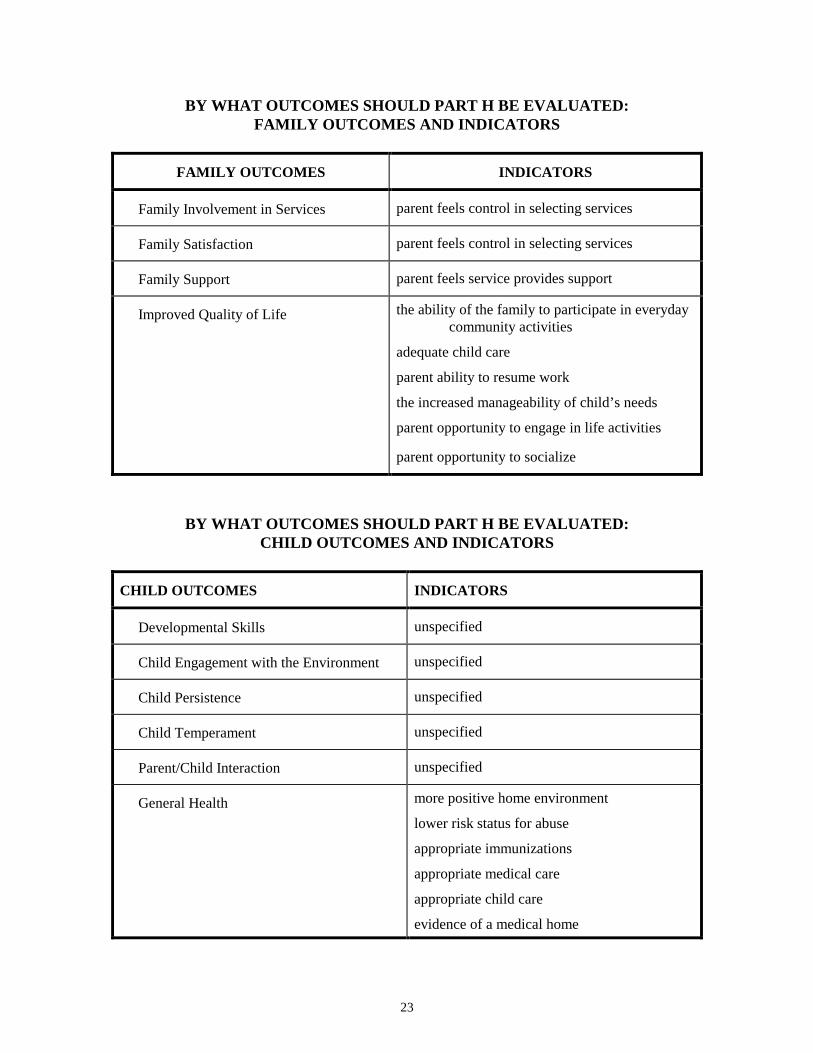
Within these general observations and concerns, participants indicated that familyinvolvement in, and family satisfaction with, the service system are potential outcomes.Ways of measuring these outcomes include ascertaining whether a parent feels control inselecting services. Another prevalent family outcome was family support—do familiesfeel the service system provides them with the support needed to nurture their child?Participants did warn, however, that past research has indicated that parents tend to reporthigh levels of satisfaction regardless of service provision quality (Roberts et al., 1997).

22
Other recommendations focused on a family’s sense of improved quality of life as afunction of receiving services. While quality of life is difficult to measure, participantssuggested the following indicators: the ability of the family to participate in everydaycommunity activities; adequate child care; parent ability to resume work; the increasedmanageability of child’s needs; parent opportunity to engage in life activities; and parentopportunity to socialize (Roberts et al., 1997).
With regard to child outcomes, the consensus was that “developmental outcomes areimportant and Part H participation should afford positive effects in this domain.” While aclear consensus did not arise, several general suggestions in this area were made.Participants felt that specific developmental outcomes should be measured, as well asother possibilities such as child engagement with the environment, child persistence, andchild temperament. Participants also suggested parent-child interaction and generalhealth outcomes such as a more positive home environment, lower risk status for abuse,appropriate immunizations, appropriate medical care, appropriate child care, andevidence of a medical home (Roberts et al., 1997).
Participants emphasized that a major factor in actually conducting studies which measurethe above outcomes was cost:
Most of the currently-funded evaluations use a mixed methodology that includeinterviews, questionnaires, and record reviews. Very few of the studies areconducting direct assessments of children and families and the directmeasurement of program activities. The reasons these methods are not being usedin more states are that direct assessment techniques are more expensive toimplement (Roberts et al., 1997).
MOST FREQUENTLY USED DATASOURCES
• interviews
• questionnaires
• record reviews
23
BY WHAT OUTCOMES SHOULD PART H BE EVALUATED:FAMILY OUTCOMES AND INDICATORS
FAMILY OUTCOMES INDICATORS
Family Involvement in Services parent feels control in selecting services
Family Satisfaction parent feels control in selecting services
Family Support parent feels service provides support
Improved Quality of Life the ability of the family to participate in everydaycommunity activities
adequate child care
parent ability to resume work
the increased manageability of child’s needs
parent opportunity to engage in life activities
parent opportunity to socialize
BY WHAT OUTCOMES SHOULD PART H BE EVALUATED:CHILD OUTCOMES AND INDICATORS
CHILD OUTCOMES INDICATORS
Developmental Skills unspecified
Child Engagement with the Environment unspecified
Child Persistence unspecified
Child Temperament unspecified
Parent/Child Interaction unspecified
General Health more positive home environment
lower risk status for abuse
appropriate immunizations
appropriate medical care
appropriate child care
evidence of a medical home

24
Some general concerns expressed regarding data collection methods mentioned in thetable were: Likert scales of satisfaction are inadequate in examining satisfaction; there areissues with report reliability from parents/providers; pre-existing state data bases are oftennot consistent year-to-year and merit caution; and questionnaires whose distribution reliedon community service providers were often given only to those favorably disposed to thatservice provider (Roberts et al., 1997).
General conclusions regarding outcomes and measures were as follows:• Few outcome measures have been developed to the point where they could be
used to assess the results of a comprehensive, coordinated system of services forfamilies.
• Discovery of such outcomes is just beginning.• Most current evaluation relies on implementation assessment.• To what degree emphasis should be placed on particular development outcomes
as opposed to well being, inclusion, and social adaptation is heavily debated.• Measurement issues are very problematic so multiple measures should be used
(Roberts et al., 1997).
EARLY INTERVENTION RESEARCH INSTITUTE (EIRI)1986-1995
General Description
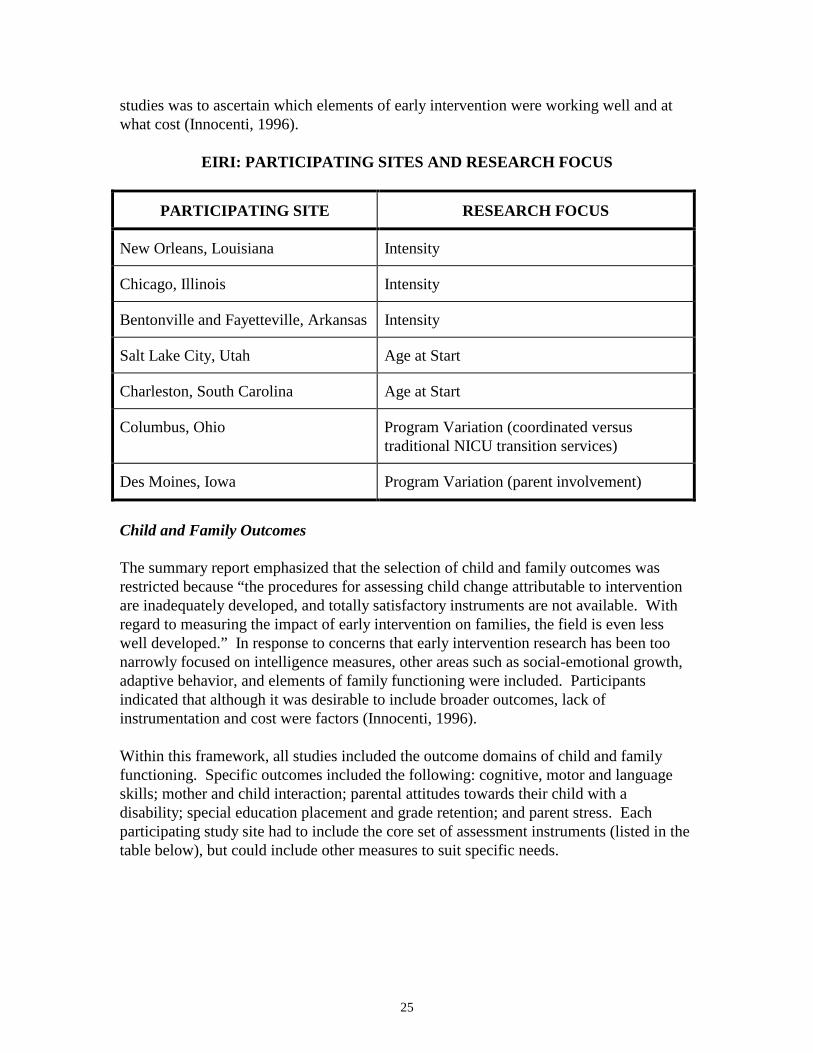
The Longitudinal Studies of the Effects of Alternative Types of Early Intervention forChildren with Disabilities is a synthesis report of a series of longitudinal studies whichtook place from 1986-1995. The original project began enrolling subjects in sixteendifferent studies in October 1986. These sixteen studies collected data until the fall of1990. Nine of the original sixteen studies conducted follow-up research from 1990-1995.This report summarizes findings for the nine studies followed longitudinally and includesdata for the entire span of the projects, 1986-1995 (Innocenti, 1996). Only seven of thesestudies have been included in this discussion as two of the studies applied to preschoolchildren rather than those aged birth to three.
The studies were funded by the U.S. Department of Education in order to evaluate theeffects and costs of alternative types of early intervention programs for children withdisabilities. The Department of Education sought to address three factors and concerns ofthe time (1985): 1) the limited high quality early intervention research for children withdisabilities; 2) pressures to expand early intervention programs for children withdisabilities; and 3) the almost total absence of efficacy research which included a cost-benefit analysis. As a result it was required that each study 1) be a true experiment(randomized controlled trial) in which two alternative types of intervention werecompared; 2) consider the effects of the intervention on both children and families; 3)analyze the cost of the alternative types of intervention in conjunction with the effects;and 4) be carried out in field-based settings which were representative of the state-of-the-art early intervention programs. The three elements of early intervention to be examinedwere intensity, age at start of intervention, and program variation. The general aim of the
25
studies was to ascertain which elements of early intervention were working well and atwhat cost (Innocenti, 1996).
EIRI: PARTICIPATING SITES AND RESEARCH FOCUS
PARTICIPATING SITE RESEARCH FOCUS
New Orleans, Louisiana Intensity
Chicago, Illinois Intensity
Bentonville and Fayetteville, Arkansas Intensity
Salt Lake City, Utah Age at Start
Charleston, South Carolina Age at Start
Columbus, Ohio Program Variation (coordinated versustraditional NICU transition services)
Des Moines, Iowa Program Variation (parent involvement)
Child and Family Outcomes
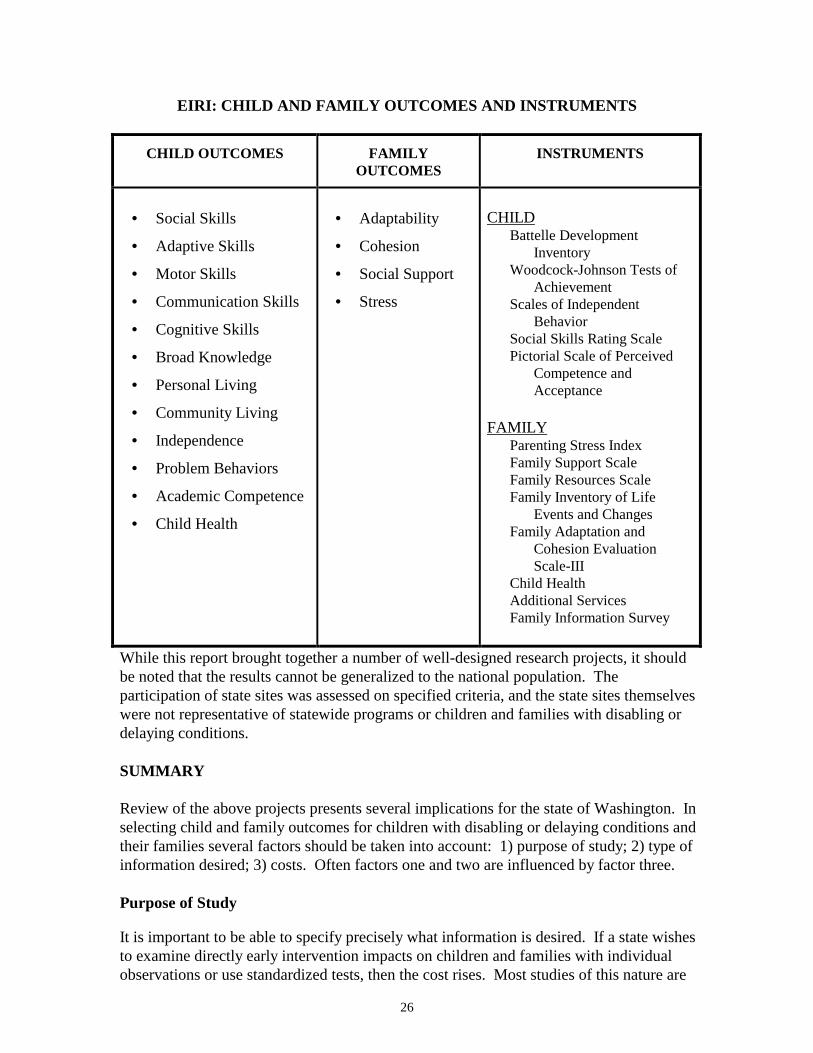
The summary report emphasized that the selection of child and family outcomes wasrestricted because “the procedures for assessing child change attributable to interventionare inadequately developed, and totally satisfactory instruments are not available. Withregard to measuring the impact of early intervention on families, the field is even lesswell developed.” In response to concerns that early intervention research has been toonarrowly focused on intelligence measures, other areas such as social-emotional growth,adaptive behavior, and elements of family functioning were included. Participantsindicated that although it was desirable to include broader outcomes, lack ofinstrumentation and cost were factors (Innocenti, 1996).
Within this framework, all studies included the outcome domains of child and familyfunctioning. Specific outcomes included the following: cognitive, motor and languageskills; mother and child interaction; parental attitudes towards their child with adisability; special education placement and grade retention; and parent stress. Eachparticipating study site had to include the core set of assessment instruments (listed in thetable below), but could include other measures to suit specific needs.
26
EIRI: CHILD AND FAMILY OUTCOMES AND INSTRUMENTS
CHILD OUTCOMES FAMILYOUTCOMES
INSTRUMENTS
• Social Skills
• Adaptive Skills
• Motor Skills
• Communication Skills
• Cognitive Skills
• Broad Knowledge
• Personal Living
• Community Living
• Independence
• Problem Behaviors
• Academic Competence
• Child Health
• Adaptability
• Cohesion
• Social Support
• Stress
CHILDBattelle Development
InventoryWoodcock-Johnson Tests of
AchievementScales of Independent
BehaviorSocial Skills Rating ScalePictorial Scale of Perceived
Competence andAcceptance
FAMILYParenting Stress IndexFamily Support ScaleFamily Resources ScaleFamily Inventory of Life
Events and ChangesFamily Adaptation and
Cohesion EvaluationScale-III
Child HealthAdditional ServicesFamily Information Survey
While this report brought together a number of well-designed research projects, it shouldbe noted that the results cannot be generalized to the national population. Theparticipation of state sites was assessed on specified criteria, and the state sites themselveswere not representative of statewide programs or children and families with disabling ordelaying conditions.
SUMMARY
Review of the above projects presents several implications for the state of Washington. Inselecting child and family outcomes for children with disabling or delaying conditions andtheir families several factors should be taken into account: 1) purpose of study; 2) type ofinformation desired; 3) costs. Often factors one and two are influenced by factor three.
Purpose of Study
It is important to be able to specify precisely what information is desired. If a state wishesto examine directly early intervention impacts on children and families with individualobservations or use standardized tests, then the cost rises. Most studies of this nature are
27
conducted by universities with federal grant money on samples of children with specificparticipation criteria. If the purpose of the study is changed to examining the perception ofvarious participants regarding early intervention rather than attempting to directly measureoutcomes, a state could use non-standardized instruments such as surveys. Given themeasurement difficulties, inadequacies of standardized tests for the disabled and delayedcondition population, the difficulty of selecting pertinent outcomes, and the costs, manystates have chosen evaluation studies that do not assess directly child and family outcomes.While much state research activity does attempt to assess directly family and childoutcomes, the purpose of such studies is usually not to assess early intervention broadly, butto examine a population affected by a specific condition (such as autism) or interventionfeature (such as intensity).
Type of Information
If the type of information desired is to be obtained by non-standardized methods,outcomes should be stated to reflect the methodology. For instance, in the National EarlyIntervention Longitudinal Study (NEILS), where outcomes will be assessed primarily bysurveys and interviews, outcomes were worded to reflect a subjective approach. Forexample, the outcome was stated, Did early intervention enhance the family’s perceivedquality of life? Rather than the more direct, Did early intervention enhance the family’squality of life?
If the study chooses standardized tests, gains in standardization may be diminished bylack of instrument sensitivity. As was mentioned in the Early Intervention ResearchInstitute (EIRI) study, researchers were frustrated that many outcomes of interest, such aschild-parent interaction and social skills, had few reliable instruments (especially for thedisabled and delayed condition population). Scientific studies have often relied onmeasures of intelligence simply because the instruments are, for the most part, reliable.Researchers question, however, whether a small gain in IQ is as important an outcome asbroader social ones, like, “the child is able to play appropriately with others.”
The Early Childhood Research Institute on Measuring Growth and Development Study(ECRI-MGD) offers promise in regard to this dilemma. The selection of child outcomesacceptable to early intervention stakeholders that can be traced from birth to eight yearsand incorporate both technical skills and social ones is an encouraging development. Theissue yet to be addressed is whether reliable objective measurement instruments can bedeveloped for the outcomes. Individual national groups are also making efforts in thisarea. The American Speech-Language Association, for instance, is working on a NationalOutcomes Measurement System (NOMS) for speech-language pathology and audiology.The system is designed to develop a national outcomes database to demonstrate the valueof speech-language pathology and audiology services. NOMS includes four components,each targeted to specific populations: birth to kindergarten; school-aged in education;school-aged in health care settings; and adults (Moore, 1998).
28
Costs
As described above in the review of the consortium on state efforts to evaluate Part H,most projects relied on information collected via surveys, record reviews, orquestionnaires. Participants expressed that standardized tests are expensive, notstandardized to children with disabling or delaying conditions, and in some cases notreliable measures of the outcome at hand, especially outcomes other than childintelligence. Non-standardized instruments can also be tailored to suit individualprograms and information requirements. Such measures, however, have not beenvalidated as extensively as many standardized tests and offer little objective assessmentof family and child outcomes.
Another element of cost to consider is the number of study subjects needed in order togain statistically significant results that can be generalized to the state population (ofchildren with disabling or delaying conditions and their families). Usually these numbersare quite large, which increase research costs. As a result, often objective evaluation offamily and child outcomes involves a smaller sample population that cannot be used togeneralize the results statewide, but can draw some conclusions about early interventionfor a specific population (e.g. autistic children) or program element (e.g. intensity).
Decision makers in Washington State, as other states, should take into consideration thesefactors when deliberating which type of study to conduct.
29
CHAPTER 4
DEVELOPMENT OF FAMILY AND CHILD OUTCOMEMEASURES AT THE STATE LEVEL
INTRODUCTION
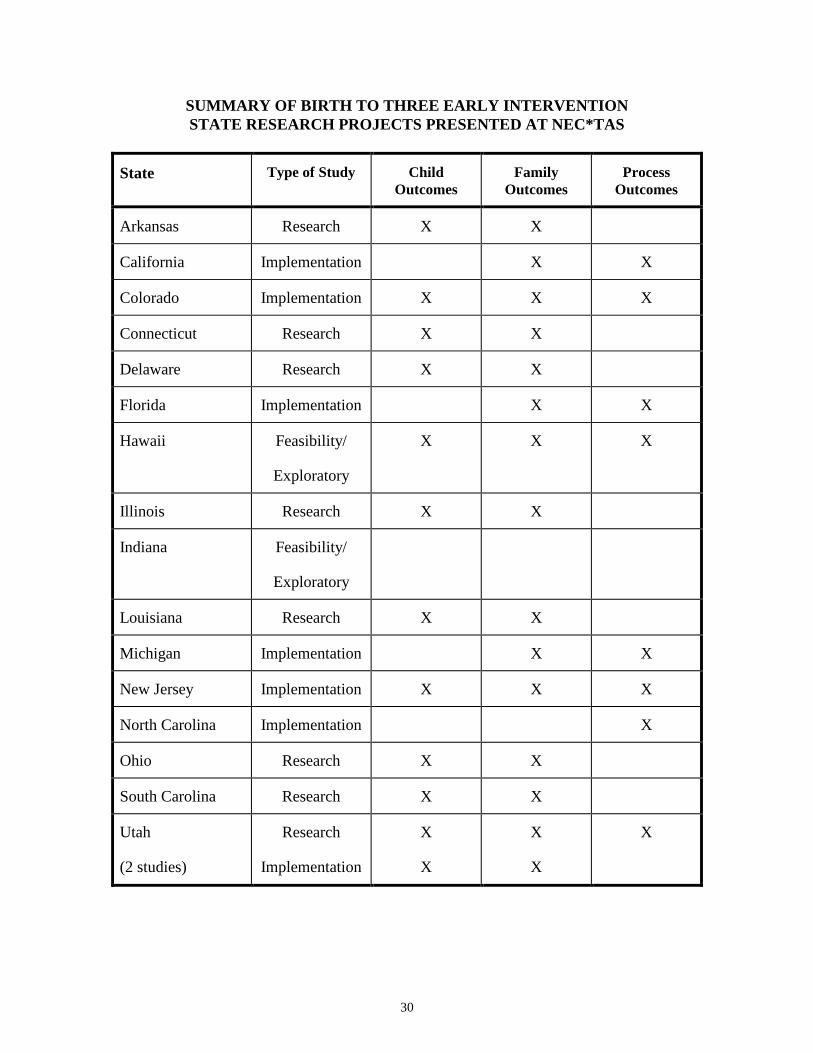
State activity takes place on several levels. Some state studies focus on Part Himplementation; some focus on child/family outcomes research which sample from adefined locale within the state; and others examine study feasibility issues. Studies areusually conducted by state agencies, universities, independent research organizations, orprograms themselves. This section describes various state research efforts which werepresented at the National Early Childhood Technical Assistance System (NEC*TAS)Conference in 1997, at the Part H Consortium, or were part of the Early InterventionResearch Institute study (see Chapter 3, Development of Family and Child OutcomeMeasures at the Federal Level, for descriptions). Only those directly relevant to child andfamily outcomes will be discussed in detail.
The following table summarizes the activity of those states which presented at theNEC*TAS conference. The three categories of study types are implementation, research,feasibility/exploratory. Implementation studies assess Part H and Part H programs. Allinclude process outcomes, most include family outcomes, and some include childoutcomes. Research studies assess the impact of a particular aspect of early intervention(such as program intensity) by examining selected child and family outcomes.Feasibility/Exploratory studies focus on investigating assessment options and gatheringprogram information and participant input.
30
SUMMARY OF BIRTH TO THREE EARLY INTERVENTIONSTATE RESEARCH PROJECTS PRESENTED AT NEC*TAS
State Type of Study ChildOutcomes
FamilyOutcomes
ProcessOutcomes
Arkansas Research X X
California Implementation X X
Colorado Implementation X X X
Connecticut Research X X
Delaware Research X X
Florida Implementation X X
Hawaii Feasibility/
Exploratory
X X X
Illinois Research X X
Indiana Feasibility/
Exploratory
Louisiana Research X X
Michigan Implementation X X
New Jersey Implementation X X X
North Carolina Implementation X
Ohio Research X X
South Carolina Research X X
Utah
(2 studies)
Research
Implementation
X
X
X
X
X
31
IMPLEMENTATION STUDIES
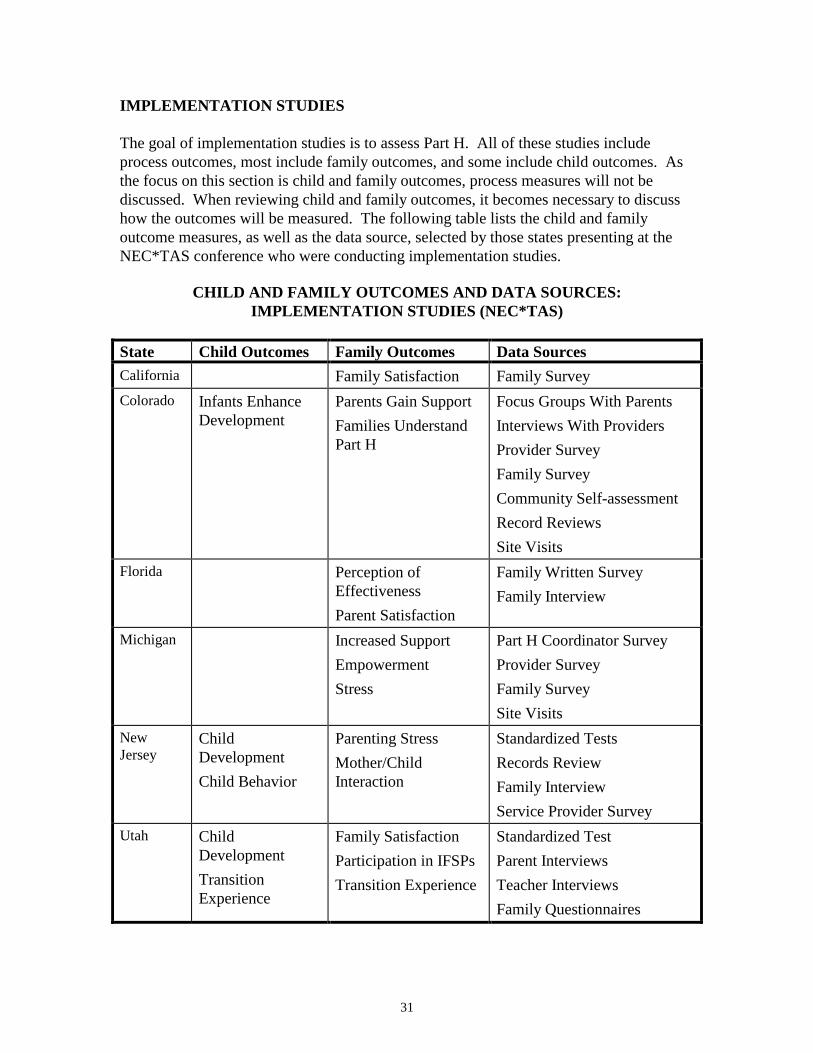
The goal of implementation studies is to assess Part H. All of these studies includeprocess outcomes, most include family outcomes, and some include child outcomes. Asthe focus on this section is child and family outcomes, process measures will not bediscussed. When reviewing child and family outcomes, it becomes necessary to discusshow the outcomes will be measured. The following table lists the child and familyoutcome measures, as well as the data source, selected by those states presenting at theNEC*TAS conference who were conducting implementation studies.
CHILD AND FAMILY OUTCOMES AND DATA SOURCES:IMPLEMENTATION STUDIES (NEC*TAS)
State Child Outcomes Family Outcomes Data SourcesCalifornia Family Satisfaction Family SurveyColorado Infants Enhance
DevelopmentParents Gain SupportFamilies UnderstandPart H
Focus Groups With ParentsInterviews With ProvidersProvider SurveyFamily SurveyCommunity Self-assessmentRecord ReviewsSite Visits
Florida Perception ofEffectivenessParent Satisfaction
Family Written SurveyFamily Interview
Michigan Increased SupportEmpowermentStress
Part H Coordinator SurveyProvider SurveyFamily SurveySite Visits
NewJersey
ChildDevelopmentChild Behavior
Parenting StressMother/ChildInteraction
Standardized TestsRecords ReviewFamily InterviewService Provider Survey
Utah ChildDevelopmentTransitionExperience
Family SatisfactionParticipation in IFSPsTransition Experience
Standardized TestParent InterviewsTeacher InterviewsFamily Questionnaires
32
The most common child outcome selected was child development. In the family outcomedomain, parent satisfaction, support and empowerment outcomes were most frequent.Methods of data collection relied heavily on surveys and interviews. Standardized testswere used to measure general child development.
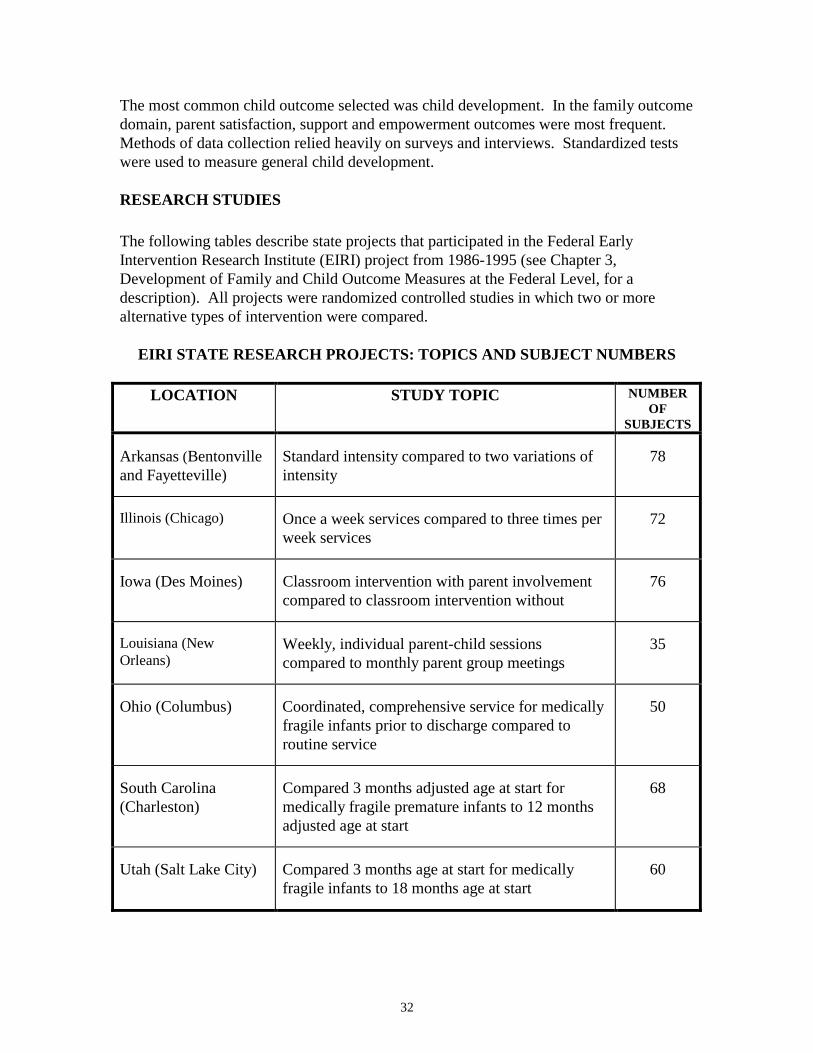
RESEARCH STUDIES
The following tables describe state projects that participated in the Federal EarlyIntervention Research Institute (EIRI) project from 1986-1995 (see Chapter 3,Development of Family and Child Outcome Measures at the Federal Level, for adescription). All projects were randomized controlled studies in which two or morealternative types of intervention were compared.
EIRI STATE RESEARCH PROJECTS: TOPICS AND SUBJECT NUMBERS
LOCATION STUDY TOPIC NUMBEROF
SUBJECTS
Arkansas (Bentonvilleand Fayetteville)
Standard intensity compared to two variations ofintensity
78
Illinois (Chicago) Once a week services compared to three times perweek services
72
Iowa (Des Moines) Classroom intervention with parent involvementcompared to classroom intervention without
76
Louisiana (NewOrleans)
Weekly, individual parent-child sessionscompared to monthly parent group meetings
35
Ohio (Columbus) Coordinated, comprehensive service for medicallyfragile infants prior to discharge compared toroutine service
50
South Carolina(Charleston)
Compared 3 months adjusted age at start formedically fragile premature infants to 12 monthsadjusted age at start
68
Utah (Salt Lake City) Compared 3 months age at start for medicallyfragile infants to 18 months age at start
60
33
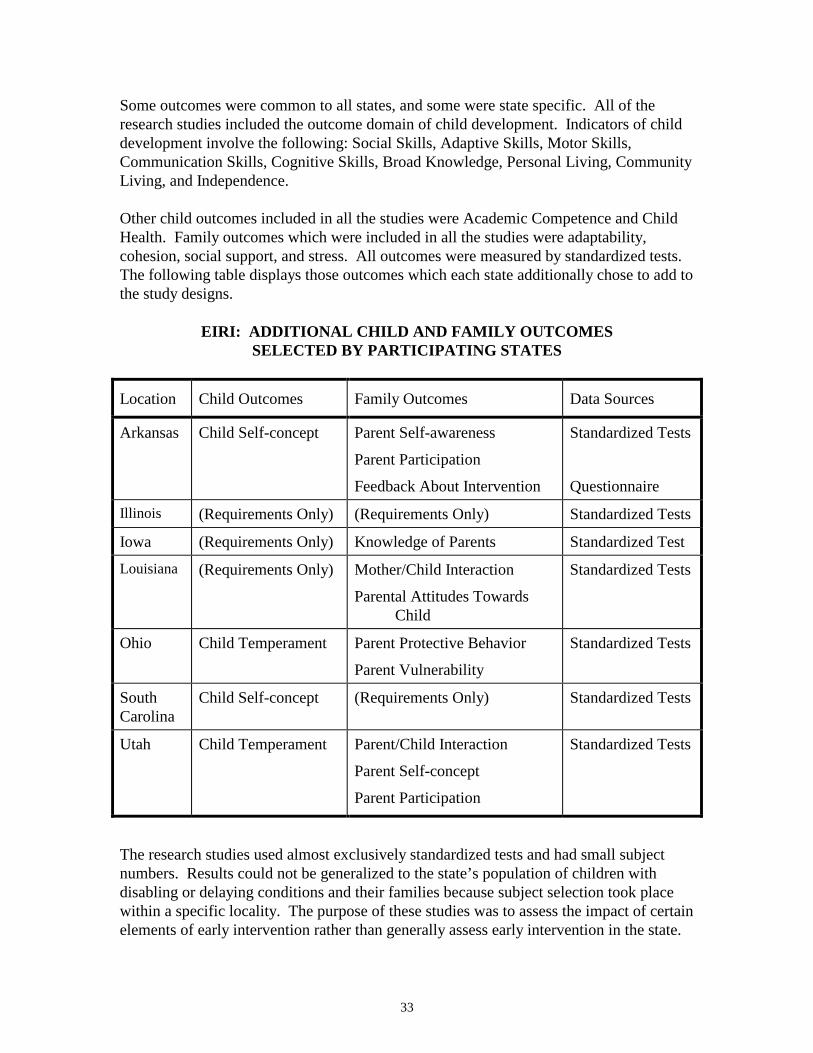
Some outcomes were common to all states, and some were state specific. All of theresearch studies included the outcome domain of child development. Indicators of childdevelopment involve the following: Social Skills, Adaptive Skills, Motor Skills,Communication Skills, Cognitive Skills, Broad Knowledge, Personal Living, CommunityLiving, and Independence.
Other child outcomes included in all the studies were Academic Competence and ChildHealth. Family outcomes which were included in all the studies were adaptability,cohesion, social support, and stress. All outcomes were measured by standardized tests.The following table displays those outcomes which each state additionally chose to add tothe study designs.
EIRI: ADDITIONAL CHILD AND FAMILY OUTCOMESSELECTED BY PARTICIPATING STATES
Location Child Outcomes Family Outcomes Data Sources
Arkansas Child Self-concept Parent Self-awareness
Parent Participation
Feedback About Intervention
Standardized Tests
Questionnaire
Illinois (Requirements Only) (Requirements Only) Standardized Tests
Iowa (Requirements Only) Knowledge of Parents Standardized Test
Louisiana (Requirements Only) Mother/Child Interaction
Parental Attitudes TowardsChild
Standardized Tests
Ohio Child Temperament Parent Protective Behavior
Parent Vulnerability
Standardized Tests
SouthCarolina
Child Self-concept (Requirements Only) Standardized Tests
Utah Child Temperament Parent/Child Interaction
Parent Self-concept
Parent Participation
Standardized Tests
The research studies used almost exclusively standardized tests and had small subjectnumbers. Results could not be generalized to the state’s population of children withdisabling or delaying conditions and their families because subject selection took placewithin a specific locality. The purpose of these studies was to assess the impact of certainelements of early intervention rather than generally assess early intervention in the state.
34
FEASIBILITY/EXPLORATORY STUDIES
Some states have chosen to conduct feasibility studies which assess methods forevaluating early intervention. As with other types of studies, feasibility projects can beeither narrowly focused (e.g. How do we evaluate Part H implementation?) or morebroadly construed (How do we evaluate early intervention services?). Exploratory studiesoften seek to gain understanding of program operations, ascertain perceptions of earlyintervention participants, or identify strengths and needs. The following is a descriptionof each type of study conducted by two states participating in the NEC*TAS conference.
Feasibility—Hawaii
The University of Hawaii received funds from the Office of Special Education Programs,U.S. Department of Education to conduct two feasibility studies (1992-1995) whichaddressed the following questions:
1) How effective and efficient is the current early intervention system?2) What outcomes are achieved by families through early intervention?3) What outcomes are achieved by children through early intervention?
The discussion of the studies in this section will focus on child and family outcomes.Each of the studies was a two-year project. Data collection methods involved a literaturereview, key informant (parents, service providers, program coordinators, medicalpersonnel) interviews and surveys, focus groups, site visits, records review, andchecklists.
What Outcomes Are Achieved by Families Through Early Intervention?
The major finding of this study was the lack of information available in early interventionprograms regarding identification of the needs (and strengths) of enrolled earlyintervention families in Hawaii. The research team first tried to identify family needs andhow they were being addressed in order to assess what family outcomes should be. Sinceinformation regarding needs was lacking, the study concentrated on creatingmethodologies for collecting this information. As a result, recommendations regardingactual outcomes were limited by the fact that information on actual goals and objectivesfor families was not present. The study did recommend, however, two broad domains:empowerment and family functioning.
What Outcomes Are Achieved by Children Through Early Intervention?
The major recommendation of this study in regard to assessment was to conduct a seriesof small-scale evaluations which focused on the two child outcomes of life skills andschool readiness. In terms of evaluation methods, the study concluded that “the onlyevaluations which seemed feasible were non-experimental designs without comparisongroups.” (Roberts, 1997). It was suggested that school readiness could be measured byasking kindergarten teachers to rate random samples of early intervention “graduates” and
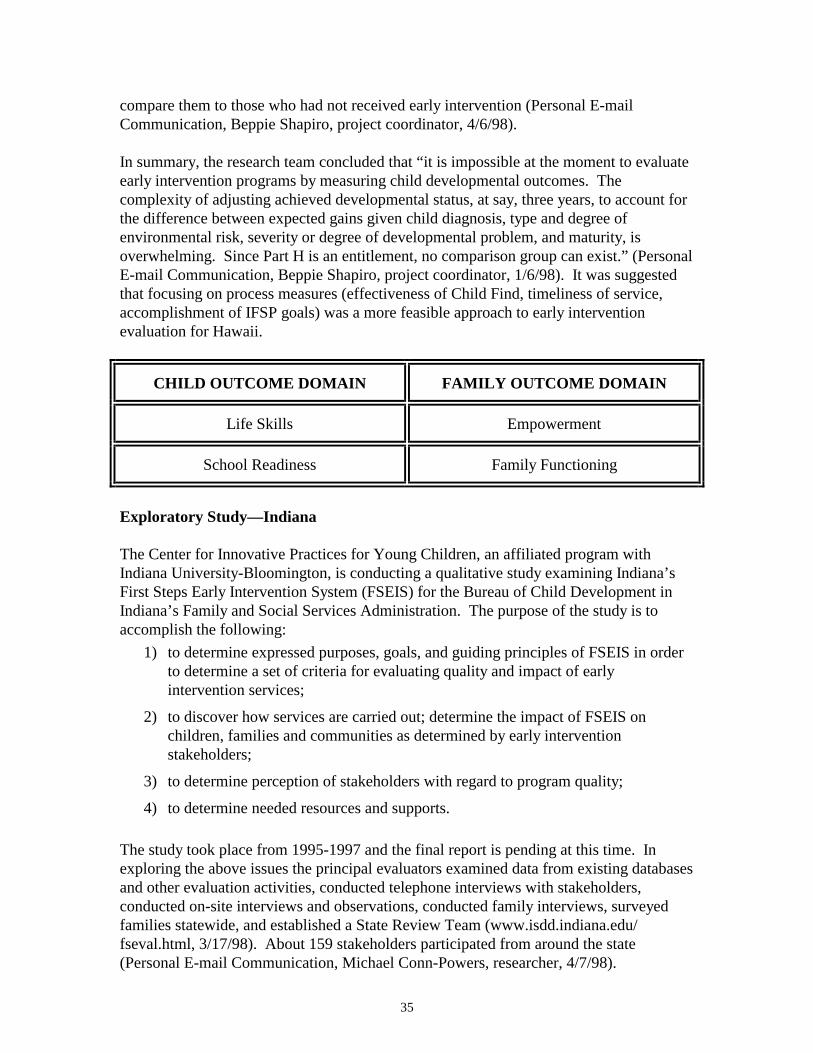
35
compare them to those who had not received early intervention (Personal E-mailCommunication, Beppie Shapiro, project coordinator, 4/6/98).
In summary, the research team concluded that “it is impossible at the moment to evaluateearly intervention programs by measuring child developmental outcomes. Thecomplexity of adjusting achieved developmental status, at say, three years, to account forthe difference between expected gains given child diagnosis, type and degree ofenvironmental risk, severity or degree of developmental problem, and maturity, isoverwhelming. Since Part H is an entitlement, no comparison group can exist.” (PersonalE-mail Communication, Beppie Shapiro, project coordinator, 1/6/98). It was suggestedthat focusing on process measures (effectiveness of Child Find, timeliness of service,accomplishment of IFSP goals) was a more feasible approach to early interventionevaluation for Hawaii.
CHILD OUTCOME DOMAIN FAMILY OUTCOME DOMAIN
Life Skills Empowerment
School Readiness Family Functioning
Exploratory Study—Indiana
The Center for Innovative Practices for Young Children, an affiliated program withIndiana University-Bloomington, is conducting a qualitative study examining Indiana’sFirst Steps Early Intervention System (FSEIS) for the Bureau of Child Development inIndiana’s Family and Social Services Administration. The purpose of the study is toaccomplish the following:
1) to determine expressed purposes, goals, and guiding principles of FSEIS in orderto determine a set of criteria for evaluating quality and impact of earlyintervention services;
2) to discover how services are carried out; determine the impact of FSEIS onchildren, families and communities as determined by early interventionstakeholders;
3) to determine perception of stakeholders with regard to program quality;
4) to determine needed resources and supports.
The study took place from 1995-1997 and the final report is pending at this time. Inexploring the above issues the principal evaluators examined data from existing databasesand other evaluation activities, conducted telephone interviews with stakeholders,conducted on-site interviews and observations, conducted family interviews, surveyedfamilies statewide, and established a State Review Team (www.isdd.indiana.edu/fseval.html, 3/17/98). About 159 stakeholders participated from around the state(Personal E-mail Communication, Michael Conn-Powers, researcher, 4/7/98).
36
While the final report is pending, one major finding of the study was the “absence ofclearly defined outcome-oriented goals among constituents.” Participants emphasizedprocess and service quality oriented goals. In regard to child outcomes, improvement inchild development and the acquisition of major milestones were common themes.Researchers pointed out that selecting specific milestones and skills was problematic dueto the diversity of needs and strengths in the early intervention population. It is underconsideration to recommend an “exiting” measurement survey which would ask familieswhat their goals were in this area and how well they accomplished them. (Personal E-mailCommunication, Michael Conn-Powers, researcher, 4/7/98)
SUMMARY
In terms of the statewide evaluations discussed above, Child Development, Readiness toLearn, and Life Skills are common child outcomes. Such outcomes can be measured boththrough standardized tests, or non-standardized data collection methods (non-standardized surveys, interviews, questionnaires). Family Empowerment and FamilyFunctioning are prevalent family outcome domains which can also be measured bystandardized or non-standardized instruments. Indicators for these domains are quitevaried and can depend on the data collection method and the focus of the study.
Evaluation of early intervention programs with regard to family and child outcomes is acomplicated matter. Issues of cost, scientific validity, study designs and focus are a fewcommon topics emerging from the summary of state activity by NEC*TAS, EarlyIntervention Research Institute study and Consortium participants. Some states havechosen to evaluate early intervention programs in terms of process measures. Some havechosen child and family outcomes that are suited to subjective evaluation (such assatisfaction or perceived impact); others have selected projects which use more objectivemeans to measure outcomes and focus on specific aspects of early intervention programs.Others have conducted exploratory or feasibility studies to collect decision-makinginformation. In choosing which studies to do, states should balance cost, scientificvalidity, desired information, and desired study focus in order to determine what is bestsuited to their particular circumstances.
37
CHAPTER 5
LOCAL ASSESSMENT IN WASHINGTON STATE
A number of communities and programs in Washington State have developed proceduresfor assessing local early intervention efforts. The Local Assessment Survey (Appendix D)was developed to identify program evaluation activities undertaken at the local level thatmight inform statewide evaluation activities. The survey was sent to child developmentalprograms, County Interagency Coordinating Councils, Educational Service Districts,Infant Toddler Early Intervention Program Lead Agencies and additional contractors,neurodevelopmental centers, school district Special Education Directors for schools whocurrently serve children, tribal authorities, University Affiliated Programs, and UniversitySpecial Education Teacher Preparation Programs.
A total of 309 surveys were mailed. This included duplicate listings for organizationsboth within and between targeted mailing categories. With only a few exceptions, noattempt was made to contact non-responders after a single mailing. As this was intendedto be a probe for information, responses were not anticipated from all those surveyed.Eighty-nine organizations responded, from programs within all of the categories listedabove and associated with every county.
LOCAL ASSESSMENT ACTIVITIES
Responses from the Local Assessment Survey were focused into three categories:1) surveys developed by an organization to provide specific feedback; 2) processes usedto track children’s progress; and 3) tracking children’s services after age three.
Surveys
All programs that contract with the Infant Toddler Early Intervention Program receive itsSelf-Assessment Tool (Infant Toddler Early Intervention Program). This includes sampleparent/family and provider surveys, used directly by some organizations. Other programshave developed their own surveys. Thirty-four Local Assessment Survey respondentsindicated that they had developed their own survey(s) targeted at either families and/orstaff. These respondents included County Interagency Coordinating Councils,developmental centers, neurodevelopmental centers, school districts, Infant Toddler EarlyIntervention Program contractors, tribal organizations, and University programs. Therepresented organizations reside in eighteen counties and are spread among countieswhich are metro (38%), small urban (35%) and rural (26%) in character.
Twenty-six respondents had developed parent/family surveys which addressed issuessuch as whether families perceived their needs as being met; program convenience,responsiveness, and/or sensitivity; coordination of services; family choice, awareness ofoptions, and/or control; level of comfort with staff and/or program; knowledge gained;the referral experience; specific staff areas, Family Resources Coordinators; level ofinvolvement or participation; and family support. Some surveys also discussed obstacles,
38
life improvements, and stress levels. An additional ten surveys were directed towardfamilies but were more specific in nature, i.e., concerned with parent needs, health,interests, gross child development, the fit of the parent match (for parent support),transportation issues, or transitions.
Four respondents mentioned staff surveys. These included a self-assessment for“helping” parents (parents involved in parent support), a survey which addressed familysupport worker duties, and staff surveys concerned with transition.
Tracking progress
All programs track the individual progress of children through their IndividualizedFamily Service Plans (IFSP). These plans outline service components and desiredoutcomes for children and their families, and are updated periodically to reflect new goalsas development and needs are reassessed. While many respondents cited this process oftracking children’s progress, thirteen respondents noted specific additional or relatedtracking activities. Represented organizations include developmental centers,neurodevelopmental centers, school districts, Infant Toddler Early Intervention Programcontractors, tribal organizations, and University programs, and are located in twelvecounties which are metro (27%), small urban (31%) and rural (42%) in character.
Of these organizations, almost half (six) noted the use of various curriculum-basedassessment, evaluation, and programming systems, which track progress and help withindividual goal-setting. Other responses included broad compilations of numbers servedand exited, as well as more specific programs such as a monitoring program designed forhigh school parents and their children.
The Neurodevelopmental Centers of Washington have begun an additional trackingactivity, partially supported by the Department of Health. Six neurodevelopmentalcenters are taking part in a one-year trial of WeeFIM, a functional improvementmeasurement tool for children from six months to seven years of age and older. This isthe pediatric version of the adult Functional Improvement Indicator (FIM) for patientsundergoing medical rehabilitation. As with FIM, a national database of subscribers’ dataallows users to compare their data with regional and national performance figures.Information collected includes patient demographic characteristics, medical diagnoses,impairment groups, lengths of inpatient stay, costs, and functional assessments (self-care,sphincter control, transfers, locomotion, communication, and social cognition) undertakenduring admission, treatment, discharge, and follow-up. The Neurodevelopmental Centersare working with Uniform Data System for Medical Rehabilitation (developers ofWeeFIM) to increase the sensitivity of WeeFIM for the birth to three population. At theend of the trial period (October 1998) the Neurodevelopmental Centers of Washingtonwill evaluate the applicability and usefulness of WeeFIM.
39
Tracking services after age three
A number of school district programs which offer both birth to three early interventionservices (Part H) and preschool services (Part B) pointed out that they track children whoremain eligible until kindergarten. In addition, five organizations mentioned longer termtracking activities. Sedro-Woolley School District noted that through the WashingtonState Information Processing Cooperative, they are able to track special educationchildren from eligibility to the time of exit. Bethel School District tracks those whotransition into district services, and is exploring the possibility of tracking through gradesthree or four. Two tribal organizations (the Roger Saux Health Center of the QuinaultIndian Nation and the Port Gamble S’Klallam Tribe) noted that they have computerizedsystems by which they track their children, and this continues after age three. The LittleRed School House, a developmental center with sites in Lynnwood and Everett currentlyserving approximately 130 children, is beginning to survey its graduates in order to gaininsights into families’ early intervention experiences and to track later placement andquality of life. They plan to routinely track new graduates at preschool entry and at thestart of kindergarten, with more random sampling at later points in time.
RESEARCH STUDIES
Several more extensive research studies related to early intervention for infants andtoddlers, birth to three, were identified within Washington State.
Washington Research Institute
Supporting Neurobehavioral Organizational Development in Infants with Disabilities:The Neurobehavioral Curriculum for Early Intervention. Rodd Hedlund, PrincipalInvestigator, Washington Research Institute. The purpose of this project is thedevelopment, field-testing, and evaluation of a neurobehavioral curriculum for infantsborn with very low birthweight and their parents. The model assists early interventionprofessionals to: 1) observe and interpret the behavioral cues expressed by the infant; 2)learn and implement specific neurobehavioral strategies that support the infant’sneurobehavioral organization and self-regulatory competence; and 3) support parents aswell as paraprofessionals to recognize and support the neurobehavioral needs of thesefragile infants.
A comprehensive evaluation of the Neurobehavioral Curriculum for Early Intervention(NCEI) was conducted for formative and summative purposes using both quantitative andqualitative procedures to capture the impact of the curriculum on a variety of indicesincluding standardized measures of infant development, subtle changes in infantbehaviors, and subjective impressions and feelings of care givers and early interventionprofessionals and paraprofessionals. Fifteen early intervention professional andparaprofessionals from three sites (Tacoma Learning Center, Valley Learning Center, andthe Hospital to Home Program) participated in the field-testing and evaluation of theNCEI. Data were collected on a total of 48 infants (26 male and 22 female) and theirfamilies. To be included in the project, infants had to be chronologically ordevelopmentally six months of age or younger. The infants’ average chronological age
40
was 11 months, ranging from 2.5 to 31 months. Average corrected age was 9 months,ranging from birth to 27 months. The infants’ average gestational age was 33.5 weeksand their average birth weight was 2062 grams (~4.5 lbs). Forty of these infants had threeor more significant medical conditions such as prematurity and very low birthweight(<1500 grams, 3.3 lbs), broncho-pulmonary dysplasia, developmental delays and visionor hearing impairments.
Results
The field testing and evaluation focused on five main areas: impact of the curriculum,impact of training, fidelity of implementation, formative evaluation of materials, usersatisfaction, and cost-effectiveness.
Infant progress and caregiver-infant interactions
Pre- and post-test data were collected on infants’ progress using the Bayley Scales ofInfant Development and the Early Intervention Developmental Profile. On the BayleyScales, significant gains (p < .05) were found for both mental and the psychomotor ageequivalencies. On the EIDP, significant gains (p<.05) were found for age equivalenciesin all six domains, Cognitive, Gross Motor, Communication, Fine Motor, Self-help, andSocial. Data on infants’ progress on IFSP goals and objectives (outcomes) and degreesand amount of neurobehavioral supports were collected on a quarterly basis. Over a sixmonth intervention period, infants’ progress on IFSP goals was significant for all sixdevelopmental domains. Decreases over time in degree and amount of neurobehavioralfacilitation were also significant for cognitive, gross motor, communication, and finemotor goals.
Overall these results show that infants made significant progress on their IFSP goals andobjectives (outcomes) as well as decreased their need for neurobehavioral facilitation.
Significant improvement in neurobehavioral organization was also found using the InfantBehavioral Assessment (IBA), reflecting greater infant competence and reduced stressduring interactions.
Qualitative information gathered from the early interventionists through questionnaires,informal interviews, and direct observations confirmed that interventionists found theNCEI strategies very helpful in improving infants’ neurobehavioral organization and hadan impact on infants’ gains on their IFSP goals (outcomes).
Interventionists also found that as a result of their use of the NCEI strategies and parentmaterials, caregivers appeared more comfortable in a number of ways with their infants.
Impact of training, fidelity of implementation and formative evaluation of materials
Overall, trainees found the IBA and NCEI training very effective in increasing theirknowledge on infant neurobehavioral organization, their ability to interpret infants’ cuesand provide neurobehavioral support to infants and families. Most interventionists
41
implemented the NCEI with all or most of the infants and families in their case load,including older children who were functioning at a low level.
The NCEI and the parent materials were found to be well thought out and organized. Theneurobehavioral strategies and activities were comprehensive and easily understood. Theparent materials were found to be positively worded, and understandable for average levelreaders.
User satisfaction and cost effectiveness
Overall, interventionists expressed satisfaction with most of the strategies and materials,and felt that parents also generally liked the strategies and materials. Mostinterventionists thought the strategies and parent materials were very easy to integratewithin daily activities, and that they were very reasonable in terms of time and effort forpreparation and implementation.
University of Washington
The Early Child Care Study of Children with Special Needs. Cathryn Booth, PrincipalInvestigator, and Jean Kelly, Co-Principal Investigator. This longitudinal, ecologicalstudy is being conducted through the Department of Family and Child Nursing at theUniversity of Washington. This project is designed to evaluate the effects of child careon the development of young children with special needs. The sample (n=160) includesthose with diagnosed disabilities or delays (n=80) and those at risk for developing a delay(n=80) due to prematurity, respiratory distress syndrome, maternal abuse of drugs oralcohol, or other specified factors.
A longitudinal design is being used to evaluate child outcomes at 30 and 45 months as afunction of the complex interactions among child characteristics, family characteristics,and the quality and type of home, early intervention, and child care environments inwhich the children develop. Children and their families participating in the study arebeing assessed at child ages 12, 15, 30 and 45 months. Interviews, questionnaires,structured and unstructured observations occur at home, at child care, and in thelaboratory setting.
Families were recruited when the children were 12 months of age and are being followedthrough 45 months. A grant has been submitted to follow the children through secondgrade, in order to look at transition, inclusion and school-age outcomes.
Training and Early Intervention to Promote Quality Parent-Child Interaction inHomeless Families. Jean Kelly, Principal Investigator. This study is being conductedthrough the Department of Family and Child Nursing at the University of Washington.
Background and Purpose of Research
This project will provide early intervention services to homeless families being served bythe YWCA, and train YWCA staff to provide the intervention services after the project is
42
completed. One of the terrible aspects of family homelessness is a dramatically increasedrisk that homeless children will be impaired both psychologically and cognitively, withimmediate and long-term consequences for these children and society. The focus of thisintervention will be to facilitate nurturing interactions between homeless parents and theirchildren, birth to three years of age, in order to mitigate the children’s risk forpsychological problems and delayed development. The specific objectives of the studyare:
1. To provide training to Greater Seattle YWCA program sites serving homeless families on how to provide one-on-one early intervention to facilitate healthy parent-child interactions.
2. To provide direct early intervention with parents and their young children, birthto three years of age, who are in YWCA transitional housing. The earlyintervention sessions will be the basis of the training. The intervention isdesigned to increase the quality of parent-child interactions.
3. To evaluate the project to determine changes in (a) the quality of interactionbetween participating parents and children and (b) YWCA parent educators’knowledge, performance, and satisfaction.
Evaluation
The pre- and post-assessments of staff (videotaped sessions of educators with parent-child dyads and knowledge and satisfaction questionnaires), and the parent-childinteractions (videotaped sessions) will be used to evaluate the success of this training andearly intervention project. Coders, blind to the design of the project, will code thevideotapes of the parent-child play and teaching episodes, and the videotapes of theparent-educator sessions. The parent-child interactions will be coded using the NursingChild Assessment Teaching Scale (NCATS) (Barnard, 1994). The parent-educatorinteractions will be coded using a coding scheme developed for the purposes of the study.Additionally, the parent-educator will complete The Competency Rating Scale (adaptedfrom Leitch, 1995) used to rate knowledge and skill in each of the following areas:knowledge of infant/toddler states, behaviors and cues, parent-child interaction, providingfeedback to parents during interactions, and establishing helping adult relationships in theearly intervention settings, and a staff satisfaction questionnaire.
Parent-Child Communication Coaching. Kathryn Barnard, Principal Investigator,Susan Spieker and Colleen Morisset Huebner, Co-Investigators. This study, which is partof a national consortium of 15 projects evaluating the Early Head Start program, is beingconducted through the University of Washington, School of Nursing, in collaborationwith Families First Early Head Start program of the Children’s Home Society of SouthKing County. This project is designed to measure outcomes of an intervention known asParent-Child Communication Coaching, whose intent is to facilitate the parent-childinteraction in a positive manner and to facilitate the child’s secure attachment to theparent, thereby boosting the child’s cognitive and language development and preventinglearning and emotional problems.
43
Two hundred families enrolled in the Families First program will be studied. Onehundred of the families will receive the intervention, and 100 will serve as a controlgroup. The core service of the intervention is a home visiting program. The Parent-ChildCommunication Coaching begins in pregnancy and continues with age specificinterventions through the second year.
The broader Early Head Start program goals, which each have specific outcomes, include:
1. Enhance child development and social competence by promoting the child’sdevelopment and supporting the provision of developmentally enrichingcaregiving and environments in the family’s home and, when appropriate, thechild care center.
2. Support family development and promote long term self-sufficiency and
capability of parents. 3. Create stronger, responsive communities that share responsibility for the
healthy development of children.
4. Recruit, develop and retain high quality staff.
Snohomish County
Snohomish County and the Region III office of the Division of DevelopmentalDisabilities recently worked with consultant Susan Janko, Ph.D., University ofWashington College of Education, to conduct a review of birth to three services forchildren with disabilities in Snohomish County. A community steering committeeincluding families, educators, and service providers helped direct and advise the study.
Data were collected through the use of interviews, observations, and review of programdocuments. Interviews were conducted with families of children currently using birth tothree services, families of children who had previously used birth to three services,families of children who were eligible for but did not use birth to three services, andrepresentatives of programs providing services in Snohomish County. Observations wererelated to program sites and community information.
The review addressed five goals: 1) identify successful models of service; 2) learn aboutfamily preferences; 3) describe changes in children’s and family’s priorities and needs;4) guide and support new options in response to families’ priorities; and 5) develop waysto evaluate accomplishments and progress in the future. The final report, expected to beavailable in July 1998, will include recommendations regarding future directions forSnohomish County birth to three services.

44
45
45
CHAPTER 6
DATA INVENTORY
A wealth of information is available in secondary data sources on children in the state ofWashington. An inventory of relevant technical data was conducted to identify possibleindicators for child and family early intervention outcomes, and to assess the feasibility ofobtaining access to these data.
Extensive information on children with special needs over the age of three is maintainedin local school records. While school records are not readily accessible for research, boththe Department of Health and Department of Social and Health Services (DSHS),Division of Developmental Disabilities maintain information for children to whom theyprovide services. Another source of information for children who are born to Washingtonresidents is contained in the First Steps Database. Additional databases include thatmaintained by the DSHS, Children’s Administration on child abuse, neglect and out-of-home placement. All of these databases can be linked to provide information on thebackground characteristics of children served, the type of services received, and somelimited information relative to type of disability and outcome. Despite the plenitude ofdata, these secondary sources provide very limited information regarding child’sdisability and the family environment. As a result of the limitations in these secondarydata sources, all of the proposed research projects using these secondary sources involveadditional primary data collection.
DATA FROM OFFICE OF SUPERINTENDENT OF PUBLICINSTRUCTION/STUDENT FILES
The confidentiality issues surrounding access to student identified data are significant.The release of personally identifiable information (without parental consent) is permittedin limited cases: in order to meet the requirements imposed by chapter 392-172 WAC; orto officials of participating agencies under the rules governing the Family EducationalRights and Privacy Act of 1974. In general, for written informed consent not to berequired, the disclosure must be on behalf of school districts’ efforts to improveinstruction and the manner in which the information will be used to improve instructionmust be clearly articulated. Permission to obtain an enrollment count for three to six yearolds must be negotiated with Office of Superintendent of Public Instruction (OSPI) andwould require Human Research Review Board (HRRB) approval. Permission for accessto children’s school records would have to be negotiated separately with each district orthrough written parental consent. With parental consent, HRRB approval, and supportfrom OSPI it would be possible to review student files. Some of the information whichwould be contained in these student files is listed in Table 1.
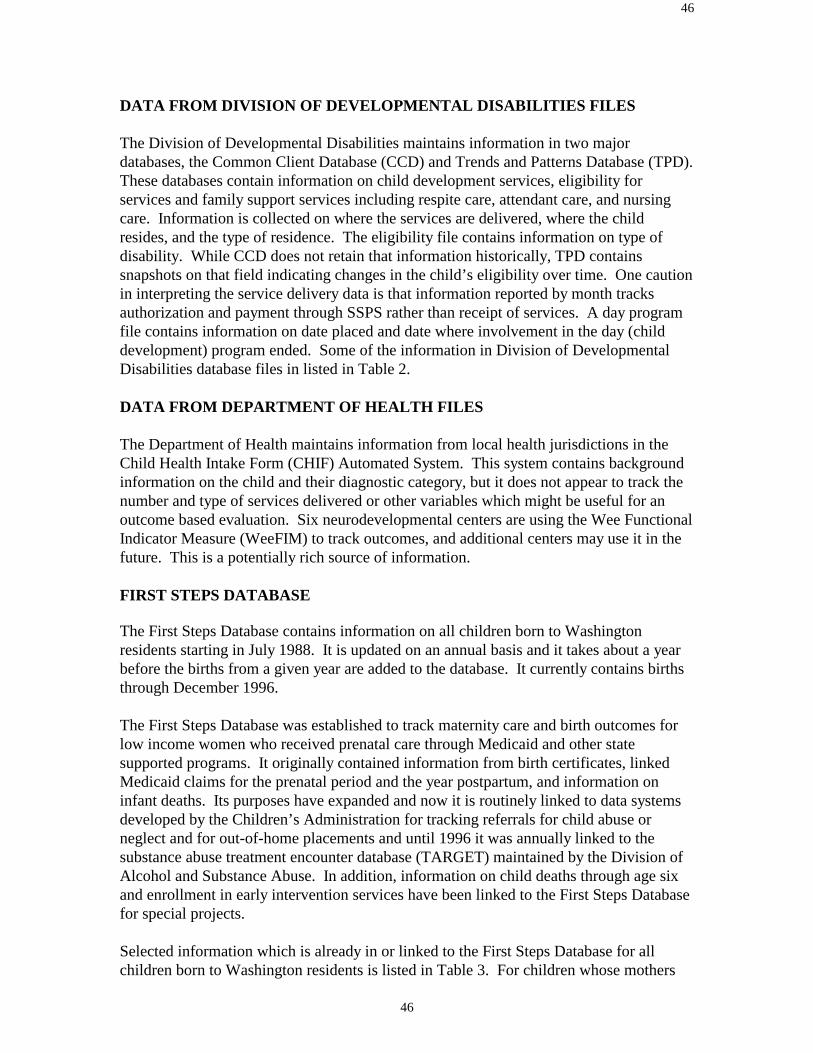
46
46
DATA FROM DIVISION OF DEVELOPMENTAL DISABILITIES FILES
The Division of Developmental Disabilities maintains information in two majordatabases, the Common Client Database (CCD) and Trends and Patterns Database (TPD).These databases contain information on child development services, eligibility forservices and family support services including respite care, attendant care, and nursingcare. Information is collected on where the services are delivered, where the childresides, and the type of residence. The eligibility file contains information on type ofdisability. While CCD does not retain that information historically, TPD containssnapshots on that field indicating changes in the child’s eligibility over time. One cautionin interpreting the service delivery data is that information reported by month tracksauthorization and payment through SSPS rather than receipt of services. A day programfile contains information on date placed and date where involvement in the day (childdevelopment) program ended. Some of the information in Division of DevelopmentalDisabilities database files in listed in Table 2.
DATA FROM DEPARTMENT OF HEALTH FILES
The Department of Health maintains information from local health jurisdictions in theChild Health Intake Form (CHIF) Automated System. This system contains backgroundinformation on the child and their diagnostic category, but it does not appear to track thenumber and type of services delivered or other variables which might be useful for anoutcome based evaluation. Six neurodevelopmental centers are using the Wee FunctionalIndicator Measure (WeeFIM) to track outcomes, and additional centers may use it in thefuture. This is a potentially rich source of information.
FIRST STEPS DATABASE
The First Steps Database contains information on all children born to Washingtonresidents starting in July 1988. It is updated on an annual basis and it takes about a yearbefore the births from a given year are added to the database. It currently contains birthsthrough December 1996.
The First Steps Database was established to track maternity care and birth outcomes forlow income women who received prenatal care through Medicaid and other statesupported programs. It originally contained information from birth certificates, linkedMedicaid claims for the prenatal period and the year postpartum, and information oninfant deaths. Its purposes have expanded and now it is routinely linked to data systemsdeveloped by the Children’s Administration for tracking referrals for child abuse orneglect and for out-of-home placements and until 1996 it was annually linked to thesubstance abuse treatment encounter database (TARGET) maintained by the Division ofAlcohol and Substance Abuse. In addition, information on child deaths through age sixand enrollment in early intervention services have been linked to the First Steps Databasefor special projects.
Selected information which is already in or linked to the First Steps Database for allchildren born to Washington residents is listed in Table 3. For children whose mothers
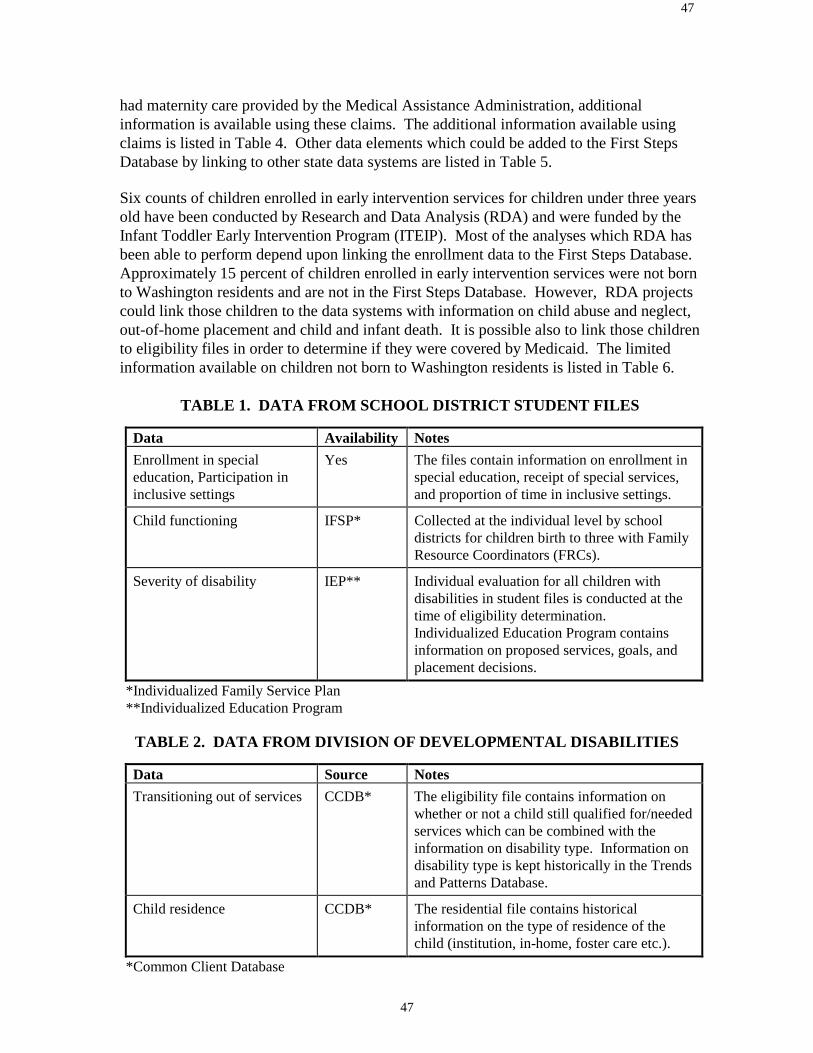
47
47
had maternity care provided by the Medical Assistance Administration, additionalinformation is available using these claims. The additional information available usingclaims is listed in Table 4. Other data elements which could be added to the First StepsDatabase by linking to other state data systems are listed in Table 5.
Six counts of children enrolled in early intervention services for children under three yearsold have been conducted by Research and Data Analysis (RDA) and were funded by theInfant Toddler Early Intervention Program (ITEIP). Most of the analyses which RDA hasbeen able to perform depend upon linking the enrollment data to the First Steps Database.Approximately 15 percent of children enrolled in early intervention services were not bornto Washington residents and are not in the First Steps Database. However, RDA projectscould link those children to the data systems with information on child abuse and neglect,out-of-home placement and child and infant death. It is possible also to link those childrento eligibility files in order to determine if they were covered by Medicaid. The limitedinformation available on children not born to Washington residents is listed in Table 6.
TABLE 1. DATA FROM SCHOOL DISTRICT STUDENT FILES
Data Availability NotesEnrollment in specialeducation, Participation ininclusive settings
Yes The files contain information on enrollment inspecial education, receipt of special services,and proportion of time in inclusive settings.
Child functioning IFSP* Collected at the individual level by schooldistricts for children birth to three with FamilyResource Coordinators (FRCs).
Severity of disability IEP** Individual evaluation for all children withdisabilities in student files is conducted at thetime of eligibility determination.Individualized Education Program containsinformation on proposed services, goals, andplacement decisions.
*Individualized Family Service Plan**Individualized Education Program
TABLE 2. DATA FROM DIVISION OF DEVELOPMENTAL DISABILITIES
Data Source NotesTransitioning out of services CCDB* The eligibility file contains information on
whether or not a child still qualified for/neededservices which can be combined with theinformation on disability type. Information ondisability type is kept historically in the Trendsand Patterns Database.
Child residence CCDB* The residential file contains historicalinformation on the type of residence of thechild (institution, in-home, foster care etc.).
*Common Client Database

48
48
TABLE 3. DATA FOR CHILDREN BORN TO WASHINGTON RESIDENTSIN (OR ALREADY LINKED TO) THE FIRST STEPS DATABASE
BACKGROUNDVARIABLES
SOURCE NOTES
Mother’s marital status FSDB* from birth certificate—at time of birth
Mother’s age FSDB* from birth certificate—at time of birth
Mother’s education FSDB* from birth certificate—from 1992 on
Eligibility for Medicaid FSDB* from OFM eligibility file—from conceptionthrough 2 years after
Ethnicity FSDB* from birth certificate—as stated on birthcertificate
Receipt of prenatal pare FSDB* from birth certificate—month began prenatalcare
Parity FSDB* from birth certificate—number of priorpregnancies or prior children
Amniocentesis FSDB* from birth certificate
Birthweight FSDB* from birth certificate—grams
Gestational age FSDB* from birth certificate—estimated gestationalage
Apgar score FSDB* from birth certificate
Enrollment in the InfantToddler Early InterventionProgram
RDA** enrollment in B-3 on Dec ’93, May ’95, Dec’95, May ’96, Dec ’96, Dec ‘97
Condition: identified at birth FSDB* from birth certificate for conditions identifiedat birth
DATA SOURCE NOTES
Infant death FSDB* from matched infant death file for 7/88-12/95
Child death FSDB* currently linked for child deaths prior to 1996for children born 7/91-12/94.
Accepted referral to child andprotective services
CAMIS***
for children born after July 1, 1991; CAMISdata linked to FSDB for referrals throughAugust, 1996 to children born before 1996
Placement by children’sservices out-of-home
CAMIS***
for children born after July 1, 1991; CAMISdata linked to FSDB for placements throughAugust 1996 to children born before 1996
*First Steps Database**Research and Data Analysis***Case and Management Information System
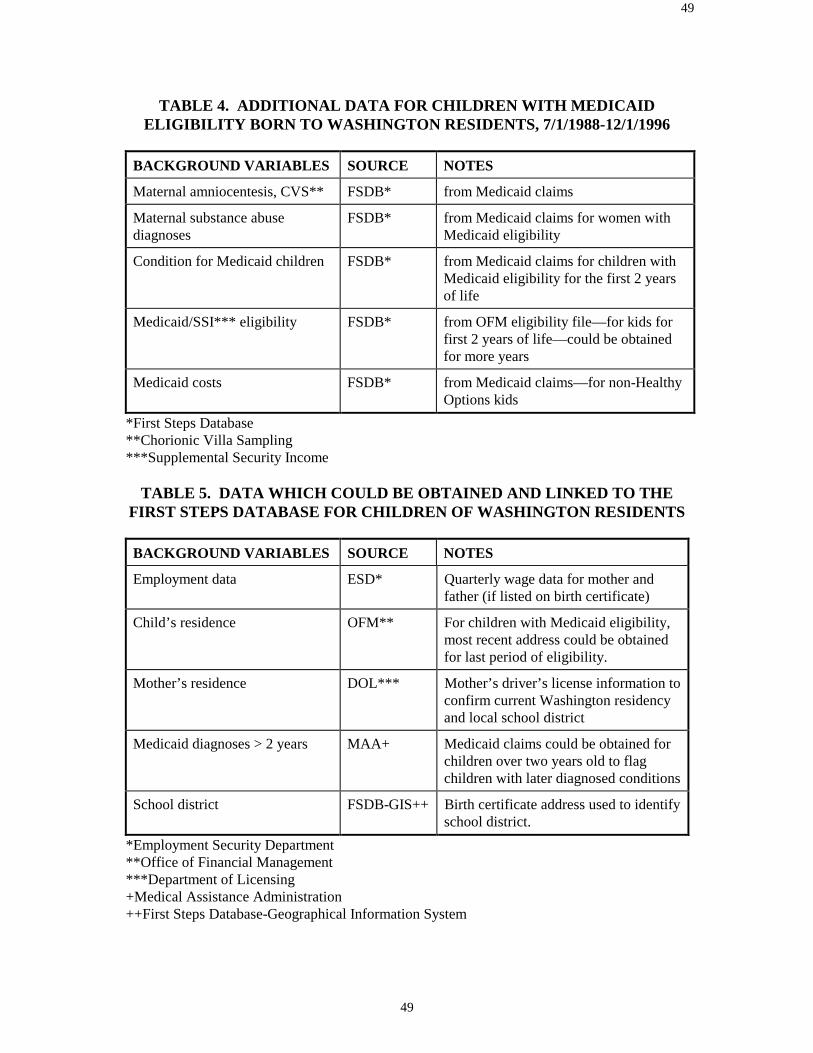
49
49
TABLE 4. ADDITIONAL DATA FOR CHILDREN WITH MEDICAIDELIGIBILITY BORN TO WASHINGTON RESIDENTS, 7/1/1988-12/1/1996
BACKGROUND VARIABLES SOURCE NOTES
Maternal amniocentesis, CVS** FSDB* from Medicaid claims
Maternal substance abusediagnoses
FSDB* from Medicaid claims for women withMedicaid eligibility
Condition for Medicaid children FSDB* from Medicaid claims for children withMedicaid eligibility for the first 2 yearsof life
Medicaid/SSI*** eligibility FSDB* from OFM eligibility file—for kids forfirst 2 years of life—could be obtainedfor more years
Medicaid costs FSDB* from Medicaid claims—for non-HealthyOptions kids
*First Steps Database**Chorionic Villa Sampling***Supplemental Security Income
TABLE 5. DATA WHICH COULD BE OBTAINED AND LINKED TO THEFIRST STEPS DATABASE FOR CHILDREN OF WASHINGTON RESIDENTS
BACKGROUND VARIABLES SOURCE NOTES
Employment data ESD* Quarterly wage data for mother andfather (if listed on birth certificate)
Child’s residence OFM** For children with Medicaid eligibility,most recent address could be obtainedfor last period of eligibility.
Mother’s residence DOL*** Mother’s driver’s license information toconfirm current Washington residencyand local school district
Medicaid diagnoses > 2 years MAA+ Medicaid claims could be obtained forchildren over two years old to flagchildren with later diagnosed conditions
School district FSDB-GIS++ Birth certificate address used to identifyschool district.
*Employment Security Department**Office of Financial Management***Department of Licensing+Medical Assistance Administration++First Steps Database-Geographical Information System
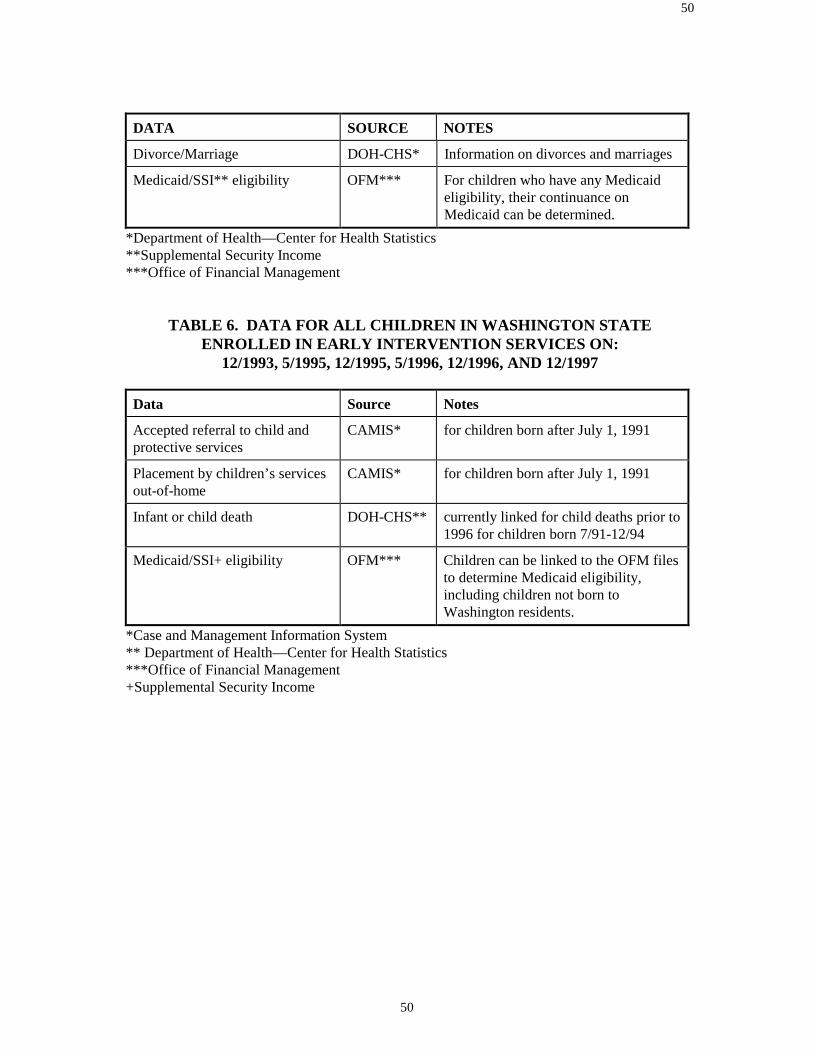
50
50
DATA SOURCE NOTES
Divorce/Marriage DOH-CHS* Information on divorces and marriages
Medicaid/SSI** eligibility OFM*** For children who have any Medicaideligibility, their continuance onMedicaid can be determined.
*Department of Health—Center for Health Statistics**Supplemental Security Income***Office of Financial Management
TABLE 6. DATA FOR ALL CHILDREN IN WASHINGTON STATEENROLLED IN EARLY INTERVENTION SERVICES ON:
12/1993, 5/1995, 12/1995, 5/1996, 12/1996, AND 12/1997
Data Source Notes
Accepted referral to child andprotective services
CAMIS* for children born after July 1, 1991
Placement by children’s servicesout-of-home
CAMIS* for children born after July 1, 1991
Infant or child death DOH-CHS** currently linked for child deaths prior to1996 for children born 7/91-12/94
Medicaid/SSI+ eligibility OFM*** Children can be linked to the OFM filesto determine Medicaid eligibility,including children not born toWashington residents.
*Case and Management Information System** Department of Health—Center for Health Statistics***Office of Financial Management+Supplemental Security Income
51
CHAPTER 7
STUDY DESIGNS
This chapter presents possible options for study designs for evaluating the impact of earlyintervention on infants and toddlers, birth to three, with disabling or delaying conditionsand their families in Washington State. Following a brief literature review, each study isdescribed in full. Each study design includes the following: a description of themethodology, suggestions for child and family outcomes, suggested analysis techniques, adiscussion of strengths and weaknesses, and estimated duration and costs of the study.
GENERAL LITERATURE REVIEW
The literature regarding the effectiveness of early intervention for children with disablingor delaying conditions and their families should be reviewed within the context of the fieldof child development itself. One impetus behind early intervention legislation was theemergence of data and developmental theories that indicated the unique interventionpotential during the first few years of life (Futterweit and Ruff, 1993). As was previouslydiscussed, development of neural synapses which form patterns of behavior and learningstyle occurs as early as infancy (Huttenlocher, 1990). Three populations of children are thetargets of early intervention services: 1) those with established developmental delays ordisabilities; 2) those at biomedical risk (such as low birth weight), and 3) those atenvironmental risk (such as those existing in poverty) (Tjossem, 1976). One of the aims ofearly intervention is to maximize each child’s developmental potential. While it isgenerally accepted that early intervention is effective in stimulating development (Castoand Mastropieri, 1986; Guralnick, 1998), understanding the relationship between child andfamily factors, program factors, and types of outcomes desired is still being researched(Guralnick, 1998).
The questions of early intervention research—for whom does early intervention work,under what conditions, and toward what goals (Guralnick, 1988)—are shaped within theevolution of the field of child development itself. Early studies assessing interventioneffects defined development as a strictly cognitive construct, more specifically,psychometrically defined intelligence (Guralnick, 1998). Current studies reflect trends inthe field of child development which suggest that development should be construed in amuch broader sense to include an array of social factors (Guralnick, 1997; Roberts et al.,1997). Similarly, earlier studies focused on child development as the sole outcome ofintervention (Innocenti, 1996), while contemporary thought suggests that development isan interactive activity and emphasizes the importance of the family and social environment(Boyce, 1993; Casto and White, 1993; Crowley and Taylor, 1993:4; Gallagher, 1996).With the growth in emphasis on family focused early intervention strategies, recent studieshave incorporated family outcomes as an integral part of intervention assessment (Bailey etal., 1998; Caro and Derevensky, 1991; Innocenti, 1996). As concepts of development andstrategies of intervention evolve, the parameters of research change. It is within thiscontext that a brief, general review of the literature will be presented. The individual

52
discussion of study designs contains a literature review section which elaborates on studiesof that specific nature.
First Generation Research
Early intervention research is often categorized into two time periods. First generationresearch indicates research occurring from the early 60s until the late 80s; second generationresearch indicates research from the late 80s until the present.
The focus of first generation research has primarily addressed the issue of the generaleffectiveness of early intervention services. Many first generation studies have used at riskor economically disadvantaged populations to draw conclusions about the impact of earlyintervention programs (Casto and Mastropieri, 1986). These studies produced strongevidence that early intervention programs had a positive impact (Innocenti, 1996). Theirresults were supported by longitudinal studies which confirmed early interventioneffectiveness in the long term such as the following: the Consortium for LongitudinalStudies (Lazar and Darington, 1982), the Perry Preschool Project (Berrueta-Clement et al.,1984), and the Abecedarian Project (Ramey and Haskins, 1981). Some researchers havequestioned whether the results from studies using at risk, preschool aged children can beapplied to those children, birth to three, with established disabling or delaying conditions(White and Casto, 1985). Despite these concerns, studies that did focus on birth to threepopulations of disabling or delaying conditions generally showed positive results (Guralnickand Bennet, 1987; Lovaas, 1987; McEachlin et al., 1993). Below are listed results fromsome reviews of first generation research pertaining to those with disabling or delayingconditions.
• In a review of 42 first generation projects researching the impact of early interventionservices on the disabled population, Farran (1990) stated that there were short and longterm gains in all areas of child development.
• In a review of 74 studies reviewing the impact of early intervention on children with
disabling conditions, Casto and Mastopieri (1986) reported that participants in earlyintervention services experienced improvement in IQ, motor, and language skills.
• In a review of 21 demonstration studies for infants and children with Down Syndrome,
Gibson and Harris (1988) noted that early intervention services had a positive impact onfine motor skills, IQs, and social behavior.
• In a review of 11 studies researching the impact of early infant stimulation programs on
infants and children with Down Syndrome, Gibson and Fields (1984) reported gains indevelopmental skills and social habits.
• In a review of 74 studies for children with disabling conditions, Casto (1986) stated that
“early intervention programs result in moderately large immediate benefits” in outcomessuch as cognitive, language, motor, and social skills, and parent-child interaction.
53
• White, et al. (1985) conducted a review of the reviewers of first generation (until 1985)studies and reported that 94% of 52 primary literature reviewers concluded that earlyintervention services resulted in “substantial immediate benefits for handicapped, at risk,and disadvantaged populations.”
First generation research faced a host of methodological problems which include thefollowing: 1) lack of random assignment, 2) subject selection, and 3) problems ofmeasurement (Bricker et al., 1984; Farran, 1990; Guralnick, 1991). Second generationresearch faces similar difficulties. These problems will be discussed in the subsequentsection, Methodological Challenges. While these methodological problems have affected alarge number of studies (Casto and Mastropieri, 1986; Shonkoff and Hauser-Cram, 1987), itis generally accepted that early intervention has a positive impact for children with disablingor delaying conditions (Casto and Mastropieri, 1986; Guralnick 1997; Shonkoff and Hauser-Cram, 1987), and that first generation research has “put the global question about whetheror not early intervention is effective to rest” (Guralnick, 1997).
Second Generation Research
Second generation research attempts to respond to the shortcomings of first generationresearch and incorporates current developments in the field of early childhood development.First generation research measured the effectiveness of early intervention programs from theearly 60s to the late 80s. Programs at this time were newly developed, uncoordinated andfragmented (Guralnick, 1997). As a result, which element of early intervention waseffective (or not) was not often discernible in earlier studies. Earlier studies also failed totake into account established independent variables that may affect the developmentalprogress of a child and family. Without taking these into account, conclusions regarding theimpact of early intervention may be erroneous (Shonkoff et al., 1988). As a result, secondgeneration research has focused on ascertaining which elements of early intervention have apositive impact on which type of subjects under what circumstances. A typical study of thistype is Longitudinal Studies of the Effects of Alternative Types of Early Intervention forChildren with Disabilities (Innocenti, 1996).
While first generation research focused primarily on cognitive child development, theconcept of development has been widened to include skills that will allow children toparticipate in valued roles in the community, perform to the best of their ability in schooland be able to become contributing members of society. To assess these goals, outcomesother than IQ, such as adaptive, communication, and social skills have become prevalent(Casto and Lewis, 1984; Guralnick, 1991 and 1989; Hauser-Cram and Shonkoff, 1988).
The growing emphasis on the importance of the effect of family and social environment ona child’s development has expanded the concept of development even further. Whileprevious studies focused solely on child outcomes, current research has begun to discussand assess impact of early intervention on families especially in the areas of family support,parent-child interaction, family empowerment, and knowledge needed to enhance a child’spotential for development (Boyce, 1993; Casto and White, 1993; Cleary, 1988; Crowley andTaylor, 1993:4; Gallagher, 1996, Kelly and Barnard, in press).
54
In sum, second generation research has moved beyond the general impact question andattempts to identify the “child characteristics, family characteristics, and program featuresthat interact to optimize one or more outcomes within the framework of contemporary earlyintervention services” (Guralnick, 1993).
Some General Results of Second Generation Research
Some general results of second generation research are listed below. These conclusionswere drawn by the referenced authors after a review of second generation studies. Theprojects were randomized controlled studies or met the criterion of “believability” whichMcLean and Cripe (1997) describe as requiring that a “skeptical reviewer would believe thatthe study’s results were almost certainly attributable to the experimental intervention, andnot to maturation or some other uncontrolled variable” (McLean and Cripe, 1997).
• Early intervention is effective in training mothers to be more responsive to infants withdevelopmental delays (Spiker and Hopmann, 1997).
• Infant stimulation had a positive impact on motor skills for children with cerebral palsyor related motor delays, especially when parent mediated (Harris, 1997).
• Therapeutic treatment for young children (birth to four years) with cerebral palsy ormotor delays has a greater impact on development than for older (four to eight years)children with cerebral palsy or related motor delays (Harris, 1997).
• Parent understanding of and compliance with therapeutic intervention programspositively affect the development of fine motor skills of children with cerebral palsy andmotor disabilities (Harris, 1997).
• Early intervention programs using the Mother-Infant Communication Program1
positively affect maternal responsivity to children with communication disorders(McLean and Cripe, 1997).
• Families using Hanen Early Language Parent Program2 increased the frequency andduration of joint and interactive engagement with their children diagnosed withcommunication delays than families who did not use this model (McLean and Cripe,1997).
• More successful treatment with greater efficiency has occurred when children withcommunication disorders are enrolled in early intervention at a young age (McLean andCripe, 1997).
• Parents can serve as effective interventionist for children with communication disorders(McLean and Cripe, 1997).
1 This program emphasizes strengths of mothers by focusing on behaviors already being used in order toincrease maternal responsivity to children with communication delays. It incorporates nondirective strategiessuch as modeling, video feedback, and planned practice (McLean and Cripe, 1997).2 The aim of this program is to increase social interaction skills of children with communication disorders byusing parents as interventionists. Mothers are taught to increase the frequency of their child’s socialinteraction by following the child’s lead (McLean and Cripe, 1997).
55
• Children with communication disorders functioning at levels of prelanguage and earlylanguage development respond more positively to treatment which is highlysystematic and takes place in naturalistic3 settings (McLean and Cripe, 1997).
• Early intervention has been effective in teaching children with autism to pay attentionto other people, to imitate others, to comprehend and use language, to playappropriately with toys, and to interact socially with others (Dawson and Osterling,1997).
• Children with autism demonstrate greater improvement in developmental areas whenparents are included in the child’s intervention service (Dawson and Osterling, 1997).
• Children with autism respond positively to highly structured, low staff-child ratioprograms (Dawson and Osterling, 1997).
• Children with autism require more intensive intervention than other conditions toachieve positive results (Dawson and Osterling, 1997).
These findings are by no means comprehensive, but they do demonstrate the focus ofcontemporary research. Rather than assess general impact of early intervention, secondgeneration studies address questions regarding the influence of specific program featuresand curricula (such as Hanen Early Language Parent Program, or structured versus lessstructured), child characteristics (such as type of condition), and family characteristics(such as parent-child interaction). Second generation research aims to be moremethodologically sound than previously; however, inherent difficulties remain.
METHODOLOGICAL CHALLENGESDefinitions
In order to understand the difficulties of designing good research with regard to earlyintervention, a brief explanation of key study components may be helpful.
Randomized Controlled Trials and Background Characteristics
The best type of study design to establish a causal relationship between treatment andoutcomes is a randomized controlled trial. Randomized controlled trials are trueexperimental designs and typically involve a treatment group, in this case earlyintervention, and a no-treatment group (controls), those not receiving any earlyintervention. Participants are randomly assigned to one of these groups. The benefit ofsuch a design is that it is the best way to eliminate a systematic bias in the groups withrespect to attributes (variables) other than, in this case, intervention, that may account fordifferences in the outcomes of these two groups (Polit and Hungler, 1987). If such a
3 Naturalistic infers that learning opportunities take place in naturally occurring activities or interactions andthat the intervention revolves around the child’s apparent focus of attention (McLean and Cripe, 1997).
56
design cannot be achieved, these other variables should be 1) discovered and 2)statistically controlled for. Since early intervention is primarily involved with childdevelopment (however broadly defined), characteristics of children, families, andprograms that could affect child development outside of early intervention should betaken into account. Currently well over forty external characteristics (such as childtemperament, severity of condition, caregiver education level) are known to affect childdevelopment (see Appendix B). Research in this area continues and the more that isunderstood about child development, the more accurately these characteristics will beidentified and their exact effects defined.
Outcomes and Indicators
Outcomes is a term that refers to the desired effect of intervention. In the case of earlyintervention, one common outcome is child development, which can be construed quitebroadly. Typically child development has included cognitive, communication,social/emotional (social competence), adaptive (level of independence), and physical(motor, vision, hearing, health) attributes. Recently it has been expanded to include familyoutcomes, such as parent-child interaction, which are known to have direct effects on childdevelopment (Kelly and Barnard, in press). Indicators are specific measurable attributesthat are directly related to the more general outcome. For instance, if parent-childinteraction is the outcome under investigation, one specific indicator might be “mother isresponsive to child’s needs.” Once indicators are chosen, the method of measurement canbe selected.
Measurement Techniques—Standardized Tests
Two main types of standardized instruments are used to assess outcomes of earlyintervention: 1) norm-referenced, and 2) criterion-referenced. Such tests include a variety ofmethods to obtain information such as observation [e.g. Nursing Child Assessment TeachingScale (NCATS) (Barnard, 1978; Barnard et al., 1989; Barnard and Kelly, 1990],questionnaires [e.g., Family Support Scale (FSS) (Dunst et al., 1984)], and structuredinterviews [e.g. Child Behavior Checklist (Achenbach and Edelbrock, 1987)].
Norm-referenced Tests
Norm-referenced tests are used to compare the individual child’s performance to a group ofchildren who share some specific characteristics such as age. The average performance ofthe standardization sample (large number of children with similar characteristics) becomesthe norm to which an individual child is compared. The norm is thus standardized, andchildren can be scored on the basis of their performance compared to the standardized norm.(Meisels and Fenichel, 1996). Examples of norm-referenced tests are the Bayley Scales ofInfant Development (Bayley, 1993, 2nd edition), Receptive-Expressive Emergent LanguageScale (Bzoch and League 1991, 2nd edition), Scales of Independent Behavior (SIB)(Bruininks et al., 1985), and Wisconsin Behavior Rating Scale (Songs et al., 1984).
57
Criterion-Referenced Tests
A. Domain/Objective Based
A criterion-referenced test rates the child on the degree that the child has mastered a certaindomain (such as motor development) or objective (child can stand independently).Development occurs in stages or levels. For instance, a child must have the dexterity tograsp before being able to eat with a spoon. Criterion tests are designed to measure eachlevel of this hierarchy of development, and the score reflects how many levels a child hasmastered in a given domain. The key to quality criterion tests is the degree to which theyaccurately encompass this hierarchy. To assess whether the ordered development in the testreflects actual patterns of child development, it is usually tested on a large population whohas some commonality (usually age). Hence criterion tests use norms as well. The subjectsare not scored on normative performance, however, but rather are scored on the basis of thelevel of achievement. Criterion tests are standardized in that each child is rated on the samedevelopmental hierarchy. Examples of criterion-referenced tests are Batelle DevelopmentalInventory (Newborg, et al., 1984) and the Early Learning Accomplishment Profile (LAP)(Glover et al., 1995),
B. Curriculum-based Evaluations
Curriculum-based assessment is also criterion referenced, but incorporates specific child andfamily objectives rather than standardized hierarchies. The purpose of these types ofassessments is to design intervention programs for individual children and families. Theseassessments identify general areas of focus. For example in the Vulpe Assessment Battery(Vulpe, 1979), one of the assessments is “Observe the child’s response to stimulation ofvarious sounds, human speech, or adult’s smile. The child responds occasionally withvocalization.” Scores are designed to indicate frequency of anticipated desired response (forinstance, the child responded occasionally with vocalization 5 out of 5 times in similarobservational settings, or 4 out of 5 times.) (Meisels and Fenichel, 1996). Examples ofcurriculum-based evaluations are Assessment, Evaluation, and Programming System forInfants and Children (AEPS) (Volumes 1 and 2) [D. Bricker (Vol. 1); J. Cripe, K. Slentzand D. Bricker (Vol. 2), 1993], Creative Curriculum for Early Childhood (Dodge andColker 1992, 3rd edition), and Every Move Counts (EMC) (Korsten et al., 1993).
Measurement Techniques—Non-standardized Assessment Tools
Non-standardized refers to a scoring methodology on a particular assessment tool that hasnot been based on standardized norms or criteria. For example, a particular observationtechnique was designed to measure how often a child had positive interaction with itsmother. The test would first have to define positive interaction, then establish a method forscoring the number of times a child had the defined indicator of positive interaction (e.g.simple counting) and a method for the process of assessment (e.g. observation in a naturalsetting for 30 minutes, three times a week). Results for this are comparable across differentsubjects only by the fact that subjects were assessed in the same manner. Whether thisparticular method may actually measure the positive interaction depends on factors such asthe pertinence of the indicator and the accuracy of the observations. While
58
non-standardized tests may seem less appropriate for research evaluation studies,researchers may be interested in phenomena not well measured by standardized tests.Non-standardized assessments are also very useful for evaluating each child on anindividually selected set of objectives. Goal Attainment Scaling (GAS) is an example of anon-standardized assessment. While it provides a method for scoring the degree goals areachieved, it does not determine what the goals are, nor whether they are appropriate for aspecific age or condition.
The choice of whether to use standardized or non-standardized tests depends on howaccurate the norm or criterion is for the population of interest, how accurate the test is inmeasuring the phenomena of interest, and whether or not the norm or criterion isappropriate for the particular children and families of interest.
Problems of Research Design in Early Intervention
The Absence of a Control Group
The greatest challenge facing early intervention research for children with disabling ordelaying conditions and their families is the absence of an appropriate control group. Dueto legal and ethical considerations, a randomly assigned no-treatment group cannot exist.If subjects cannot be randomly assigned to an early intervention treatment group and acontrol group, it cannot readily be concluded that changes in child or family developmentare due strictly to early intervention. As a result, studies that use randomized controldesigns focus on specific elements of early intervention. For instance, studies mayexamine the degree of intensity where the treatment group has an added intensitycomponent (Innocenti, 1996; Ramey et al., 1985; Taylor et al., 1993); a specific programcomponent such as Parent Instruction (Innocenti, 1996, Innocenti et. al, 1993); or a specificfactor such as age of enrollment (Innocenti, 1996).
Lack of a Comparison Group
A control group indicates those subjects in an experimental study who do not receive theexperimental treatment and who have been randomly assigned to the no-treatment group.Outcome scores from the control group are used as a baseline measure against which tocontrast the outcome scores of the treatment group. A comparison group is not randomlyselected, but provides a group against which to compare scores of the target group. Forinstance, families who choose not to receive early intervention services even though theyqualify would provide a good no-treatment comparison group. These families do notcomprise a control group, however, because they were not randomly assigned by theresearcher to a no-treatment group. Since comparison groups are not randomly assigned,researchers should be careful to analyze whether there is any systematic bias in thecomparison group which may affect outcomes. If there is such a bias, changes inoutcomes cannot be conclusively attributed to early intervention. For example, it wasfound that a hypothetical group of families that chose not to enroll in services althoughthey qualified were three times as likely to be more religious than the target group. Tostrengthen conclusions, researchers must then discover whether religion might have animpact on the child and family outcomes selected, assess to what degree it has an impact,
59
and control for that impact. Given that the differences in groups may occur in areas notmonitored by the researcher, and the measurement of the impact of significantcharacteristics (independent variables) might not be feasible, the use of comparisongroups can be problematic, but offers a compromise when a true control group cannot beidentified. Research projects that use comparison groups are referred to as quasi-experimental—a term that indicates a true control group is not being used in the study.
Since all eligible children must, if desired and accepted by parents, receive early interventionservices once identified, the only possible known comparison group for early interventionresearch is comprised of those who have qualified for services but chosen not to enroll. Ifsuch a group could be identified and agreed to cooperate in an evaluative study, the numberof subjects would have to be sufficient to control for type of disability, severity, andindependent variables. Achieving numbers large enough to attain statistical power is achallenge.
Without a control group, studies should statistically account for differences in child/familyoutcomes due to factors other than early intervention. While much progress has been madein identifying which factors influence child and family development (Andrews et al., 1995;Boyce et al., 1991; King et al., 1992; Kochanek et al., 1987; Ramey et al., 1978), the sheernumber of possible influential factors (independent variables) and their potential causalrelationships is daunting. Well over 40 possible program, family and child variables havebeen recognized as affecting development (Appendix B).
One method that has been employed to address these difficulties uses the child and family astheir own controls. Most such comparative approaches contrast actual child developmentscores to predicted progress scores generated from baseline data obtained before earlyintervention services began (Burchinal et al., 1994; Hauser-Cram and Krauss, 1991). Thedrawback to this approach is that measuring the impact of early intervention relies on theaccuracy of the predicted score. While this method has some statistical drawbacks (seesubsequent study designs that use children and families as their own control and AppendixE), it does provide an accepted methodological alternative in the absence of appropriatecomparison groups.
Subject Selection
Given the quantity of independent variables, the number of subjects required to generatestatistically significant results is quite large.4 Studies that attempt to sufficiently control forthe effects of independent variables on child and family development should include numberswhich allow adequate statistical power (Shonkoff et al., 1988). Acceptable statistical poweris achieved when the probability that an effect will be identified if it exists is quite high (80%or more).
4 Estimating the number of subjects required depends on factors such as the number of independent variables,the power of the analysis, and the effect size the study wishes to measure. For this reason estimates are usuallycalculated for specific studies using power analysis. For an example, one study which accounted for about 30independent variables with a medium effect size required a subject number of 200 (Shonkoff, 1992).

60
Another difficulty with subject recruitment is the use of comparison groups considering thevariability in effect of early intervention related to differing conditions. Studies have shownthat the impact of early intervention is affected by the severity and type of disabling ordelaying conditions (Shonkoff and Hauser-Cram, 1987). Children with mild psychomotorimpairments often showed gains (Shonkoff et al., 1992), while children with DownSyndrome tend to show less gain (Guralnick, 1988). It should be pointed out however, thatmaintaining a child’s development level is considered a very positive result for those withDown Syndrome. If the researcher were simply to examine the degree of effect for thegroup as a whole using numbers only, the gains of the mild psychomotor impaired childrenwould be diluted by the numerical results of the children with Down Syndrome—eventhough both results are considered positive impacts. A solution is to match children on typeand severity of delay, but given the number of variables that should be controlled,generating the numbers needed to achieve statistical power is difficult. Another factor toconsider is that with the wide variety of independent variables involved with each child andfamily, the often unknown etiology of certain conditions, and the specificity of each child’sarea of concern, accounting for variables between comparison groups becomes a verycomplex issue.
Data Sources and Measurement
After defining the desired outcomes of early intervention services, selecting an instrumentthat adequately measures the specified indicators can be problematic. While a host ofinstruments are available for measuring cognitive and social indicators, often theseinstruments have some limitations: they are not standardized for populations with disablingor delaying conditions, are not accurate for development in early stages, are not sensitiveenough to measure small changes, are not culturally sensitive, and are not valid for thephenomena they are measuring (Hauser-Cram, 1990; Meisels and Fenichel, 1996; Zigler andBalla, 1982). In an article reviewing early intervention program evaluation the authorwarns:
[Tests] are widely used because of the large numbers of preschool instrumentsavailable, because tests are usually easy to administer and score, and becausethey possess an aura of objectivity, which researchers find irresistible. However,it would be wise to remember that preschool assessment devices have beencriticized as being unreliable, and in many instances, invalid for the purposes forwhich they are being used (Casto, 1986).
Data sources other than standardized tests include surveys, interviews, observation and non-standardized tests. These methods are often used to supplement standardized tests and tocollect enough descriptive data to be able to properly interpret numerical evidence. Giventhe limitations of standardized tests, researchers recommend using a variety of measurementtechniques (Hauser-Cram, 1990). Non-standardized assessments are used in order tocustomize evaluations specifically to the information researchers are trying to assess. Inchoosing assessment methods, researchers need to bear in mind the limitations of themethods they choose.
61
Goals for Study Designs
Several general criteria were identified as important to consider in designing researchstudies that assess the impact of early intervention service on infants and toddlers withdisabling or delaying conditions and their families in Washington State.
The first criterion was that results from the study could be applied to early intervention on astatewide level. Subjects of the study should include the entire population of children withdisabling or delaying conditions and their families, or be a representative sample of thesechildren and families. The second criterion was that the outcomes should becomprehensive, reflect the latest developments in the field of child development, and couldbe tracked over time and provide an ongoing basis of assessment. The third criterion was toidentify generally accepted indicators of the selected outcomes through a review of theliterature, examination of other studies, and consultation with the Advisory Group.
Many of the problems described above apply to designs presented in the next section.Efforts were made to moderate the significance of these difficulties and steps were taken tocontrol for major characteristics (independent variables), balance quantitative data withqualitative data, and identify appropriate comparison groups. Each study, however, has itsown particular strengths and weaknesses. When evaluating a study, these strengths andweaknesses should be weighed carefully.
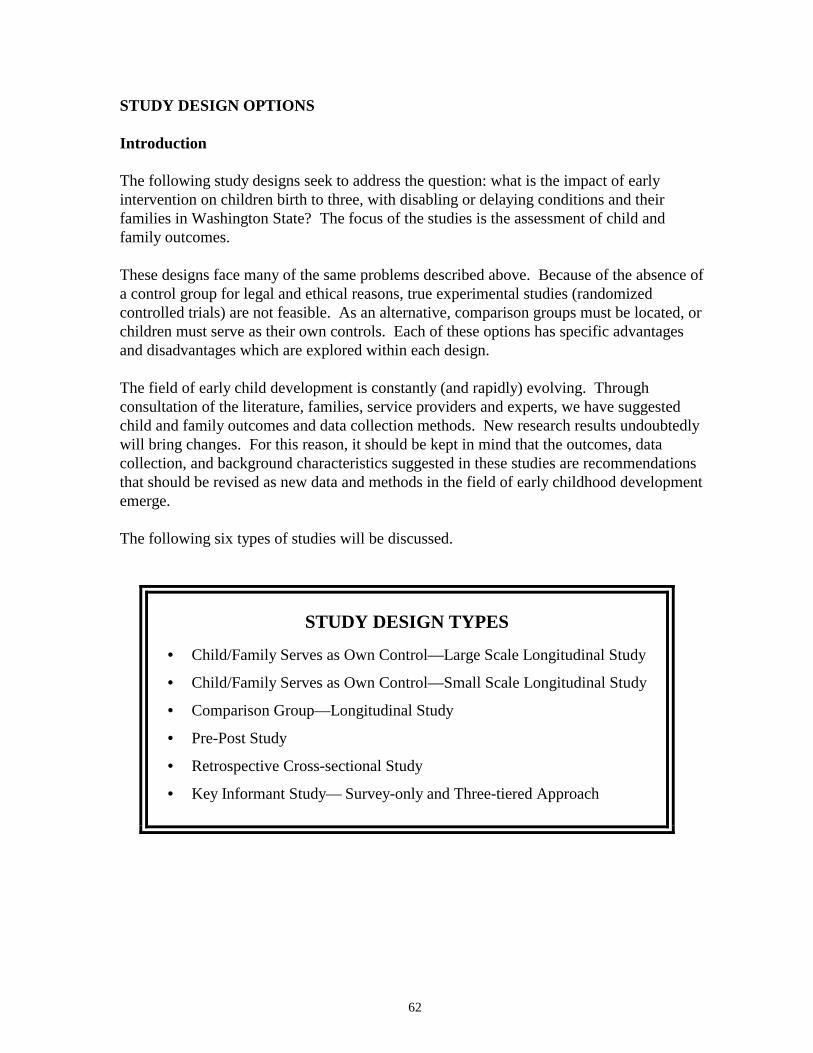
62
STUDY DESIGN OPTIONS
Introduction
The following study designs seek to address the question: what is the impact of earlyintervention on children birth to three, with disabling or delaying conditions and theirfamilies in Washington State? The focus of the studies is the assessment of child andfamily outcomes.
These designs face many of the same problems described above. Because of the absence ofa control group for legal and ethical reasons, true experimental studies (randomizedcontrolled trials) are not feasible. As an alternative, comparison groups must be located, orchildren must serve as their own controls. Each of these options has specific advantagesand disadvantages which are explored within each design.
The field of early child development is constantly (and rapidly) evolving. Throughconsultation of the literature, families, service providers and experts, we have suggestedchild and family outcomes and data collection methods. New research results undoubtedlywill bring changes. For this reason, it should be kept in mind that the outcomes, datacollection, and background characteristics suggested in these studies are recommendationsthat should be revised as new data and methods in the field of early childhood developmentemerge.
The following six types of studies will be discussed.
STUDY DESIGN TYPES
• Child/Family Serves as Own Control—Large Scale Longitudinal Study
• Child/Family Serves as Own Control—Small Scale Longitudinal Study
• Comparison Group—Longitudinal Study
• Pre-Post Study
• Retrospective Cross-sectional Study
• Key Informant Study— Survey-only and Three-tiered Approach
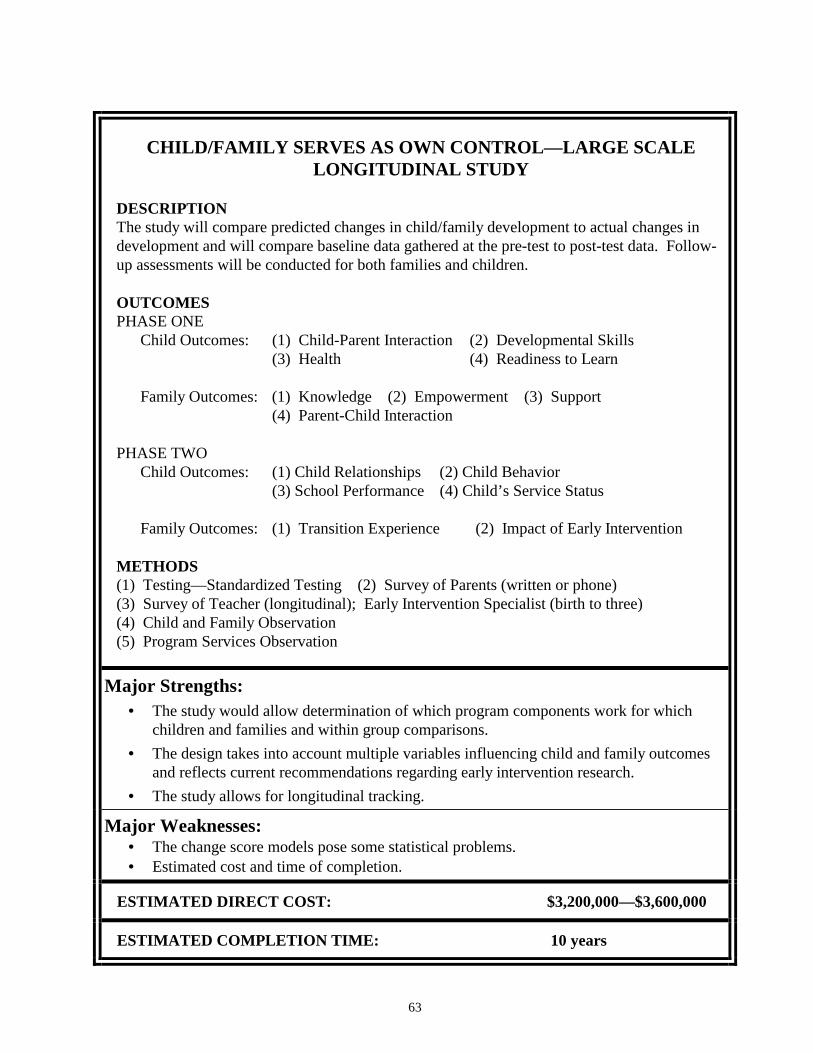
63
CHILD/FAMILY SERVES AS OWN CONTROL—LARGE SCALELONGITUDINAL STUDY
DESCRIPTIONThe study will compare predicted changes in child/family development to actual changes indevelopment and will compare baseline data gathered at the pre-test to post-test data. Follow-up assessments will be conducted for both families and children.
OUTCOMESPHASE ONE
Child Outcomes: (1) Child-Parent Interaction (2) Developmental Skills(3) Health (4) Readiness to Learn
Family Outcomes: (1) Knowledge (2) Empowerment (3) Support(4) Parent-Child Interaction
PHASE TWOChild Outcomes: (1) Child Relationships (2) Child Behavior
(3) School Performance (4) Child’s Service Status
Family Outcomes: (1) Transition Experience (2) Impact of Early Intervention
METHODS(1) Testing—Standardized Testing (2) Survey of Parents (written or phone)(3) Survey of Teacher (longitudinal); Early Intervention Specialist (birth to three)(4) Child and Family Observation(5) Program Services Observation
Major Strengths:• The study would allow determination of which program components work for which
children and families and within group comparisons.• The design takes into account multiple variables influencing child and family outcomes
and reflects current recommendations regarding early intervention research.• The study allows for longitudinal tracking.
Major Weaknesses:• The change score models pose some statistical problems.• Estimated cost and time of completion.
ESTIMATED DIRECT COST: $3,200,000—$3,600,000
ESTIMATED COMPLETION TIME: 10 years
64
CHILD/FAMILY SERVES AS OWN CONTROL—LARGE SCALELONGITUDINAL STUDY
SUMMARY
This study is a non-experimental, longitudinal project which will examine the impact ofWashington State early intervention services on children with delaying or disablingconditions and their families. Children and families serving as their own control means thatthis study does not have a separate control or comparison group. The study will essentiallymeasure changes in each individual and family that have occurred during the course ofintervention, and compare beginning outcome data to outcome data at future points in timefor each subject. Predicted changes in child/family outcomes also will be compared toactual changes in development using interval5 standardized test scores. Outcomes which arenot measured by interval scores will compare baseline data gathered at the pre-test to post-test data, only. Follow-up assessments will be conducted for both families and children inthe form of child observation, and parent/teacher surveys and interviews.
The study consists of two parts: Phase I examines child and family progress over the courseof continuous early intervention enrollment; Phase II involves a follow-up survey/interviewof families/teachers when children are ages 5 and 7 which 1) ascertains whether children areenrolled in special education, 2) describes their transition experience, 3) describes thechild’s relationships, behavior, and school performance, and 4) describes the family’sopinion of early intervention. Subjects are stratified by type of delay, and categorized aseither moderate or severe in terms of severity of condition.
INTRODUCTION
The purpose of this study is to measure the impact of early intervention on Washingtonchildren with delaying or disabling conditions and their families by adopting provenmethods of predicted change scores, controlling for determining characteristics, andaccounting for differences in the large array of delaying conditions.
If subjects cannot be randomly assigned to treatment (early intervention) and no-treatment(no early intervention) groups, it is difficult to conclude that changes in child/familydevelopment are due specifically to early intervention. To control for effects onchild/family outcomes other than early intervention, characteristics which affect theseoutcomes should be taken into account. The validity of some first generation research isquestioned due to the fact that influences affecting children and families other than earlyintervention had not been evaluated (Farran, 1996).
With the difficulties involved in identifying an appropriate control group, some studieshave relied on using each child as its own control. Second generation research has tried toredress some of the difficulties with such an approach by designing studies that: 1) control
5 An interval score is a measure that is ranked on a scale that has equal distance between points on that scale.
65
for determining characteristics (Shonkoff et al., 1992), and 2) pose an alternativecomparison method, such as residual change scores (Fewell and Glick, 1996; Oelwein etal., 1985). Most such comparative approaches contrast actual child development scores topredicted progress scores generated from baseline data obtained before early interventionservices began (Burchinal et al., 1994; Hauser-Cram and Krauss, 1991).
Recent research stresses that in order to measure the efficacy of early intervention moreaccurately, studies should take into account the variety of child/family characteristics andthe specific program components with which they interact. By law, services must beindividualized (and therefore different) for every child and family. Since the nature ofdisabilities and background characteristics are so varied, program components will affecteach child and family differently. For instance, more intensive intervention may producedramatic improvements for a child with one disability; whereas a child with a differentdisability may achieve the same amount of progress without added intensity. If services arenot individualized, children and families do not receive the full benefit of services andprogress towards outcomes is jeopardized.
METHODS
Recruitment Sites
This study relies on recruitment of children with the assistance of service providers in eachof Washington’s 39 counties who agree to participate. Participating sites will include avariety of urban, suburban, and rural areas.
Eligibility Criteria
The target population is all birth to three children and their families newly enrolled in earlyintervention services in Washington State. Children will be selected in the three followingcategories: 1) Down Syndrome, 2) motor impairment, and 3) developmental delay.
Sample Size
The ideal size of the study, accounting for a 30% attrition rate over time, would beapproximately 260 subjects (α=.05, statistical power is at .80, and effect is ~.33). The samplesize will be divided as follows: n (Down Syndrome)=50, n (motor)=50, n (delay)=160.Separating groups by type of disability will allow a more detailed analysis of change scores.
Recruitment of Children and Families
At the time of initial referral, participating service providers will inform the parent about theexistence of the study if it is likely that the child will meet study criteria. A pamphlet will beprovided which explains the process, focus and design of the study, and which asks thefamily’s permission to be contacted by the research team. If a family declines, non-identifiable demographic data should be collected for comparison of non-participating toparticipating children and families. If a family agrees, the research staff will contact them
66
to describe the study further, answer questions, and obtain written consent. After thepaperwork is completed, subjects will be assessed to obtain baseline data at T1 no more than4-6 weeks after initial assessment.
Child Characteristics
A review of the literature (please see the subsequent section, Discussion) indicates thatmany characteristics can affect the development of children with disabling or delayingconditions. For this study seven characteristics have been selected: 1) gender, 2)birthweight, 3) age, 4) age at enrollment, 5) health status, 6) temperament, and 7) severity ofcondition. Characteristics 1-4 can be obtained from a review of the child’s intakeinformation by research staff. To assess child health status, trained research staff will utilizeGeneral Health Ratings Index (Eisen et al., 1980). To obtain child temperamentinformation, trained research staff will conduct an evaluation using the Carey InfantTemperament Scale (ITQ) (Carey and McDevitt,1978). Severity of condition will involvetwo categories: 1) mild-moderate and 2) moderate-severe, where group one indicateschildren with a Mental Development Index (MDI) of less than 50, and group two indicatesan MDI of 50 or greater. Mental development will be measured by research staff at the startof the study using the Bayley Scales of Infant Development (Bayley, 2nd edition, 1993).
Family Characteristics
Family characteristics will include the following: 1) primary caregiver’s6 education level, 2)family’s yearly income, 3) family’s category of residence (urban, small urban, rural), 4)ethnicity, 5) quality of home environment, 6) family’s social support resources, and 7)primary caregiver’s health status. Characteristics 1-4 can be gathered at intake. Thefamily’s home environment will be evaluated by trained researchers using FamilyInteractive Scales (FIS) (Kracke, 1981; Riskin and Faunce, 1982; Walsh and Wood, 1983).The family’s degree of social support will be measured by trained researchers using theSocial Support Questionnaire (Sarason et al., 1983).
Program Characteristics
Recent research has explored the importance of matching particular program elements tospecific needs of children and families. Within this paradigm, certain programcharacteristics have emerged as key characteristics. Of those characteristics this study willexamine: 1) location of services (home-based, center-based, mixed), 2) type of service(multidisciplinary, single disciplinary), 3) monthly duration (total mean hours per month), 4)service structure (individual, group, both), 5) degree of structure (very structured, somewhatstructured, loosely structured) 6) amount (if any) of other services.
6 With regard to characteristics, primary caregiver is used in this report in place of mother to include situationswhere the child is living with a caregiver other than or in addition to the mother. It should be noted that theliterature usually refers to these characteristics as mother’s health and mother’s education level.

67
The types of services and their characteristics will be noted by early intervention staff onMonthly Service Records. Parents will be asked whether they are receiving any otherservices periodically (approximately every six months) through the course of the study.
To provide program service information, services will be observed every six months tovalidate information presented in the Monthly Service Reports.
Phase I
Child Outcomes and Measures
These outcomes reflect the growing trend in early intervention evaluation which recognizesthat the purpose of early intervention is to encourage children with delaying or disablingconditions and their families to become contributing members of society. Child outcomeassessment will occur in four domains: 1) Developmental Skills, 2) Health, 3) Child-ParentInteraction, and 4) Readiness to Learn.
Developmental skills incorporate the five basic development areas which are assessed inorder to qualify for early intervention services: 1) cognitive development, 2)communication, 3) social competence (social/emotional), 4) adaptive (level ofindependence), and 5) physical (vision, hearing, motor). The child health outcomeincorporates the idea that the child receiving services has the best possible health. Theoutcome, school readiness, reflects the general ability of children to learn in school. Theeducational experience is important for all children in that it forms the basis for furtherlearning throughout their lives. It has been determined that five attributes enable children todo well in school. They are confidence, curiosity, persistence, capacity to communicate, andcapacity to get along with others. Such qualities are developed in children within the firstthree years of life. It is especially important for children with disabling or delayingconditions to develop school readiness. The more children are ready to learn, the more theycan contribute to the classroom, to the work force, and to society (Heart Start: TheEmotional Foundations of School Readiness, 1992). For the outcome, child-parentinteraction, two indicators have been selected, responsivity and reciprocity. Responsivityrefers to the degree which the child initiates interactions with the parent, and the degree ofreceptiveness the child exhibits towards parent-initiated interactions. Reciprocity indicatesthe degree which the child understands the intention of the parent’s interaction.
Standardized tests designed for these specific outcomes will be used for assessment. Theinstruments specified in the following table are suggestions only. The research team shouldreview the literature at the time of the study as instruments are constantly under review andundergo revision.

68
CHILD OUTCOMES, INDICATORS, AND SUGGESTED INSTRUMENTS
Child Outcomes Suggested Instruments
1) Developmental Skills
a. cognitive development
b. communication
c. social competence (social/emotional)
d. adaptive (level of independence)
e. physical (motor, vision, hearing)
Standardized Tests
[e.g. Pediatric Evaluation of DisabilityInventory (PEDI) (Hayley et al., 1992);Developmental Sequence PerformanceInventory (DSPI) (B to 8); MacArthurCommunication Development Inventory(Fenson et al., 1993)]
2) Health
a. children have the best possible health
Standardized Lists
[e.g. General Health Ratings Index (Eisen etal., 1980)]
3) Child-Parent Interaction
a. responsivity
b. reciprocity
Standardized Tests
[e.g. Nursing Child Assessment Teaching Scale(NCATS) (Barnard, 1978; Barnard et al.,1989; Barnard and Kelly, 1990)]
4) Readiness to Learn
a. confidence
b. curiosity
c. persistence
d. capacity to communicate
e. capacity to get along with others
Standardized Tests
[e.g. Bayley Scales of Infant Development(Bayley, 2nd edition, 1993), EICS ObservationScale of Children’s Spontaneous Play (Belskyet al., 1983)]
Family Outcomes and Measures
Four family outcomes have been selected for this study: 1) knowledge, 2) empowerment, 3)parent-child interaction, and 4) social support. Under the broad outcome category ofknowledge, three indicators will be examined: 1) knowledge of child’s disability, 2)understanding what the child needs to enhance development, and 3) ability to read child’scues. Input from parents along with family outcomes conceptualized by some researchersconfirm that these are four desirable family outcomes of early intervention (Bailey et al.,1998; Goldberg, 1977; Turnbull et al., in press). Knowledge is considered essential to fosterthe family’s capacity to enhance their child’s development.
69
Empowerment has been defined by Staples (1990) as “the ongoing capacity of individuals orgroups to act on their own behalf to achieve a greater measure of control over their lives anddestinies.” Empowerment may include a sense of self-efficacy and the perception of controlover life events (Bailey et al., 1998; Conger and Kanungo, 1988). Dunst et al. (1988) andTurnbull and Turnbull (1997) see empowerment as the degree to which family membersperceive they can negotiate the system and feel a sense of efficacy or control over access tosupports and services. The three indicators chosen for empowerment are the following: 1)confidence in ability to enhance child’s development, 2) confidence in ability to interactwith professionals and advocate for services, and 3) locus of control (perception of self-empowerment).
The importance of parent-child interaction is well noted in the literature (Barnard et al.,1989; Barnard and Kelly, 1990; Kelly and Barnard, in press; Resnick et al., 1988; Seifer andSameroff, 1991). Two indicators of parent-child interaction, responsiveness and reciprocity,have been selected for the study. Responsiveness is the ability of the parent to initiatedesired interactions with the child and respond to child initiated interaction. Reciprocity isthe degree to which the parent can successfully communicate with the child.
The emergence of social support as an important factor directly affecting child and familydevelopment has drawn value and importance to the role of early intervention in helping toestablish social support networks (Dunst, et al., 1997). Turnbull and Turnbull (1997)suggest that early intervention services can assist parents in generating support networkswhich facilitate acquiring basic economic and social needs. Two indicators chosen for thisoutcome are economic and social support. Economic support refers to the ability of thefamily to provide basic needs such as food, shelter, clothing, and medical attention(Turnbull and Turnbull, 1997). While providing economic support is not a direct role ofearly intervention , linking families to services such as Medicaid, Supplemental SecurityIncome, and housing, food, and economic assistance is critical to establishing a healthydevelopmental environment for children. Social support refers to the existence of a networkof contacts that can fulfill the family’s needs on a variety of levels (Dunst et al., 1997).
Standardized tests designed for these specific outcomes will be used for assessment. Theinstruments specified in the following table are suggestions only. The research team shouldreview the literature at the time of the study as instruments are constantly under review andundergo revision.
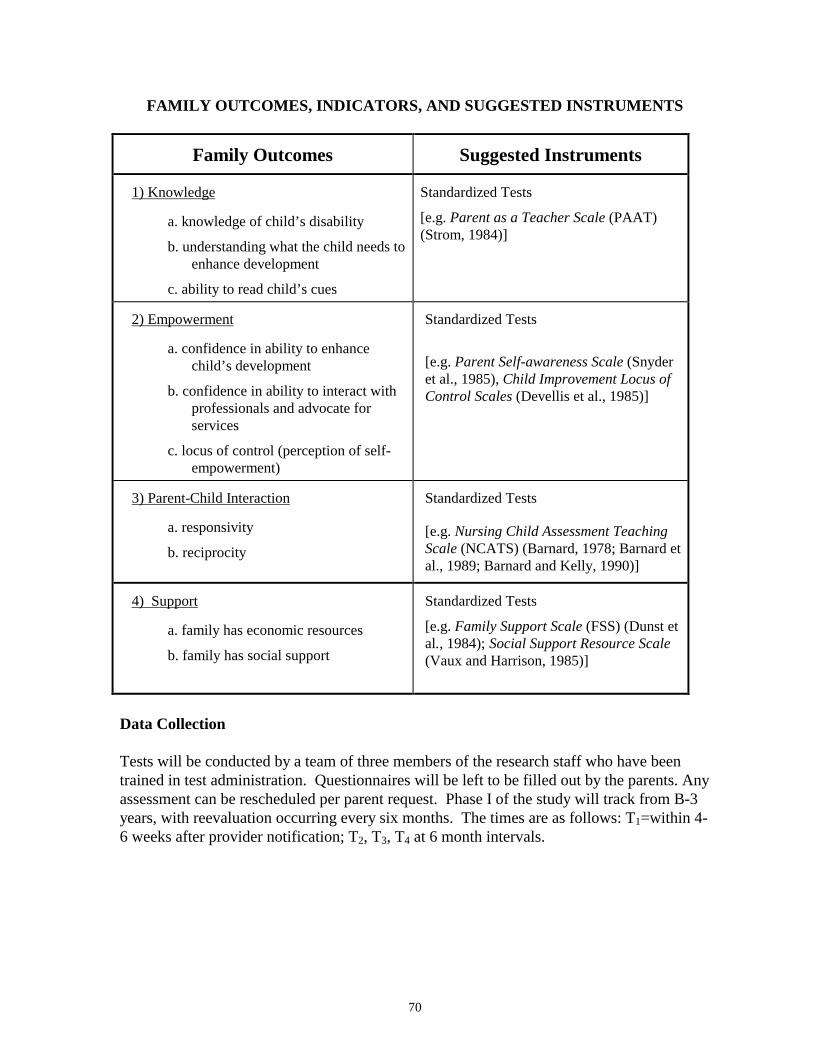
70
FAMILY OUTCOMES, INDICATORS, AND SUGGESTED INSTRUMENTS
Family Outcomes Suggested Instruments
1) Knowledge
a. knowledge of child’s disability
b. understanding what the child needs toenhance development
c. ability to read child’s cues
Standardized Tests
[e.g. Parent as a Teacher Scale (PAAT)(Strom, 1984)]
2) Empowerment
a. confidence in ability to enhancechild’s development
b. confidence in ability to interact withprofessionals and advocate forservices
c. locus of control (perception of self-empowerment)
Standardized Tests
[e.g. Parent Self-awareness Scale (Snyderet al., 1985), Child Improvement Locus ofControl Scales (Devellis et al., 1985)]
3) Parent-Child Interaction
a. responsivity
b. reciprocity
Standardized Tests
[e.g. Nursing Child Assessment TeachingScale (NCATS) (Barnard, 1978; Barnard etal., 1989; Barnard and Kelly, 1990)]
4) Support
a. family has economic resources
b. family has social support
Standardized Tests
[e.g. Family Support Scale (FSS) (Dunst etal., 1984); Social Support Resource Scale(Vaux and Harrison, 1985)]
Data Collection
Tests will be conducted by a team of three members of the research staff who have beentrained in test administration. Questionnaires will be left to be filled out by the parents. Anyassessment can be rescheduled per parent request. Phase I of the study will track from B-3years, with reevaluation occurring every six months. The times are as follows: T1=within 4-6 weeks after provider notification; T2, T3, T4 at 6 month intervals.
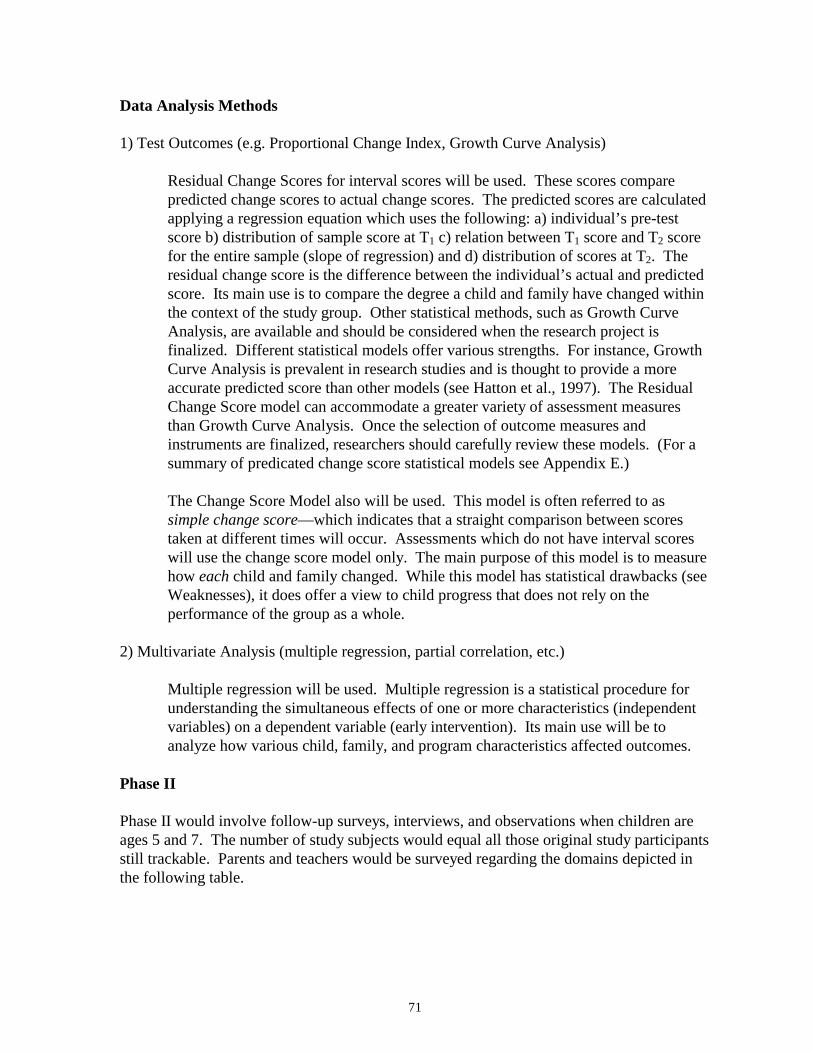
71
Data Analysis Methods
1) Test Outcomes (e.g. Proportional Change Index, Growth Curve Analysis)
Residual Change Scores for interval scores will be used. These scores comparepredicted change scores to actual change scores. The predicted scores are calculatedapplying a regression equation which uses the following: a) individual’s pre-testscore b) distribution of sample score at T1 c) relation between T1 score and T2 scorefor the entire sample (slope of regression) and d) distribution of scores at T2. Theresidual change score is the difference between the individual’s actual and predictedscore. Its main use is to compare the degree a child and family have changed withinthe context of the study group. Other statistical methods, such as Growth CurveAnalysis, are available and should be considered when the research project isfinalized. Different statistical models offer various strengths. For instance, GrowthCurve Analysis is prevalent in research studies and is thought to provide a moreaccurate predicted score than other models (see Hatton et al., 1997). The ResidualChange Score model can accommodate a greater variety of assessment measuresthan Growth Curve Analysis. Once the selection of outcome measures andinstruments are finalized, researchers should carefully review these models. (For asummary of predicated change score statistical models see Appendix E.)
The Change Score Model also will be used. This model is often referred to assimple change score—which indicates that a straight comparison between scorestaken at different times will occur. Assessments which do not have interval scoreswill use the change score model only. The main purpose of this model is to measurehow each child and family changed. While this model has statistical drawbacks (seeWeaknesses), it does offer a view to child progress that does not rely on theperformance of the group as a whole.
2) Multivariate Analysis (multiple regression, partial correlation, etc.)
Multiple regression will be used. Multiple regression is a statistical procedure forunderstanding the simultaneous effects of one or more characteristics (independentvariables) on a dependent variable (early intervention). Its main use will be toanalyze how various child, family, and program characteristics affected outcomes.
Phase II
Phase II would involve follow-up surveys, interviews, and observations when children areages 5 and 7. The number of study subjects would equal all those original study participantsstill trackable. Parents and teachers would be surveyed regarding the domains depicted inthe following table.
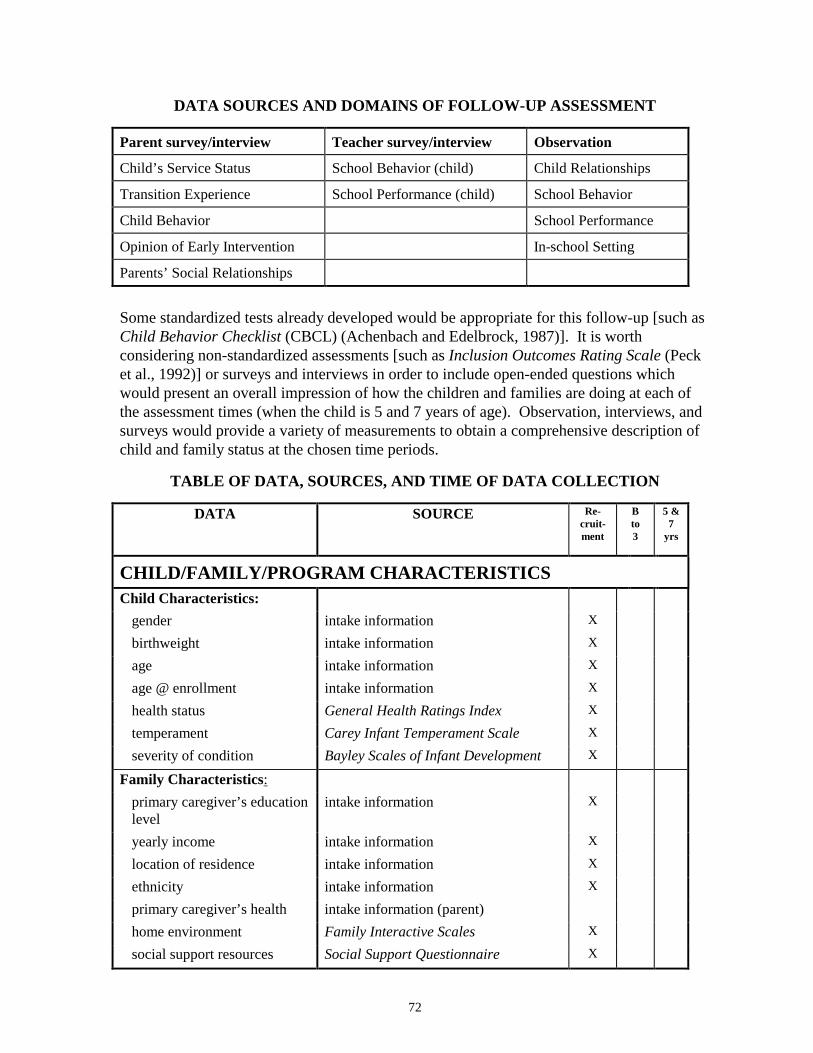
72
DATA SOURCES AND DOMAINS OF FOLLOW-UP ASSESSMENT
Parent survey/interview Teacher survey/interview Observation
Child’s Service Status School Behavior (child) Child Relationships
Transition Experience School Performance (child) School Behavior
Child Behavior School Performance
Opinion of Early Intervention In-school Setting
Parents’ Social Relationships
Some standardized tests already developed would be appropriate for this follow-up [such asChild Behavior Checklist (CBCL) (Achenbach and Edelbrock, 1987)]. It is worthconsidering non-standardized assessments [such as Inclusion Outcomes Rating Scale (Pecket al., 1992)] or surveys and interviews in order to include open-ended questions whichwould present an overall impression of how the children and families are doing at each ofthe assessment times (when the child is 5 and 7 years of age). Observation, interviews, andsurveys would provide a variety of measurements to obtain a comprehensive description ofchild and family status at the chosen time periods.
TABLE OF DATA, SOURCES, AND TIME OF DATA COLLECTION
DATA SOURCE Re-cruit-ment
Bto3
5 &7
yrs
CHILD/FAMILY/PROGRAM CHARACTERISTICSChild Characteristics:
gender intake information X
birthweight intake information X
age intake information X
age @ enrollment intake information X
health status General Health Ratings Index X
temperament Carey Infant Temperament Scale X
severity of condition Bayley Scales of Infant Development X
Family Characteristics:primary caregiver’s educationlevel
intake information X
yearly income intake information X
location of residence intake information X
ethnicity intake information X
primary caregiver’s health intake information (parent)home environment Family Interactive Scales X
social support resources Social Support Questionnaire X
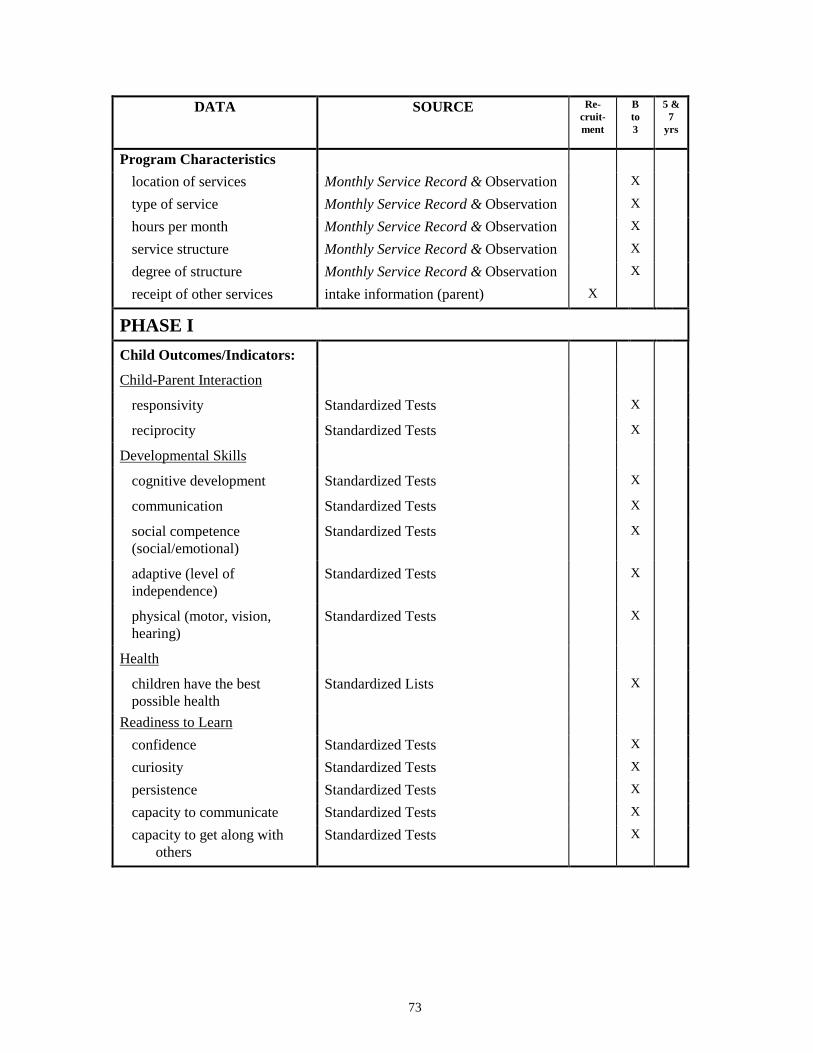
73
DATA SOURCE Re-cruit-ment
Bto3
5 &7
yrs
Program Characteristicslocation of services Monthly Service Record & Observation X
type of service Monthly Service Record & Observation X
hours per month Monthly Service Record & Observation X
service structure Monthly Service Record & Observation X
degree of structure Monthly Service Record & Observation X
receipt of other services intake information (parent) X
PHASE IChild Outcomes/Indicators:
Child-Parent Interaction
responsivity Standardized Tests X
reciprocity Standardized Tests X
Developmental Skills
cognitive development Standardized Tests X
communication Standardized Tests X
social competence(social/emotional)
Standardized Tests X
adaptive (level ofindependence)
Standardized Tests X
physical (motor, vision,hearing)
Standardized Tests X
Health
children have the bestpossible health
Standardized Lists X
Readiness to Learnconfidence Standardized Tests X
curiosity Standardized Tests X
persistence Standardized Tests X
capacity to communicate Standardized Tests X
capacity to get along withothers
Standardized Tests X
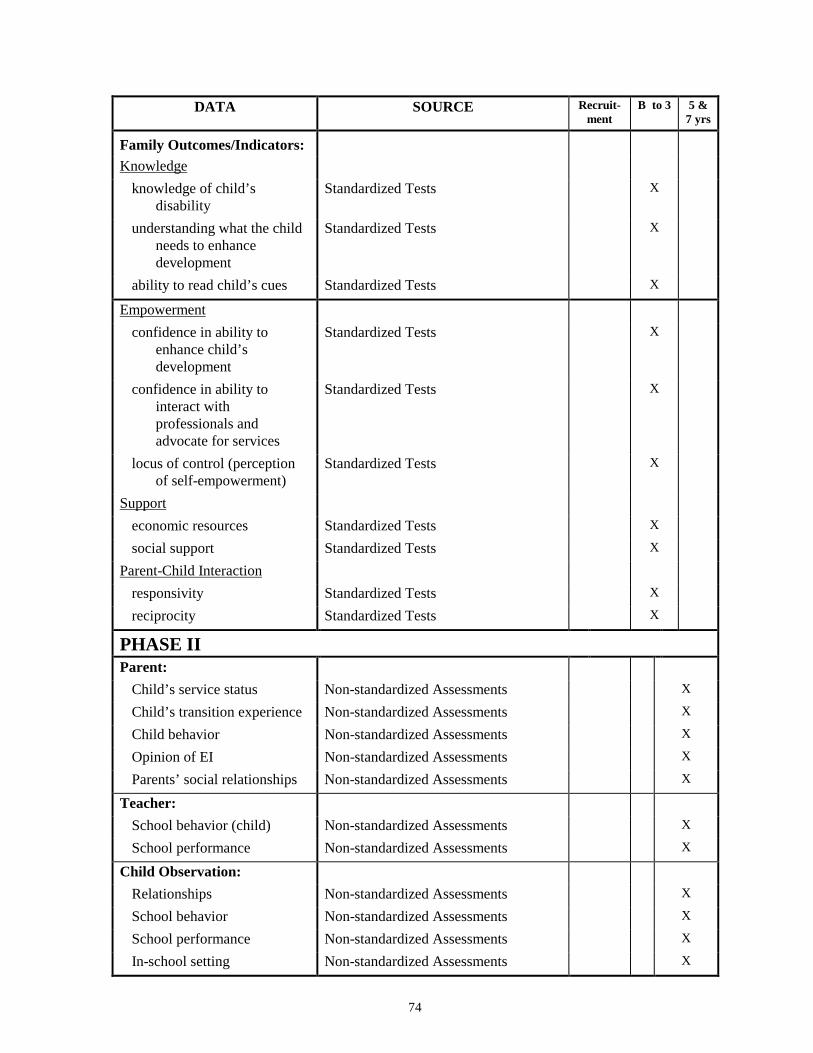
74
DATA SOURCE Recruit-ment
B to 3 5 &7 yrs
Family Outcomes/Indicators:Knowledge
knowledge of child’sdisability
Standardized Tests X
understanding what the childneeds to enhancedevelopment
Standardized Tests X
ability to read child’s cues Standardized Tests X
Empowermentconfidence in ability to
enhance child’sdevelopment
Standardized Tests X
confidence in ability tointeract withprofessionals andadvocate for services
Standardized Tests X
locus of control (perceptionof self-empowerment)
Standardized Tests X
Supporteconomic resources Standardized Tests X
social support Standardized Tests X
Parent-Child Interactionresponsivity Standardized Tests X
reciprocity Standardized Tests X
PHASE IIParent:
Child’s service status Non-standardized Assessments X
Child’s transition experience Non-standardized Assessments X
Child behavior Non-standardized Assessments X
Opinion of EI Non-standardized Assessments X
Parents’ social relationships Non-standardized Assessments X
Teacher:School behavior (child) Non-standardized Assessments X
School performance Non-standardized Assessments X
Child Observation:Relationships Non-standardized Assessments X
School behavior Non-standardized Assessments X
School performance Non-standardized Assessments X
In-school setting Non-standardized Assessments X

75
TIMELINE
The total time for the study is estimated at 10 years.
TIMELINE FOR CHILD/FAMILY SERVES AS OWN CONTROL—LARGE SCALE LONGITUDINAL STUDY
STUDYYEAR
1 2 3 4 5 6 7 8 9 10
Age of Year2 Subjects
.5-3years
1.5-4years
2.5-5years
3.5-6years
4.5-7years
5.5-8years
6.5-9years
Age of Year3 Subjects
.5-3years
1.5-4years
2.5-5years
3.5-6years
4.5-7year
5.5-8years
6.5-9years
OrganizeStudy*
X
Recruit X X
Phase I X X X X X
Phase II X X X X X X
AnalysisPhase I
X
CompletedReport
X
* (hire staff, Human Research Review Board, establish criteria, establish recruiting sites)
DIRECT COST ELEMENTS
Cost estimates include only the direct costs of conducting the study. Indirect cost rates (tocover organizational overhead) vary widely depending on the type of organization, such asuniversity, for-profit research center, or state agency. Depending on the specific indirectcost rate, indirect costs may represent 10 to 60 percent, or more, of the direct costs. Withadditional expenses for rent or lease for project space and indirect costs, total costs (directplus indirect) could be double the estimated direct costs presented. This study will incur thefollowing direct cost elements:
∗ Participant Payment— subjects and service providers will be reimbursed for their time/effort in participation of the study
∗ Research Staff∗ Supplies/Equipment∗ Other (e.g. travel, postage)
TOTAL ESTIMATED DIRECT COST: $3,200,000—3,600,000

76
DISCUSSION
Previous Studies
One difficulty facing studies of this nature is the number of subjects required to carry outmultivariate analysis. The greater the number of variables included in the study, the morestudy subjects are required. As a result, many studies using the predicted change scoremodel have taken into account too few determining child/family characteristics and havefocused on evaluating a single program component or model (Caro and Derevensky, 1991,1991; Wolery et al., 1985). Few have been longitudinal. Although results have beenpositive for child development (Bailey and Bricker, 1985; Caro and Derevensky, 1991;Fewell et al., 1996; Hanson, 1985; Oelwein et al., 1985; Wolery et al. 1985), familyresources and support (Caro and Derevensky, 1991), family skills (Bailey and Bricker,1985; Caro and Derevensky, 1991; Hanson, 1985), and parent satisfaction (Bailey andBricker, 1985; Hanson, 1985), these results have to be considered within thesemethodological shortcomings.
One study which has generated the required number of subjects to carry out validmultivariate analysis was able to demonstrate the positive effects of early intervention byspecifying which components of early intervention succeeded for which type of child andfamily (Shonkoff et al., 1992). These findings have shaped current research in therecognition that early intervention is “a complex and multidimensional experience thatdefies simple description” (Shonkoff et al. 1992). Short of a randomized control groupstudy, the accurate assessment of the general impact of early intervention largely depends onthe accuracy in, and ability to control for, contributing developmental factors of each familyand child. Implications are that future research should be multidimensional (Guralnick,1997; Hauser-Cram, 1990).
Characteristics
Past research is rich in terms of which variables predict developmental delay (HealthyPeople 2000, 1991; King et al., 1992; Rojahn et al., 1993), but to what degree thesecharacteristics affect developmental progress in the long term is less conclusive. Childcharacteristics used in this study represent those that are currently considered to be primaryinfluencing factors in child development (King et al., 1992; Kochanek et al., 1987). Thefamily characteristics in this study are those thought to impact child and family development(Boyce et al., 1991; Andrews et al., 1995; King et al., 1992; Ramey et al., 1978). More thanforty-five characteristics thought to influence the development of children with delaying ordisabling conditions and their families have been noted in previous studies or the earlyintervention research. Due to feasibility concerns, this study takes into consideration onlythose characteristics that are most prevalent in current literature.
Recent research has produced numerous studies on the impact of specific elements ofintervention programs (Bennet and Guralnick, 1991; Casto and White, 1993; Ramey et al.,1992; Seifer et al., 1991; Taylor, 1993). Program components in this study have been
77
drawn from this body of work, and from similar studies which suggest that other externalelements, such as location of service center (rural or urban), may influence effectiveness(Lonner et al., Exploratory Study of Barriers to Birth to Three Services, 1994). Similar tochild and family characteristics, program components have been narrowed to those mostpredominant in contemporary research.
Outcomes
Part of the purpose of early intervention is to assist children in developing skills that willallow them to participate in valued roles in the community, perform to the best of theirability in school and be able to become contributing members of society. To assess thesegoals, outcomes other than IQ, such as adaptive, communication and social skills havebecome prevalent (Guralnick, 1991 and 1989; Casto and Lewis, 1984; Hauser-Cram andShonkoff, 1988). The outcomes in this study were chosen from stated goals in national PartH legislation [Individuals with Disabilities Education Act (IDEA), 1997], recommendationsfrom national councils on early education (Outcome Measures for Early InterventionServices, Accreditation Council for People with Disabilities, 1995; Starting Points,Carnegie Foundation, 1994; Healthy People 2,000, 1991; Heart Start: The EmotionalFoundations of School Readiness, 1992), the literature (Guralnick, 1997; Shonkoff et al.,1992), and recommendations from the Advisory Group of this project (1998).
Since the passage of Part H, programs have emphasized family centered services and in sodoing have generated a new direction of early intervention research. While previous studiesfocused solely on child development, current research has begun to discuss and assessimpact of early intervention on families especially in the areas of family support, familyempowerment, parent child interaction, and the skills needed to enhance a child’s potentialfor development (Boyce, 1993; Casto and White, 1993; Cleary, 1988; Crowley and Taylor,1993:4; Gallagher, 1996; Kelly and Barnard, in press; Turnbull et al., in press). Familyoutcomes in this study reflect these categories.
ISSUES
General Issues
Consideration should be given to general social science research difficulties. While themethodology addresses some of these problems, the final study report should address issuessuch as:
• Generalizability• Possible Threats to Validity
Selection effects (biases in the study sample, absence of a control group) Hawthorne effect (especially pertinent for ratings obtained by observation) Testing effects (given the amount of re-testing, this could be a problem;
although less so for observable phenomena) History Attrition

78
• Problems of instrument sensitivity
Additional consideration should be given to the feasibility issues of the study. The timerequired to achieve reasonable numbers of subjects and collect data is estimated at 10 years.Success of recruitment will depend on extent of participation among providers, frequency ofconditions, and refusal rates. It might be difficult to recruit 260 subjects. If this is the case,the study could take longer than 10 years.
Strengths
One major strength of this study is its comprehensiveness in addressing many of theshortcomings of other early intervention research such as failure to take into considerationdetermining independent variables, low subject numbers, and inadequate comparisongroups. In this study, frequently cited program, family, and child characteristics have beenselected. In controlling for these independent variables known to affect child development,conclusions regarding the effect of early intervention on child development can be drawnmore reliably than if these characteristics were not taken into consideration. The study willalso allow analysis of how these characteristics interact.
Another major strength is that by using children as their own controls, researchers will beable to draw conclusions regarding each child and family. Given the diversity of conditions,learning styles, and independent variables affecting development, the definition of positiveimpact is different for every child and family. By isolating which program techniques workfor which types of children and families, program personnel, government agencies, andlegislators will be able to analyze how to use resources effectively and efficiently. Usingchildren and families as their own controls avoids numerical difficulties in drawing generalconclusions. As discussed earlier in this chapter, positive impact can occur on manylevels—maintenance of developmental achievements can be a very positive impact for onechild, whereas increase of developmental levels are expected for other groups of children.A comparison of the numerical results of a child who maintains a level of development toone who improves might dilute the overall numerical gain. If the progress of each child andfamily is reviewed, however, conclusions regarding each study participant can be drawn andwill not be lost in a larger picture that does not explain important details.
This particular methodology also facilitates within group comparisons. Data from subjectswho do particularly well can be analyzed to ascertain which particular children and familiesrespond positively to which program elements. General conclusions regarding the degree ofchange of study participants can be obtained through residual change scores. Using residualchange score methods allows general conclusions to be drawn regarding the progress of theentire group as well as a particular subjects’ progress within than group. Thus this studyprovides both individual assessments, and within group assessments. A general groupassessment can be made with regard to whether the group as a whole improved bycomparing group baseline data to data gathered at future points in time and usingcomparative residual change scores.
79
Weaknesses
The study has numerous drawbacks, some of more concern than others. One difficulty isthe choice of characteristics (independent variables). A range of child, family, and programcharacteristics known to affect child development has been selected for this study. Suchcharacteristics must be controlled for in order to attribute changes in child and familyoutcomes to early intervention, and not to other variables. All characteristics have not beentaken into consideration; in part because all of them are not known, and in part becausegenerating the subject numbers necessary to control for all known independent variableswould not be feasible. In addition, some chosen characteristics may face problems ofdefinition. For instance, one of the selected program characteristics is degree of structure.Researchers should determine in advance what will constitute a highly structured programas opposed to a loosely structured program, and who will be rating the program onstructure—the service provider or researcher.
A major problem with the design is that the strength of the conclusions rely on theacceptance of the validity of predicted change scores and simple change scores. Both ofthese processes have statistical drawbacks (see Appendix E). The main concern with theresidual change score model is that it relies heavily on group changes since part of theregression equation predicting how an individual child will change depends on how thegroup as a whole changes. In this way, progress is a relative measure. The main concernwith simple change scores is that the reliability of the standardized tests creates statisticalproblems. When comparing changes, the error in each individual measure is compounded.For example, a child scored 13 points on a curiosity scale and the test was accurate to within2 points. The child’s actual score may be as low as 11 or as high as 15. The same childscored 15 on the next test and again, the test is accurate to within two points. The secondscore could be as low as 13 or as high as 17. In terms of accuracy, while the obvious simplechange score is 2 (13:15) a possible change score may be 6 (11:17) or 0 (13:13). Thevariety in these scores undermines the accuracy of the measure of change.
A related weakness is the general problem with instrument validity and sensitivity.Measuring such concepts as curiosity or perception of self-confidence is difficult, especiallyin the age range of birth to three. This design relies heavily on standardized testing. Itshould be kept in mind, however, that despite vast improvements over the last decade,testing still lacks the validity researchers would like to see and problems with culturalsensitivity, accuracy in measuring the outcome or indicator, relevance for the populationwith disabling or delaying conditions, and sensitivity to small changes still exist.
It also should be noted that given the amount of testing and information collection, the studymight be intrusive for participants. In addition, time and money factors associated with thisstudy should be considered carefully. While it is beneficial to follow subjectslongitudinally, a ten-year study is a large commitment of time and resources. During thetime of the study, many changes may occur which affect early intervention programs and theway they are implemented. How future changes will influence the results and continuanceof the study is unknown.

80
SUMMARY: STRENGTHS/WEAKNESSES/TIME/ESTIMATED DIRECT COST
Major Strengths:
• The study would allow determination of which program components work for whichchildren/ families.
• The design takes into account the multiple variables influencing child and familyoutcomes.
• The design reflects current recommendations regarding early intervention research.
Major Weaknesses:
• Conclusions rely heavily on residual change score and change score models.
• There may be a significant problem recruiting enough study subjects.
• Instrument sensitivity, validity.
• Estimated cost and time of completion.
ESTIMATED DIRECT COST: $3,200,000—$3,600,000
ESTIMATED COMPLETION TIME: 10 years
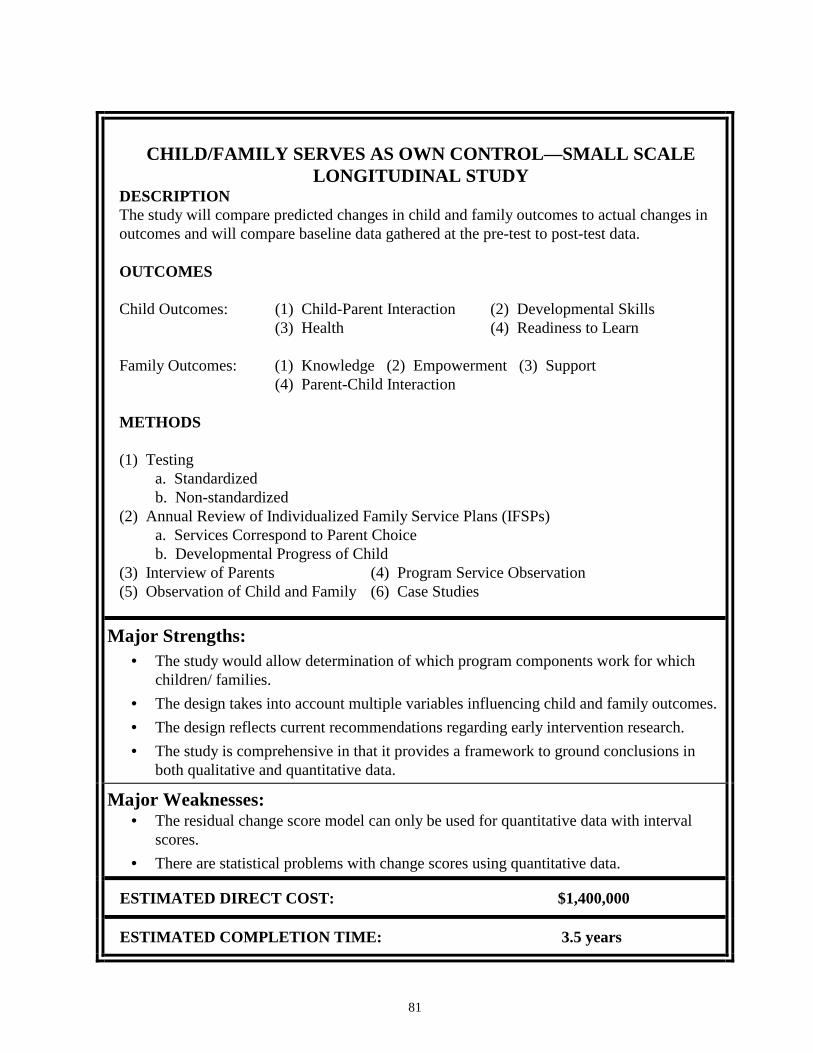
81
CHILD/FAMILY SERVES AS OWN CONTROL—SMALL SCALELONGITUDINAL STUDY
DESCRIPTIONThe study will compare predicted changes in child and family outcomes to actual changes inoutcomes and will compare baseline data gathered at the pre-test to post-test data.
OUTCOMES
Child Outcomes: (1) Child-Parent Interaction (2) Developmental Skills(3) Health (4) Readiness to Learn
Family Outcomes: (1) Knowledge (2) Empowerment (3) Support(4) Parent-Child Interaction
METHODS
(1) Testinga. Standardizedb. Non-standardized
(2) Annual Review of Individualized Family Service Plans (IFSPs)a. Services Correspond to Parent Choiceb. Developmental Progress of Child
(3) Interview of Parents (4) Program Service Observation(5) Observation of Child and Family (6) Case Studies
Major Strengths:• The study would allow determination of which program components work for which
children/ families.• The design takes into account multiple variables influencing child and family outcomes.• The design reflects current recommendations regarding early intervention research.• The study is comprehensive in that it provides a framework to ground conclusions in
both qualitative and quantitative data.
Major Weaknesses:• The residual change score model can only be used for quantitative data with interval
scores.• There are statistical problems with change scores using quantitative data.
ESTIMATED DIRECT COST: $1,400,000
ESTIMATED COMPLETION TIME: 3.5 years
82
CHILD/FAMILY SERVES AS OWN CONTROL—SMALL SCALELONGITUDINAL STUDY
SUMMARY
This study is a scaled down version of the previous large scale study where children andfamilies serve as their own control. In this study, the school-age longitudinal element hasbeen removed, and the number of standardized tests have been vastly reduced and replacedwith a number of different assessment approaches. Recruitment, eligibility requirements,background characteristics and methods for obtaining them, and the relevant literature arethe same as the larger study. Child and family outcomes and indicators are also the same.The number of subjects has been reduced from 260 to 220, with the expectation that ashorter study will have a lower attrition rate (10 percent). The discussion which followsconcentrates on those elements which differ in the study.
INTRODUCTION
The previous study relies heavily on standardized tests. While these tests include a varietyof techniques to gather information such as observations [e.g. Nursing Child AssessmentTeaching Scale (NCATS) (Barnard, 1978; Barnard et al., 1989; Barnard and Kelly, 1990],questionnaires [e.g. Family Support Scale (FSS) (Dunst et al., 1984)], and structuredinterviews [e.g. Child Behavior Checklist (CBCL) (Achenbach and Edelbrock, 1987)],current thought in early intervention assessment suggests that “high quality assessmentincludes the use of several types of instruments and methods, such as informal and formaltesting, observation, and interviews” (Bagnato et al., 1997). Given the problems associatedwith standardized tests (see the section Methodological Challenges in this chapter), researchin early intervention has stressed the importance of balancing the results of these tests withinformal measures and qualitative information (Bagnato et al., 1997; Meisels and Fenichel,1996). Often referred to as triangulation of measurement, this method provides aconstructive and comprehensive assessment of the impact of early intervention as resultscan be interpreted on a variety of levels. The principle of triangulation of measurementinvolves the use of a variety of qualitative and quantitative data in order to interpret theseresults within a fuller framework. If data from standardized tests, informal assessment,interviews, and observations can be drawn together to make conclusions, these conclusionsare better grounded than those that rely on a single type of assessment method which may ormay not portray an accurate picture.
This smaller scale study includes the use of standardized tests along with informalmeasures, structured and non-structured observation, and open-ended interviews. Alsoincluded are a small number of case studies to use as the descriptive context within which tointerpret quantitative data.
The following table summarizes the similarities of this study and the previous one in termsof characteristics and their methods of collection, outcomes, and indicators.
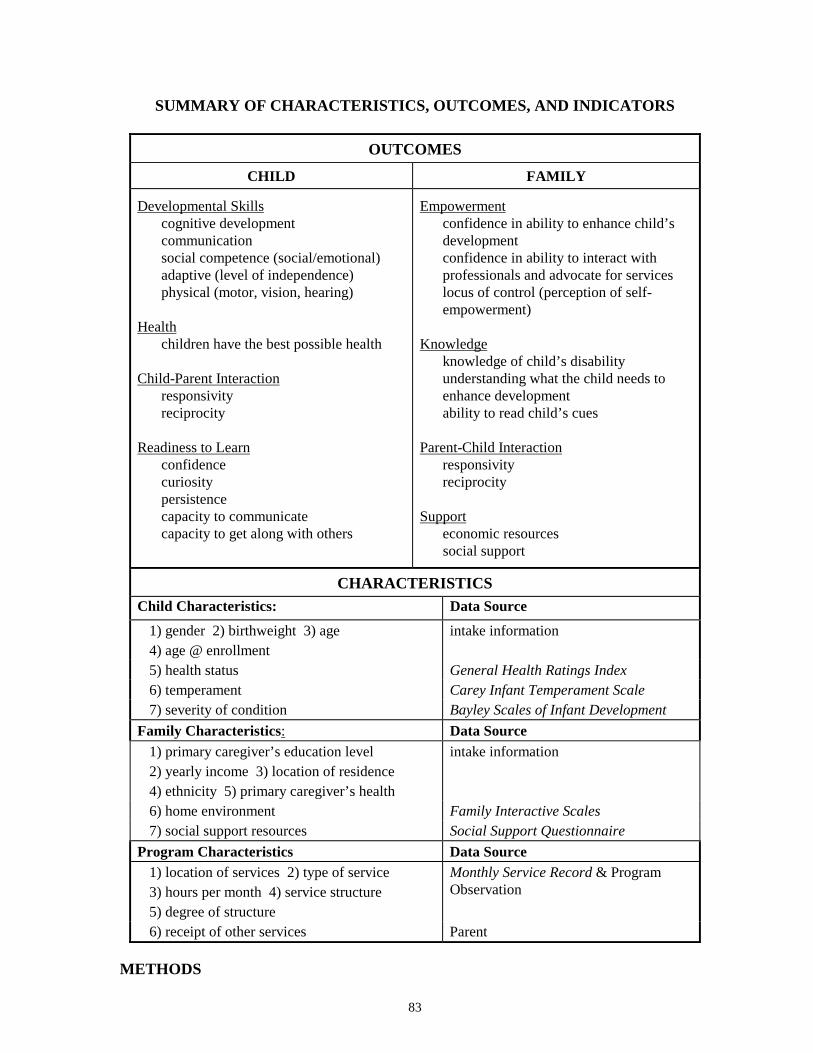
83
SUMMARY OF CHARACTERISTICS, OUTCOMES, AND INDICATORS
OUTCOMESCHILD FAMILY
Developmental Skillscognitive developmentcommunicationsocial competence (social/emotional)adaptive (level of independence)physical (motor, vision, hearing)
Healthchildren have the best possible health
Child-Parent Interactionresponsivityreciprocity
Readiness to Learnconfidencecuriositypersistencecapacity to communicatecapacity to get along with others
Empowermentconfidence in ability to enhance child’sdevelopmentconfidence in ability to interact withprofessionals and advocate for serviceslocus of control (perception of self-empowerment)
Knowledgeknowledge of child’s disabilityunderstanding what the child needs toenhance developmentability to read child’s cues
Parent-Child Interactionresponsivityreciprocity
Supporteconomic resourcessocial support
CHARACTERISTICSChild Characteristics: Data Source
1) gender 2) birthweight 3) age4) age @ enrollment
intake information
5) health status General Health Ratings Index6) temperament Carey Infant Temperament Scale7) severity of condition Bayley Scales of Infant Development
Family Characteristics: Data Source1) primary caregiver’s education level2) yearly income 3) location of residence4) ethnicity 5) primary caregiver’s health
intake information
6) home environment Family Interactive Scales7) social support resources Social Support Questionnaire
Program Characteristics Data Source1) location of services 2) type of service3) hours per month 4) service structure5) degree of structure
Monthly Service Record & ProgramObservation
6) receipt of other services Parent
METHODS
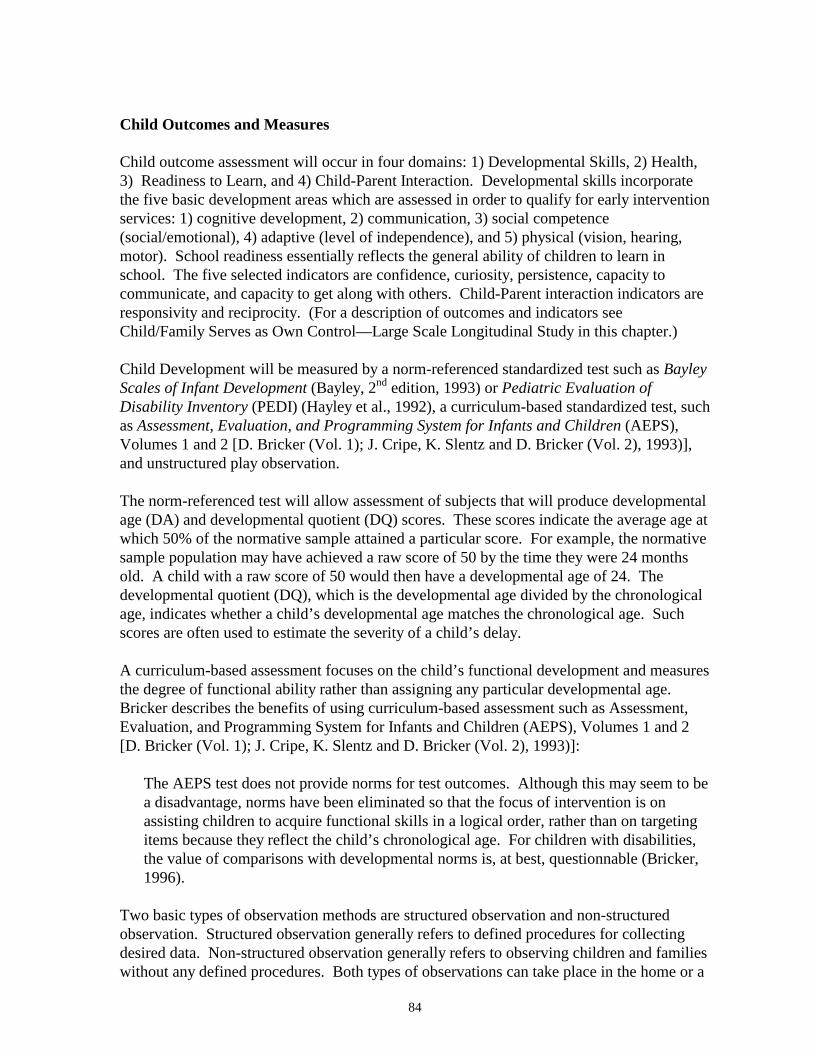
84
Child Outcomes and Measures
Child outcome assessment will occur in four domains: 1) Developmental Skills, 2) Health,3) Readiness to Learn, and 4) Child-Parent Interaction. Developmental skills incorporatethe five basic development areas which are assessed in order to qualify for early interventionservices: 1) cognitive development, 2) communication, 3) social competence(social/emotional), 4) adaptive (level of independence), and 5) physical (vision, hearing,motor). School readiness essentially reflects the general ability of children to learn inschool. The five selected indicators are confidence, curiosity, persistence, capacity tocommunicate, and capacity to get along with others. Child-Parent interaction indicators areresponsivity and reciprocity. (For a description of outcomes and indicators seeChild/Family Serves as Own Control—Large Scale Longitudinal Study in this chapter.)
Child Development will be measured by a norm-referenced standardized test such as BayleyScales of Infant Development (Bayley, 2nd edition, 1993) or Pediatric Evaluation ofDisability Inventory (PEDI) (Hayley et al., 1992), a curriculum-based standardized test, suchas Assessment, Evaluation, and Programming System for Infants and Children (AEPS),Volumes 1 and 2 [D. Bricker (Vol. 1); J. Cripe, K. Slentz and D. Bricker (Vol. 2), 1993)],and unstructured play observation.
The norm-referenced test will allow assessment of subjects that will produce developmentalage (DA) and developmental quotient (DQ) scores. These scores indicate the average age atwhich 50% of the normative sample attained a particular score. For example, the normativesample population may have achieved a raw score of 50 by the time they were 24 monthsold. A child with a raw score of 50 would then have a developmental age of 24. Thedevelopmental quotient (DQ), which is the developmental age divided by the chronologicalage, indicates whether a child’s developmental age matches the chronological age. Suchscores are often used to estimate the severity of a child’s delay.
A curriculum-based assessment focuses on the child’s functional development and measuresthe degree of functional ability rather than assigning any particular developmental age.Bricker describes the benefits of using curriculum-based assessment such as Assessment,Evaluation, and Programming System for Infants and Children (AEPS), Volumes 1 and 2[D. Bricker (Vol. 1); J. Cripe, K. Slentz and D. Bricker (Vol. 2), 1993)]:
The AEPS test does not provide norms for test outcomes. Although this may seem to bea disadvantage, norms have been eliminated so that the focus of intervention is onassisting children to acquire functional skills in a logical order, rather than on targetingitems because they reflect the child’s chronological age. For children with disabilities,the value of comparisons with developmental norms is, at best, questionnable (Bricker,1996).
Two basic types of observation methods are structured observation and non-structuredobservation. Structured observation generally refers to defined procedures for collectingdesired data. Non-structured observation generally refers to observing children and familieswithout any defined procedures. Both types of observations can take place in the home or a
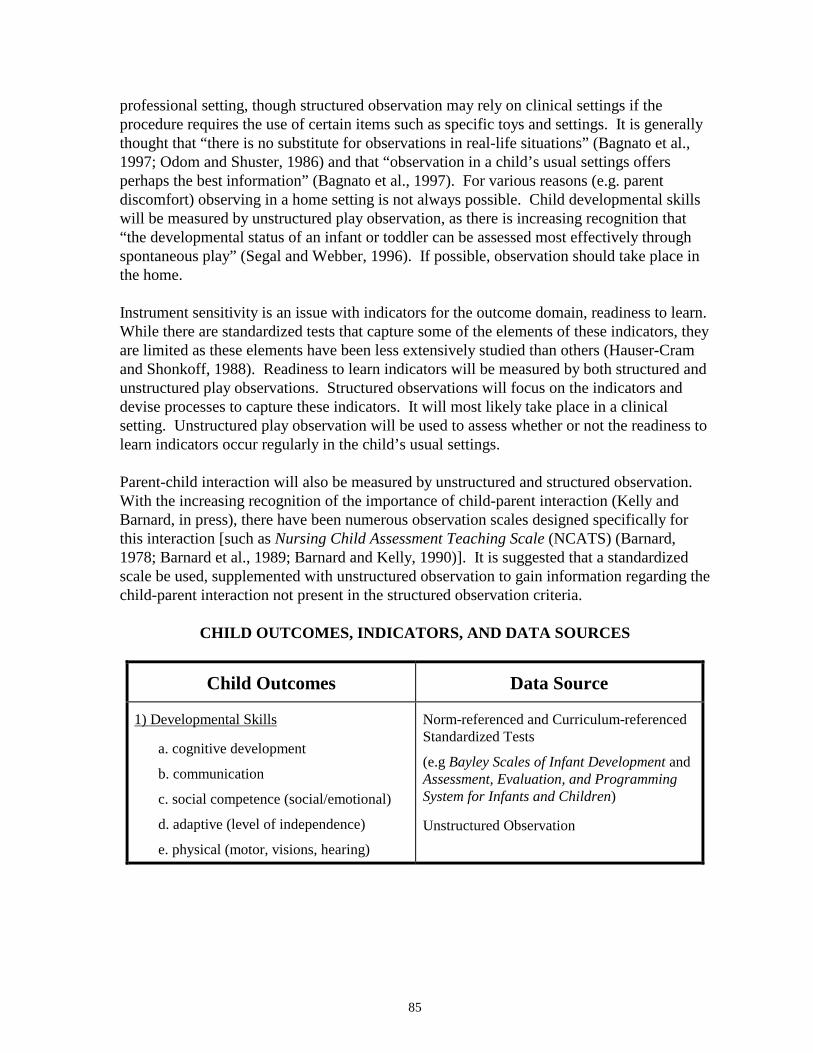
85
professional setting, though structured observation may rely on clinical settings if theprocedure requires the use of certain items such as specific toys and settings. It is generallythought that “there is no substitute for observations in real-life situations” (Bagnato et al.,1997; Odom and Shuster, 1986) and that “observation in a child’s usual settings offersperhaps the best information” (Bagnato et al., 1997). For various reasons (e.g. parentdiscomfort) observing in a home setting is not always possible. Child developmental skillswill be measured by unstructured play observation, as there is increasing recognition that“the developmental status of an infant or toddler can be assessed most effectively throughspontaneous play” (Segal and Webber, 1996). If possible, observation should take place inthe home.
Instrument sensitivity is an issue with indicators for the outcome domain, readiness to learn.While there are standardized tests that capture some of the elements of these indicators, theyare limited as these elements have been less extensively studied than others (Hauser-Cramand Shonkoff, 1988). Readiness to learn indicators will be measured by both structured andunstructured play observations. Structured observations will focus on the indicators anddevise processes to capture these indicators. It will most likely take place in a clinicalsetting. Unstructured play observation will be used to assess whether or not the readiness tolearn indicators occur regularly in the child’s usual settings.
Parent-child interaction will also be measured by unstructured and structured observation.With the increasing recognition of the importance of child-parent interaction (Kelly andBarnard, in press), there have been numerous observation scales designed specifically forthis interaction [such as Nursing Child Assessment Teaching Scale (NCATS) (Barnard,1978; Barnard et al., 1989; Barnard and Kelly, 1990)]. It is suggested that a standardizedscale be used, supplemented with unstructured observation to gain information regarding thechild-parent interaction not present in the structured observation criteria.
CHILD OUTCOMES, INDICATORS, AND DATA SOURCES
Child Outcomes Data Source
1) Developmental Skills
a. cognitive development
b. communication
c. social competence (social/emotional)
d. adaptive (level of independence)
e. physical (motor, visions, hearing)
Norm-referenced and Curriculum-referencedStandardized Tests
(e.g Bayley Scales of Infant Development andAssessment, Evaluation, and ProgrammingSystem for Infants and Children)
Unstructured Observation
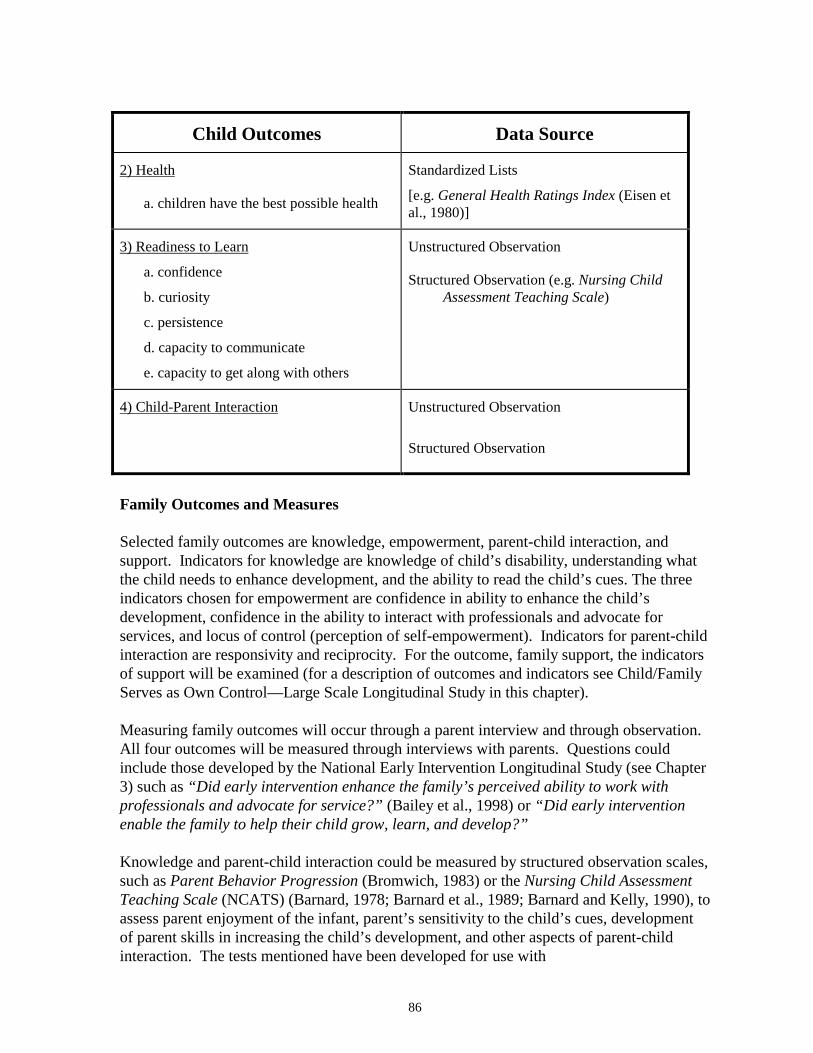
86
Child Outcomes Data Source
2) Health
a. children have the best possible health
Standardized Lists
[e.g. General Health Ratings Index (Eisen etal., 1980)]
3) Readiness to Learn
a. confidence
b. curiosity
c. persistence
d. capacity to communicate
e. capacity to get along with others
Unstructured Observation
Structured Observation (e.g. Nursing ChildAssessment Teaching Scale)
4) Child-Parent Interaction Unstructured Observation
Structured Observation
Family Outcomes and Measures
Selected family outcomes are knowledge, empowerment, parent-child interaction, andsupport. Indicators for knowledge are knowledge of child’s disability, understanding whatthe child needs to enhance development, and the ability to read the child’s cues. The threeindicators chosen for empowerment are confidence in ability to enhance the child’sdevelopment, confidence in the ability to interact with professionals and advocate forservices, and locus of control (perception of self-empowerment). Indicators for parent-childinteraction are responsivity and reciprocity. For the outcome, family support, the indicatorsof support will be examined (for a description of outcomes and indicators see Child/FamilyServes as Own Control—Large Scale Longitudinal Study in this chapter).
Measuring family outcomes will occur through a parent interview and through observation.All four outcomes will be measured through interviews with parents. Questions couldinclude those developed by the National Early Intervention Longitudinal Study (see Chapter3) such as “Did early intervention enhance the family’s perceived ability to work withprofessionals and advocate for service?” (Bailey et al., 1998) or “Did early interventionenable the family to help their child grow, learn, and develop?”
Knowledge and parent-child interaction could be measured by structured observation scales,such as Parent Behavior Progression (Bromwich, 1983) or the Nursing Child AssessmentTeaching Scale (NCATS) (Barnard, 1978; Barnard et al., 1989; Barnard and Kelly, 1990), toassess parent enjoyment of the infant, parent’s sensitivity to the child’s cues, developmentof parent skills in increasing the child’s development, and other aspects of parent-childinteraction. The tests mentioned have been developed for use with
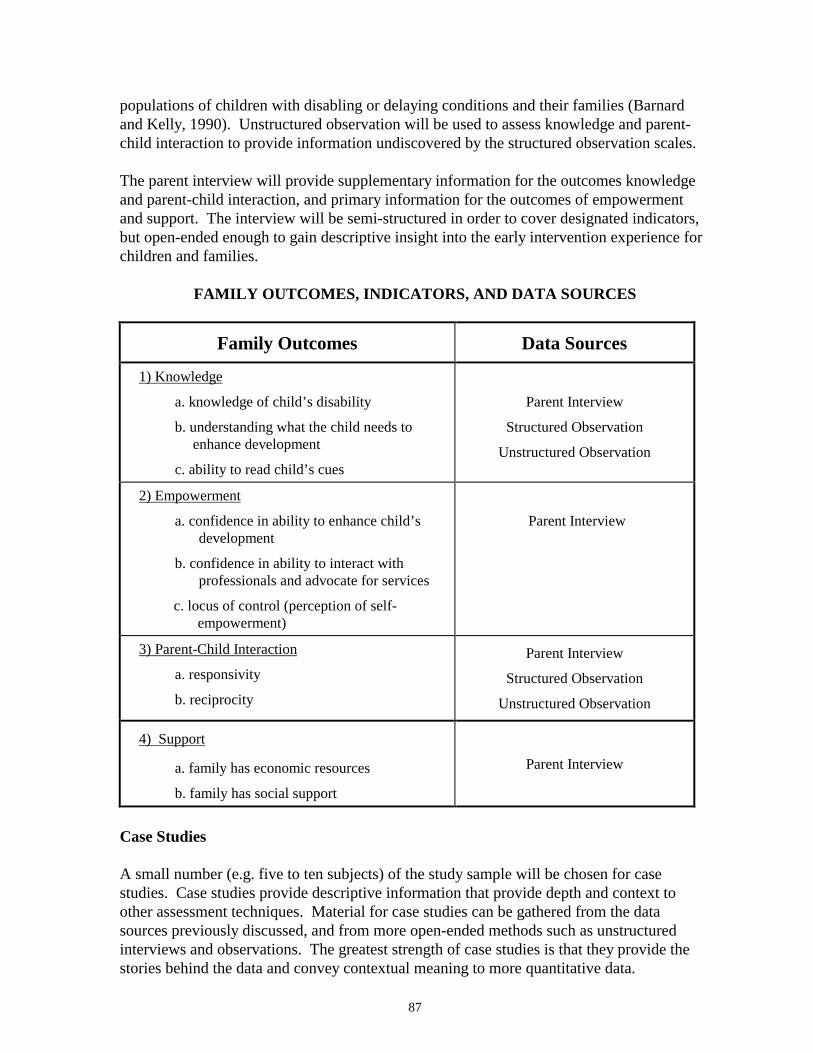
87
populations of children with disabling or delaying conditions and their families (Barnardand Kelly, 1990). Unstructured observation will be used to assess knowledge and parent-child interaction to provide information undiscovered by the structured observation scales.
The parent interview will provide supplementary information for the outcomes knowledgeand parent-child interaction, and primary information for the outcomes of empowermentand support. The interview will be semi-structured in order to cover designated indicators,but open-ended enough to gain descriptive insight into the early intervention experience forchildren and families.
FAMILY OUTCOMES, INDICATORS, AND DATA SOURCES
Family Outcomes Data Sources
1) Knowledge
a. knowledge of child’s disability
b. understanding what the child needs toenhance development
c. ability to read child’s cues
Parent Interview
Structured Observation
Unstructured Observation
2) Empowerment
a. confidence in ability to enhance child’sdevelopment
b. confidence in ability to interact withprofessionals and advocate for services
c. locus of control (perception of self-empowerment)
Parent Interview
3) Parent-Child Interaction
a. responsivity
b. reciprocity
Parent Interview
Structured Observation
Unstructured Observation
4) Support
a. family has economic resources
b. family has social support
Parent Interview
Case Studies
A small number (e.g. five to ten subjects) of the study sample will be chosen for casestudies. Case studies provide descriptive information that provide depth and context toother assessment techniques. Material for case studies can be gathered from the datasources previously discussed, and from more open-ended methods such as unstructuredinterviews and observations. The greatest strength of case studies is that they provide thestories behind the data and convey contextual meaning to more quantitative data.
88
Data Collection
Tests will be conducted by both the research team and program staff who usually work withthe child and family. While some precision may be lost in that the same testers will not beadministering the assessments, participant responsiveness, especially with infants andtoddlers is increased when working with someone they already know (Personal Interview,Maryanne Barnes, executive director, Tacoma Learning Center, 3/24/98). Interviews andobservations will be conducted by trained research staff. Any assessment can berescheduled per parent request. The study will track from birth to three years. T1=within 8weeks after provider notification. T2 at 1 year after T1; T3 at exit of birth to three services.
An annual review of Individualized Family Service Plans (IFSPs) and records will takeplace to gather descriptive information regarding child and family progress. The aim of thereview would be to track the:
a. Correspondence of Services to Parent Choiceb. Developmental Progress of Child
Parent choice may or may not be a prominent part of Individualized Family Service Plans.Since the purpose of the review of IFSPs and records is to provide descriptive information,data regarding whether or not services correspond to family choice can be obtained usinginformation from the program observation and parent interviews as well as recordsinformation.
Similarly, the Individualized Family Service Plans (IFSPs) will reflect outcomes that thechild and family have accomplished. Records information can be used to provide anothermethod to view child development along with test, interview, observation, and case studydata.
Individualized Family Service Plans (IFSPs) could also be reviewed to note whether theyreflect comprehensive, coordinated, family centered, and culturally sensitive services—elements which reflect the aim of federal legislation with regard to early interventionservices for children with disabling or delaying conditions and their families.
Data Analysis Methods
1) Test Outcomes (e.g. Proportional Change Index, Growth Curve Analysis)
Residual Change Scores for interval scores will be used. These scores comparepredicted change scores to actual change scores. The predicted scores are calculatedapplying a regression equation which uses the following: a) individual’s pre-testscore b) distribution of sample score at T1 c) relation between T1 score and T2 scorefor the entire sample (slope of regression) and d) distribution of scores at T2. Theresidual change score is the difference between the individual’s actual and predictedscore. Its main use is to compare the degree a child and family have changed withinthe context of the study group. Other statistical methods, such as Growth CurveAnalysis, are available and should be considered

89
when the research project is finalized. Different statistical models offer variousstrengths. For instance, Growth Curve Analysis is prevalent in research studies andis thought to provide a more accurate predicted score than other models (see Hattonet al., 1997). The Residual Change Score model can accommodate a greater varietyof assessment measures than Growth Curve Analysis. Once the selection ofoutcome measures and instruments are finalized, researchers should carefully reviewthese models. (For a summary of predicated change score statistical models seeAppendix E.)
The Change Score Model also will be used. This model is often referred to assimple change score—which indicates that a straight comparison between scorestaken at different times will occur. Assessments which do not have interval scoreswill use the change score model only. The main purpose of this model is to measurehow each child and family changed. While this model has statistical drawbacks (seeWeaknesses), it does offer a view to child progress that does not rely on theperformance of the group as a whole.
2) Multivariate Analysis (multiple regression, partial correlation, etc.)
Multiple regression will be used. Multiple regression is a statistical procedure forunderstanding the simultaneous effects of one or more characteristics (independentvariables) on a dependent variable (early intervention). Its main use will be toanalyze how various child, family, and program characteristics affected outcomes.
3) Qualitative analysis
Results from the interviews and unstructured observations will be codedsystematically. Some of the data will be presented in summary descriptive form.Other data will be quantified and can be used to draw general conclusions (e.g. 90percent of families interviewed felt professionals respected their choices), or can beused to generate change scores.
TIMELINEThe total time estimated for the study is 3.5 years.
TIMELINE FOR SMALL SCALE LONGITUDINAL STUDY
STUDY YEAR 1 2 3 4Age of Year 1 Subjects .5-3 years 1.5-4 yearsAge of Year 2 Subjects .5-3 years 1.5-4 yearsOrganize Study* XRecruitment X XAssessments X XCompleted Report X
* (hire staff, Human Research Review Board, establish criteria, establish recruiting sites)

90
DIRECT COST ELEMENTS
Cost estimates include only the direct costs of conducting the study. Indirect cost rates (tocover organizational overhead) vary widely depending on the type of organization, such asuniversity, for-profit research center, or state agency. Depending on the specific indirectcost rate, indirect costs may represent 10 to 60 percent, or more, of the direct costs. Withadditional expenses for rent or lease for project space and indirect costs, total costs (directplus indirect) could be double the estimated direct costs presented.
This study will incur the following direct cost elements:
∗ Participant Payment— subjects and service providers will be reimbursed for theirtime/effort in participation of the study
∗ Research Staff∗ Supplies/Equipment∗ Other (e.g. travel, postage)
TOTAL ESTIMATED DIRECT COST: $1,400,000
ISSUES
General Issues
Consideration should be given to the general issues mentioned in the previous study,Child/Family Serves as Own Control—Large Scale Longitudinal Study.
Strengths
Strengths of the smaller scale study are similar to those of the larger scale study and will notbe discussed again in this section. For a review of the general strengths of the design referto the Strengths section in the previous study.
The greatest strength of this study is that it provides both qualitative and quantitative data.Given the concerns regarding standardized instruments (see Methodological Challenges inthis chapter), researchers have stressed the importance of using a variety of measurementtechniques. Through a triangulation of measurement, results from both qualitative andquantitative inquiries can be drawn together to make well-grounded conclusions. This studyuses normative and curriculum-based assessment (for a definition of terms seeMethodological Challenges in this chapter), as well as unstructured and structuredobservation and interviews. Case studies are also used to convey the full context of earlyintervention services. The use of such a variety of methods provides a comprehensive basisto describe and assess early intervention services.
Another strength of the study is that the records review allows an opportunity to makegeneral observations regarding Part H goals of the federal legislation. Through a review ofIndividualized Family Service Plans (IFSPs) and records, researchers will be able to
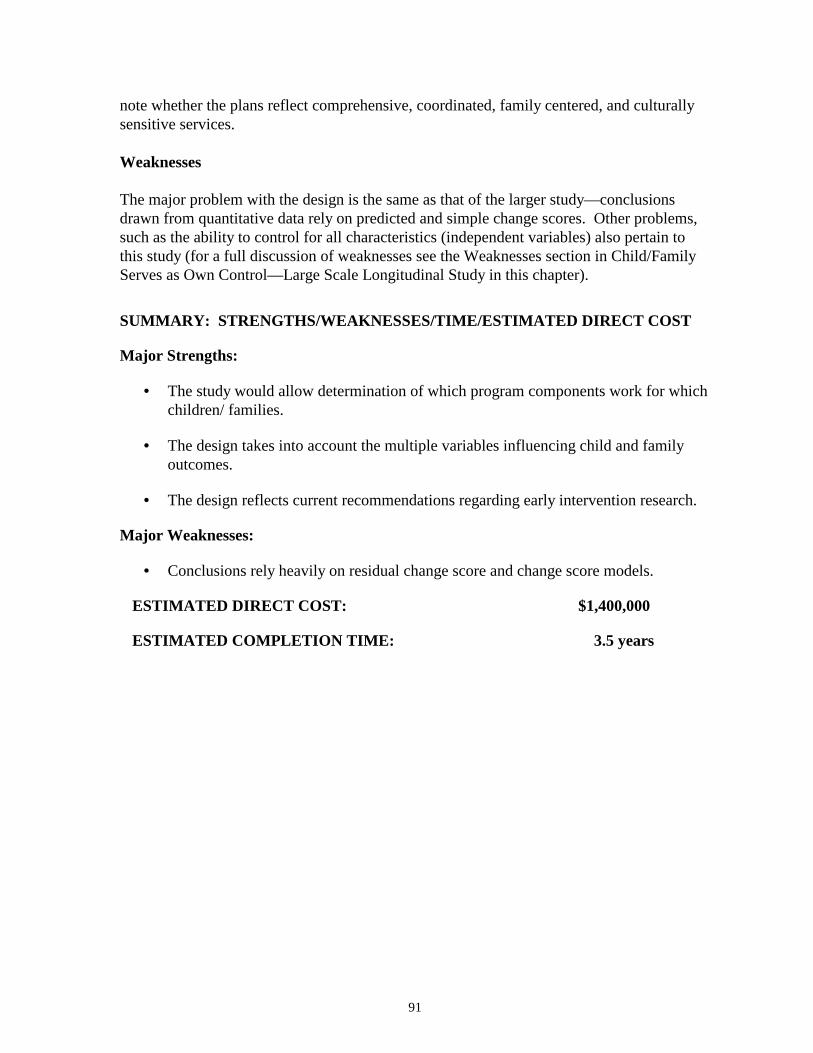
91
note whether the plans reflect comprehensive, coordinated, family centered, and culturallysensitive services.
Weaknesses
The major problem with the design is the same as that of the larger study—conclusionsdrawn from quantitative data rely on predicted and simple change scores. Other problems,such as the ability to control for all characteristics (independent variables) also pertain tothis study (for a full discussion of weaknesses see the Weaknesses section in Child/FamilyServes as Own Control—Large Scale Longitudinal Study in this chapter).
SUMMARY: STRENGTHS/WEAKNESSES/TIME/ESTIMATED DIRECT COST
Major Strengths:
• The study would allow determination of which program components work for whichchildren/ families.
• The design takes into account the multiple variables influencing child and familyoutcomes.
• The design reflects current recommendations regarding early intervention research.
Major Weaknesses:
• Conclusions rely heavily on residual change score and change score models.
ESTIMATED DIRECT COST: $1,400,000
ESTIMATED COMPLETION TIME: 3.5 years
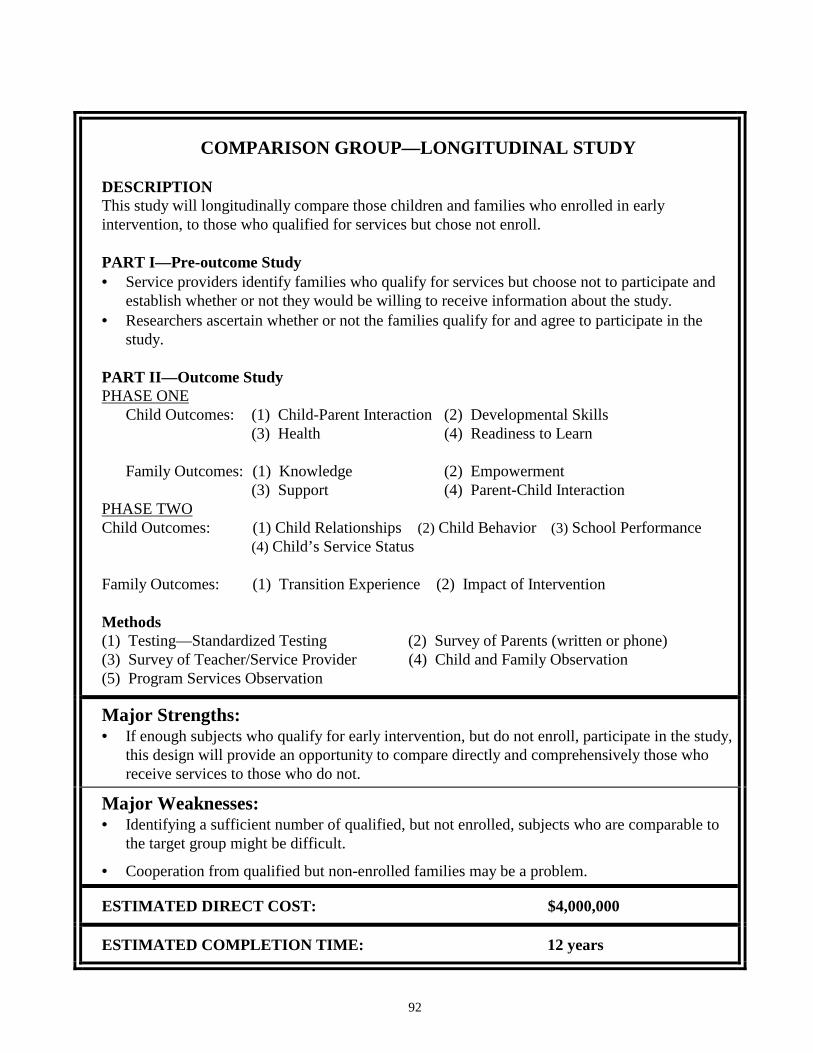
92
COMPARISON GROUP—LONGITUDINAL STUDY
DESCRIPTIONThis study will longitudinally compare those children and families who enrolled in earlyintervention, to those who qualified for services but chose not enroll.
PART I—Pre-outcome Study• Service providers identify families who qualify for services but choose not to participate and
establish whether or not they would be willing to receive information about the study.• Researchers ascertain whether or not the families qualify for and agree to participate in the
study.
PART II—Outcome StudyPHASE ONE
Child Outcomes: (1) Child-Parent Interaction (2) Developmental Skills(3) Health (4) Readiness to Learn
Family Outcomes: (1) Knowledge (2) Empowerment(3) Support (4) Parent-Child Interaction
PHASE TWOChild Outcomes: (1) Child Relationships (2) Child Behavior (3) School Performance
(4) Child’s Service Status
Family Outcomes: (1) Transition Experience (2) Impact of Intervention
Methods(1) Testing—Standardized Testing (2) Survey of Parents (written or phone)(3) Survey of Teacher/Service Provider (4) Child and Family Observation(5) Program Services Observation
Major Strengths:• If enough subjects who qualify for early intervention, but do not enroll, participate in the study,
this design will provide an opportunity to compare directly and comprehensively those whoreceive services to those who do not.
Major Weaknesses:• Identifying a sufficient number of qualified, but not enrolled, subjects who are comparable to
the target group might be difficult.
• Cooperation from qualified but non-enrolled families may be a problem.
ESTIMATED DIRECT COST: $4,000,000
ESTIMATED COMPLETION TIME: 12 years
93
COMPARISON GROUP—LONGITUDINAL STUDY
SUMMARY
This study will examine the impact of early intervention on children with delaying ordisabling conditions and their families in Washington State by comparing those children andfamilies who enrolled in early intervention to those that qualified but did not enroll.
The study is divided into two parts. Part I will identify whether or not there is a sufficientcomparison group willing to participate in the study. Part II will conduct a study similar indesign to the larger scale longitudinal study (ages birth to eight) in which children serve astheir own controls (for details of outcomes, indicators, and data collection methods seeChild/Family Serves as Own Control—Large Scale Longitudinal Study in this chapter).
INTRODUCTION
Research on the effectiveness of early intervention is hampered by the methodologicalproblems generated by the lack of a control group. Since service in Washington ismandated for those children found eligible who accept enrollment, it is unethical and illegalto deny children treatment. If subjects cannot be randomly assigned to a control/treatmentgroup, however, it is difficult to conclude that changes in child/family development are duestrictly to early intervention.
Given the ethical complexities in establishing a control group, the next logical alternative isto isolate a comparison group who qualified for early intervention services, but chose not toenroll. Several problems face this approach as well. Since children and families are notrandomly assigned, group comparability becomes a concern. In order to match groups ondefining characteristics (such as type of disability, severity of condition, gender, etc.) a fairnumber of subjects would have to be recruited. It is also necessary to know which definingcharacteristics influence whether or not a family chooses to receive services. In order tocarry out a longitudinal study that accounts for background characteristics (independentvariables) of families, children, and programs, and which takes into consideration 30 percentattrition, approximately 260 subjects are needed. In this study the groups would be dividedinto those that chose to receive early intervention (n=130) and those who chose not toparticipate (n=130).
Possible Indications of Subject Numbers Available
In Washington, there is no compiled record of the number of children and families whoqualified for services but chose not to enroll. Some numbers may be useful in estimatingwhether or not there is a possibility of recruiting 130 children and families who wereeligible for enrollment but chose not to enroll. The following discussion pertains only toestimating whether or not there is a possibility for a comparison group of sufficientnumbers. The groups of children identified below will not be considered as possiblecomparison groups. Identification of possible comparison subjects for the study will occurat service sites (see the subsequent section, Recruitment, for further details).

94
Infant Toddler Early Intervention Program Records
• The Infant Toddler Early Intervention Program (ITEIP) tracks the number of childrenwho are eligible for ITEIP services and the number of children who have IndividualizedFamily Service Plans (IFSPs). These numbers are reported from individual contractors.From October 1996-September 1997, 2,641 children were eligible for enrollment and2,128 had IFSPs. While the difference (513) could represent those that qualified and didnot enroll, many other reasons are possible. Such reasons may include the following: 1)some children may have been assessed in September 1997 but had not yet enrolled at thetime of report; 2) some enrolled children and families may not have developed an IFSPat the time of the report; 3) although the child and family may be eligible for ITEIP, themajority of their care may be covered by a source not affiliated with the ITEIP; or 4) thefamilies could have moved between the assessment date and the enrollment count. Insum, this number should not be used to estimate the number of qualified families whochoose not to enroll in early intervention services.
Medicaid Records
• Medicaid records could possibly be used to indicate whether there is a potential subjectpool who qualify but do not enroll for early intervention services. For example, fromDecember 1993-December 1995, 94 Medicaid children were diagnosed with DownSyndrome, and 80 of these children were enrolled in early intervention services (Keenanet al., Washington’s Infant Toddler Early Intervention Program Study, 1997). Whileone possible reason for the difference (14) could be that families of children with DownSyndrome decided not to enroll, other explanations are possible (if not probable).Figures could be due to the receipt of private services or the fact that a child and familymay have moved by the time of the enrollment count, or the fact that a child might havedied.
From these numbers it is difficult even to speculate whether the possibility of conducting astudy with a large enough number of subjects to be statistically significant exists. Thenumbers do indicate, however, that there may be some families who choose not to enroll inservices. Since estimates of possible subjects for the non-participation group areunavailable, the first step in the study would involve obtaining this number. If enough of asubject pool is available (n=130), groups will be stratified according to type and severity ofdelay.
METHODS PART I—LOCATING A COMPARISON GROUP
Eligibility
To be eligible for inclusion in the study, families must meet the following conditions: 1)they qualify for early intervention services but choose not to enroll, 2) they agree to becontacted by the research team, 3) they agree to participate in the study, and 3) they are notreceiving any early intervention services (e.g. privately funded services).

95
Recruitment
Estimating how many children and their families qualify for early intervention services butdo not enroll (because of choice), relies on the cooperation of contractors and serviceproviders to monitor these numbers over a one year period and to estimate how many ofthese families would be willing to participate in the study. For this purpose the researchteam will need to provide a brief description of the study which explains its focus andpurpose. Contractors and service providers will be responsible for: 1) noting which childrenand families qualify, but choose not to enroll, 2) ascertaining whether or not families wouldbe willing to receive information regarding the study from researchers, 3) establishingwhether or not the family is receiving private services, and 4) providing researchers with thenames and addresses of eligible families after families consent. (Providers and contractorswill be paid for their time.) Researchers will then contact willing, eligible families toestablish a data collection schedule and to arrange confidentiality agreements.
Data Collection
Data on eligible non-enrollment subjects should be collected by researchers as soon as thesubjects are recruited. Even if a sufficient number of subjects (n=130) are not recruited tocomplete the study, families who choose not to enroll their children in early interventionservices provide an important perspective and can contribute valuable descriptiveinformation (Presentation, Dr. Susan Janko, 2/6/98). If enough families are recruited, thestudy will continue.
PART II—OUTCOME STUDY
This part of the study is similar in structure to the Child/Family Serves as Own Control—Large Scale Longitudinal Study. Because there will be a comparison group, predictedchange score and simple change score models will not be used, but rather results from thetwo comparison groups will be directly compared (for details see Child/Family Serves asOwn Control—Large Scale Longitudinal Study in this chapter). The discussion whichfollows concentrates on those elements of the studies that differ.
Eligibility Criteria
The target population is all birth to three children and their families newly enrolled in earlyintervention services in Washington State. Recruitment for enrolled participants will occurat the end of Part I (one year) if a sufficient number of subjects for the comparison groupshas been identified.
Sample Size
The ideal size of the study, accounting for a 30 percent attrition rate over time, would beapproximately 260 subjects (α=.05, statistical power is at .80, and effect is ~.33). Thesample size will be divided as follows: n= 130, non-enrolled subjects; n=130 enrolled
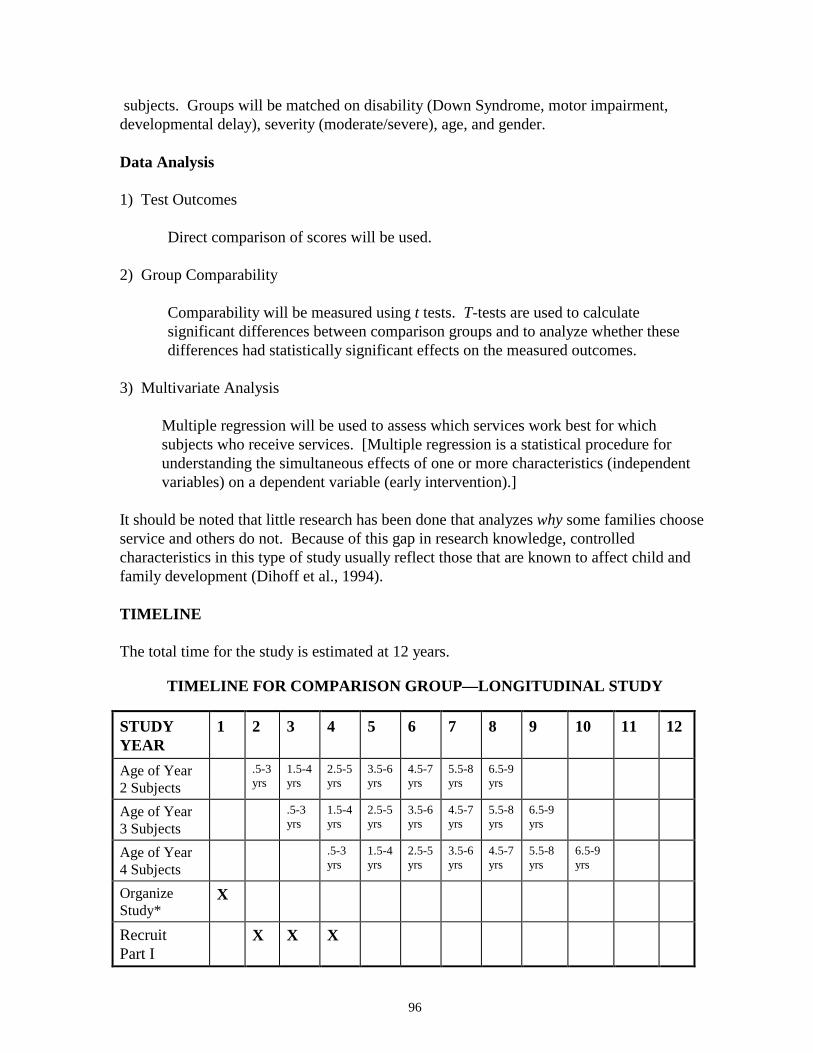
96
subjects. Groups will be matched on disability (Down Syndrome, motor impairment,developmental delay), severity (moderate/severe), age, and gender.
Data Analysis
1) Test Outcomes
Direct comparison of scores will be used.
2) Group Comparability
Comparability will be measured using t tests. T-tests are used to calculatesignificant differences between comparison groups and to analyze whether thesedifferences had statistically significant effects on the measured outcomes.
3) Multivariate Analysis
Multiple regression will be used to assess which services work best for whichsubjects who receive services. [Multiple regression is a statistical procedure forunderstanding the simultaneous effects of one or more characteristics (independentvariables) on a dependent variable (early intervention).]
It should be noted that little research has been done that analyzes why some families chooseservice and others do not. Because of this gap in research knowledge, controlledcharacteristics in this type of study usually reflect those that are known to affect child andfamily development (Dihoff et al., 1994).
TIMELINE
The total time for the study is estimated at 12 years.
TIMELINE FOR COMPARISON GROUP—LONGITUDINAL STUDY
STUDYYEAR
1 2 3 4 5 6 7 8 9 10 11 12
Age of Year2 Subjects
.5-3yrs
1.5-4yrs
2.5-5yrs
3.5-6yrs
4.5-7yrs
5.5-8yrs
6.5-9yrs
Age of Year3 Subjects
.5-3yrs
1.5-4yrs
2.5-5yrs
3.5-6yrs
4.5-7yrs
5.5-8yrs
6.5-9yrs
Age of Year4 Subjects
.5-3yrs
1.5-4yrs
2.5-5yrs
3.5-6yrs
4.5-7yrs
5.5-8yrs
6.5-9yrs
OrganizeStudy*
X
RecruitPart I
X X X
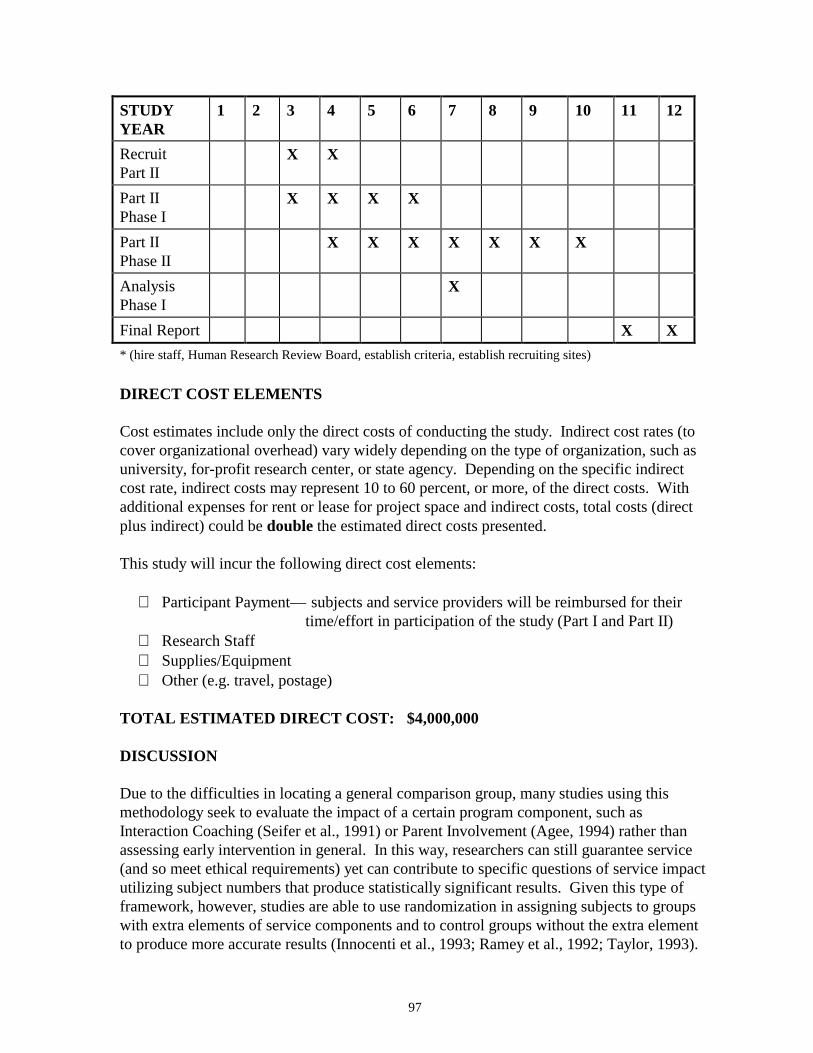
97
STUDYYEAR
1 2 3 4 5 6 7 8 9 10 11 12
RecruitPart II
X X
Part IIPhase I
X X X X
Part IIPhase II
X X X X X X X
AnalysisPhase I
X
Final Report X X* (hire staff, Human Research Review Board, establish criteria, establish recruiting sites)
DIRECT COST ELEMENTS
Cost estimates include only the direct costs of conducting the study. Indirect cost rates (tocover organizational overhead) vary widely depending on the type of organization, such asuniversity, for-profit research center, or state agency. Depending on the specific indirectcost rate, indirect costs may represent 10 to 60 percent, or more, of the direct costs. Withadditional expenses for rent or lease for project space and indirect costs, total costs (directplus indirect) could be double the estimated direct costs presented.
This study will incur the following direct cost elements:
∗ Participant Payment— subjects and service providers will be reimbursed for their time/effort in participation of the study (Part I and Part II)
∗ Research Staff∗ Supplies/Equipment∗ Other (e.g. travel, postage)
TOTAL ESTIMATED DIRECT COST: $4,000,000
DISCUSSION
Due to the difficulties in locating a general comparison group, many studies using thismethodology seek to evaluate the impact of a certain program component, such asInteraction Coaching (Seifer et al., 1991) or Parent Involvement (Agee, 1994) rather thanassessing early intervention in general. In this way, researchers can still guarantee service(and so meet ethical requirements) yet can contribute to specific questions of service impactutilizing subject numbers that produce statistically significant results. Given this type offramework, however, studies are able to use randomization in assigning subjects to groupswith extra elements of service components and to control groups without the extra elementto produce more accurate results (Innocenti et al., 1993; Ramey et al., 1992; Taylor, 1993).
98
ISSUES
General Issues
Consideration should be given to the general issues mentioned in the Child/Family Servesas Own Control—Large Scale Longitudinal Study in this chapter.
Strengths
The greatest strength of this study is that it provides an actual comparison group who doesnot receive services. If a large enough comparison group exists (n=130), it would providebaseline outcome data against which to contrast target group (those that received services)data. If the comparison group could be matched on critical characteristics (see the sectiondescribing characteristics in Child/Family Serves as Own Control—Large ScaleLongitudinal Study in this chapter), conclusions could be made in regard to attributingchanges in outcomes to early intervention.
Another strength of the study is the ability to track and compare groups longitudinally.Children and families will be monitored from enrollment in birth to three services until thechild is seven years old, which provides an opportunity to assess directly the long-termbenefits of early intervention.
Weaknesses
The major weakness with the design is that it is possible that researchers will be unable torecruit sufficient numbers of those children and families who: 1) qualified for services butchoose not to enroll, 2) will cooperate, and 3) are not receiving any other early interventionservices. The likelihood of families who decline services participating in a ten to twelveyear evaluative study is questionable.
Group comparability is also a concern. Since children should be matched, at the very least,on type and severity of delay, generating a group of comparable children may beproblematic. Similarly, the reasons for refusal of services are not widely known, making itdifficult for researchers to control for group distinctions on this basis. While possibleexplanations such as health reasons, religious reasons, level of education, U.S. legalresidence status, and poverty status could be proposed, there have not been enough studiesto assess the validity of such constructions. The impact of these factors on childdevelopment should be assessed in order to strengthened conclusions regarding whether ornot changes in outcomes can be attributed to early intervention services.
Another consideration involves the commitment of time and resources to a researchproject that may be suspended after Part One due to insufficient subject numbers. Fundingshould be obtained for the entire study before it actually commences. If it were discoveredin Part One that a large enough comparison group could not be recruited, Part Two of theproject could not commence. While funding could be obtained one part at a time, delays infunding of Part Two of the study would create methodological problems with testing

99
procedures in that many subjects would be older than originally anticipated. In sum,funding issues may be problematic.
SUMMARY: STRENGTHS/WEAKNESSES/TIME/ESTIMATED DIRECT COST
Major Strengths:
• The greatest strength of this study is that it provides an actual comparison groupwhich does not receive services.
• The study allows comprehensive longitudinal assessment.
Major Weaknesses:
• The major weakness with the design is that it is possible that researchers will beunable to recruit sufficient numbers of non-enrolled children and families who arewilling to cooperate.
• Group comparability is a concern.
ESTIMATED DIRECT COST: $4,000,000
ESTIMATED COMPLETION TIME: 12 years
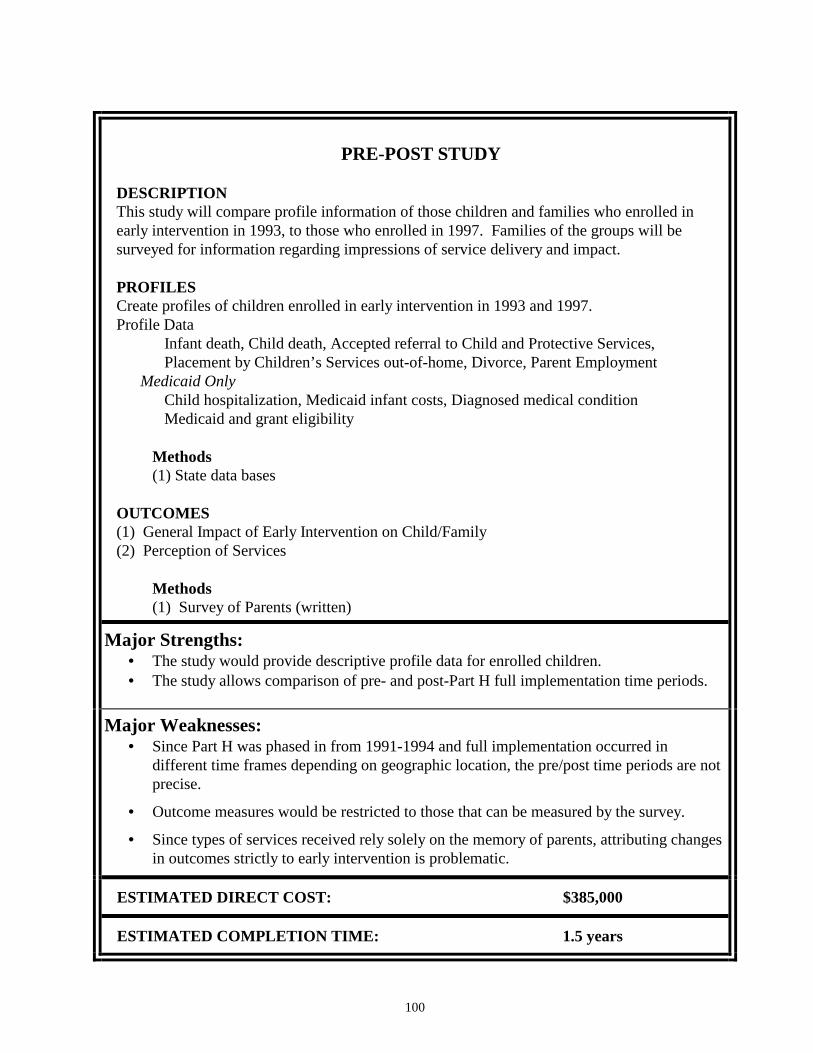
100
PRE-POST STUDY
DESCRIPTIONThis study will compare profile information of those children and families who enrolled inearly intervention in 1993, to those who enrolled in 1997. Families of the groups will besurveyed for information regarding impressions of service delivery and impact.
PROFILESCreate profiles of children enrolled in early intervention in 1993 and 1997.Profile Data
Infant death, Child death, Accepted referral to Child and Protective Services,Placement by Children’s Services out-of-home, Divorce, Parent Employment
Medicaid OnlyChild hospitalization, Medicaid infant costs, Diagnosed medical conditionMedicaid and grant eligibility
Methods(1) State data bases
OUTCOMES(1) General Impact of Early Intervention on Child/Family(2) Perception of Services
Methods(1) Survey of Parents (written)
Major Strengths:• The study would provide descriptive profile data for enrolled children.• The study allows comparison of pre- and post-Part H full implementation time periods.
Major Weaknesses:• Since Part H was phased in from 1991-1994 and full implementation occurred in
different time frames depending on geographic location, the pre/post time periods are notprecise.
• Outcome measures would be restricted to those that can be measured by the survey.
• Since types of services received rely solely on the memory of parents, attributing changesin outcomes strictly to early intervention is problematic.
ESTIMATED DIRECT COST: $385,000
ESTIMATED COMPLETION TIME: 1.5 years
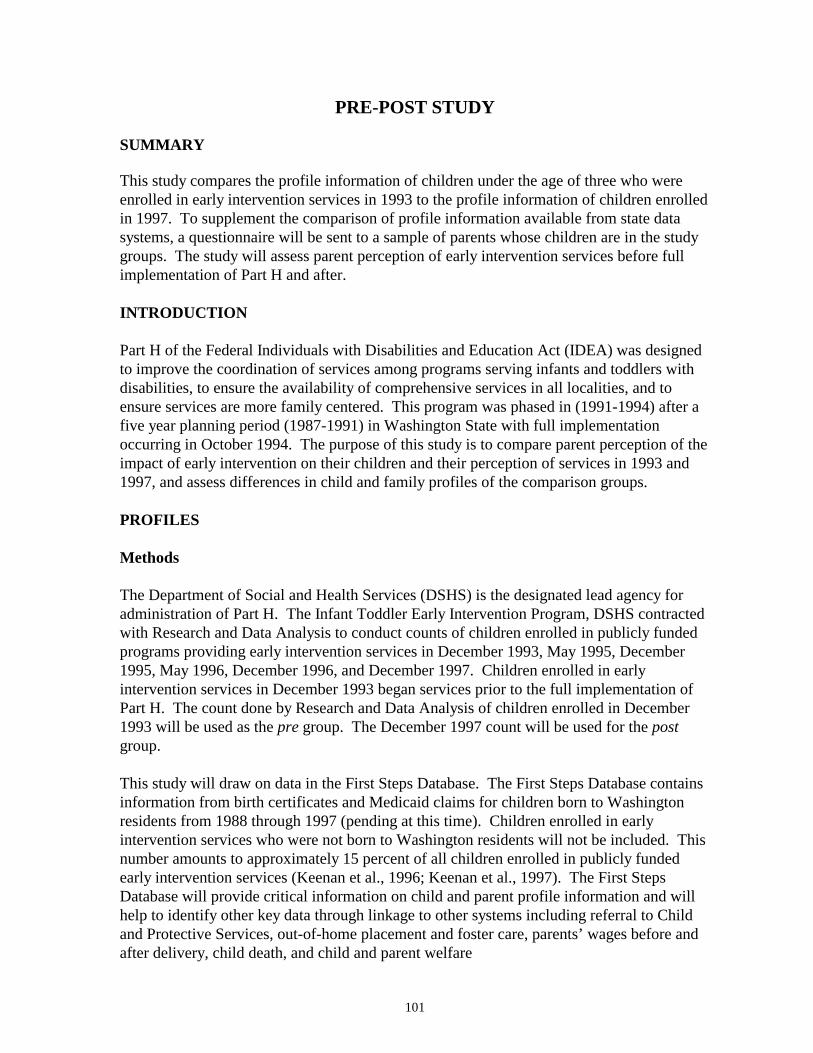
101
PRE-POST STUDY
SUMMARY
This study compares the profile information of children under the age of three who wereenrolled in early intervention services in 1993 to the profile information of children enrolledin 1997. To supplement the comparison of profile information available from state datasystems, a questionnaire will be sent to a sample of parents whose children are in the studygroups. The study will assess parent perception of early intervention services before fullimplementation of Part H and after.
INTRODUCTION
Part H of the Federal Individuals with Disabilities and Education Act (IDEA) was designedto improve the coordination of services among programs serving infants and toddlers withdisabilities, to ensure the availability of comprehensive services in all localities, and toensure services are more family centered. This program was phased in (1991-1994) after afive year planning period (1987-1991) in Washington State with full implementationoccurring in October 1994. The purpose of this study is to compare parent perception of theimpact of early intervention on their children and their perception of services in 1993 and1997, and assess differences in child and family profiles of the comparison groups.
PROFILES
Methods
The Department of Social and Health Services (DSHS) is the designated lead agency foradministration of Part H. The Infant Toddler Early Intervention Program, DSHS contractedwith Research and Data Analysis to conduct counts of children enrolled in publicly fundedprograms providing early intervention services in December 1993, May 1995, December1995, May 1996, December 1996, and December 1997. Children enrolled in earlyintervention services in December 1993 began services prior to the full implementation ofPart H. The count done by Research and Data Analysis of children enrolled in December1993 will be used as the pre group. The December 1997 count will be used for the postgroup.
This study will draw on data in the First Steps Database. The First Steps Database containsinformation from birth certificates and Medicaid claims for children born to Washingtonresidents from 1988 through 1997 (pending at this time). Children enrolled in earlyintervention services who were not born to Washington residents will not be included. Thisnumber amounts to approximately 15 percent of all children enrolled in publicly fundedearly intervention services (Keenan et al., 1996; Keenan et al., 1997). The First StepsDatabase will provide critical information on child and parent profile information and willhelp to identify other key data through linkage to other systems including referral to Childand Protective Services, out-of-home placement and foster care, parents’ wages before andafter delivery, child death, and child and parent welfare
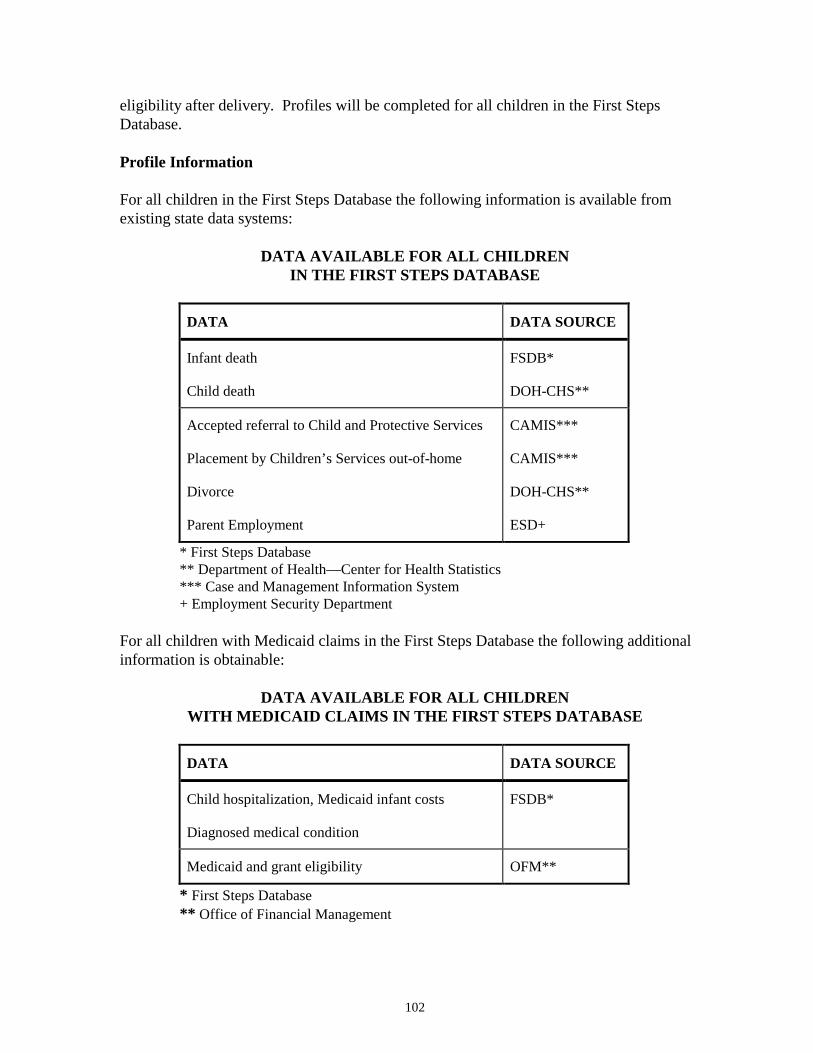
102
eligibility after delivery. Profiles will be completed for all children in the First StepsDatabase.
Profile Information
For all children in the First Steps Database the following information is available fromexisting state data systems:
DATA AVAILABLE FOR ALL CHILDRENIN THE FIRST STEPS DATABASE
DATA DATA SOURCE
Infant death
Child death
FSDB*
DOH-CHS**
Accepted referral to Child and Protective Services
Placement by Children’s Services out-of-home
Divorce
Parent Employment
CAMIS***
CAMIS***
DOH-CHS**
ESD+
* First Steps Database** Department of Health—Center for Health Statistics*** Case and Management Information System+ Employment Security Department
For all children with Medicaid claims in the First Steps Database the following additionalinformation is obtainable:
DATA AVAILABLE FOR ALL CHILDRENWITH MEDICAID CLAIMS IN THE FIRST STEPS DATABASE
DATA DATA SOURCE
Child hospitalization, Medicaid infant costs
Diagnosed medical condition
FSDB*
Medicaid and grant eligibility OFM**
* First Steps Database** Office of Financial Management
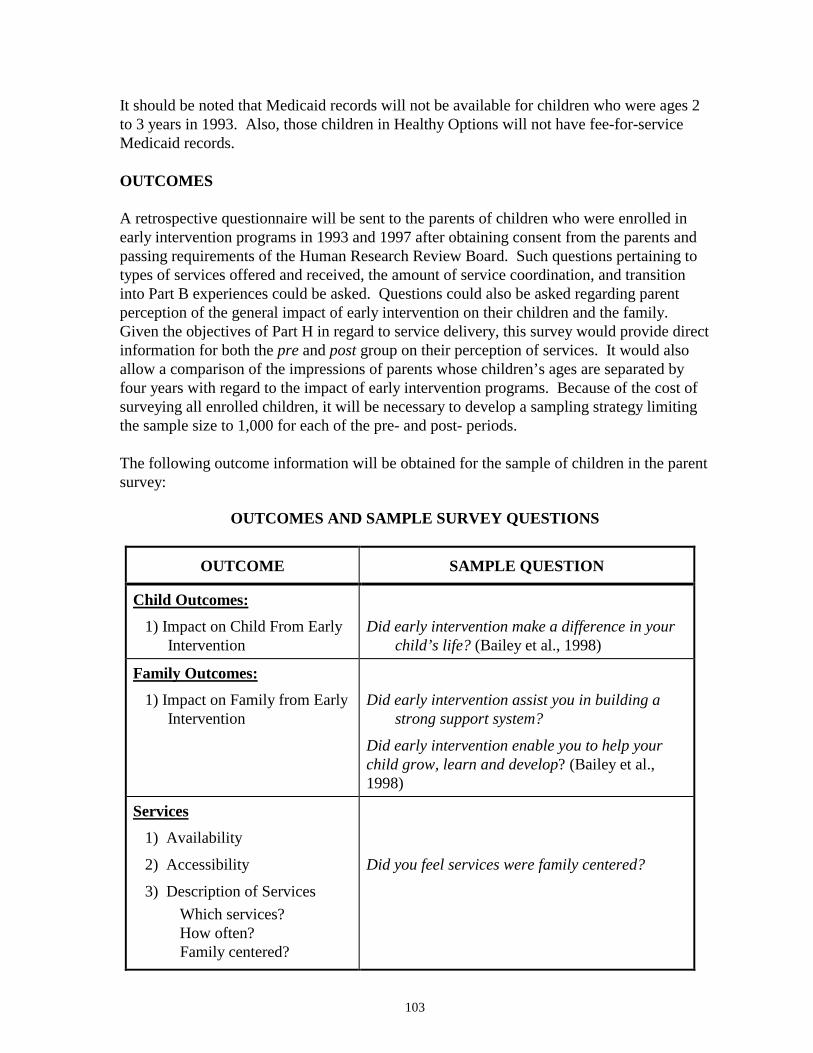
103
It should be noted that Medicaid records will not be available for children who were ages 2to 3 years in 1993. Also, those children in Healthy Options will not have fee-for-serviceMedicaid records.
OUTCOMES
A retrospective questionnaire will be sent to the parents of children who were enrolled inearly intervention programs in 1993 and 1997 after obtaining consent from the parents andpassing requirements of the Human Research Review Board. Such questions pertaining totypes of services offered and received, the amount of service coordination, and transitioninto Part B experiences could be asked. Questions could also be asked regarding parentperception of the general impact of early intervention on their children and the family.Given the objectives of Part H in regard to service delivery, this survey would provide directinformation for both the pre and post group on their perception of services. It would alsoallow a comparison of the impressions of parents whose children’s ages are separated byfour years with regard to the impact of early intervention programs. Because of the cost ofsurveying all enrolled children, it will be necessary to develop a sampling strategy limitingthe sample size to 1,000 for each of the pre- and post- periods.
The following outcome information will be obtained for the sample of children in the parentsurvey:
OUTCOMES AND SAMPLE SURVEY QUESTIONS
OUTCOME SAMPLE QUESTION
Child Outcomes:1) Impact on Child From Early
InterventionDid early intervention make a difference in your
child’s life? (Bailey et al., 1998)
Family Outcomes:1) Impact on Family from Early
InterventionDid early intervention assist you in building a
strong support system?
Did early intervention enable you to help yourchild grow, learn and develop? (Bailey et al.,1998)
Services1) Availability
2) Accessibility
3) Description of ServicesWhich services?How often?Family centered?
Did you feel services were family centered?
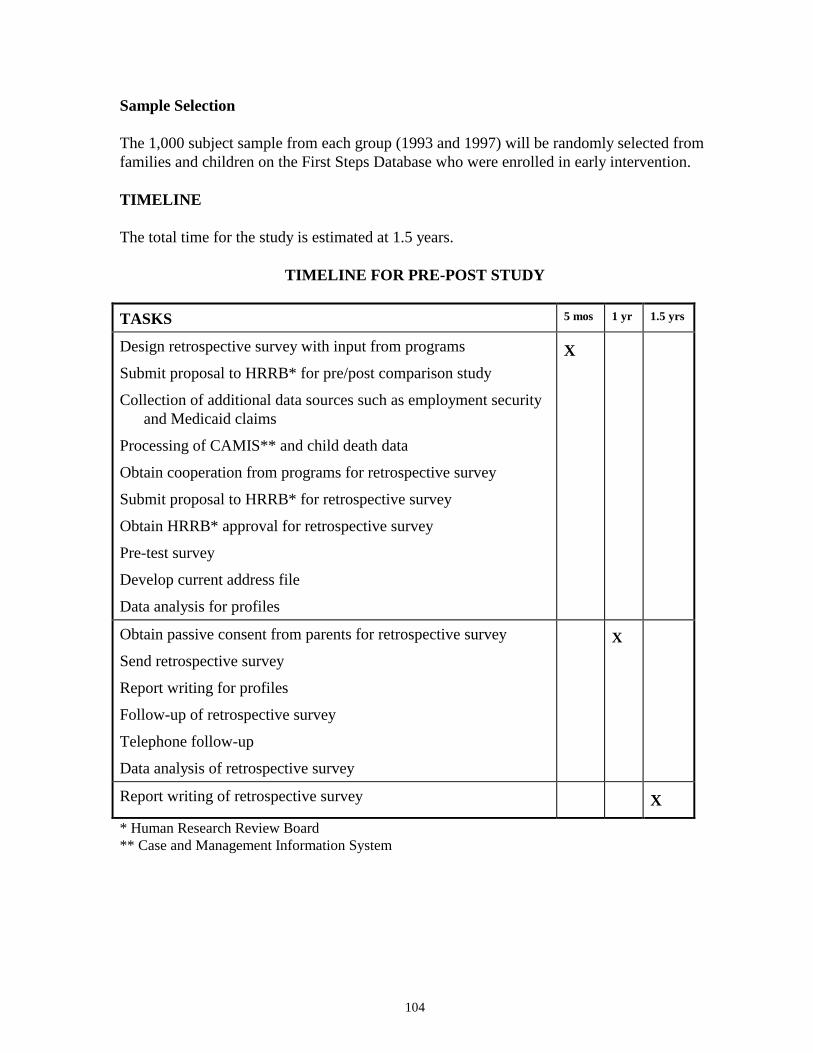
104
Sample Selection
The 1,000 subject sample from each group (1993 and 1997) will be randomly selected fromfamilies and children on the First Steps Database who were enrolled in early intervention.
TIMELINE
The total time for the study is estimated at 1.5 years.
TIMELINE FOR PRE-POST STUDY
TASKS 5 mos 1 yr 1.5 yrs
Design retrospective survey with input from programs
Submit proposal to HRRB* for pre/post comparison study
Collection of additional data sources such as employment securityand Medicaid claims
Processing of CAMIS** and child death data
Obtain cooperation from programs for retrospective survey
Submit proposal to HRRB* for retrospective survey
Obtain HRRB* approval for retrospective survey
Pre-test survey
Develop current address file
Data analysis for profiles
X
Obtain passive consent from parents for retrospective survey
Send retrospective survey
Report writing for profiles
Follow-up of retrospective survey
Telephone follow-up
Data analysis of retrospective survey
X
Report writing of retrospective survey X
* Human Research Review Board** Case and Management Information System
105
DIRECT COST ELEMENTS
Cost estimates include only the direct costs of conducting the study. Indirect cost rates (tocover organizational overhead) vary widely depending on the type of organization, such asuniversity, for-profit research center, or state agency. Depending on the specific indirectcost rate, indirect costs may represent 10 to 60 percent, or more, of the direct costs. Withadditional expenses for rent or lease for project space and indirect costs, total costs (directplus indirect) could be double the estimated direct costs presented.
This study will incur the following direct cost elements:
∗ Participant Payment— subjects and service providers will be reimbursed for their time/effort in participation of the study
∗ Research Staff∗ Supplies/Equipment∗ Other (e.g. travel, postage)
TOTAL ESTIMATED DIRECT COST: $385,000
DISCUSSION
While much information is available from state data systems, a retrospective survey of asample of children and their families who received birth to three services in 1993 and 1997will provide information regarding their impressions of impact and services during thesetime periods. The survey will ask about type of disability or delay, identification ofdisabilities, referral to services, initial services received, intensity and type of servicesreceived, whether or not services were coordinated and family centered, and current childdevelopment. The survey will require cooperation from programs and approval from theHuman Research Review Board.
Studies indicate a high level of reliability for many questions related to infants withdisabilities when asked at different points in time. Parents respond to questions such aswhen they first recognized their child’s disability or delay, who first diagnosed their child’sdisability or delay, and when they first received early intervention services similarly whentheir child is young as when their child is grown (Carr, 1987; Palfrey, 1987).
ISSUES
Strengths
The greatest strength of this study is that it provides comparison groups of pre-Part H fullimplementation and post-Part H full implementation time periods. While these dates do notaccurately reflect a true pre- and post- time period (see Weaknesses), the study wouldprovide interesting information regarding how parents perceived services and their benefitsin 1993 and 1997. If the study were to take place in 1999, the children who participated inearly intervention in 1993 would be 6 to 9 years old; and those who participated in 1997would be 2 to 5 years old. The study would allow the contrast of parent feedback whose
106
children are still in early intervention or have recently transitioned, to those parents whosechildren are substantially older. The study may also provide insight into how services mighthave changed during those four years.
Detailed profiles would be established for a majority of the children enrolled in 1993 and1997 and provide information that previously has been undisclosed. The profiles would useinformation already present in state data bases and provide a full description of manychildren with disabling or delaying conditions and their families using publicly funded earlyintervention services in Washington State. Information such as infant and child death,placement in foster care, and parent employment would contribute to the understanding ofthe possible needs of those who are being served in the state.
Other strengths of the study are that it is relatively inexpensive and can be completed inunder two years, and it has a large subject number which increases the generalizability ofresults.
Weaknesses
One major weakness of the study is that child and family outcomes are restricted toinformation that can be obtained through the parent survey. The survey will ask parentsabout how early intervention impacted their children and families, and inquire about servicedelivery. While the information provided by parents will be interesting and useful, becausethe description of services cannot be verified and relies strictly on the memory of parents,concluding that the impact parents describe is strictly due to intervention is problematic.
Another concern with the study is that there is no clear demarcation between pre- and post-Part H since the program was phased in over a number of years and its full implementationvaried from location to location. In 1993, Part H had been phased in since 1991 indicatingthat some areas probably achieved close to full implementation as early as 1993. Thechanges that took place in services between 1993-1997 such as coordination, family focus,and the use of Family Resource Coordinators (FRCs) may not be reflected in the surveys.Although data on whether or not families had FRCs is available, people working in the fieldhave remarked that families refer to their FRC by name and often do not remember theirposition title (Advisory Group Meeting, 5/15/98); and given that some will have been out ofservices for four or more years, parents may not remember details that would allowconclusions to be drawn regarding changes in services. Results from the study should betreated as providing primarily descriptive information regarding how parent perceptionsdiffer during these time periods.
One other weakness of the study is that a possible selection bias may exist in that thosefamilies who are unable to be reached cannot participate in the study. The selection biaswill detract from the generalizability of the results.
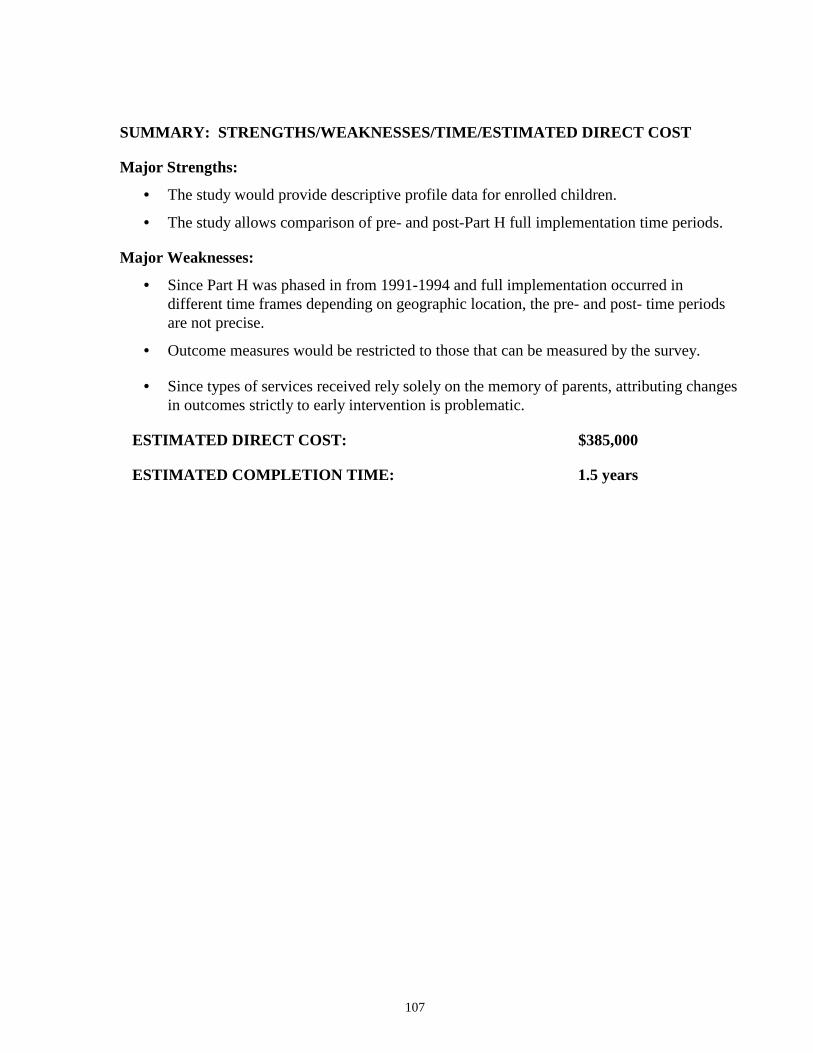
107
SUMMARY: STRENGTHS/WEAKNESSES/TIME/ESTIMATED DIRECT COST
Major Strengths:
• The study would provide descriptive profile data for enrolled children.
• The study allows comparison of pre- and post-Part H full implementation time periods.
Major Weaknesses:
• Since Part H was phased in from 1991-1994 and full implementation occurred indifferent time frames depending on geographic location, the pre- and post- time periodsare not precise.
• Outcome measures would be restricted to those that can be measured by the survey.
• Since types of services received rely solely on the memory of parents, attributing changesin outcomes strictly to early intervention is problematic.
ESTIMATED DIRECT COST: $385,000
ESTIMATED COMPLETION TIME: 1.5 years
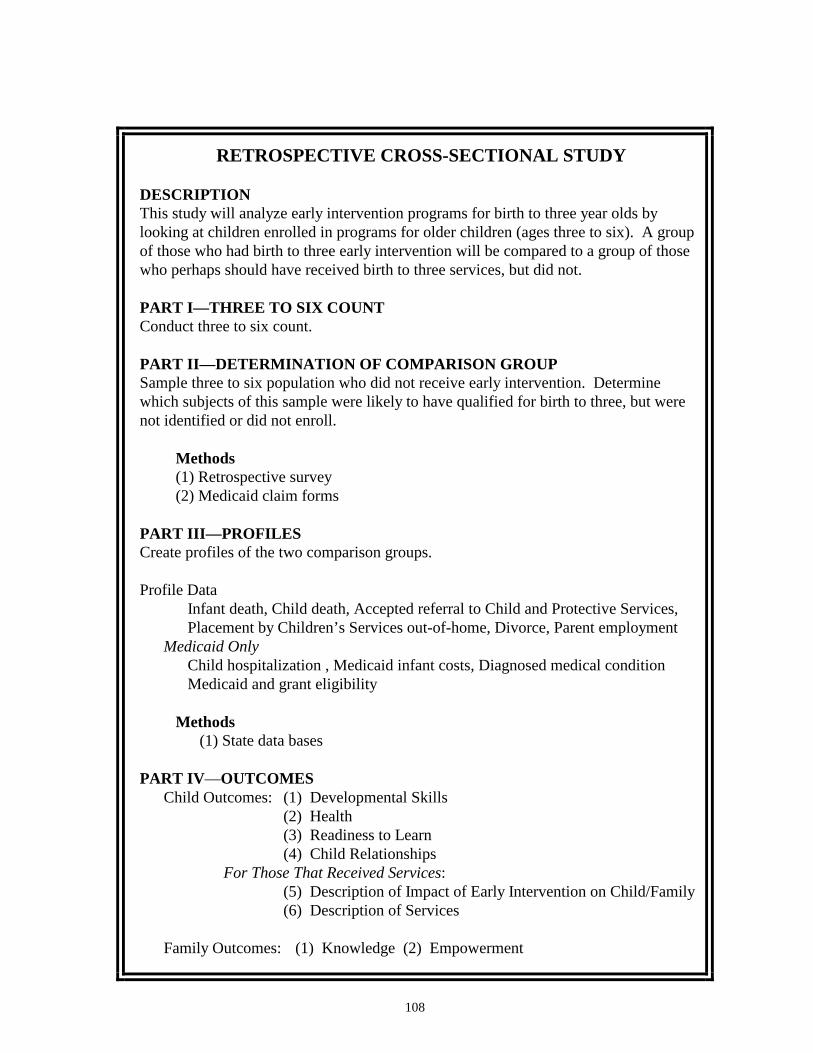
108
RETROSPECTIVE CROSS-SECTIONAL STUDY
DESCRIPTIONThis study will analyze early intervention programs for birth to three year olds bylooking at children enrolled in programs for older children (ages three to six). A groupof those who had birth to three early intervention will be compared to a group of thosewho perhaps should have received birth to three services, but did not.
PART I—THREE TO SIX COUNTConduct three to six count.
PART II—DETERMINATION OF COMPARISON GROUPSample three to six population who did not receive early intervention. Determinewhich subjects of this sample were likely to have qualified for birth to three, but werenot identified or did not enroll.
Methods(1) Retrospective survey(2) Medicaid claim forms
PART III—PROFILESCreate profiles of the two comparison groups.
Profile DataInfant death, Child death, Accepted referral to Child and Protective Services,Placement by Children’s Services out-of-home, Divorce, Parent employment
Medicaid OnlyChild hospitalization , Medicaid infant costs, Diagnosed medical conditionMedicaid and grant eligibility
Methods(1) State data bases
PART IV—OUTCOMESChild Outcomes: (1) Developmental Skills
(2) Health(3) Readiness to Learn(4) Child Relationships
For Those That Received Services:(5) Description of Impact of Early Intervention on Child/Family(6) Description of Services
Family Outcomes: (1) Knowledge (2) Empowerment
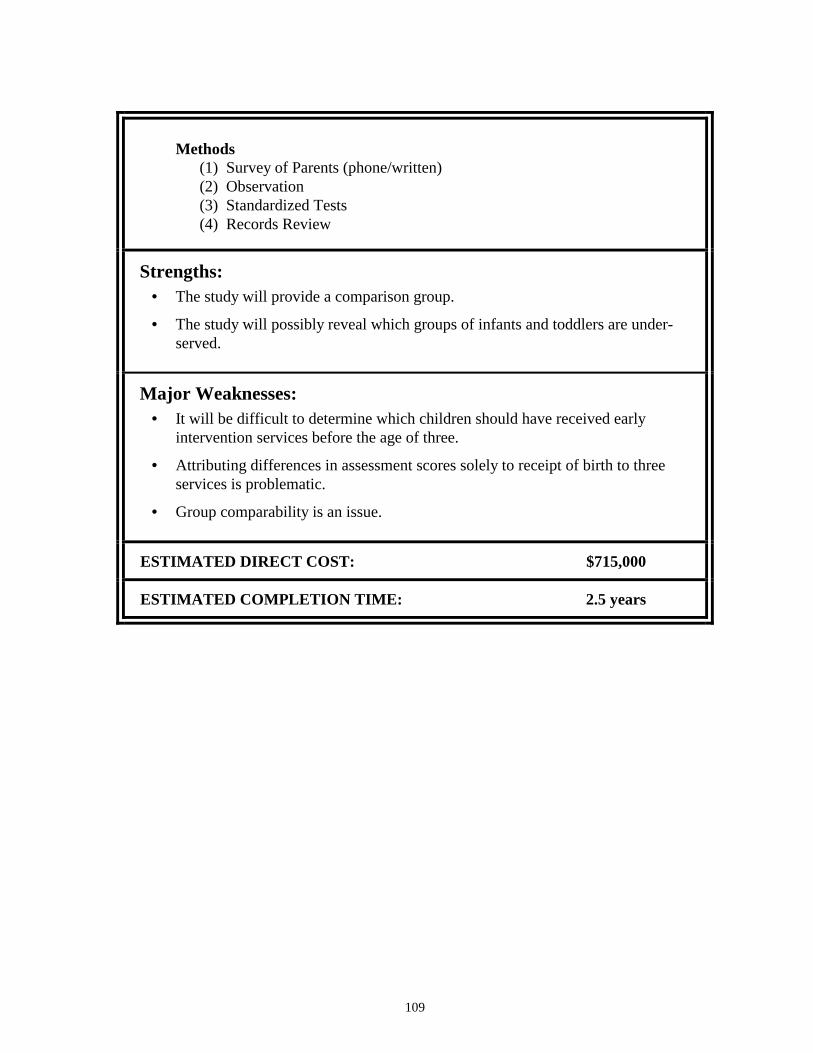
109
Methods(1) Survey of Parents (phone/written)(2) Observation(3) Standardized Tests(4) Records Review
Strengths:• The study will provide a comparison group.
• The study will possibly reveal which groups of infants and toddlers are under-served.
Major Weaknesses:• It will be difficult to determine which children should have received early
intervention services before the age of three.
• Attributing differences in assessment scores solely to receipt of birth to threeservices is problematic.
• Group comparability is an issue.
ESTIMATED DIRECT COST: $715,000
ESTIMATED COMPLETION TIME: 2.5 years
110
RETROSPECTIVE CROSS-SECTIONAL STUDY
SUMMARY
This is a retrospective study of children in publicly funded programs for those aged three tosix years with delaying or disabling conditions. Their enrollment in programs prior toturning three will be determined. A retrospective parent survey will be conducted for asample of children who were not enrolled in birth to three services in order to ascertainwhether or not their children might have qualified for birth to three services. Those childrenand families that were likely to qualify for birth to three services, but did not enroll (andwere not receiving other privately funded services), will be compared to those children andfamilies enrolled in three to six programs who were previously enrolled in birth to threeservices. A survey regarding parent perception of birth to three services will be conducted.
INTRODUCTION
The study will compare children in programs for three to six year olds based on their priorenrollment in programs for birth to three year olds. The identification of these twogroups—children with and without prior enrollment in birth to three programs—will permitcomparison of the types of children served in these two age categories, comparison of childand family outcomes, analysis of the transitioning of children from early interventionprograms for the younger age group into programs for three to six year olds, andidentification of under-served or under-identified children.
PART I—ENROLLMENT COUNT
METHODS
Three to Six Count
A count of children with disabling or delaying conditions enrolled in programs for three tosix year olds will be conducted. The basic component of this part of the study is a listing ofchildren from ages three to six enrolled in Washington State public services for those withdisabling or delaying conditions. This listing, a snapshot in time of the population enrolledin three to six programs, will be obtained by surveying service providers. Prior to the dateof the count, surveys will be mailed to providers of preschool services. The survey willrequest a list of every child from ages three to six who was enrolled with the provider on theday of the count. Duplicated counts (children receiving services from more than oneprovider) will be eliminated through an unduplication process. Records belonging to thesame child can be identified using last name, middle name, first name, gender, and date ofbirth. Human Research Review Board (HRRB) review and an agreement with Office ofSuperintendent of Public Instruction (OSPI) are required to conduct the count in order toconform with rules regarding confidentiality concerns.
111
Identification of Those Who Received Birth to Three Services
The three to six count data will be combined with the information from Department ofSocial and Health Services, Research and Data Analysis’ enrollment counts in earlyintervention programs for children under age three in December 1993, December 1995,December 1996, and December 1997. This cross-comparison can determine whetherchildren and families in the three to six count were enrolled in birth to three services.
The following table displays the age of the children in the various December countsconducted by Research and Data Analysis (RDA). It can be used to understand how theinformation from enrollment counts in the two programs can be used to develop studygroups.
AGE OF CHILDREN IN RDA ENROLLMENT COUNTSFOR BIRTH TO THREE PROGRAM
1993 1994 1995 1996 1997 1998 1999 2000Dec count 1-4 2-5 3-6 4-7 5-8 6-9 7-10
Dec count 1-4 2-5 3-6 4-7 5-8Dec count 1-4 2-5 3-6 4-7
Dec count 1-4 2-5 3-6
For example, if a count of children served by programs for three to six year olds wereconducted in December 1998, it would be possible to examine their enrollment in programsfor under three year olds using the December 1993, December 1995, December 1996, andDecember 1997 counts. Two main study groups could be identified: 1) children enrolled inthree to six programs with prior enrollment in birth to three programs; and 2) childrenenrolled in three to six programs without prior enrollment in birth to three programs.
PART II—DETERMINATION OF COMPARISON GROUP
METHODS
The early intervention program for three to six year olds enrolls many more children thanthe program for children under age three. Enrollment for children under three is about 5,000while approximately 12,000 children aged three to six are enrolled in programs for childrenwith disabling or delaying conditions (Office of Superintendent of Public Instruction(OSPI), 1997). Many factors change as a child grows older, most especially the number ofcontacts with professionals (school, day care, doctors) and the obviousness of many types ofdevelopmental disability and delay. Illness or accidents will also result in some childrenacquiring new disabilities. The group of greatest interest will be the children with adisability or delay which likely made them eligible for birth to three services but who werenot enrolled in intervention programs until they were older.
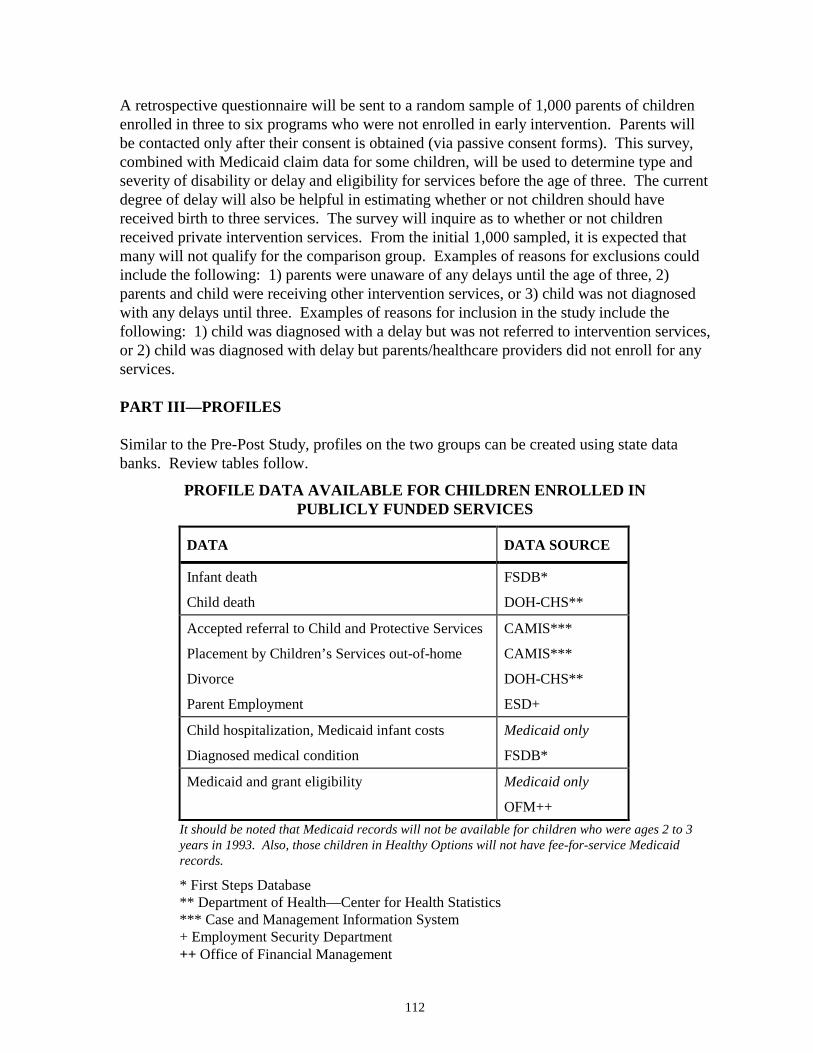
112
A retrospective questionnaire will be sent to a random sample of 1,000 parents of childrenenrolled in three to six programs who were not enrolled in early intervention. Parents willbe contacted only after their consent is obtained (via passive consent forms). This survey,combined with Medicaid claim data for some children, will be used to determine type andseverity of disability or delay and eligibility for services before the age of three. The currentdegree of delay will also be helpful in estimating whether or not children should havereceived birth to three services. The survey will inquire as to whether or not childrenreceived private intervention services. From the initial 1,000 sampled, it is expected thatmany will not qualify for the comparison group. Examples of reasons for exclusions couldinclude the following: 1) parents were unaware of any delays until the age of three, 2)parents and child were receiving other intervention services, or 3) child was not diagnosedwith any delays until three. Examples of reasons for inclusion in the study include thefollowing: 1) child was diagnosed with a delay but was not referred to intervention services,or 2) child was diagnosed with delay but parents/healthcare providers did not enroll for anyservices.
PART III—PROFILES
Similar to the Pre-Post Study, profiles on the two groups can be created using state databanks. Review tables follow.
PROFILE DATA AVAILABLE FOR CHILDREN ENROLLED INPUBLICLY FUNDED SERVICES
DATA DATA SOURCE
Infant death
Child death
FSDB*
DOH-CHS**
Accepted referral to Child and Protective Services
Placement by Children’s Services out-of-home
Divorce
Parent Employment
CAMIS***
CAMIS***
DOH-CHS**
ESD+
Child hospitalization, Medicaid infant costs
Diagnosed medical condition
Medicaid only
FSDB*
Medicaid and grant eligibility Medicaid only
OFM++It should be noted that Medicaid records will not be available for children who were ages 2 to 3years in 1993. Also, those children in Healthy Options will not have fee-for-service Medicaidrecords.
* First Steps Database** Department of Health—Center for Health Statistics*** Case and Management Information System+ Employment Security Department++ Office of Financial Management

113
PART IV—OUTCOMES
METHODS
To assess child and family outcomes, two methods will be used. A survey similar to thePre-Post Study will be sent to parents of children enrolled in three to six programs who werepreviously enrolled in birth to three. The survey will ask questions regarding impact ofservices on the child, family benefits, and service provisions (including transitionexperience). A records review will be included as part of this survey to track which servicesparents and children actually did receive.
The second method will involve sub-groups of the two comparison groups. Observationand standardized tests will be used to assess the children (who are now enrolled in three tosix programs) and their families. The study is cross-sectional and will measure data at onepoint in time.
Recruitment of Children and Families
Families who agree to be part of the study (using passive consent) will form selection pools(one for each group). From this pool, participants will be selected randomly.
Sample Size
For the survey of parents whose children were enrolled in three to six programs who werepreviously enrolled in birth to three programs the sample size will be 1,000. For theobservation and standardized assessments each group will contain 100 subjects: n=100(previously enrolled in birth to three), n=100 (not previously enrolled).
Observation and Standardized Assessment
Child Outcomes and Measures
Child outcome assessment will occur in four domains: 1) Developmental Skills, 2) Health,3) Readiness to Learn, and 4) Child Relationships. The same indicators as explainedpreviously in the study, Child/Family Serves as Own Control—Large Scale LongitudinalStudy will be used for the outcomes. The outcome, Child Relationships, will use theindicator peer group interaction as the children are older and interrelate more with peergroups than the birth to three population.
Child Development will be measured by standardized tests [e.g. Bayley Scales of InfantDevelopment (Bayley, 2nd edition, 1993) or Battelle Developmental Inventory (BDI)(Newborg et al., 1984)]. Health will be measured by a standardized checklist. Readiness toLearn indicators will be measured by structured and unstructured observation (for adiscussion of observation see Child/Family Serves as Own Control—Small ScaleLongitudinal Study in this chapter). Relationships will be measured by a non-standardizedobservational scale developed by Washington State University, Inclusion EducationResearch Project (Peck et al., 1992).
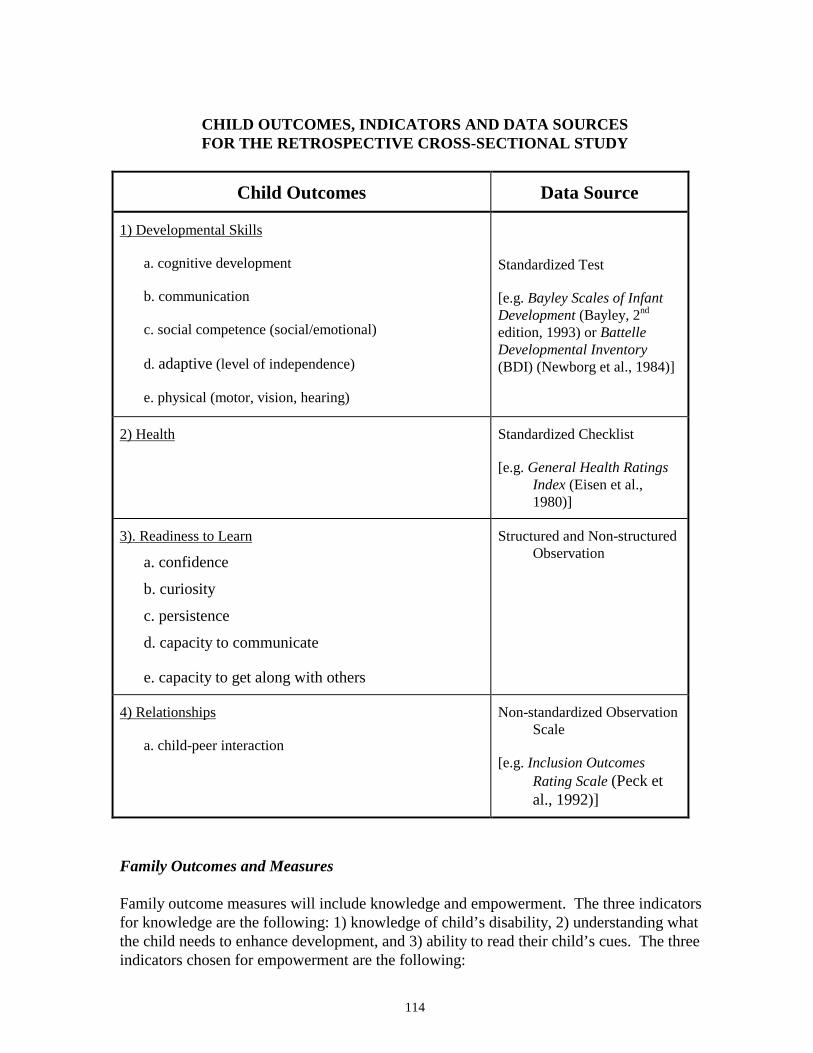
114
CHILD OUTCOMES, INDICATORS AND DATA SOURCESFOR THE RETROSPECTIVE CROSS-SECTIONAL STUDY
Child Outcomes Data Source
1) Developmental Skills
a. cognitive development
b. communication
c. social competence (social/emotional)
d. adaptive (level of independence)
e. physical (motor, vision, hearing)
Standardized Test
[e.g. Bayley Scales of InfantDevelopment (Bayley, 2nd
edition, 1993) or BattelleDevelopmental Inventory(BDI) (Newborg et al., 1984)]
2) Health Standardized Checklist
[e.g. General Health RatingsIndex (Eisen et al.,1980)]
3). Readiness to Learn
a. confidence
b. curiosity
c. persistence
d. capacity to communicate
e. capacity to get along with others
Structured and Non-structuredObservation
4) Relationships
a. child-peer interaction
Non-standardized ObservationScale
[e.g. Inclusion OutcomesRating Scale (Peck etal., 1992)]
Family Outcomes and Measures
Family outcome measures will include knowledge and empowerment. The three indicatorsfor knowledge are the following: 1) knowledge of child’s disability, 2) understanding whatthe child needs to enhance development, and 3) ability to read their child’s cues. The threeindicators chosen for empowerment are the following:

115
1) confidence in ability to enhance child’s development, 2) confidence in ability to interactwith professionals and advocate for services, and 3) locus of control (perception of self-empowerment) (see Child/Family Serves as Own Control—Large Scale Study in thischapter for a discussion of these outcomes and indicators).
Measuring knowledge and empowerment will occur through standardized self-assessmenttools [such as Parent Self-awareness Scale (Snyder et al., 1985), Child Improvement Locusof Control Scales (Devellis et al., 1985)] and structured observation [such as ParentBehavior Progression (Bromwich, 1983)].
FAMILY OUTCOMES, INDICATORS AND DATA SOURCESFOR THE RETROSPECTIVE CROSS-SECTIONAL STUDY
Family Outcomes Data Source
1) Knowledge
a. knowledge of child’s disability
b. understanding what the child needs toenhance development
c. ability to read child’s cues
Structured Observation
[e.g. Parent Behavior Progression(Bromwich, 1983)]
2) Empowerment
a. confidence in ability to enhance child’sdevelopment
b. confidence in ability to interact withprofessionals and advocate for services
c. locus of control (perception of self-empowerment)
Standardized Self-assessment
[e.g. Parent Self-awareness Scale (Snyderet al., 1985), Child Improvement Locus ofControl Scales (Devellis et al., 1985)]
Data Collection
Data collection will take place at one time 2 years after the study is initiated.
Data Analysis Methods
1) Test Outcomes
Direct comparison of scores will be used.
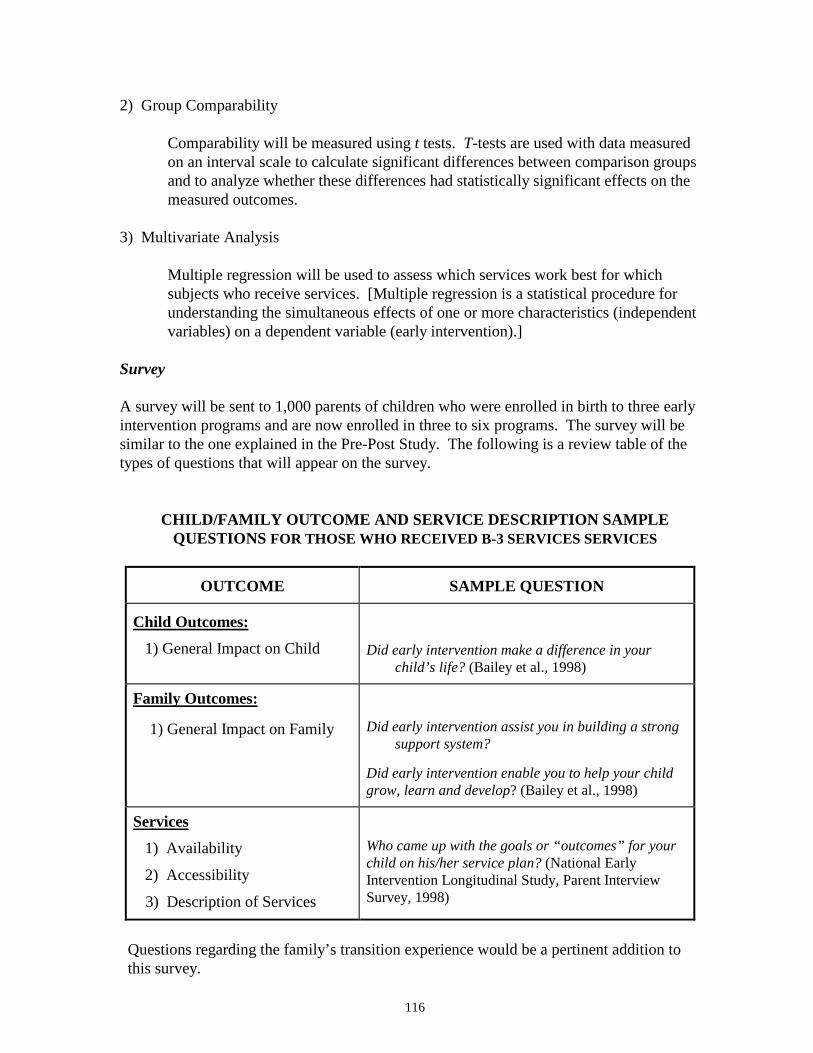
116
2) Group Comparability
Comparability will be measured using t tests. T-tests are used with data measuredon an interval scale to calculate significant differences between comparison groupsand to analyze whether these differences had statistically significant effects on themeasured outcomes.
3) Multivariate Analysis
Multiple regression will be used to assess which services work best for whichsubjects who receive services. [Multiple regression is a statistical procedure forunderstanding the simultaneous effects of one or more characteristics (independentvariables) on a dependent variable (early intervention).]
Survey
A survey will be sent to 1,000 parents of children who were enrolled in birth to three earlyintervention programs and are now enrolled in three to six programs. The survey will besimilar to the one explained in the Pre-Post Study. The following is a review table of thetypes of questions that will appear on the survey.
CHILD/FAMILY OUTCOME AND SERVICE DESCRIPTION SAMPLEQUESTIONS FOR THOSE WHO RECEIVED B-3 SERVICES SERVICES
OUTCOME SAMPLE QUESTION
Child Outcomes:1) General Impact on Child Did early intervention make a difference in your
child’s life? (Bailey et al., 1998)
Family Outcomes:
1) General Impact on Family Did early intervention assist you in building a strongsupport system?
Did early intervention enable you to help your childgrow, learn and develop? (Bailey et al., 1998)
Services1) Availability
2) Accessibility
3) Description of Services
Who came up with the goals or “outcomes” for yourchild on his/her service plan? (National EarlyIntervention Longitudinal Study, Parent InterviewSurvey, 1998)
Questions regarding the family’s transition experience would be a pertinent addition to this survey.
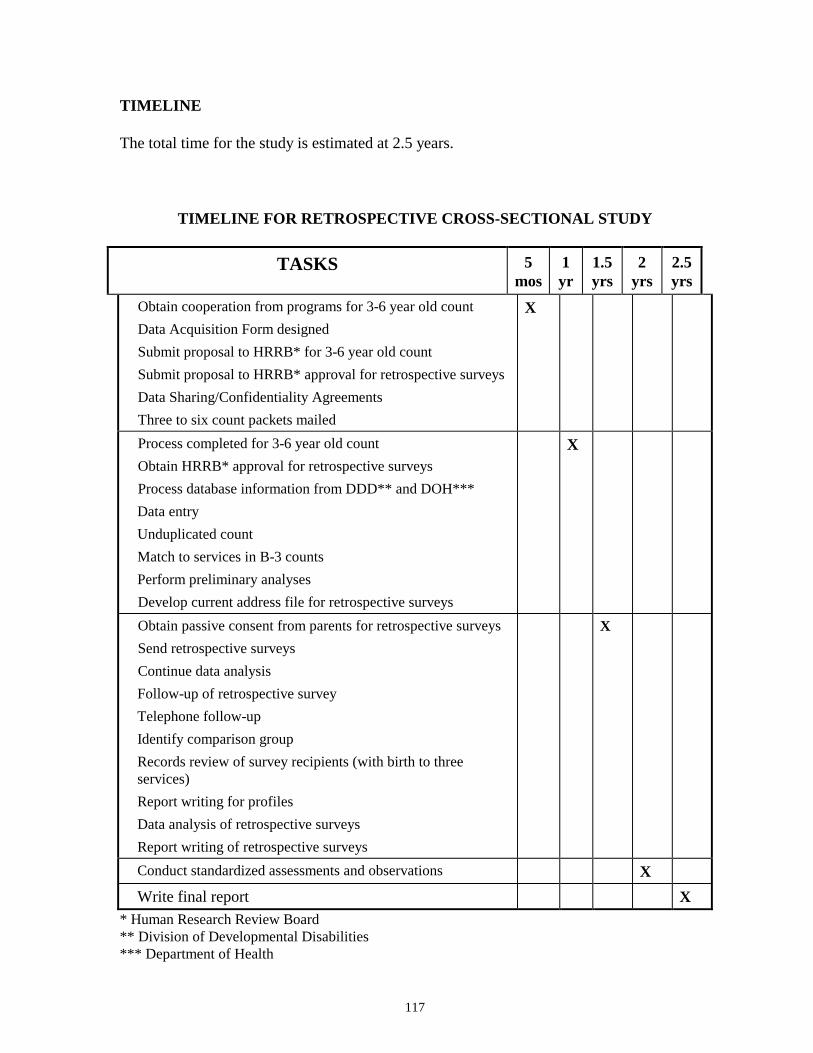
117
TIMELINE
The total time for the study is estimated at 2.5 years.
TIMELINE FOR RETROSPECTIVE CROSS-SECTIONAL STUDY
TASKS 5mos
1yr
1.5yrs
2yrs
2.5yrs
Obtain cooperation from programs for 3-6 year old countData Acquisition Form designedSubmit proposal to HRRB* for 3-6 year old countSubmit proposal to HRRB* approval for retrospective surveysData Sharing/Confidentiality AgreementsThree to six count packets mailed
X
Process completed for 3-6 year old countObtain HRRB* approval for retrospective surveysProcess database information from DDD** and DOH***Data entryUnduplicated countMatch to services in B-3 countsPerform preliminary analysesDevelop current address file for retrospective surveys
X
Obtain passive consent from parents for retrospective surveysSend retrospective surveysContinue data analysisFollow-up of retrospective surveyTelephone follow-upIdentify comparison groupRecords review of survey recipients (with birth to threeservices)Report writing for profilesData analysis of retrospective surveysReport writing of retrospective surveys
X
Conduct standardized assessments and observations XWrite final report X
* Human Research Review Board** Division of Developmental Disabilities*** Department of Health
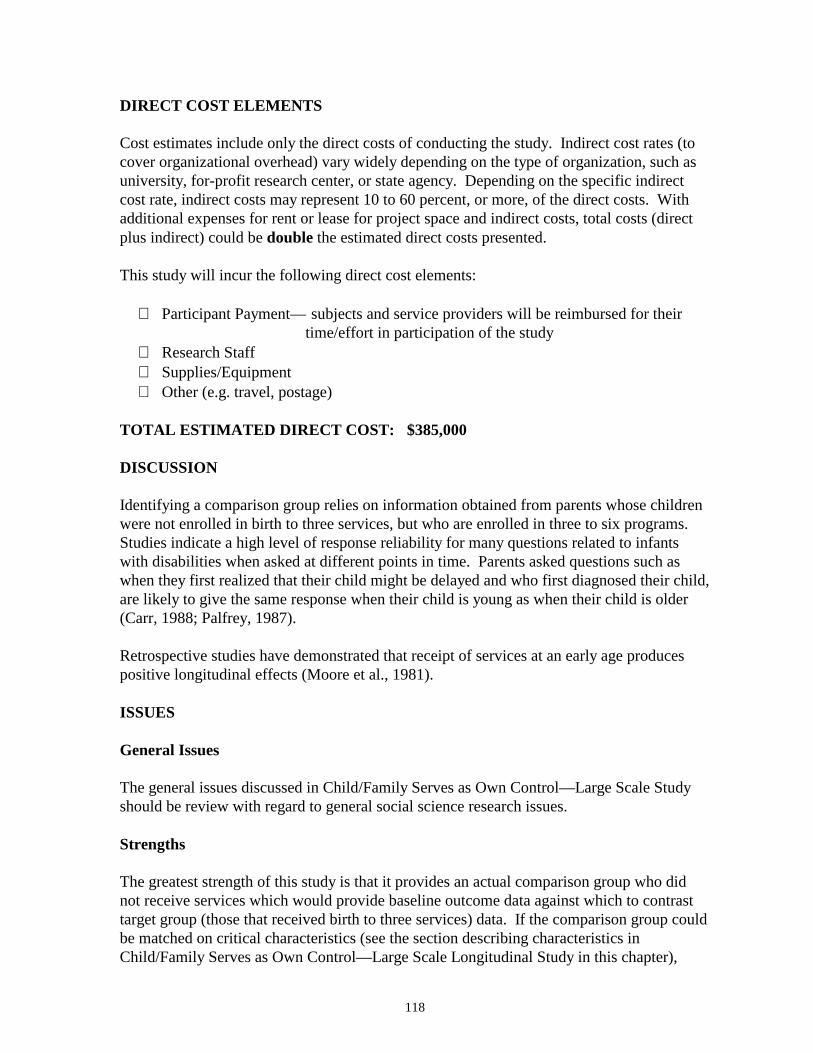
118
DIRECT COST ELEMENTS
Cost estimates include only the direct costs of conducting the study. Indirect cost rates (tocover organizational overhead) vary widely depending on the type of organization, such asuniversity, for-profit research center, or state agency. Depending on the specific indirectcost rate, indirect costs may represent 10 to 60 percent, or more, of the direct costs. Withadditional expenses for rent or lease for project space and indirect costs, total costs (directplus indirect) could be double the estimated direct costs presented.
This study will incur the following direct cost elements:
∗ Participant Payment— subjects and service providers will be reimbursed for their time/effort in participation of the study
∗ Research Staff∗ Supplies/Equipment∗ Other (e.g. travel, postage)
TOTAL ESTIMATED DIRECT COST: $385,000
DISCUSSION
Identifying a comparison group relies on information obtained from parents whose childrenwere not enrolled in birth to three services, but who are enrolled in three to six programs.Studies indicate a high level of response reliability for many questions related to infantswith disabilities when asked at different points in time. Parents asked questions such aswhen they first realized that their child might be delayed and who first diagnosed their child,are likely to give the same response when their child is young as when their child is older(Carr, 1988; Palfrey, 1987).
Retrospective studies have demonstrated that receipt of services at an early age producespositive longitudinal effects (Moore et al., 1981).
ISSUES
General Issues
The general issues discussed in Child/Family Serves as Own Control—Large Scale Studyshould be review with regard to general social science research issues.
Strengths
The greatest strength of this study is that it provides an actual comparison group who didnot receive services which would provide baseline outcome data against which to contrasttarget group (those that received birth to three services) data. If the comparison group couldbe matched on critical characteristics (see the section describing characteristics inChild/Family Serves as Own Control—Large Scale Longitudinal Study in this chapter),
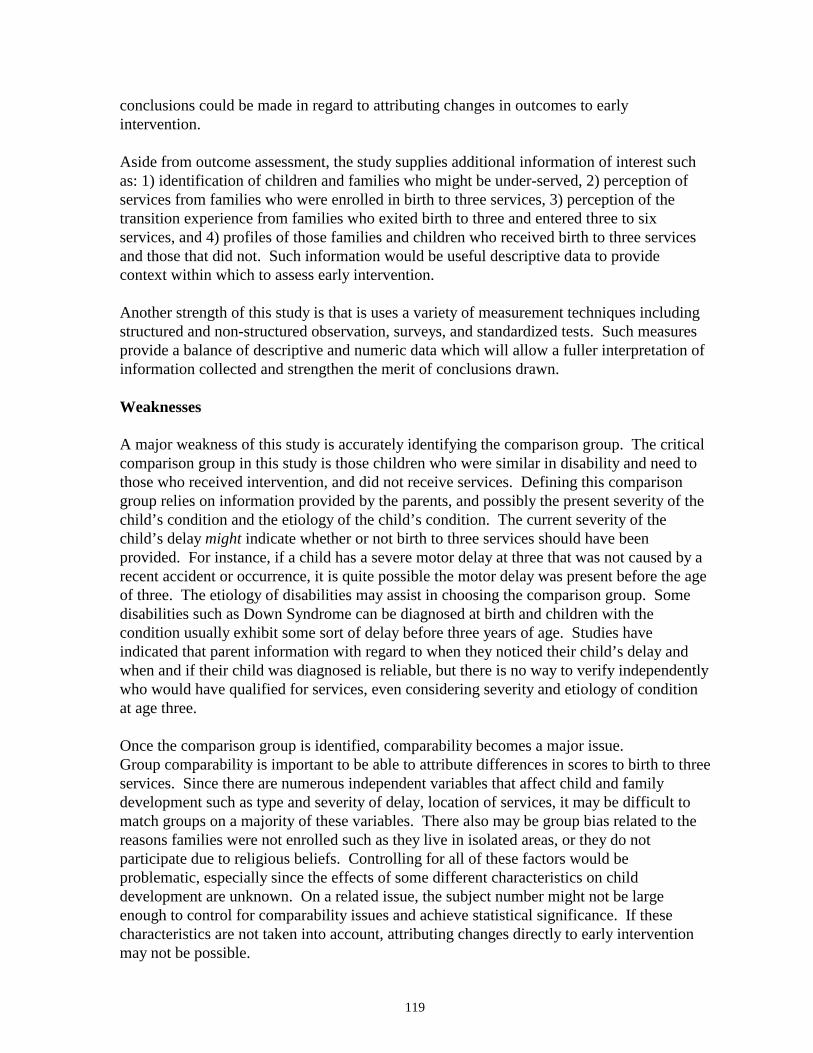
119
conclusions could be made in regard to attributing changes in outcomes to earlyintervention.
Aside from outcome assessment, the study supplies additional information of interest suchas: 1) identification of children and families who might be under-served, 2) perception ofservices from families who were enrolled in birth to three services, 3) perception of thetransition experience from families who exited birth to three and entered three to sixservices, and 4) profiles of those families and children who received birth to three servicesand those that did not. Such information would be useful descriptive data to providecontext within which to assess early intervention.
Another strength of this study is that is uses a variety of measurement techniques includingstructured and non-structured observation, surveys, and standardized tests. Such measuresprovide a balance of descriptive and numeric data which will allow a fuller interpretation ofinformation collected and strengthen the merit of conclusions drawn.
Weaknesses
A major weakness of this study is accurately identifying the comparison group. The criticalcomparison group in this study is those children who were similar in disability and need tothose who received intervention, and did not receive services. Defining this comparisongroup relies on information provided by the parents, and possibly the present severity of thechild’s condition and the etiology of the child’s condition. The current severity of thechild’s delay might indicate whether or not birth to three services should have beenprovided. For instance, if a child has a severe motor delay at three that was not caused by arecent accident or occurrence, it is quite possible the motor delay was present before the ageof three. The etiology of disabilities may assist in choosing the comparison group. Somedisabilities such as Down Syndrome can be diagnosed at birth and children with thecondition usually exhibit some sort of delay before three years of age. Studies haveindicated that parent information with regard to when they noticed their child’s delay andwhen and if their child was diagnosed is reliable, but there is no way to verify independentlywho would have qualified for services, even considering severity and etiology of conditionat age three.
Once the comparison group is identified, comparability becomes a major issue.Group comparability is important to be able to attribute differences in scores to birth to threeservices. Since there are numerous independent variables that affect child and familydevelopment such as type and severity of delay, location of services, it may be difficult tomatch groups on a majority of these variables. There also may be group bias related to thereasons families were not enrolled such as they live in isolated areas, or they do notparticipate due to religious beliefs. Controlling for all of these factors would beproblematic, especially since the effects of some different characteristics on childdevelopment are unknown. On a related issue, the subject number might not be largeenough to control for comparability issues and achieve statistical significance. If thesecharacteristics are not taken into account, attributing changes directly to early interventionmay not be possible.
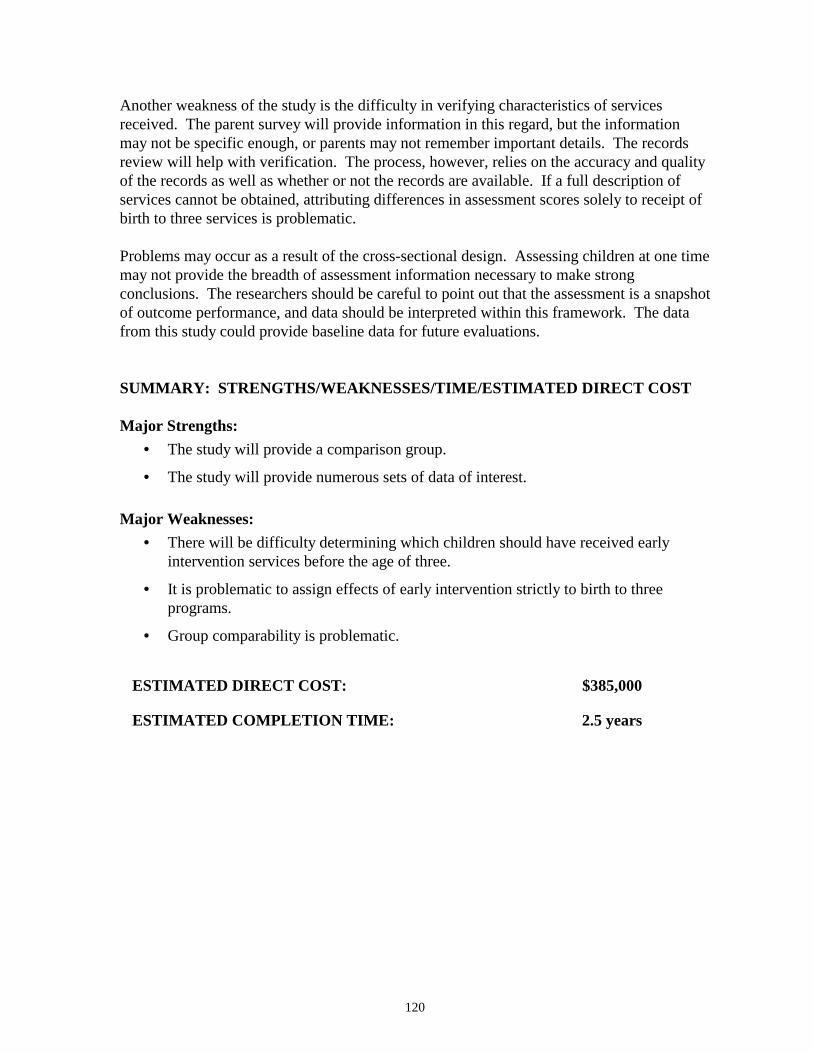
120
Another weakness of the study is the difficulty in verifying characteristics of servicesreceived. The parent survey will provide information in this regard, but the informationmay not be specific enough, or parents may not remember important details. The recordsreview will help with verification. The process, however, relies on the accuracy and qualityof the records as well as whether or not the records are available. If a full description ofservices cannot be obtained, attributing differences in assessment scores solely to receipt ofbirth to three services is problematic.
Problems may occur as a result of the cross-sectional design. Assessing children at one timemay not provide the breadth of assessment information necessary to make strongconclusions. The researchers should be careful to point out that the assessment is a snapshotof outcome performance, and data should be interpreted within this framework. The datafrom this study could provide baseline data for future evaluations.
SUMMARY: STRENGTHS/WEAKNESSES/TIME/ESTIMATED DIRECT COST
Major Strengths:• The study will provide a comparison group.
• The study will provide numerous sets of data of interest.
Major Weaknesses:• There will be difficulty determining which children should have received early
intervention services before the age of three.
• It is problematic to assign effects of early intervention strictly to birth to threeprograms.
• Group comparability is problematic.
ESTIMATED DIRECT COST: $385,000
ESTIMATED COMPLETION TIME: 2.5 years

121
KEY INFORMANT STUDY
DESCRIPTION
The study examines perceptions of key informants across Washington State regardingchild and family outcomes, and provision, quality, and needs of early interventionservices for infants/toddlers and families with delaying or disabling conditions. Twoapproaches will be discussed: the three-tiered approach, which uses interviews andfocus groups to select outcomes before conducting a written survey, and the survey-only approach which begins with pre-established outcomes and uses survey questionsthat are already developed.
THREE-TIERED APPROACH
Outcomes
The aim of the open-ended interviews with a small sample of parents and serviceproviders is to suggest child and family outcomes. The focus groups will providefeedback regarding the outcomes derived. The qualitative data collected during theseprocesses will provide a rich context within which to interpret survey results.
Methods(1) Qualitative interviews with parents and service providers(2) Focus groups with parents and service providers(3) Written survey of parents and service providers
SURVEY-ONLY APPROACH
Child Outcomes: (1) Child Development (2) Quality of Life(3) Child Interaction/Behavior
Family Outcomes: (1) Support (2) Quality of Life(3) Knowledge (4) Empowerment
Services: (1) Description of Services
METHODS
(1) County Interagency Coordinating Council (CICC) Survey(2) Survey of Service Providers(3) Survey of Parents(4) County Interagency Coordinating Council (CICC) Focus Groups
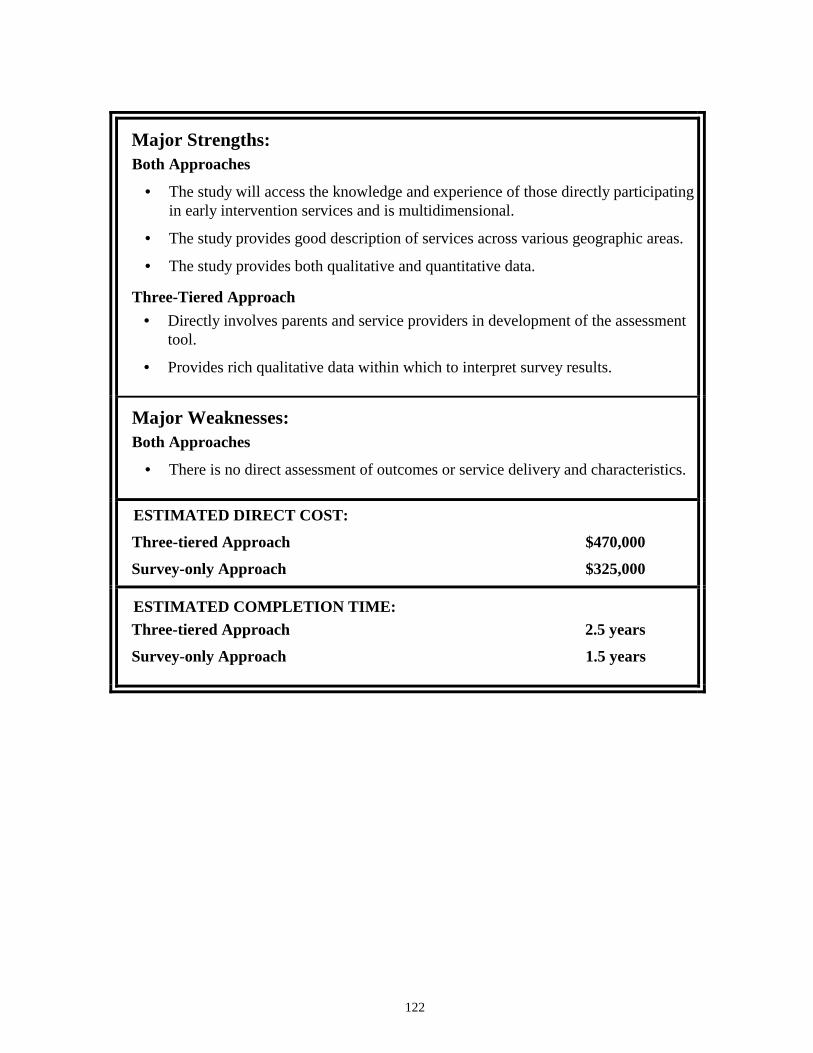
122
Major Strengths:Both Approaches
• The study will access the knowledge and experience of those directly participatingin early intervention services and is multidimensional.
• The study provides good description of services across various geographic areas.
• The study provides both qualitative and quantitative data.
Three-Tiered Approach• Directly involves parents and service providers in development of the assessment
tool.
• Provides rich qualitative data within which to interpret survey results.
Major Weaknesses:Both Approaches
• There is no direct assessment of outcomes or service delivery and characteristics.
ESTIMATED DIRECT COST:
Three-tiered Approach $470,000
Survey-only Approach $325,000
ESTIMATED COMPLETION TIME:Three-tiered Approach 2.5 years
Survey-only Approach 1.5 years
123
KEY INFORMANT STUDY
SUMMARY
This study is a qualitative exploration of the status of early intervention services in the stateof Washington and its impact on children, birth to three, with disabling or delayingconditions and their families. The study examines perceptions of key informants across thestate regarding child and family outcomes; and provision, quality, and needs of earlyintervention services for children and families with delaying or disabling conditions in theircommunities.
INTRODUCTION
This study draws upon the perceptions and attitudes of those participants who are in keypositions to observe and appraise early intervention services in the state of Washington inorder to assess the impact of those services on children with delaying or disablingconditions and their families.
Three-Tiered Approach
The three-tiered approach proceeds from the idea that child and family outcomes should beselected directly from the input of early intervention participants, particularly parents andservice providers. This approach involves three steps: 1) open-ended interviews withparents and service providers, 2) focus groups with parents and service providers, and 3) awritten survey of parents and service providers. The aims of the open-ended interview witha small sample of parents and service providers are to collect qualitative data to provide arich context within which to interpret survey results, and to derive suggestions of possiblechild and family outcomes. The purpose of the focus groups is to gather feedback regardingthe outcomes derived, and to gather additional contextual qualitative data. From the resultsof the interviews and focus groups, outcomes will be selected and survey questionsdeveloped.
Survey-Only Approach
The survey-only approach uses child and family outcomes determined by previous studies,and gathers data through a written survey of key informants and small focus groups. Suchinformants include service providers, parents, and community groups. The communitygroups chosen for the survey are the County Interagency Coordinating Councils (CICCs).CICC members represent health departments, medical providers, school districts, parents,service providers, and other public and private agencies. The CICCs plan and coordinateservices at the community levels and aid communities in achieving Part H goals. SinceCICC members include those vital to the functioning of early intervention programs, theyare a rich source of key informants and provide a fruitful focus point for this study.
Three surveys will be developed for use in the study: 1) the family survey, 2) the serviceprovider survey, and 3) the County Interagency Coordinating Council (CICC) survey.The family and provider survey will contain virtually the same questions, only asked from
124
the relevant perspective. The CICC survey will focus more on provision of services andwill inquire about family and child outcomes only in a general way (see the subsequentsection, County Interagency Coordinating Council Survey, Survey-Only Approach, Childand Family Outcomes). The focus groups will occur at CICC meetings to providequalitative contextual data.
METHODS—THREE-TIERED APPROACH
Eligibility and Recruitment
Qualitative Interviews
It is suggested that open-ended qualitative interviews should be conducted with twentyservice providers and twenty parents (n=40 total). Selection of these participants should becarefully thought out. Various geographic locations should be represented, parents andservice providers of children with various conditions should be included, as well as thosewith different opinions regarding early intervention services. If parents of children who areeight to ten years old can be located, several should be interviewed to provide a longitudinalperspective. The 1993 Research and Data Analysis child count database can be used toidentify these parents. Informal conversations with service providers and parents could aidin selection of interview participants.
Focus Groups
At least nine locations strategically selected across Washington State should be establishedfor focus group locations. At the nine locations, one focus group should be held for parentsand one for service providers for a total of eighteen focus groups. Locations should berepresentative of various regions in Washington State.
Survey
Those eligible for the study are families who are included in the early intervention childenrollment counts. The sample size will include 1,000 families and their service providers(n=2,000 total) and will be selected randomly to receive a mailed survey. The serviceproviders of these families will receive a survey for each family under their care. Apercentage of the number of families (n=1,000) should include those whose children areolder to provide a longitudinal perspective. (The 1993 Research and Data Analysis childcount database can be used to identify these parents.)
Interviews
After participants are selected, open-ended interviews will be conducted. The aims of theinterview are to identify some possible outcomes and to gather contextual descriptive data.While the trained interviewer should be sure to gather feedback regarding outcomes, theother content of interview can be quite unstructured. Open-ended interviews can be used asan exploratory tool to draw out points not previously considered by the researcher. Theinformation will then be coded and prevalent themes identified.
125
Focus Groups
Similarly, the focus groups will be unstructured. The aim of these groups is to providefeedback on outcomes which arose from the interviews and provide another source ofcontextual descriptive data. Discussion will last approximately three hours, so it is feasibleto do both focus groups (parents and service providers) in one day.
Survey
From the input of parents and service providers, outcomes will be selected and pertinentsurvey questions developed. The survey can either draw from other established surveys ifquestions are appropriate for the outcomes, or create a new survey. If the latter is chosen, asmall pilot study of the survey should be conducted in order to refine the questions.
Child and Family Outcomes
Child and family outcomes will be derived from the qualitative interviews and focus groups.
Description of Services
In order to gain some idea of what kind of services children and families are receiving, adescription of services must be included as part of the survey. Questions should revolvearound identified relevant program characteristics (see Appendix B and the followingsection Description of Services for example questions).
METHODS—SURVEY-ONLY APPROACH
Eligibility Criteria and Sample Size
Those eligible for the study are families who are included in the most recent earlyintervention child enrollment count. The sample size will include 1,000 families and will beselected randomly to receive a mailed survey. The service providers of these families willreceive a survey for each family. All County Interagency Coordinating Councils (35) willbe contacted.
Sample numbers therefore include the following: 1,000 family surveys and 1,000 serviceprovider surveys. The number of County Interagency Coordinating Council (CICC)participants will depend on meeting attendance.
Recruitment of Families and Service Providers
Families will be randomly selected from the child count conducted by Research and DataAnalysis of the Department of Social and Health Services. Once these families areidentified, their service providers will be contacted. The service providers will thencontact the families to obtain consent for researchers to contact them (via passive consentforms). Providers will then furnish addresses of the families that agree to participate.

126
Researchers will send families the family survey, and providers will be sent the serviceprovider survey. All those who complete a survey will be reimbursed for their time, andservice providers will be paid an hourly rate for their time involved in recruitment.
County Interagency Coordinating Council (CICC) Written Survey and Focus Groups
The written survey will be presented to CICC meetings with a brief explanation of itspurpose and aims. Researchers will request approximately four hours of meeting time toconduct the study survey and focus groups. The first 45 minutes of the meeting will involvecompletion of the written survey. After a short break, focus groups will take place over athree hour period. The remainder of the meeting will be spent gathering suggestions andinformation regarding possible other community members to whom the written survey willbe mailed.
Possible focus group questions could include the following:
1) In the past five years, what were major influences that supported theimplementation of Part H in your county?
2) What are positive outcomes of early intervention for children? Families?Your community?
3) What are the major accomplishments achieved by early intervention servicesin your area during the past five years?
4) In the past five years, what were major problems that interfered with theimplementation of Part H in your county? What resolutions to theseproblems have been attempted? Were they effective?
5) What problems still remain? How large are they?
6) In the past five years, what barriers to services were there? What solutions tothese barriers have been attempted? Were they effective?
7) What objectives would you set with regard to early intervention in the nextfive years?
Child Outcomes and Measures
The child outcomes include the domains: 1) Child Development, 2) Quality of Life, and 3)Child Behavior/Interaction. These outcomes were selected because of their generalapplicability to many families, and because feedback on these outcomes is readily attainablein the survey format. Since child outcomes will be evaluated from the perspective of theparents and service providers, questions should be worded to reflect these differentviewpoints. Questions will be based on Likert Scale ratings for data
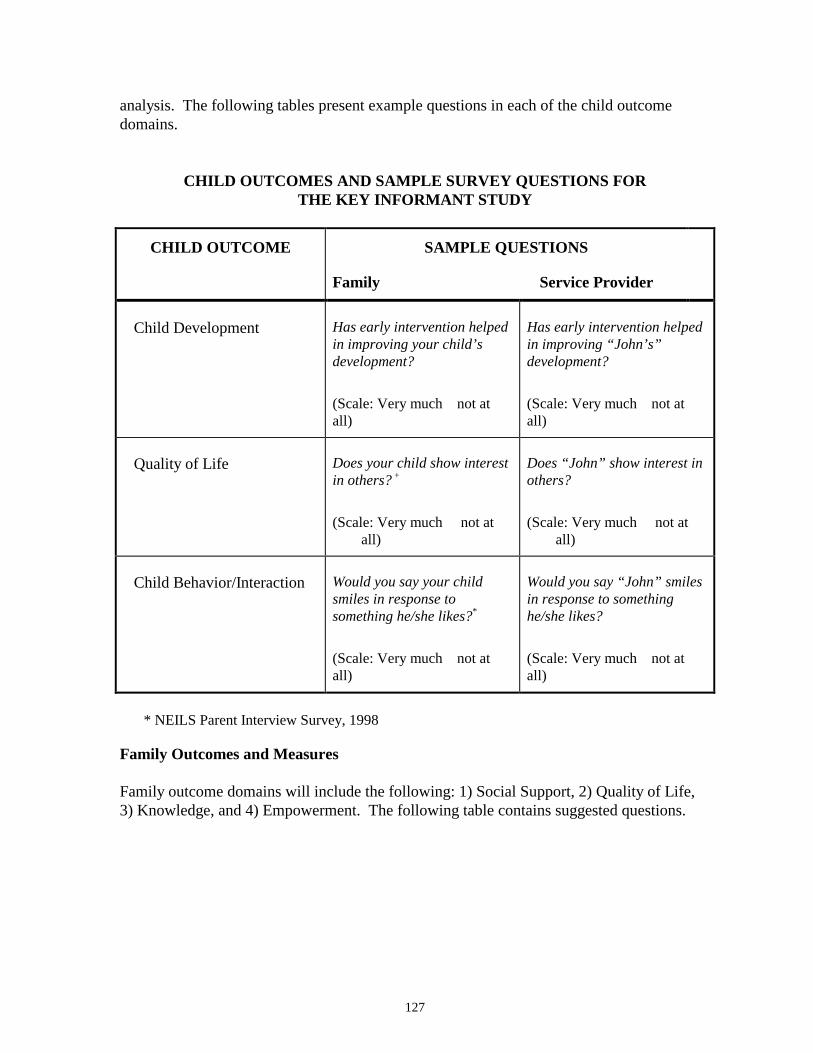
127
analysis. The following tables present example questions in each of the child outcomedomains.
CHILD OUTCOMES AND SAMPLE SURVEY QUESTIONS FORTHE KEY INFORMANT STUDY
CHILD OUTCOME SAMPLE QUESTIONS
Family Service Provider
Child Development Has early intervention helpedin improving your child’sdevelopment?
(Scale: Very much not atall)
Has early intervention helpedin improving “John’s”development?
(Scale: Very much not atall)
Quality of Life Does your child show interestin others? +
(Scale: Very much not atall)
Does “John” show interest inothers?
(Scale: Very much not atall)
Child Behavior/Interaction Would you say your childsmiles in response tosomething he/she likes?*
(Scale: Very much not atall)
Would you say “John” smilesin response to somethinghe/she likes?
(Scale: Very much not atall)
* NEILS Parent Interview Survey, 1998
Family Outcomes and Measures
Family outcome domains will include the following: 1) Social Support, 2) Quality of Life,3) Knowledge, and 4) Empowerment. The following table contains suggested questions.
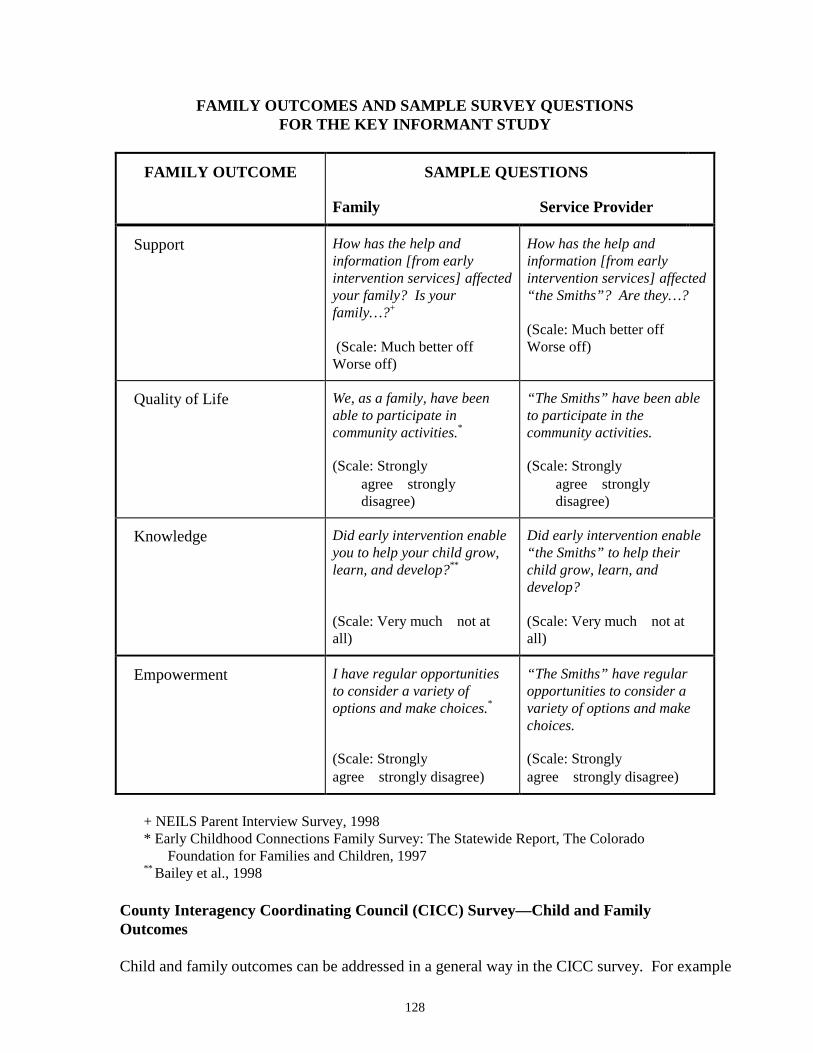
128
FAMILY OUTCOMES AND SAMPLE SURVEY QUESTIONSFOR THE KEY INFORMANT STUDY
FAMILY OUTCOME SAMPLE QUESTIONS
Family Service Provider
Support How has the help andinformation [from earlyintervention services] affectedyour family? Is yourfamily…?+
(Scale: Much better off Worse off)
How has the help andinformation [from earlyintervention services] affected“the Smiths”? Are they…?
(Scale: Much better off Worse off)
Quality of Life We, as a family, have beenable to participate incommunity activities.*
(Scale: Stronglyagree stronglydisagree)
“The Smiths” have been ableto participate in thecommunity activities.
(Scale: Stronglyagree stronglydisagree)
Knowledge Did early intervention enableyou to help your child grow,learn, and develop?**
(Scale: Very much not atall)
Did early intervention enable“the Smiths” to help theirchild grow, learn, anddevelop?
(Scale: Very much not atall)
Empowerment I have regular opportunitiesto consider a variety ofoptions and make choices.*
(Scale: Stronglyagree strongly disagree)
“The Smiths” have regularopportunities to consider avariety of options and makechoices.
(Scale: Stronglyagree strongly disagree)
+ NEILS Parent Interview Survey, 1998* Early Childhood Connections Family Survey: The Statewide Report, The Colorado
Foundation for Families and Children, 1997** Bailey et al., 1998
County Interagency Coordinating Council (CICC) Survey—Child and FamilyOutcomes
Child and family outcomes can be addressed in a general way in the CICC survey. For example
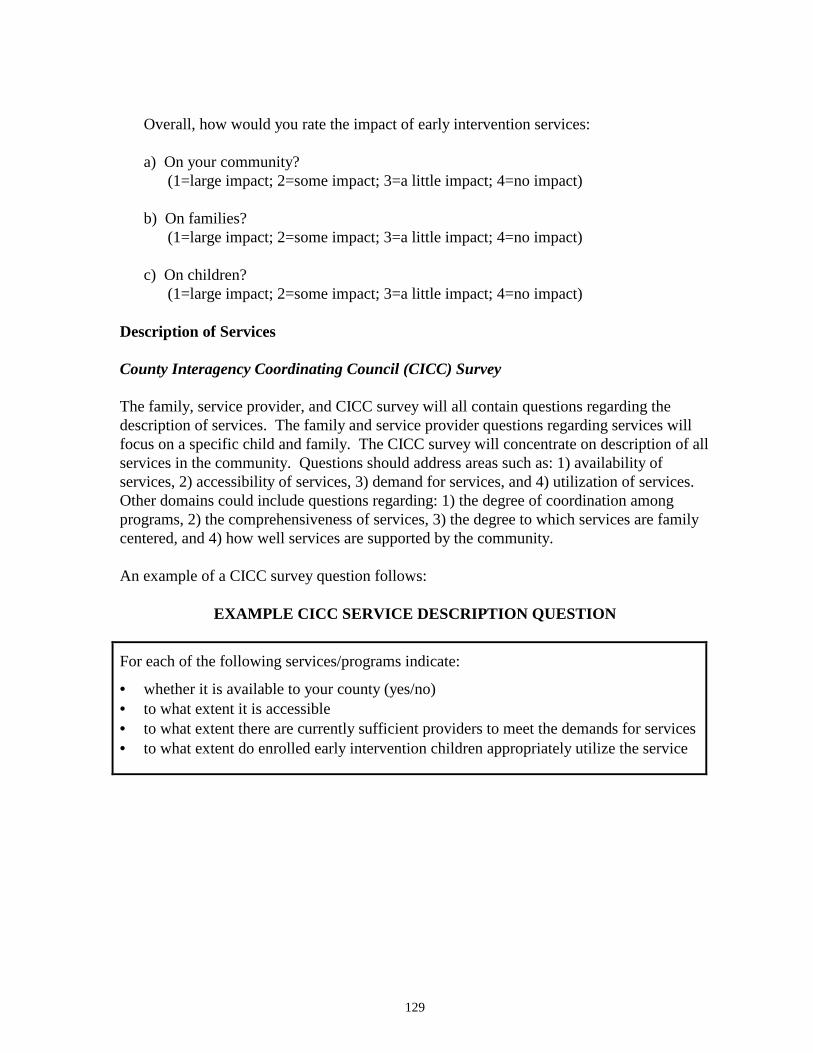
129
Overall, how would you rate the impact of early intervention services:
a) On your community?(1=large impact; 2=some impact; 3=a little impact; 4=no impact)
b) On families?(1=large impact; 2=some impact; 3=a little impact; 4=no impact)
c) On children?(1=large impact; 2=some impact; 3=a little impact; 4=no impact)
Description of Services
County Interagency Coordinating Council (CICC) Survey
The family, service provider, and CICC survey will all contain questions regarding thedescription of services. The family and service provider questions regarding services willfocus on a specific child and family. The CICC survey will concentrate on description of allservices in the community. Questions should address areas such as: 1) availability ofservices, 2) accessibility of services, 3) demand for services, and 4) utilization of services.Other domains could include questions regarding: 1) the degree of coordination amongprograms, 2) the comprehensiveness of services, 3) the degree to which services are familycentered, and 4) how well services are supported by the community.
An example of a CICC survey question follows:
EXAMPLE CICC SERVICE DESCRIPTION QUESTION
For each of the following services/programs indicate:
• whether it is available to your county (yes/no)• to what extent it is accessible• to what extent there are currently sufficient providers to meet the demands for services• to what extent do enrolled early intervention children appropriately utilize the service
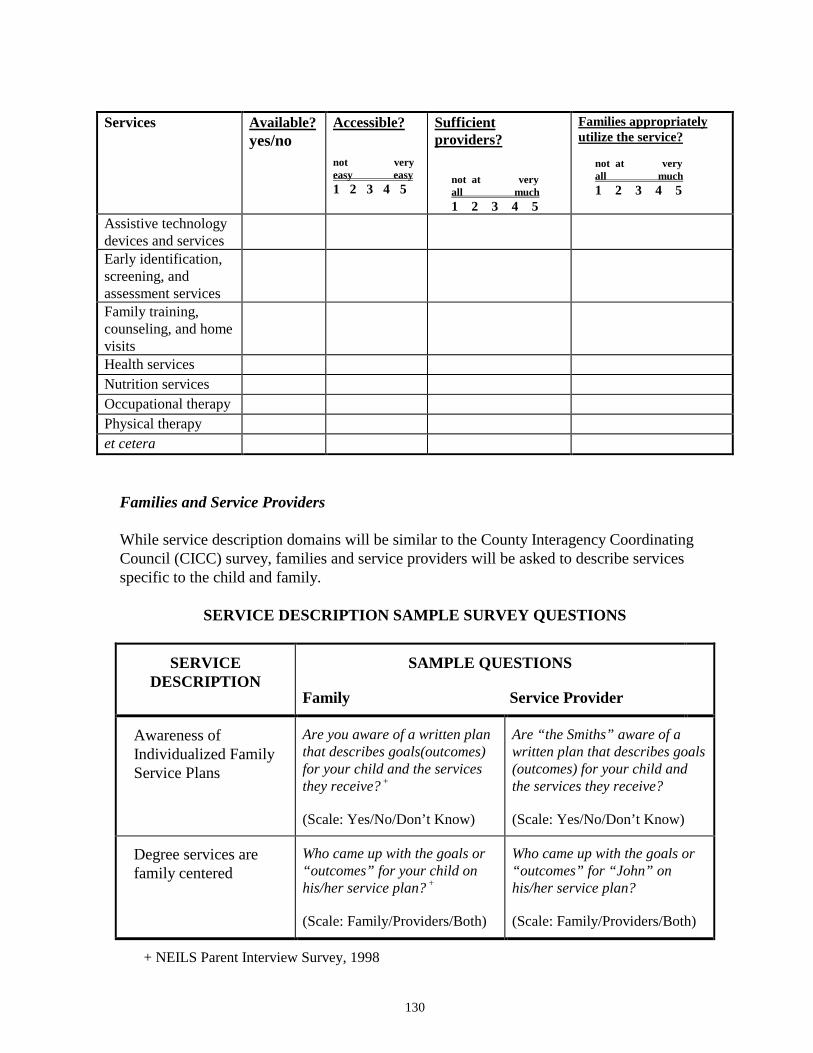
130
Services Available?yes/no
Accessible?
not veryeasy easy1 2 3 4 5
Sufficientproviders?
not at veryall much1 2 3 4 5
Families appropriatelyutilize the service?
not at veryall much1 2 3 4 5
Assistive technologydevices and servicesEarly identification,screening, andassessment servicesFamily training,counseling, and homevisitsHealth servicesNutrition servicesOccupational therapyPhysical therapyet cetera
Families and Service Providers
While service description domains will be similar to the County Interagency CoordinatingCouncil (CICC) survey, families and service providers will be asked to describe servicesspecific to the child and family.
SERVICE DESCRIPTION SAMPLE SURVEY QUESTIONS
SERVICEDESCRIPTION
SAMPLE QUESTIONS
Family Service Provider
Awareness ofIndividualized FamilyService Plans
Are you aware of a written planthat describes goals(outcomes)for your child and the servicesthey receive? +
(Scale: Yes/No/Don’t Know)
Are “the Smiths” aware of awritten plan that describes goals(outcomes) for your child andthe services they receive?
(Scale: Yes/No/Don’t Know)
Degree services arefamily centered
Who came up with the goals or“outcomes” for your child onhis/her service plan? +
(Scale: Family/Providers/Both)
Who came up with the goals or“outcomes” for “John” onhis/her service plan?
(Scale: Family/Providers/Both)
+ NEILS Parent Interview Survey, 1998
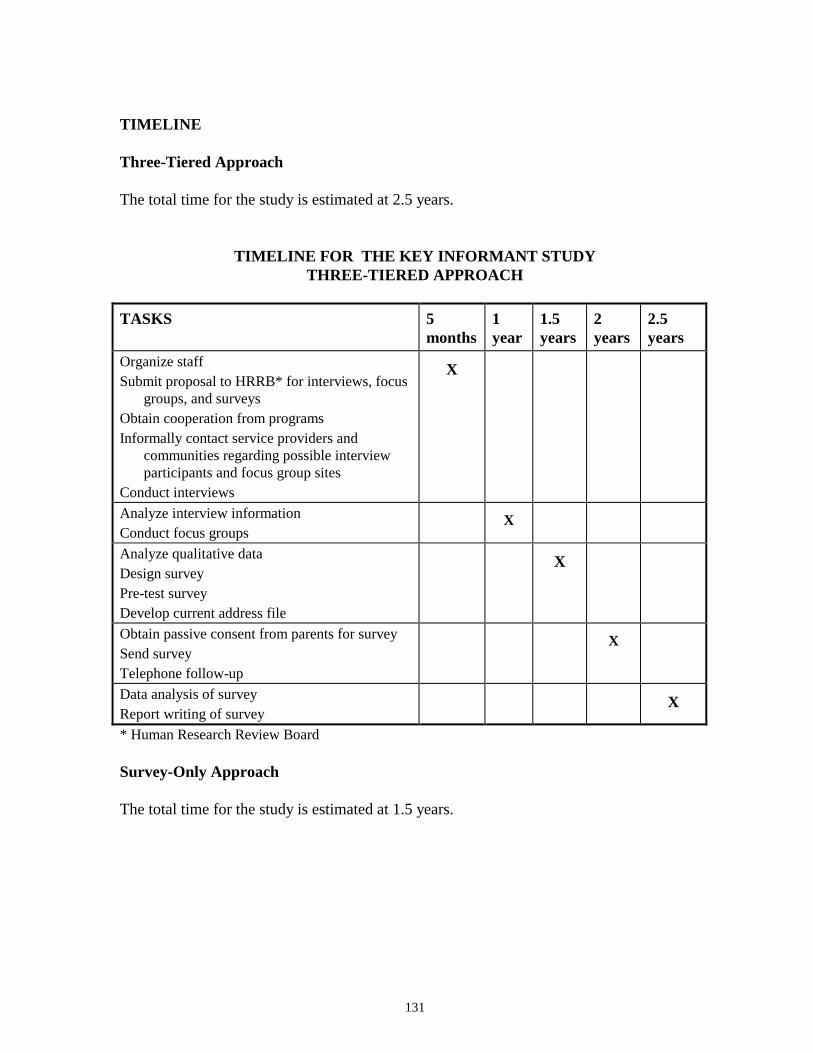
131
TIMELINE
Three-Tiered Approach
The total time for the study is estimated at 2.5 years.
TIMELINE FOR THE KEY INFORMANT STUDYTHREE-TIERED APPROACH
TASKS 5months
1year
1.5years
2years
2.5years
Organize staffSubmit proposal to HRRB* for interviews, focus
groups, and surveysObtain cooperation from programsInformally contact service providers and
communities regarding possible interviewparticipants and focus group sites
Conduct interviews
X
Analyze interview informationConduct focus groups
X
Analyze qualitative dataDesign surveyPre-test surveyDevelop current address file
X
Obtain passive consent from parents for surveySend surveyTelephone follow-up
X
Data analysis of surveyReport writing of survey
X
* Human Research Review Board
Survey-Only Approach
The total time for the study is estimated at 1.5 years.
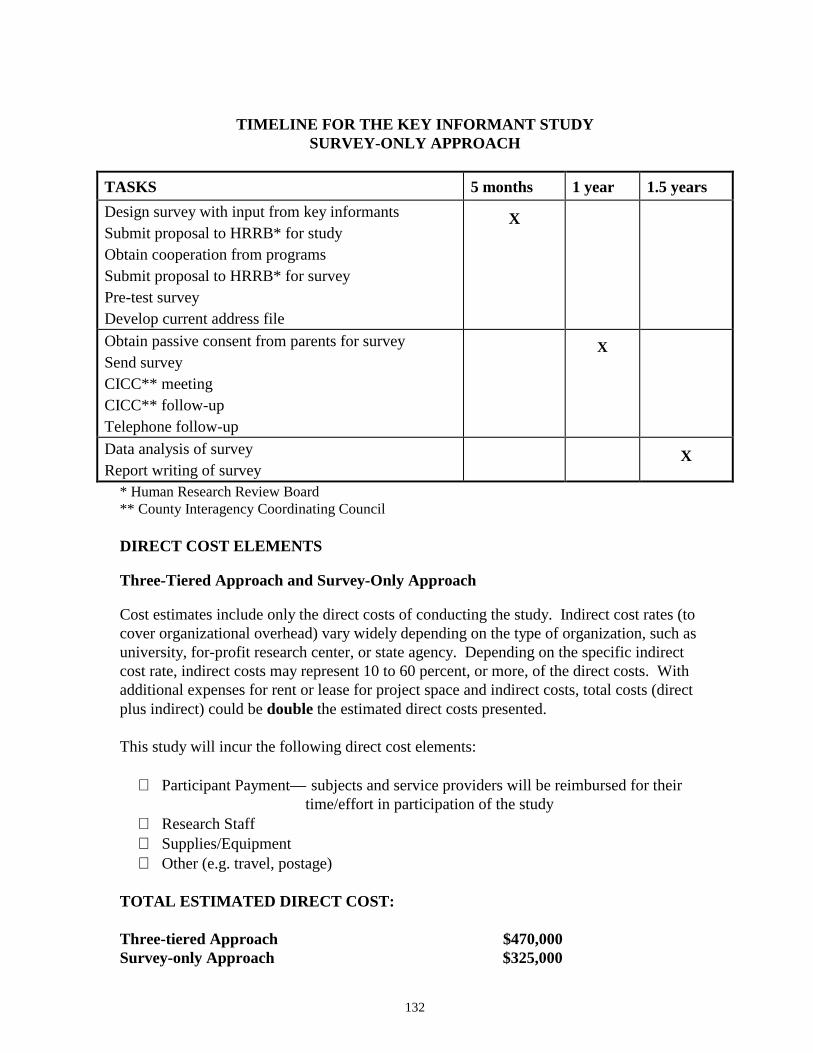
132
TIMELINE FOR THE KEY INFORMANT STUDYSURVEY-ONLY APPROACH
TASKS 5 months 1 year 1.5 yearsDesign survey with input from key informantsSubmit proposal to HRRB* for studyObtain cooperation from programsSubmit proposal to HRRB* for surveyPre-test surveyDevelop current address file
X
Obtain passive consent from parents for surveySend surveyCICC** meetingCICC** follow-upTelephone follow-up
X
Data analysis of surveyReport writing of survey
X
* Human Research Review Board** County Interagency Coordinating Council
DIRECT COST ELEMENTS
Three-Tiered Approach and Survey-Only Approach
Cost estimates include only the direct costs of conducting the study. Indirect cost rates (tocover organizational overhead) vary widely depending on the type of organization, such asuniversity, for-profit research center, or state agency. Depending on the specific indirectcost rate, indirect costs may represent 10 to 60 percent, or more, of the direct costs. Withadditional expenses for rent or lease for project space and indirect costs, total costs (directplus indirect) could be double the estimated direct costs presented.
This study will incur the following direct cost elements:
∗ Participant Payment— subjects and service providers will be reimbursed for their time/effort in participation of the study
∗ Research Staff∗ Supplies/Equipment∗ Other (e.g. travel, postage)
TOTAL ESTIMATED DIRECT COST:
Three-tiered Approach $470,000Survey-only Approach $325,000
133
DISCUSSION
Given the methodological difficulties associated with scientific evaluation of the impact ofearly intervention services (Casto and White, 1993; Eayrs and Jones, 1992; Mott et al.,1986; Casto and Mastropieri, 1986), many state and federal governments have turned to keyinformant surveys to gain a greater understanding of the need and impact of services in agiven area, and to ascertain the perceived impact of early intervention on children withdisabling or delaying conditions and their families (see Chapters 3 and 4). By contrastingthe perceptions of service providers and service receivers, a multidimensional assessment ofearly intervention can occur.
Three-Tiered Approach
The major advantage of the three-tiered approach is derived from the inclusive participationof service providers and parents in developing research tools. Green and McAllister (1998)explain why research benefits from the participatory evaluation method:
• Such a method provides a format for evaluators, practitioners, and family membersto share their thoughts about how and why a program works.
• The evaluation tool more accurately reflects the actual program process and intended
outcomes. • The method encourages a systematic, commonly understood method for prioritizing
evaluation activities. • The method provides a framework for sharing information with programs and
parents.
Direct involvement of service providers and parents at the ground level of planning allowsthem to become part of the evaluation project rather than be subjects outside of the project.Cooperation among researchers, program personnel, and parents provide the framework formutually beneficial activities. When participants actually become interested in the studyand its results, the conduct of the study is facilitated.
Survey-Only Approach
The survey-only approach takes advantage of previous child and family outcome researchand survey development. Many surveys have been developed to gather qualitativeinformation regarding child and family outcomes. Given the cost and methodologicaldifficulties of direct assessment studies, surveys often have been the method of choice forstates seeking to evaluate their programs (see Chapter 4, Development of Child and FamilyOutcomes at the State Level). While the survey-only approach does provide qualitativecontextual data through the use of County Interagency Coordinating Council (CICC) focusgroups, this qualitative data is not used to develop the assessment tool.

134
ISSUES
Strengths—Both Approaches
The greatest strength of this study is that it provides information on child and familyoutcomes and service provisions from a multidimensional viewpoint. In both approaches,those directly involved with services are the source of the data. Comparing the perceptionsof service providers and parents will provide insightful qualitative and quantitative data togain a multidimensional view on the intent and outcome of services. Such information willnot only be useful for evaluation, but would be valuable for programs in planning futureprogram goals and objectives.
Given that 2,000 people will participate in the survey, the methodology allows a broad arrayof parents and services providers from different geographical locations across WashingtonState to participate in the project. The large number and variety of participants strengthensthe generalizability of results which is important to attaining information that can be appliedstatewide.
Both approaches allow descriptive data to be collected to provide a context within which tointerpret more quantitative data. Without such descriptive data, survey results will have nointerpretive framework, which could weaken the strength of conclusions.
Three-Tiered Approach
The greatest asset of this approach is that it directly involves parents and service providersin development of the assessment tool. Such an approach reflects recent trends in the fieldof evaluation. As was discussed in Chapter 3 (Development Of Family And Child OutcomeMeasures At The Federal Level), the Early Childhood Research Institute national researchteam recognized that “the future use of the general growth outcomes would hinge greatly onacceptance by families, teachers, administrators, and other individuals involved in earlychildhood education” (Early Childhood Research Institute on Measuring Growth andDevelopment, Draft Report, 1998) and directly incorporated key informants into thedevelopment of their outcomes. By involving service providers and parents at the groundlevel of the research project, motivation to participate fully in the project will increase(Presentation, Dr. Susan Janko, 2/6/98).
Another strength of this approach is that it allows flexibility in the selection of outcomes.By first conducting qualitative interviews and focus groups with service providers andparents, outcomes previously not considered might emerge. The open process allows afuller, less pre-defined discussion of which outcomes may be beneficial to include.
Survey-Only Approach
The main strength of this study is that it draws on previously developed material whichreduces time and cost commitments. From a feasibility standpoint, the study will providevaluable information in a quick time frame for a relatively low cost.
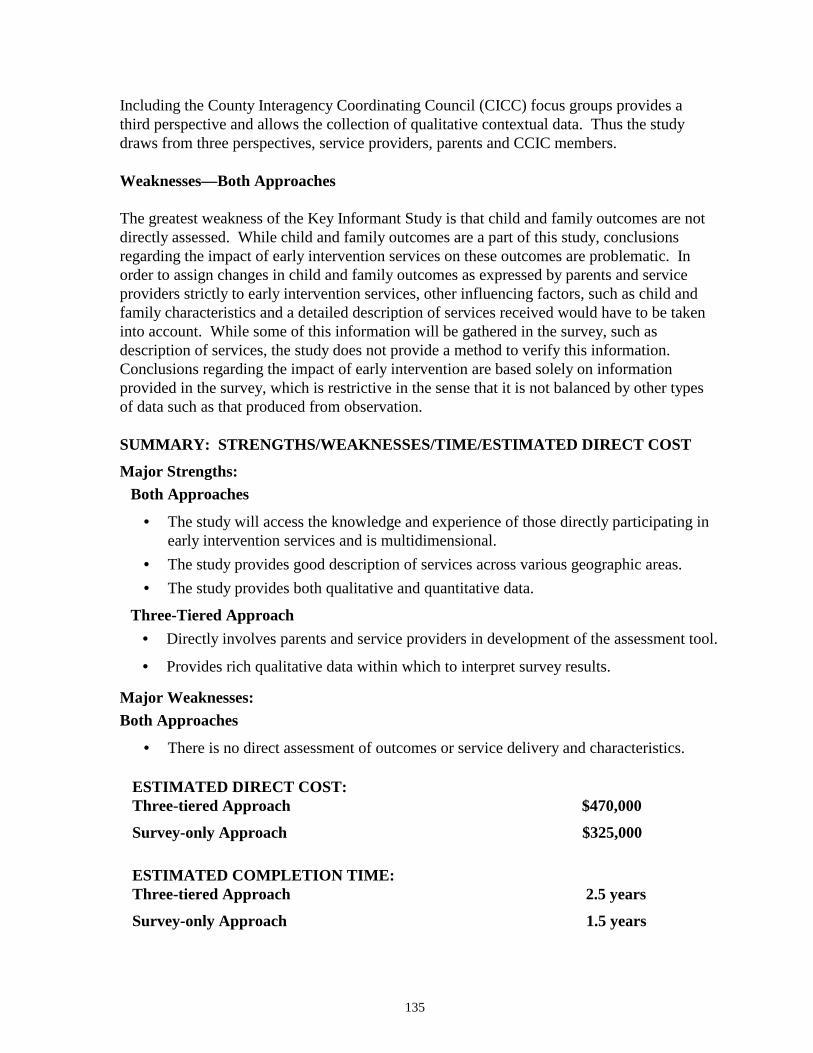
135
Including the County Interagency Coordinating Council (CICC) focus groups provides athird perspective and allows the collection of qualitative contextual data. Thus the studydraws from three perspectives, service providers, parents and CCIC members.
Weaknesses—Both Approaches
The greatest weakness of the Key Informant Study is that child and family outcomes are notdirectly assessed. While child and family outcomes are a part of this study, conclusionsregarding the impact of early intervention services on these outcomes are problematic. Inorder to assign changes in child and family outcomes as expressed by parents and serviceproviders strictly to early intervention services, other influencing factors, such as child andfamily characteristics and a detailed description of services received would have to be takeninto account. While some of this information will be gathered in the survey, such asdescription of services, the study does not provide a method to verify this information.Conclusions regarding the impact of early intervention are based solely on informationprovided in the survey, which is restrictive in the sense that it is not balanced by other typesof data such as that produced from observation.
SUMMARY: STRENGTHS/WEAKNESSES/TIME/ESTIMATED DIRECT COST
Major Strengths:Both Approaches
• The study will access the knowledge and experience of those directly participating inearly intervention services and is multidimensional.
• The study provides good description of services across various geographic areas.• The study provides both qualitative and quantitative data.
Three-Tiered Approach• Directly involves parents and service providers in development of the assessment tool.
• Provides rich qualitative data within which to interpret survey results.
Major Weaknesses:Both Approaches
• There is no direct assessment of outcomes or service delivery and characteristics.
ESTIMATED DIRECT COST:Three-tiered Approach $470,000
Survey-only Approach $325,000
ESTIMATED COMPLETION TIME:Three-tiered Approach 2.5 years
Survey-only Approach 1.5 years

136
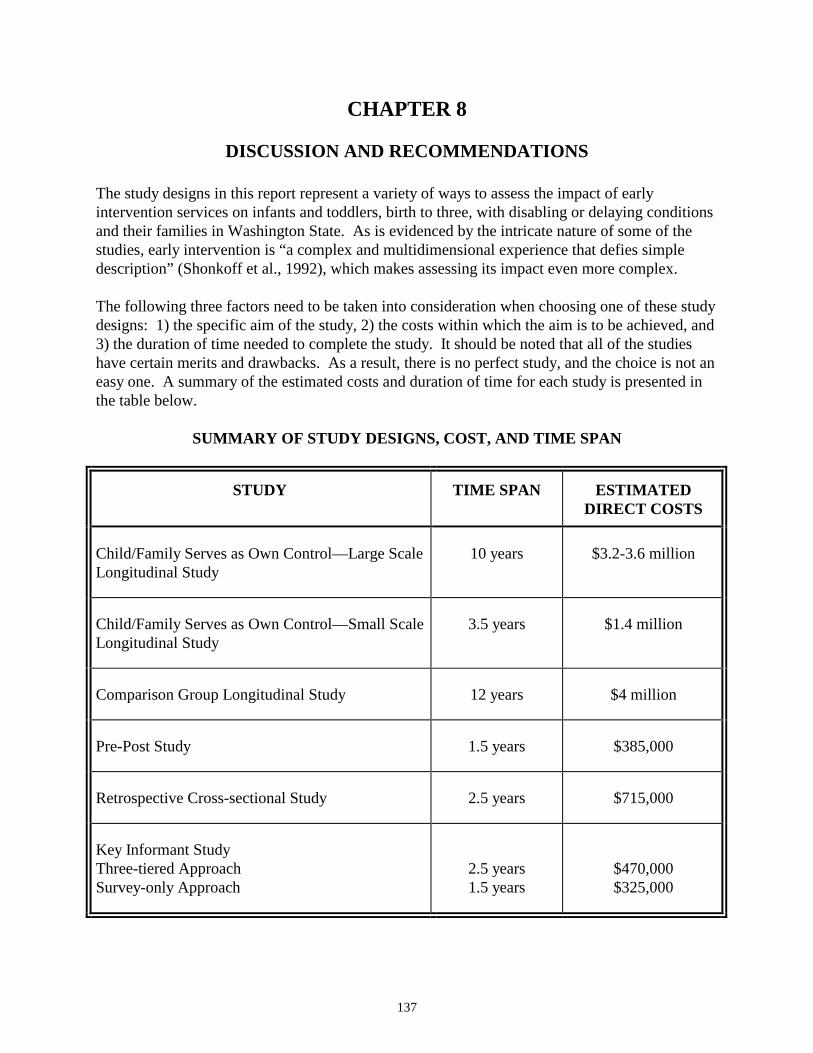
137
CHAPTER 8
DISCUSSION AND RECOMMENDATIONS
The study designs in this report represent a variety of ways to assess the impact of earlyintervention services on infants and toddlers, birth to three, with disabling or delaying conditionsand their families in Washington State. As is evidenced by the intricate nature of some of thestudies, early intervention is “a complex and multidimensional experience that defies simpledescription” (Shonkoff et al., 1992), which makes assessing its impact even more complex.
The following three factors need to be taken into consideration when choosing one of these studydesigns: 1) the specific aim of the study, 2) the costs within which the aim is to be achieved, and3) the duration of time needed to complete the study. It should be noted that all of the studieshave certain merits and drawbacks. As a result, there is no perfect study, and the choice is not aneasy one. A summary of the estimated costs and duration of time for each study is presented inthe table below.
SUMMARY OF STUDY DESIGNS, COST, AND TIME SPAN
STUDY TIME SPAN ESTIMATEDDIRECT COSTS
Child/Family Serves as Own Control—Large ScaleLongitudinal Study
10 years $3.2-3.6 million
Child/Family Serves as Own Control—Small ScaleLongitudinal Study
3.5 years $1.4 million
Comparison Group Longitudinal Study 12 years $4 million
Pre-Post Study 1.5 years $385,000
Retrospective Cross-sectional Study 2.5 years $715,000
Key Informant StudyThree-tiered ApproachSurvey-only Approach
2.5 years1.5 years
$470,000$325,000
138
RECOMMENDATIONS
Recommendation One
Research and Data Analysis and the majority of the Advisory Group chose the Child/FamilyServes as Own Control—Small Scale Longitudinal Study as their first choice to address thequestion: what is the impact of early intervention services on children, birth to three, withdisabling or delaying conditions and their families in Washington State? The following pointswere made:
• This study links child outcomes to program characteristics thereby allowing one toattribute change to early intervention.
• Given the difficulty in locating a proper comparison group, children serving as their
own control is the best option.
• In order for the impact of early intervention to be assessed accurately, a large enoughstudy sample must be recruited to control for background variables which affect childand family development.
• The smaller scale study will reduce estimated costs and time, yet still attain a high
subject number and control for independent variables.
Several members of the Advisory Group felt a small, but intensive, ethnographic study(six months-one year) of a small sample of children and families should be conducted prior tothis study in order to provide rich, holistic portraits of what early intervention means for thesechildren and families. A survey aimed at evaluating the generalization of results emerging fromthe ethnographic study could be conducted in order to discern which child and family outcomesto use for the recommended study.
Recommendation Two
If the first choice of Child/Family Serves as Own Control—Small Scale Longitudinal Studyproves to be too expensive and the time for completion too long, Research and Data Analysis andthe Advisory Group recommend two different options.
Research and Data Analysis recommends the Retrospective Cross-sectional Study as a lessexpensive and shorter timeline option. They pointed out the following strengths:
• This study design will provide a comparison group of children and families who didnot receive early intervention services.
• This study allows analysis of other issues in early intervention including transitioningof children from birth to three early intervention programs into programs for three tosix year olds and identification of under-served or under-identified children.
139
The three-tiered approach of the Key Informant Study was chosen by the majority of theAdvisory Group as a second choice if there was not enough funding available to do theChild/Family Serves as Own Control—Small Scale Longitudinal Study or a full ethnographicstudy. The following points were made:
• This study’s participatory nature in accessing knowledge and experience of familiesand service providers will result in identifying meaningful child and family outcomesfor Washington State.
• The study design includes a combination of qualitative and quantitative data.
DISCUSSION
Child/Family Serves as Own Control—Small Scale Longitudinal Study
Both Research and Data Analysis and the majority of the Advisory Group recommended theChild/Family Serves as Own Control—Small Scale Longitudinal Study as the first choice of thesix study designs presented in this report. This study offers a triangulation of measurementwhere multiple methods, both quantitative and qualitative, are employed. Scores of standardizedand non-standardized tests are complemented by more open-ended methods such as observation,interviews, and case studies. Quantitative and qualitative results will provide a comprehensivepicture of the impact of early intervention. Observation of the early interventionenvironment/program will allow a measure of program characteristics, thereby allowing a linkbetween child outcomes and early intervention services.
Two general strategies might be pursued to obtain funding for such a study: applying for a federalgrant or obtaining state funding. If federal grant funding is pursued, it might require one to twoyears (or more) to obtain funding, and additional investment in developing and submitting aformal proposal would be required. If state funds were made available, a request for proposals(RFP) could be developed. The RFP process would also require time and money, and actualbudget proposals from bidders might exceed the budget estimates in this report, perhaps by aconsiderable amount.
It is unlikely that such a study could be initiated before the year 2000.
Retrospective Cross-Sectional Study
The Retrospective Cross-sectional Study provides a comparison group of children that did notreceive birth to three early intervention services. While isolating an appropriate comparisongroup is problematic, the study allows examination of a number of pertinent factors such as 1)identification of children and families who might be under-served, 2) description of servicesfrom families who were enrolled in birth to three services, 3) perception of the transitionexperience from families who exited birth to three and entered three to six services, and 4)profiles of those families and children who received birth to three services and those that did not.This study is relatively inexpensive and can be completed in a short amount of time.
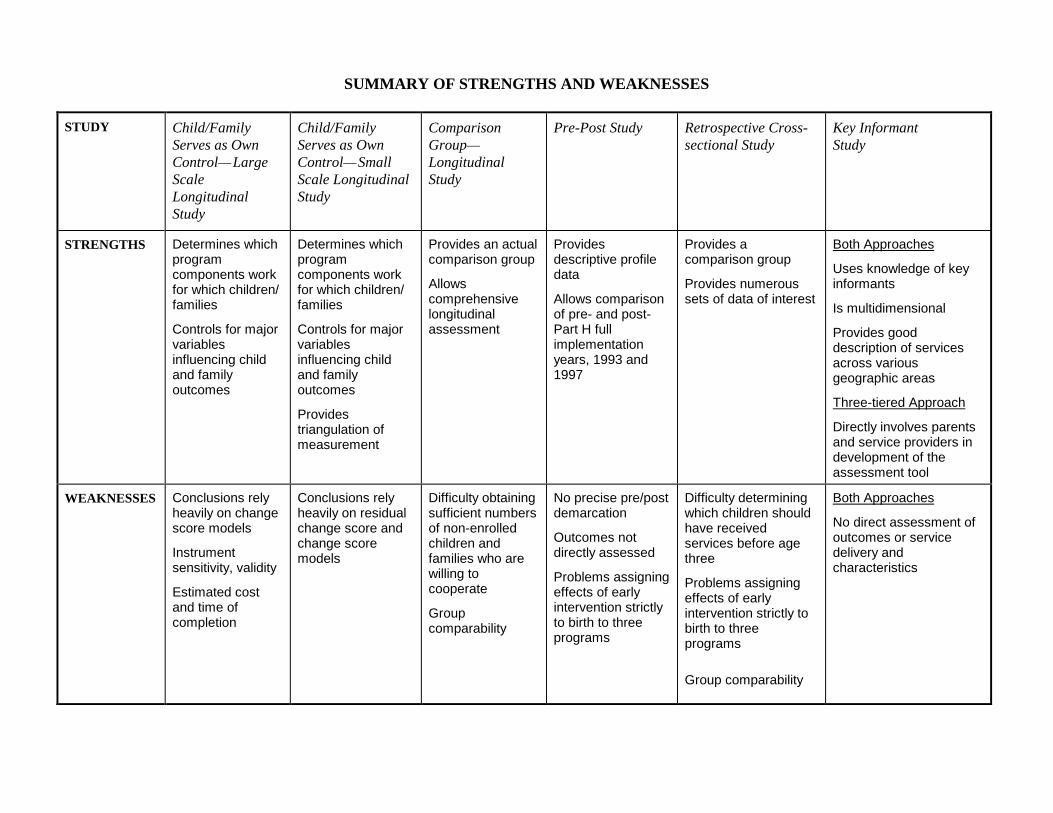
SUMMARY OF STRENGTHS AND WEAKNESSES
STUDY Child/FamilyServes as OwnControl—LargeScaleLongitudinalStudy
Child/FamilyServes as OwnControl—SmallScale LongitudinalStudy
ComparisonGroup—LongitudinalStudy
Pre-Post Study Retrospective Cross-sectional Study
Key InformantStudy
STRENGTHS Determines whichprogramcomponents workfor which children/families
Controls for majorvariablesinfluencing childand familyoutcomes
Determines whichprogramcomponents workfor which children/families
Controls for majorvariablesinfluencing childand familyoutcomes
Providestriangulation ofmeasurement
Provides an actualcomparison group
Allowscomprehensivelongitudinalassessment
Providesdescriptive profiledata
Allows comparisonof pre- and post-Part H fullimplementationyears, 1993 and1997
Provides acomparison group
Provides numeroussets of data of interest
Both Approaches
Uses knowledge of keyinformants
Is multidimensional
Provides gooddescription of servicesacross variousgeographic areas
Three-tiered Approach
Directly involves parentsand service providers indevelopment of theassessment tool
WEAKNESSES Conclusions relyheavily on changescore models
Instrumentsensitivity, validity
Estimated costand time ofcompletion
Conclusions relyheavily on residualchange score andchange scoremodels
Difficulty obtainingsufficient numbersof non-enrolledchildren andfamilies who arewilling tocooperate
Groupcomparability
No precise pre/postdemarcation
Outcomes notdirectly assessed
Problems assigningeffects of earlyintervention strictlyto birth to threeprograms
Difficulty determiningwhich children shouldhave receivedservices before agethree
Problems assigningeffects of earlyintervention strictly tobirth to threeprograms
Group comparability
Both Approaches
No direct assessment ofoutcomes or servicedelivery andcharacteristics
141
Members of the Advisory Group felt that while the Retrospective Cross-sectional Studyhas a comparison group, there would be a problem with group comparability includingpotentially different child and family characteristics of those who received earlyintervention and those who did not. With the knowledge of the interaction between childcharacteristics, family characteristics, program components and child outcomes,controlling for the differences in groups may require a much larger subject number. Itwould be important to determine the reason families are not coming into the earlyintervention system which may include religious reasons, health reasons, education,referral patterns, availability and access of services in different geographic areas, or typeof private insurance. There was also a concern about not being able to determine specificprogram characteristics for those who received early intervention services due to theretrospective nature of this design. Records of an individual’s services may not beavailable nor would observation of the child in the early intervention environment bepossible.
Longitudinal Comparison Group Study
While the Longitudinal Comparison Group Study would theoretically provide the mostuseful comparison group, it is not known whether a large enough subject sample could berecruited or would be willing to participate in a 12 year study.
Pre-Post Study
The Pre-Post Study provides a relatively inexpensive way to compare impressions ofservices before (1993) and after (1997) full implementation of Part H in October 1994. Italso provides profile information on these two groups which would be useful. However,implementation of the Part H program in Washington State occurred in stages. Forexample, Family Resources Coordinators were phased in, beginning with the addition ofInterim Family Resources Coordinators in 1991. Similarly, regional differences in thedegree of implementation in specific years may exist. Since the components of the Part Hprogram were phased in over varying time periods, it appears that a precise demarcationbetween pre- and post-Part H full implementation does not exist. This study design doesnot yield direct child assessment or service provision information.
Key Informant Study
Both the three-tiered and survey-only approach of the Key Informant Study offer simple,relatively inexpensive study design options and can be completed in a short time span.Both approaches include the combination of qualitative and quantitative data, access theknowledge and experience of service providers and families, and provide a description ofservices across geographic areas in the state. Although these methods do not directlymeasure child outcomes with tests or observation, many states are choosing similarapproaches, due to the costs and difficulties of measuring outcomes.
142
Three-Tiered Approach
The major strength of the three-tiered approach is its state-of-the-art participatoryapproach to evaluation the direct involvement of families and service providers in thedevelopment of the outcomes and assessment tool (Green and McAllister, 1998). TheAdvisory Group pointed out that although this study design would not yield direct childassessment data, it would result in the identification of meaningful outcomes through theinterviews and focus groups. These outcomes could then be incorporated into relevantsurvey questions to determine their generalizability in Washington State.
Survey-only Approach
The survey-only option of the Key Informant Study would be the least expensive of thetwo approaches, as it would incorporate previously developed surveys. However, it lacksthe extent of qualitative data available in the three-tiered approach. This approach, likethe three-tiered option, has no direct assessment of child outcomes or service provision.
Future Directions
A number of evaluations and assessment activities are currently ongoing which willenhance the pool of knowledge regarding evaluation. Local, state, and national activitiesregarding the evaluation of early intervention services are likely to produce materials thatwill be beneficial to Washington State’s assessment efforts. Some of these projects thatshould be carefully tracked as their results become available include those listed in thetable on the following page.
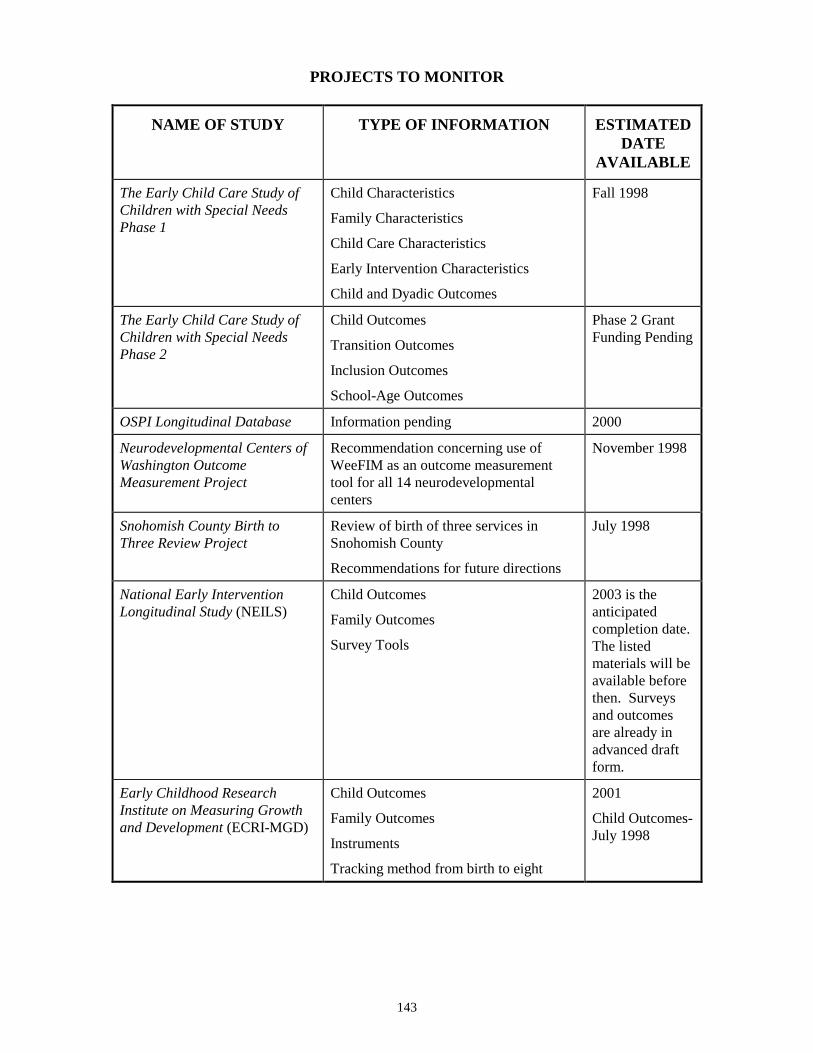
143
PROJECTS TO MONITOR
NAME OF STUDY TYPE OF INFORMATION ESTIMATEDDATE
AVAILABLE
The Early Child Care Study ofChildren with Special NeedsPhase 1
Child Characteristics
Family Characteristics
Child Care Characteristics
Early Intervention Characteristics
Child and Dyadic Outcomes
Fall 1998
The Early Child Care Study ofChildren with Special NeedsPhase 2
Child Outcomes
Transition Outcomes
Inclusion Outcomes
School-Age Outcomes
Phase 2 GrantFunding Pending
OSPI Longitudinal Database Information pending 2000
Neurodevelopmental Centers ofWashington OutcomeMeasurement Project
Recommendation concerning use ofWeeFIM as an outcome measurementtool for all 14 neurodevelopmentalcenters
November 1998
Snohomish County Birth toThree Review Project
Review of birth of three services inSnohomish County
Recommendations for future directions
July 1998
National Early InterventionLongitudinal Study (NEILS)
Child Outcomes
Family Outcomes
Survey Tools
2003 is theanticipatedcompletion date.The listedmaterials will beavailable beforethen. Surveysand outcomesare already inadvanced draftform.
Early Childhood ResearchInstitute on Measuring Growthand Development (ECRI-MGD)
Child Outcomes
Family Outcomes
Instruments
Tracking method from birth to eight
2001
Child Outcomes-July 1998
144
Review of these studies as they are completed would contribute to Washington State’sdevelopment of assessment plans in that selected outcomes and instruments would havealready been field tested. Since appropriate outcome measures and instruments may bewell defined in the short term by some of these studies, it may be efficient forWashington to take advantage of the results of these projects that were started some timeago. Local efforts could reveal information regarding which assessment methods workwell in Washington. Such information would save time and resources when planning forWashington State’s evaluation study.
An opportunity to analyze existing data collected for a different purpose was alsodiscussed. The Early Child Care Study of Children With Special Needs Part 1 (Boothand Kelly, principal investigators; see Chapter 5) was designed to evaluate the effects ofchild care; receipt of early intervention services was included in the data collected for thisstudy. The data could be analyzed differently than originally planned to explore theeffects of early intervention specifically. This approach could provide an excellent pilotstudy before proceeding with a larger study. As the focus of this study was child care,there were no observations in the early intervention environment and therefore nomeasure of program characteristics to link to child outcomes. Although the sample ofchildren in the Early Child Care Study of Children With Special Needs was limited to thePuget Sound area and might not be representative of children across Washington State,analysis of these data could provide better estimates of the magnitude of the effects ofearly intervention and evaluate the usefulness of, and variability in, the outcome measurescollected. This strategy could not be pursued without the cooperation of the principalinvestigators and perhaps the permission of the original funding agency.
Summary
With regard to which outcome study most effectively addresses the question—what is theimpact of early intervention services on children, birth to three, with disabling ordelaying conditions and their families in Washington State—Research and Data Analysis(RDA) and the Advisory Group recommend the Child/Family Serves as Own Control—Small Scale Study. Given that this study is quite costly, and will take three to four yearsto complete, RDA and the Advisory Group each made secondary recommendations whichare less expensive and require less completion time. RDA recommends the RetrospectiveCross-sectional Study, and the Advisory Group recommends the Key Informant Study—Three-tiered Approach.
These recommendations are outcome study recommendations. During the process usedto complete this report, however, the need for a more comprehensive approach toevaluation of early intervention in Washington became evident. Based on all theinformation gathered during this process, and given the stated difficulties of conductinggood outcome studies, Research and Data Analysis felt it necessary to make a broaderrecommendation. This alternative approach to evaluating early intervention is explainedin the next chapter (Chapter 9).
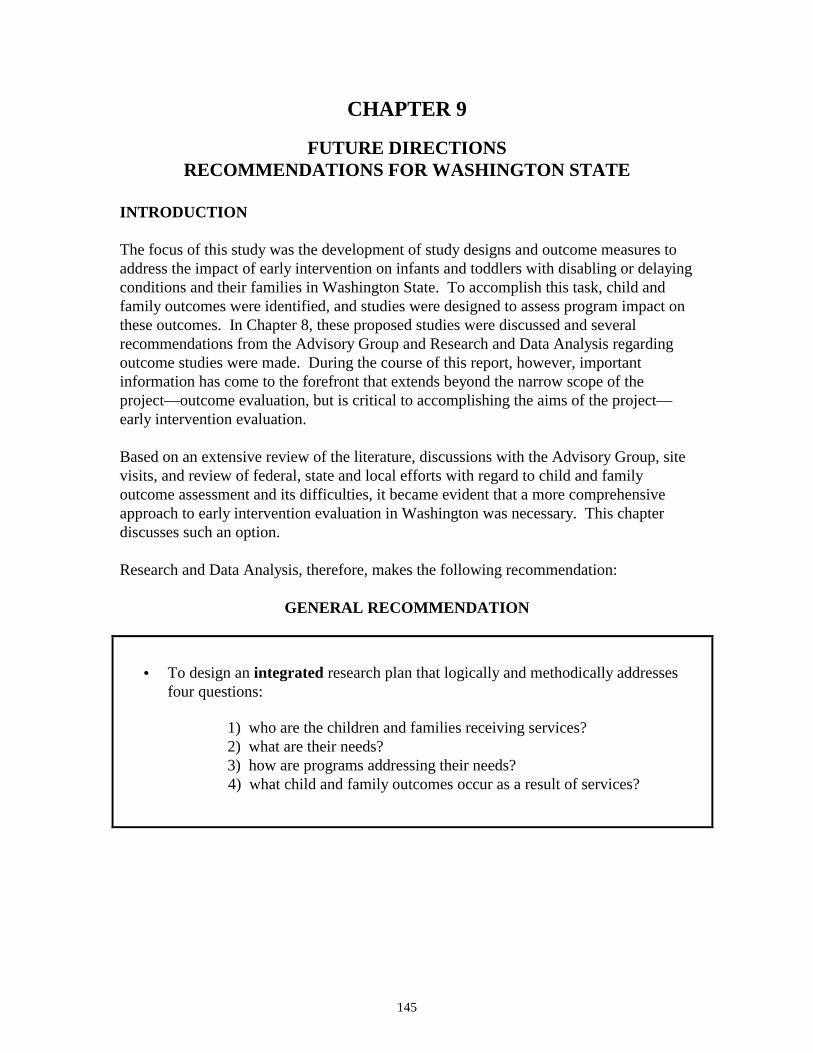
145
CHAPTER 9
FUTURE DIRECTIONSRECOMMENDATIONS FOR WASHINGTON STATE
INTRODUCTION
The focus of this study was the development of study designs and outcome measures toaddress the impact of early intervention on infants and toddlers with disabling or delayingconditions and their families in Washington State. To accomplish this task, child andfamily outcomes were identified, and studies were designed to assess program impact onthese outcomes. In Chapter 8, these proposed studies were discussed and severalrecommendations from the Advisory Group and Research and Data Analysis regardingoutcome studies were made. During the course of this report, however, importantinformation has come to the forefront that extends beyond the narrow scope of theproject—outcome evaluation, but is critical to accomplishing the aims of the project—early intervention evaluation.
Based on an extensive review of the literature, discussions with the Advisory Group, sitevisits, and review of federal, state and local efforts with regard to child and familyoutcome assessment and its difficulties, it became evident that a more comprehensiveapproach to early intervention evaluation in Washington was necessary. This chapterdiscusses such an option.
Research and Data Analysis, therefore, makes the following recommendation:
GENERAL RECOMMENDATION
• To design an integrated research plan that logically and methodically addressesfour questions:
1) who are the children and families receiving services?2) what are their needs?3) how are programs addressing their needs?4) what child and family outcomes occur as a result of services?
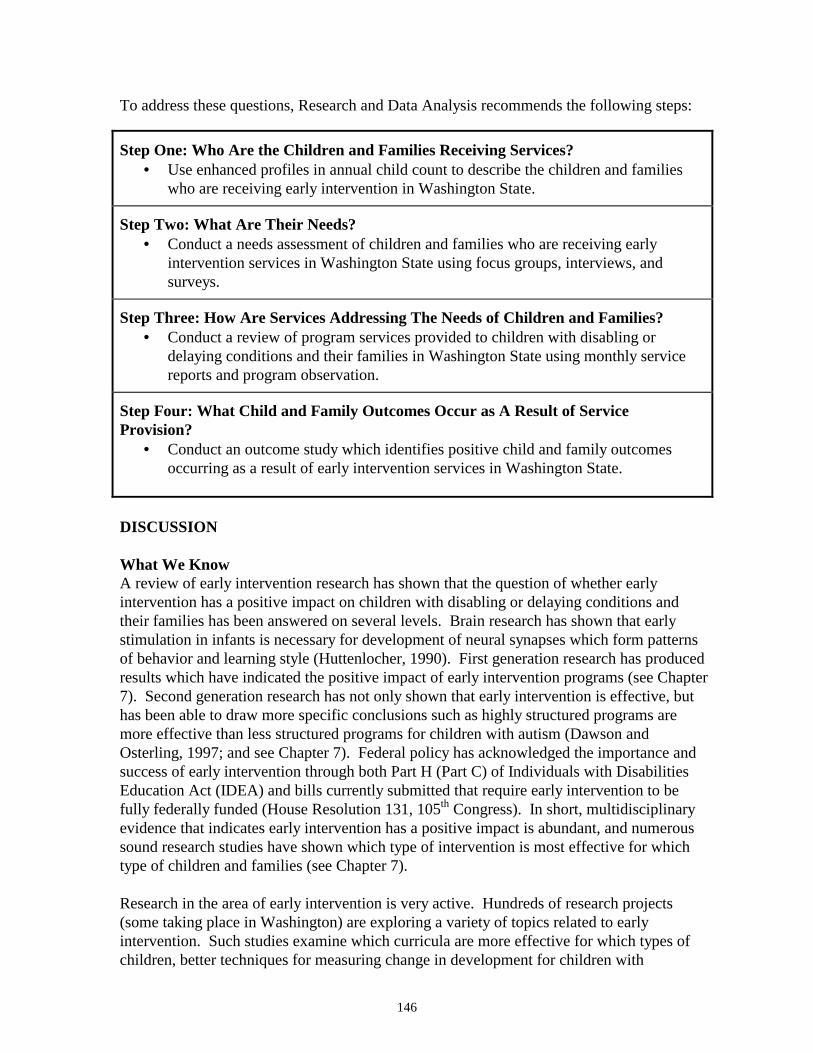
146
To address these questions, Research and Data Analysis recommends the following steps:
Step One: Who Are the Children and Families Receiving Services?• Use enhanced profiles in annual child count to describe the children and families
who are receiving early intervention in Washington State.
Step Two: What Are Their Needs?• Conduct a needs assessment of children and families who are receiving early
intervention services in Washington State using focus groups, interviews, andsurveys.
Step Three: How Are Services Addressing The Needs of Children and Families?• Conduct a review of program services provided to children with disabling or
delaying conditions and their families in Washington State using monthly servicereports and program observation.
Step Four: What Child and Family Outcomes Occur as A Result of ServiceProvision?
• Conduct an outcome study which identifies positive child and family outcomesoccurring as a result of early intervention services in Washington State.
DISCUSSION
What We KnowA review of early intervention research has shown that the question of whether earlyintervention has a positive impact on children with disabling or delaying conditions andtheir families has been answered on several levels. Brain research has shown that earlystimulation in infants is necessary for development of neural synapses which form patternsof behavior and learning style (Huttenlocher, 1990). First generation research has producedresults which have indicated the positive impact of early intervention programs (see Chapter7). Second generation research has not only shown that early intervention is effective, buthas been able to draw more specific conclusions such as highly structured programs aremore effective than less structured programs for children with autism (Dawson andOsterling, 1997; and see Chapter 7). Federal policy has acknowledged the importance andsuccess of early intervention through both Part H (Part C) of Individuals with DisabilitiesEducation Act (IDEA) and bills currently submitted that require early intervention to befully federally funded (House Resolution 131, 105th Congress). In short, multidisciplinaryevidence that indicates early intervention has a positive impact is abundant, and numeroussound research studies have shown which type of intervention is most effective for whichtype of children and families (see Chapter 7).
Research in the area of early intervention is very active. Hundreds of research projects(some taking place in Washington) are exploring a variety of topics related to earlyintervention. Such studies examine which curricula are more effective for which types ofchildren, better techniques for measuring change in development for children with

147
disabling or delaying conditions, topics in the process of child development itself,identification of critical factors in child development (characteristics) and theirrelationships, as well as identification of the etiology of certain conditions(http://www.cec.sped.org/osep/8earlych.htm, 5/22/98; http://www.nectas.unc.edu/eepcd/demos.htm#abstract, 5/22/98).
Since it is generally accepted by many parents, legislators, researchers, child developmentexperts, and stakeholders that early intervention has a positive impact on children withdisabling or delaying conditions and their families, it would appear redundant to researchthis question in Washington when it has already been answered so thoroughly. And,given the amount and variety of current research which explores different factors of howearly intervention works with specific families and children, it would seem unnecessaryfor Washington State to conduct this sort of research investigation as a method ofevaluation.
What We Do Not Know
Questions more pertinent to Washington State focus on the specific details of who isbeing served, what are their specific needs, and how these needs are being metspecifically by early intervention services in Washington State. While these questionsmay be addressed by local assessment efforts (see Chapter 5), more work is needed toachieve knowledge systematically, on a statewide basis.
Such questions go well beyond the scope of this report. It became obvious early in thisproject, however, that good research could not separate the needs of families and childrenand the status of service delivery from studies assessing outcomes.
Washington State has already taken steps to answer the first question of who is beingserved. Child counts funded by the Infant Toddler Early Intervention Program andconducted by Research and Data Analysis provide a general description of the childrenand families receiving services. Comprehensive information regarding the specific earlyintervention needs of children and families and the method of meeting these needs(program delivery) is lacking on a statewide level.
The Importance of Knowing Needs for Research Results
While the outcomes chosen for this study were drawn from extensive methodologicalreview of a variety of sources (see Chapter 2), they are general outcomes, and are notnecessarily specific to Washington families. Since child and family needs are so varied,early intervention strategies differ for each family and child. Therefore, a key researchcomponent is to discover and document what the child and family’s needs are. Using ahypothetical example, in one rural county, a child which requires specialized therapy musttravel two hours to receive it. While the outcome, readiness to learn, may be extremelyimportant, the family’s more basic need is access to services. This need must be metbefore early intervention can even take place. Therefore, an outcome (which is programrelated) that is more specific to this Washington family would be access to services.
148
It may be demonstrated that certain needs are common to all families. For instance,evidence suggests the importance of creating community social support networks (whichcan be facilitated by early intervention program personnel) to forming secure homeenvironments which positively affect child development (Dunst et al., 1997). A needsassessment should be conducted systematically on a statewide level, for conclusions to bedrawn regarding these general needs in Washington State.
The Importance of Knowing Program Factors for Research Results
The importance of gaining a comprehensive, statewide view of program service deliveryis twofold. The first importance relates to ascertaining whether basic needs are beingmet. As in the example above, before early intervention can take place, children withdisabling or delaying conditions must have access to services. They also must haveaccess to the specific services they require. It is critical to know whether these basicneeds are being met by programs before assessment of outcomes takes place. Forinstance, one hypothetical family may have a child who could achieve maximum resultswith highly structured, intense services. A highly structured, intense program isavailable, but the family does not know about it. The child is therefore enrolled in a lessstructured program. If this child were assessed for developmental outcomes, results areunlikely to be as positive as if the child were enrolled in a more intense, structuredprogram. While the conclusion drawn from an outcome study may be “the child showedslight improvement with this particular program” the important result to be ascertainedhere is that the child did not have access to the best possible services for his/her specificdisability because the parent (and perhaps service provider) was unaware of services ofthis type.
The second importance of knowing what programs do before assessing outcomes relatesto the necessity of measuring an outcome for services which the programs actuallyprovide. For instance, if a researcher wants to examine the outcome, familyempowerment, and the particular program curriculum the subject receives has not yetimplemented a curriculum that incorporates family empowerment, then it is unlikely thatthe family will demonstrate characteristics of empowerment. With this result, one may betempted to conclude that early intervention does not affect family empowerment, when inreality the situation indicates that family empowerment has not yet been incorporated inthe curriculum—a far different conclusion. In sum, evaluation and even selection ofoutcomes should not be divorced from the actual delivery of program services.
Conclusions
Therefore, a well-designed outcome study would define outcome indicators within thecontext of specific family and child needs, and then incorporate both process measuresand outcome measures in a manner that facilitates interpretation of study results. Notonly would such a study reveal the strengths and weaknesses in a state’s earlyintervention services, but also show how certain program elements are related tochild/family outcomes. This conclusion is well-supported by the approach many stateshave chosen to evaluate their programs (see Chapter 4). From a review of various stateconsortiums, it is revealed that few states proceed with outcome measure studies before
149
addressing three very basic questions: 1) who are the families and children receivingservices, 2) what are their needs, and 3) how are services meeting their needs. At present,many states have not gone beyond assessing these three questions (see Chapter 4).
Research options presented in this study have tried to address some of the above concernswithin the designs themselves (see Chapter 7). Since important factors such as thespecific needs of children and families in Washington and the status of program deliveryare not established in detail on a statewide basis, development of outcome study designswas hampered. Without knowing the needs of children with disabling or delayingconditions and their families living in Washington State, the selection of outcomesbecame a generalized process. As discussed above, not knowing what services wereprovided to which children causes problems with attributing changes in child and familyoutcomes to early intervention. Since full scale program review was beyond the scope ofthis project, the details of which services children and families received wereincorporated into the study designs only to the degree necessary to provide a minimalbasis for attributing changes in outcomes to early intervention services. In some studydesigns, such information was not attainable in a consistent manner (see Chapters 7 and8).
Needs assessment and program delivery review are studies that should be conductedseparately for several reasons: 1) the results are important independent of outcomeevaluation; 2) combining three goals (needs assessment, program delivery, and outcomeassessment) in one study is methodologically complicated; 3) results are difficult tointerpret for the reasons discussed above.
From a research prospective, a methodologically sound approach would be to collectinformation systematically, on a statewide level, which addresses four questions: 1) whoare the children and families receiving services, 2) what are their needs, 3) how areprograms addressing their needs, and 4) what child and family outcomes occur as a resultof service provision. The research approach should provide a long-term, well-planned,integrated methodology. Research and Data Analysis offers a preliminary plan forreview, discussion, and further refinement.
WASHINGTON STATE—RECOMMENDATIONS
General Recommendation
• To design an integrated research plan that logically and methodically addresses fourquestions:
1) who are the children and families receiving services?2) what are their needs?3) how are programs addressing their needs?4) what child and family outcomes occur as a result of service provision?
What is an Integrated Research Plan?
150
While each of these questions could be addressed by independent research projects, anintegrated approach would allow related aspects of these questions to be explored. Interms of outcome assessments, a valid study could not be conducted without theconsideration of the first three questions. In designing an integrated research approach,information from question one should be incorporated into the research methodology ofquestion two. Similarly the results of the needs assessment should be incorporated intothe research methodology of question three (program review). Finally, results from aneeds assessment study and program review are essential to a well-defined outcomestudy. If outcome analysis is completed without these first steps, results would be at bestinconclusive, and in the worst case, misleading.
The following is an outline of an integrated research plan that could be used inWashington State. The methodologies suggested for each step have been derived fromthe analysis of the strengths and weaknesses of each study design presented in Chapter 7.It was clear from a review of these study designs that each methodology contained certainstrengths that are best suited to gathering information of a certain type. For instance, ifpart of the research question involves discovering the needs of families, it is clear that thefamily is a good source for this information. Whereas if part of the research questioninvolves which specific therapy a child is receiving in a given time frame, the therapist isperhaps best equipped to provide this information. The following proposed methods arefelt to be the most effective way of analyzing the designated research questions.
An Integrated Research Plan for Washington State
Step One: Who Are the Children and Families Receiving Services?
• Describe the children and families who are receiving early intervention in WashingtonState.
As mentioned before, the child counts conducted by Research and Data Analysis onbehalf of the Infant Toddler Early Intervention Program provide much data in this respect.The data of these counts could be expanded to include an array of pertinent descriptiveinformation on children with disabling or delaying conditions and their families who arereceiving early intervention services in Washington State. The enhanced profiles ofchildren and families enrolled in early intervention services would be valuable, and wouldcontribute to the purpose of the integrated research plan. For example, it was reported ata meeting of the Advisory Group that more than half the children receiving earlyintervention services from one provider were in foster care. This anecdotal reporthighlighted the need to understand more about the characteristics of children receivingearly intervention services. Foster care, enrollment in Supplemental Security Income(SSI), and mortality are examples of readily available population based measures that arepertinent to children enrolled in early intervention. The Data Inventory (see Chapter 6)described a number of readily available measures which could be linked to current andfuture child counts for a modest cost.
The enhanced profiles would contribute to the integrated research plan in two ways.First, the child count would provide a comprehensive subject pool for the selection of
151
participants in the needs analysis study. Second, the information from the profiles wouldprovide descriptive information and some characteristics of the children and familiesparticipating in the integrated study.
Step Two: What Are Their Needs?
• Conduct a needs assessment of children and families who are receiving earlyintervention services in Washington State.
From the above child count, one thousand families and their service providers could beselected to participate in a statewide needs assessment study. The sample would bestratified by location (metro, small urban, and rural) to ensure statewide representation.
The best source of information for the needs of families are the families themselves. Itwould also be useful to ascertain whether needs that families express are consistent withwhat service providers perceive as family needs. Such information would be useful inconducting step three of the project that addresses how needs are being met. If serviceproviders have different notions than families with regard to which needs are to be met byearly intervention programs, services may be geared to fulfilling family needs as definedby service providers rather than fulfilling family needs as defined by the family.
The most efficient methodology for such a study uses focus groups, interviews, and awritten survey. This methodology is described in detail in Key Informant Study—Three-tiered Approach in Chapter 7. A small number of parents (15) and service providers (15)will participate in separate focus groups and interviews to provide a descriptive contextwithin which to interpret data from the thousand surveys, and to augment the profilesobtained in step one. A needs assessment survey will be sent to 1,000 families and theirservice providers to gather data for analysis of needs on a statewide level. The samplecould be stratified by location of residence and type of disability. The results of the needsanalysis will be to provide the basis for step three of the integrated research plan.
Step Three: How Are Services Addressing the Needs of Children and Families?
• Conduct a review of program services provided to children with disabling or delayingconditions and their families in Washington State.
From the 1,000 sampled for the needs assessment study, 300 children and families, andtheir service providers will be selected for the program review. As with the above study,the sample will be stratified by location (metro, small urban, rural) to ensure statewiderepresentation. The needs of these children and families are already identified in steptwo. The research question for the study will address how these needs are being met.
One method discussed in the Child/Family Serves As Own Control studies that would beparticularly useful in this study is the use of monthly service reports and programobservation to obtain details about which services are being provided to which childrenand families. The monthly service reports would be completed by early interventionspecialists for a period of one year. Services for a one-in-ten random sample of
152
participating children will be observed every two months to corroborate the monthlyservice reports and provide descriptive contextual information.
Step Four: What Child and Family Outcomes Occur as a Result of Service Provision?
• Conduct an outcome study which identifies positive child and family outcomesoccurring as a result of early intervention services in Washington State.
Once the above steps have been completed, a relevant and thoughtful child and familyoutcome study could be conducted. This study should use the same 300 children andfamilies used in the above study. In this way, the profiles, needs, and services of theoutcome study participants will be known already. Further, descriptive data obtainedfrom the needs assessment and program review will contribute to an understanding of thecontext within which outcomes should be interpreted. The methodologies and relatedproblems would include those discussed throughout this report. Since the programcharacteristics are known for this group of children, conclusions regarding the outcomesof early intervention services can be drawn. Without knowing the service characteristics,it is difficult to attribute changes in outcomes directly to services (see previous section,The Importance of Knowing Program Factors for Research Results). The outcomessuggested in this report might be adopted along with those discovered in the needsanalysis.
After completing the above steps, however, it may be decided that the benefits of anoutcomes study might not be worth the time investment and money. Many other stateshave reached this conclusion (see Chapter 4). Such a decision does not indicate that childand family outcomes are not important—indeed they are the goal of the program. Giventhe difficulties in accurately measuring outcomes and in properly interpreting the data,however, many states have focused on studying program delivery systems in order tomore efficiently meet the varied needs of families and children in their respective areas.
Timeline, Products, Cost
The comprehensive approach outlined above is a methodologically sound and resourceefficient study design. It is estimated that should there be a commitment to address thesequestions, steps one through three will require at least two to three years to complete.After these steps are completed, an outcome study could take from one to ten years,depending on the nature of the study. A one year study would most likely be a cross-sectional study, a ten year one would most likely be longitudinal.
By integrating the steps and results of the research plan, costs per study are reduced inseveral ways. First, ground level background research would be conducted once, ratherthan numerous times. Second, organization is facilitated by an integrated study design,reducing time and money invested in planning. Third, many elements of the study can beconducted simultaneously which reduces time and costs.
The following tables present a hypothetical timeline for the completion of the integratedresearch plan for Washington State, a list of individual reports, and their estimatedcompletion dates and costs.
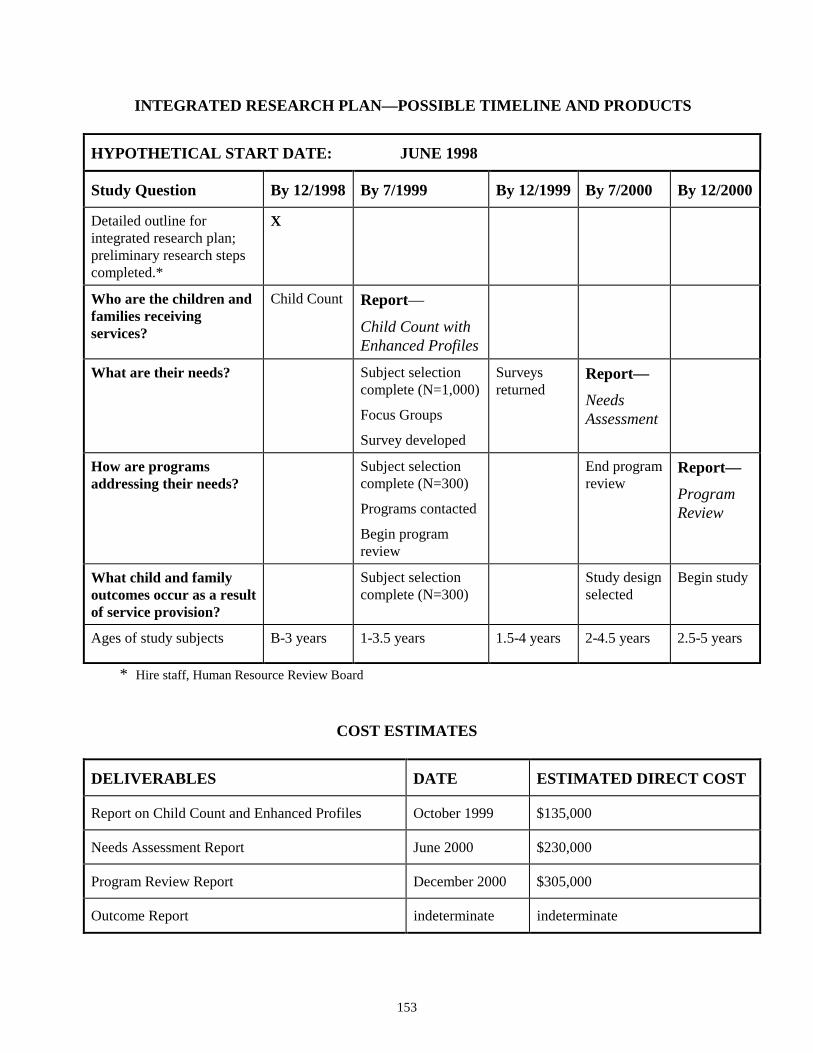
153
INTEGRATED RESEARCH PLAN—POSSIBLE TIMELINE AND PRODUCTS
HYPOTHETICAL START DATE: JUNE 1998
Study Question By 12/1998 By 7/1999 By 12/1999 By 7/2000 By 12/2000
Detailed outline forintegrated research plan;preliminary research stepscompleted.*
X
Who are the children andfamilies receivingservices?
Child Count Report—
Child Count withEnhanced Profiles
What are their needs? Subject selectioncomplete (N=1,000)
Focus Groups
Survey developed
Surveysreturned
Report—NeedsAssessment
How are programsaddressing their needs?
Subject selectioncomplete (N=300)
Programs contacted
Begin programreview
End programreview
Report—ProgramReview
What child and familyoutcomes occur as a resultof service provision?
Subject selectioncomplete (N=300)
Study designselected
Begin study
Ages of study subjects B-3 years 1-3.5 years 1.5-4 years 2-4.5 years 2.5-5 years
* Hire staff, Human Resource Review Board
COST ESTIMATES
DELIVERABLES DATE ESTIMATED DIRECT COST
Report on Child Count and Enhanced Profiles October 1999 $135,000
Needs Assessment Report June 2000 $230,000
Program Review Report December 2000 $305,000
Outcome Report indeterminate indeterminate
154
Considerations
This report has produced a series of recommendations. The primary purpose of the reportwas to design child and family outcome studies. A number of study designs werediscussed in Chapter 7, and recommendations regarding an outcome study were made inChapter 8. The need for a more comprehensive recommendation regarding an integratedresearch plan arose from the process used to complete the report’s original intent. Bymeeting with parents, service providers, academic researchers, and program personnel,and by reviewing the literature and evaluation activities of state and federal government,several important issues became clear. First, assessing early intervention services occurson multiple levels. The first level of assessment identifies and describes who is receivingservices; the second identifies their needs; the third analyzes how services are meetingtheir needs; the fourth identifies the positive outcomes resulting from early interventionservices. Second, each level is integrated so that evaluation of one level in isolationexcludes critical information necessary for well-grounded data interpretation. Forexample, Hawaii’s family needs assessment study could not answer the research question,are needs being met, when it was discovered that the program lacked informationidentifying what family needs are (see Chapter 4). Third, outcome research projectswhich do not take into account other fundamental elements (such as needs and programcharacteristics) produce results that are, at best, inconclusive.
From this information, it can be concluded that an integrated research plan is amethodologically sound and resource efficient approach to assessment. Addressing thequestion of outcomes before the groundwork for such research is complete will notproduce sound results. Consequently, policy proceeding from such results will not besound. It should be kept in mind that such policy decisions directly affect the lives of oneof the most vulnerable populations the state of Washington has committed to protect—children with disabling or delaying conditions—and that decisions made now may affectthese children and families for a lifetime.

REFERENCES

156
157
Achenbach, T. M., and Edelbrock, C. S. (1987). Child behavior checklist. Burlington:Author.
Accreditation Council on Services for People with Disabilities. (1995). OutcomeMeasures for Early Childhood Intervention Services. Towson: The AccreditationCouncil on Services for People with Disabilities.
Advisory Group Meeting, 5/15/98
Agee, L. C., Innocenti, M. S., and Boyce, G. C. (1994). I'm All Stressed Out: The Impact ofParenting on the Effectiveness of a Parent Involvement Program. Logan: EarlyIntervention Research Institute, Utah State University.
Ainsworth, M. D. S. (1973). The Development of Infant-mother Attachment. In B. M.Caldwell and H. Ricciutti (Eds.), Review of Child Development Research (pp. 1-94).Chicago: University of Chicago Press.
Andrews, H., Goldberg, D., Wellen, N., Pittman, B., and Struening, E. (1995). Prediction ofSpecial Education Placement from Birth Certificate Data. American Journal of PreventiveMedicine, 11, No. 3, 55-61.
Bagnato, Stephen J., Neisworth, John T., and Munson, Susan M. (1997). LINKingAssessment and Early Intervention. Baltimore: Paul H. Brookes Publishing CompanyPublishing Co.
Bailey, D. B., and Simeonsson, R. J. (1983). Design Issues in Family Impact Evaluation. InL. Bickman and D. L. Weatherford (Eds.), Evaluating Early Intervention Programs forSeverely Handicapped Children and Their Families (pp. 209-230). Austin: Pro-Ed.
Bailey, D., Hebbler, K., Simeonsson, R., Spiker, D., and Wagner, M. (1998). FamilyOutcomes in Early Intervention: A Framework for Program Evaluation and EfficacyResearch. Exceptional Children, 64, No. 3, 313-328.
Bailey, E. J., and Bricker, D. (1985). Evaluation of a Three-Year Early InterventionDemonstration Project. Topics in Early Childhood Special Education, 5, No. 2, 52-65.
Barnard K. E., Hammond, M., Booth, C., Bee H., Mitchell, S., and Spieker, S. (1989).Measurement and meaning of parent-child interaction. In F. Morrison, C. Lord and D.Keating (Eds.), Applied developmental psychology, 3. New York: Academic Press.
Barnard, K. E. (1978). Nursing Child Assessment Teaching Scale (NCATS). Seattle:University of Washington School of Nursing.
Barnard, K. E., and Kelly, J. F. (1990). Assessment of parent-child interaction. In J. P.Shonkoff and S. J. Meisels (Eds.), Handbook of Early Childhood Intervention (pp. 278-302). New York: Cambridge University Press.
158
Barnard, K. E. and Kelly J. F. (1990). Nursing Child Assessment Teaching Scales(NCATS) Assessment of parent-child interaction. In S. Meisels and J. Shonkoff (Eds.),Handbook of early childhood intervention. New York: Cambridge University Press.
Bayley, N. (1993). The scales of infant development (Second edition). New York:Psychological Corp.
Belsky, J. (1984). The Determinants of Parenting: A Process Model. Child Development,55, 83-96.
Belsky, J., Hrncir, E., and Vondra, J. (1983). Manual for the assessment of performance,competence, and executive capacity in infant play. Unpublished Manuscript.
Bennett, F. C., and Guralnick, M. J. (1991). Effectiveness of Developmental Intervention inthe First Five Years of Life. Pediatric Clinics of North America, 38, No. 6, 1513-1528.
Berrueta-Clement, J. R., Schweubgart. L. J., Barnett, W. S., Epstein, A. S., and Weikart, D.P. (Eds.). (1984). Changed Lives: The Effects of the Perry Preschool Program on YouthsThrough Age 19. Ypsilanti: High/Scope Press.
Billingsley, F. F., Gallucci, C., Peck C., Schwartz I. S., Staub, D. (1996). But Those KidsCan’t Even Do Math: An Alternative Conceptualization of Outcomes for InclusiveEducation. Special Education Leadership Review, 1-13.
Bowlby, F. (1969). Attachment. New York: Basis Books.
Boyce, G. (1993). The Effectiveness of Adding a Parent Involvement Component to anExisting Center-Based Program for Children with Disabilities and Their Families. In K.White and G. Boyce (Eds.), Early Education and Development (pp. 327-345).
Boyce, G. C., Smith, T. B., Immel, N., Casto, G. and Escobar, C. (1993). EarlyIntervention with Medically Fragile Infants: Investigating the Age-at-Start Question. In K.White and G. Boyce (Eds.), Early Education and Development (pp. 290-303).
Boyce, G. C., Behl, D., Mortensen, L. and Akers, J. (1991). Research Report-Childcharacteristics, family demographics and family processes: Their Effects on the StressExperienced by Families of Children with Disabilities. Counseling Psychology Quarterly,4, No. 4, 274-288.
Bricker, D. (1996). Assessment for IFSP Development and Intervention Planning. In S. J.Meisels and E. Feniches (Eds.), New Visions for the Developmental Assessment of Infantsand Young Children (First edition, pp. 162-192). Arlington: Zero to Three, National Centerfor Clinical Infant Programs.
Bricker, D. (Vol. 1), Cripe, J., Slentz, K. and Bricker, D. (Vol. 2), (1993). Assessment,Evaluation, and Programming System for Infants and Children (AEPS) (Volumes 1 and2). Baltimore: Paul H. Brooks Publishing Co.
159
Bricker, D. D., Bailey, E., and Bruder, M. B. (1984). The Efficacy of Early Intervention andthe Handicapped Infant: A Wise or Wasted Resource. Advances in Developmental andBehavioral Pediatrics, 5, 373-423.
Bromwich, R. (1983). Parent Behavior Progression - manual and 1983 supplement.Northridge: The Center for Research Development and Services, Department ofEducational Psychology, California State University.
Bruininks, Woodcock, Weatherman, and Hill (1985). Scales of Independent Behavior.Allen, TX: DLM Teaching Resources.
Burchinal, M. R., Bailey, D. B., and Snyder, P. (1994). Research Methods: Using GrowthCurve Analysis to Evaluate Child Change in Longitudinal Investigation. Journal of EarlyIntervention, 18, No.3, 403-423.
Bzoch, K. R., and League, R. (1991). The Bzoch-League Receptive-Expressive EmergentLanguage Scale: For the measurement of language skills in infancy (Second edition).Baltimore: University Park Press.
Carey, W. B. and McDevitt, S. C. (1978). Revision of the infant temperamentquestionnaire. Pediatrics, 61, 735.
Carnegie Task Force on Meeting the Needs of Young Children. (1994). Starting Points:Meeting the Needs of Our Youngest Children. New York: Carnegie Corporation of NewYork.
Caro, P., and Derevensky, J. L. (1991). Family-Focused Intervention Model:Implementation and Research Findings. Topics in Early Childhood Special Education, 11,No. 3, 66-80.
Carr, J. (1987). Six Weeks to Twenty One Years Old: A Longitudinal Study of Childrenwith Down's Syndrome and Their Families. Child Psychology and Psychiatry, 29, No. 4,407-431.
Casto, G. C. (1986). Research and Program Evaluation in Early Childhood SpecialEducation. In S. Odom and M. Karnes (Eds.), Early Intervention for Infants and Childrenwith Handicaps: An Empirical Base (1988 edition, pp. 51-62). Baltimore: Paul H. BrookesPublishing Company.
Casto, G. C., and Lewis, A. (1984). Selecting Outcome Measures in Early Intervention.Journal of the Division for Early Childhood, 10, No 2, 118-123.
Casto, G. C., and Mastropieri, M. A. (1986). The Efficacy of Early Intervention Programs:A Meta-Analysis. Exceptional Children, 52, No. 5, 417-424.
160
Casto, G. C., and White, K. (1993). Longitudinal Studies of Alternative Types of EarlyIntervention: Rationale and Design. In K. White and G. Boyce (Eds.), Early Education andDevelopment (pp. 224-235). Logan: Early Intervention Research Institute, Utah StateUniversity
Chugani, H. T., Phelps, M. E., and Mazziotta, J. C. (1987). Position Emission TomographyStudy of Human Brain Functional Development. Annals of Neurology, 22, No. 4, 487-497.
Cleary, P. D. (1988). Social Support: Conceptualization and Measurement. In H. B. Weissand F. H. Jacobs (Eds.), Evaluating Family Programs (pp. 195-216). Hawthorne: AldineDe Gruyter.
Colorado Foundation for Families and Children. (1997). Early Childhood ConnectionsFamily Survey: The Statewide Report.
Conger, J. A., and Kanungo, R. N. (1988). The Empowerment Process: Integrating Theoryand Practice. Academy of Management Review, 13, No. 3, 471-482.
Crowley, S. L., and Taylor, M. J. (1993). The Parenting Stress Index: PsychometricCharacteristics with Families Having Disabled Children. Logan: The Early InterventionResearch Institute, Utah State University.
Crowley, S. L., and Taylor, M. J. (1994). Mother's and Father's Perceptions of FamilyFunctioning in Families Having Children with Disabilities. Early Education andDevelopment, 5, No. 3, 214-225.
Dawson, G., and Osterling, J. (1997). Early Intervention in Autism. In M. J. Guralnick(Ed.), The Effectiveness of Early Intervention (pp. 307-326). Baltimore: Paul H. BrookesPublishing Company.
Devellis, R. F., Devellis, B. M., Revicki, D. A., Lurie, S. J., Runyan, D. K., and Bristol,M. (1985). Development and validation of the Child Improvement Locus of Control(CILC) Scales. In Journal of Social and Clinical Psychology, 3, 307-324.
Dihoff, R. A., Mcewan, M., Farrelly, M., Brosvic, G. M., Carpenter, L., Anderson, J., Kafer,L. B., Rizzuto, G. E., and Bloszinsky, S. (1994). Efficacy of Part- and Full-Time EarlyIntervention. Perceptual and Motor Skills, 79, 907-911.
Dodge, D. T. and Colker, L. (1992). Creative Curriculum for Early Childhood (Thirdedition). Washington DC: Teaching Strategies.
Dunst, C. J., Jenkins, V., and Trivette, C. M. (1984). The family support scale:Reliability and validity. In Journal of Individual, Family, and Community Wellness, 1,45-52.
161
Dunst, C. J., Trivette, C. M., and Jodry, W. (1997). Influence of Social Support on Childrenwith Disabilities and Their Families. In M. J. Guralnick (Ed.), The Effectiveness of EarlyIntervention (pp. 499-522). Baltimore: Paul H. Brookes Publishing Company.
Dunst, C., Trivette, C., and Deal, A. (Eds.). (1988). Enabling and Empowering Families.Cambridge: Brookline Books.
Early Childhood Research Institute on Measuring Growth and Development. (1998).Selection of General Growth Outcomes for Children Between Birth and Age Eight.Technical Report # 1-DRAFT.
Eayrs, C., and Jones, R. P. (1992). Methodological Issues and Future Direction in theEvaluation of Early Intervention Programs. Child Care, Health and Development, 18, 15-28.
Eisen, M., Donald, C. A., Ware, J. E., Brook, R. H. (1980). Conceptualization andmeasurement of health for children in the Health Insurance Study. Santa Monica: TheRand Corporation.
Farran, D. C. (1990). Effects of intervention with disadvantaged and disabled children: Adecade review. In J. Shonkoff and S. Meisels (Eds.), Handbook of Early ChildhoodIntervention (First edition, pp. 501-539). Cambridge: Cambridge University Press.
Fenson, L., Dale, P. S., Resnick, J. F., Thall, D., Bates, E., Hartung, J. P., Pethick, S.,Reilly, J. S. (1993). The MacArthur Communicative Development Inventory. San Diego:Singular Publishing Group, Inc.
Fewell, R., and Glick, M. P. (1996). Program Evaluation Findings of an Intensive EarlyIntervention Program. American Association on Mental Retardation, 233-243.
Futterweit, L. R., and Ruff, H. A. (1993). Principles of Development: Implications forEarly Intervention. Journal of Applied Developmental Psychology, 14, 153-173.
Gallagher, J. (1996). The family as a focus for intervention. In J. Shonkoff and S. Meisels(Eds.), Handbook of Early Childhood Intervention (First edition, pp. 540-559). Cambridge:Cambridge University Press.
Gibson, D., and Fields, D. L. (1984). Early Infant Stimulation Programs for Children withDown Syndrome. Advances in Developmental and Behavior Pediatrics, 5, 331-371.
Gibson, D., and Harris, A. (1988). Aggregated early intervention effects for Down'ssyndrome persons: patterning and longevity of benefits. Journal of Mental DeficiencyResearch, 32, 1-17.
Glover, E., Preminger, J., and Sanford, A. (1995). Learning Accomplishment Profiles:Early Learning Accomplishment Profile (E-LAP). Chapel Hill: Chapel Hill Training-Outreach Project.
162
Goldberg, S. (1977). Social Competence in Infancy: A Model of Parent-Infant Interaction.Merrill-Palmer Quarterly, 23, No. 3, 163-176.
Green, B. L., & McAllister, C. (1998). Theory-Based, Participatory Evaluation: A PowerfulTool for Evaluating Family Support Programs, Opening the Black Box, Bulletin of Zero toThree, National Center for Clinical Infant Programs, February/March, 1998. Arlington:Zero to Three, National Center for Clinical Infant Programs.
Greenough, W. T., and Black, J. E. (1992). Introduction of Brain Structure by Experience:Substrates for Cognitive Development. Minnesota Symposia on Child Psychology, 24, 155-200.
Guralnick, M. J. (1988). Efficacy Research in Early Childhood Intervention Programs. InEarly Intervention for Infants and Children with Handicaps (pp. 75-88). Baltimore: PaulH. Brooke.
Guralnick, M. J. (1989). Social competence as a future direction for early interventionprograms. Journal of Mental Deficiency Research, 33, 275-281.
Guralnick, M. J. (1991). The Next Decade of Research on the Effectiveness of EarlyIntervention. Exceptional Children, 58, No. 2, 174-183.
Guralnick, M. J. (1993). Second Generation Research on the Effectiveness of EarlyIntervention. Early Education and Development, 4, No. 4, 366-378.
Guralnick, M. J. (1997). The Effectiveness of Early Intervention. Baltimore: Paul H.Brookes Publishing Company Publishing Co.
Guralnick, M. J. (1998). Effectiveness of Early Intervention for Vulnerable Children: ADevelopmental Perspective. American Journal on Mental Retardation, 102(4): 319-345.
Guralnick, M. J., and Bennett, F. C. (1987). Early Intervention for At-Risk andHandicapped Children: Current and Future Perspectives. In M. J. Guralnick and F. C.Bennett (Eds.), The Effectiveness of Early Intervention for At-Risk and HandicappedChildren (pp. 366-382). New York: Academic Press.
Guralnick, M. J., and Neville B. (1997). Designing Early Intervention Programs toPromote Children’s Social Competence. In Guralnick M. J. (Ed.), The Effectiveness ofEarly Intervention. Baltimore: Paul H. Brookes Publishing Company Publishing Co., pp.579-610.
Hanson, M. J. (1985). An Analysis of the Effects of Early Intervention Services for Infantsand Toddlers with Moderate and Severe Handicaps. Topics in Early Childhood SpecialEducation, 5, No. 2, 36-51.
Harbin, Gloria and Kochanek, Thomas (1997). Cover letter to report. Frank PorterGraham Child Development Center.
163
Harding, E. and Keating B. (1995). Birth To Three Years Study. Olympia: WashingtonState Institute for Public Policy and Office of Legislative Budget Committee.
Harding, E. and Keating B. (1995). Birth To Three Years Study: Technical Appendices.Olympia: Washington State Institute for Public Policy and Office of Legislative BudgetCommittee.
Harris, S. R. (1997). The Effectiveness of Early Intervention for Children with CerebrelPalsey and Related Motor Disabilities. In M. J. Guralnick (Ed.), The Effectiveness of EarlyIntervention (pp. 327-348). Baltimore: Paul H. Brookes Publishing Company.
Hatton, D. D., Bailey, Jr., D. B., Burchinal, M. R., and Ferrell, K. A (1997) DevelopmentalGrowth Curves of Preschool Children with Vision Impairments. Child Development, 68,No. 5, 788-806.
Hauser-Cram, P (1990). Designing meaningful evaluations of early intervention services. InJ. P. Shonkoff and S. J. Meisels (Eds.), Handbook of Early Childhood Intervention (pp.583-602). New York: Cambridge University Press.
Hauser-Cram, P., and Krauss, M. W. (1991). Measuring Change in Children and Families.Journal of Early Intervention, 15, No.3, 288-297.
Hauser-Cram, P., and Shonkoff, J. P. (1988). Rethinking the Assessment of Child-FocusedOutcomes. In H. B. Weiss and F. H. Jacobs (Eds.), Evaluating Family Programs (pp. 73-94). New York: A. de Gruyter.
Hayley, S. M., Coster, W. J., Ludlow, L. H., Haltiwanger, J. T., and Andrellos, P. J.(1992). Pediatric Evaluation of Disability Inventory (PEDI). Boston: PEDI ResearchGroup.
House Resolution 131, 105th Congress
http: //www.sri.com/policy/cehs/neils/neilprog.html, 3/13/98
http: //www.cec.sped.org/osep/8earlych.htm, 5/22/98
http: //www.ici.coled.umn.edu8001/ecri, 2/2/98
http: //www.isdd.indiana.edu/ fseval.html, 3/17/98
http: //www.nectas.unc.edu/eepcd/demos.htm#abstract, 5/22/98
Huttenlocher, P. R. (1990). Morphometric Study of Human Cerebral Cortex Development.Neuropsychologia, 28, No. 6, 517-527.
Innocenti, M. S. (1996). Longitudinal Studies of the Effects of Alternative Types of EarlyIntervention for Children with Disabilities: Follow-up Institute. Logan: Early InterventionResearch Institute, Utah State University
164
Innocenti, M. S., Hollinger, P. D., Escobar, C. M., and White, K. R. (1993). The Cost-Effectiveness of Adding One Type of Parent Involvement to an Early Intervention Program.Early Education and Development, 4, No. 4, 306-326.
Kracke, K. R. (1981). A survey of procedures for assessing family conflict anddysfunction. Family Therapy, 8, 241-253.
Keenan, T., Hopps, D., Cawthon, L., Bowden, J., Dickey, R., Loerch, S., and Shureen, A.(1996). Washington's Infant Toddler Early Intervention Program Study. A comparison ofEnrollment Counts on December 1 1993, May 1, 1995, December 1, 1995 and May 1, 1996.Olympia: Research and Data Analysis, Department of Social and Health Services.
Keenan, T., Lyons, D., Cawthon, L., Bowden, J., Dickey, R., Loerch, S., and Shureen, A.(1997). Washington's Infant Toddler Early Intervention Program Study. Enrollment ofWashington Children with Disabilities and Special Health Care Needs in Washington StatePrograms on December 2, 1996. Olympia: Research and Data Analysis, Department ofSocial and Health Services.
Kelly, J. F., and Barnard, K. E. (in press). Assessment of parent-child interaction andimplications for early intervention. In S. J. Meisels and J. P. Shonkoff (Eds.), Handbook ofEarly Childhood Intervention. Cambridge: Cambridge University Press.
King, E. H., Logston, D. A., and Schroeder, S. R. (1992). Risk Factors for DevelopmentalDelay Among Infants and Toddlers. Children's Health Care, 21, No 1, 39-52.
Kochanek, T. T., Kabacoff, R. I., and Lipsitt, L. P. (1987). Early Detection of HandicappingConditions in Infancy and Early Childhood: Toward a Multivariate Model. Journal ofDevelopmental Psychology, 8, 411-420.
Korsten, J. E., Dunn, D. D., Foss, T. V., and Francke, M. K. (1993). Every Move Counts(EMC). Antonio: Therapy Skill Builders/Psychological Corporation.
Lazar, I., and Darington, R. (1982). Lasting Effects of Early Intervention: A Report fromthe Consortium for Longitudinal Studies. Monographs of the Society for Research in ChildDevelopment 47 (Serial No. 195).
Lovaas, O. (1987). Behavioral Treatment and Normal Educational and IntellectualFunctioning in Young Autistic Children. Journal of Consulting and Clinical Psychology,55, 3-9.
Lyons, D., Keenan, T., Hopps, D., Cawthon, L., Dickey, R., Fleming, J., Loerch, S., andShureen, A. (1998). Washington's Infant Toddler Early Program Study: Enrollment ofWashington's Children with Disabilities and Special Health Care Needs in WashingtonState Public Programs on December 1, 1997. Olympia: Research and Data Analysis,Department of Social and Health Services.
165
Lyons-Ruth, K., and Zeanah, C. H. (1993). The Family Context of Infant Mental Health:I. Affective Development in the Primary Care Giving Relationship. In Zeanah, C. H.(Ed.), Handbook of Infant Mental Health. New York: Guilford Press, pp. 38-55.
Martin, E. W., Martin, R., and Terman, D. L. (1996). The Legislative and Litigation Historyof Special Education. The Future of Children , 6, No 1, 25-39.
McEachlin, J. J., Smith, T., and Lovvas, O. I. (1993). Long-Term Outcome for ChildrenWith Autism Who Received Early Intensive Behavioral Treatment. American Journal onMental Retardation, 97, No. 4, 359-372.
McLean, L. K., and Cripe, J. W. (1997). The Effectiveness of Early Intervention forChildren with Communication Disorder. In M. J. Guralnick (Ed.), The Effectiveness ofEarly Intervention (pp. 327-348). Baltimore: Paul H. Brookes Publishing Company.
Meisels, S. J. (1986). Using Criterion-Referenced Assessment Data to Measure theProgress of Handicapped Children in Early Intervention Programs. Ann Arbor: Universityof Michigan.
Meisels, S. J., and Fenichel, E. (Eds.). (1996). New Visions for the DevelopmentalAssessment of Infants and Young Children (First edition). Washington DC: Zero to Three.
Moore, M. (1998). Treatment Outcomes Project Launches Adult Data Collection. ASHALeader, 3, No. 4, February 3, 1998, Rockville: American Speech-Language HearingAssociation.
Moore, M., Fredericks, H. D., and Baldwin, V. (1981). The Long-Range Effects of EarlyChildhood Education on a Trainable Mentally Retarded Population. Journal of the Divisionfor Early Childhood, 4, 94-110.
Mott, S., Lewis, M., Meisels, S. J., Shonkoff, J. P., and Simeonsson, R. J. (1986). Methodsfor Assessing Child and Family Outcomes in Early Childhood Special Education Programs:Some Views from the Field. Topics in Early Childhood Special Education, 6, No. 2, 1-15.
National Early Intervention Longitudinal Study Draft Parent Interview Survey, 1998
National Early Intervention Longitudinal Study Draft Surveys, February 27, 1997
Newborg, J., Stock, J., Wnek, L., Guidubaldi, J., and Svinicki, J. (1984). Battelledevelopmental inventory. Allen: DLM Teaching Resources.
Odom, S. I., and Shuster, S. K. (1986). Naturalistic Inquiry and the Assessment of YoungHandicapped Children and Their Families. Topics in Early Childhood Special Education, 6,No. 2, 68-82.
166
Oelwein, P. L., Fewell, R. R., and Pruess, J. B. (1985). The Efficacy of Intervention atOutreach Sites of the Program for Children with Down Syndrome and Other DevelopmentalDelays. Topics in Early Childhood Special Education, 5, No. 2, 78-87.
Office of Superintendent of Public Instruction (OSPI), (1997). Individuals withDisabilities Education Act—B Child Count December 1, l997. Olympia: OSPI .
Palfrey, J. S., Singer, J. D., Walker, D. K., and Butler, J. A. (1987). Early Identification ofChildren's Special Needs. Journal of Pediatrics, 11, No. 5, 111-659.
Peck, C. A., Gallucci, C., Schwartz, I., Staub, D., White, O., and Billingsley, F. (1992).Analysis of the outcomes of inclusive education and associated school contexts: A four yearfollow-along study. Inclusive Schools Research Group-Washington State University, andUniversity of Washington. Vancouver: Education Department, Washington StateUniversity.
Peck, C. A.. (1993). Ecological perspectives on the implementation of integrated earlychildhood programs. In C. A. Peck, S. L. Odom, and D. D. Bricker (Eds.), Integratingyoung children with disabilities into community programs (pp. 3-16). Baltimore: Paul H.Brookes Publishing Company Publishing Company.
Personal E-mail Communication, Beppie Shapiro, project coordinator, 4/6/98
Personal E-mail Communication, Beppie Shapiro, project coordinator, 1/6/98
Personal E-mail Communication, Jeff Priest, Early Childhood Research Institute researchstaff, 4/3/98
Personal E-mail Communication, Kathy Hebbeler, National Early InterventionLongitudinal Study coordinator, 4/17/98
Personal E-mail Communication, Michael Conn-Powers, researcher, 4/7/98
Personal Interview, Maryanne Barnes, executive director, Tacoma Learning Center,3/24/98
Polit, D. F. and Hungler, B. P., (1987). Nursing research (Third edition). Philadelphia: L.B. Lippincott.
Presentation, Dr. Susan Janko, Researcher, 2/6/98
Ramey, C. T., and Haskins, R. (1981). The Modification of Intelligence Through EarlyExperience. Intelligence, 5, 5-19.
Ramey, C. T., Bryant, D. M., Sparling, J. J., and Wasik, B. H. (1985). Project CARE: AComparison of Two Early Intervention Strategies to Prevent Retarded Development. Topicsin Early Childhood Special Education, 5, No. 2, 12-25.
167
Ramey, C. T., Bryant, D. M., Wasik, B. H., Sparling, J. J., Fendt, K. H., and LaVange, L.M. (1992). Infant Health and Development Program for Low Birth Weight, PrematureInfants: Program Elements, Family Participation, and Child Intelligence. Pediatrics, 3, 454-465.
Ramey, C. T., Stedman, D. J., Borders-Patterson, A., and Mengel, W. (1978). PredictingSchool Failure from Information Available at Birth. American Journal of MentalDeficiency, 82, No. 6, 525-534.
Resnick, M. B., Armstrong, S., and Carter, R. L. (1988). Developmental InterventionProgram for High-risk Premature Infants: Effects on Development and Parent-InfantInteractions. Developmental and Behavioral Pediatrics, 9, No. 2, 73-78.
Riskin, J. and Faunce, E. E. (1982). Family Interaction Scales: I. Theoretical frameworkand method. Archives of General Psychiatry, 22, 504-512.
Roberts, R. N., Innocenti, M. S., and Goetze, L. D. (1997). By What Outcomes Should PartH be Evaluated at the State Level? Proceedings of the State Part H Evaluators' Consortium.Logan: Early Intervention Research Institute, Utah State University.
Rojahn, J., Aman, M., Moeschberger, M., King, E., Logsdon, D., and Schroeder, S. (1995).Biological and Environmental Risk for Poor Developmental Outcome of Young Children.American Journal on Mental Retardation, 97, No. 6, 702-708.
Sarason, I. G., Levine, H. M., Basham, R. B., and Sarason, B. R. (1983). Assessing socialsupport: The Social Support Questionnaire. Journal of Personality and SocialPsychology, 44, 127-139.
Segal, Marilyn, and Webber, Noreen T. (1996). Nonstructural Play Observations:Guidelines, Benefits, and Caveats. In S. J. Meisels and E. Fenichel (Eds.). (1996). NewVisions for the Developmental Assessment of Infants and Young Children (First edition).Arlington: Zero to Three, National Center for Clinical Infant Programs.
Seifer, R., Clark, G. N., and Samaeroff, A. J. (1991). Positive Effects of InteractionCoaching on Infants with Developmental Disabilities and Their Mothers. American Journalon Mental Retardation, 90, No. 1, 1-11.
Shonkoff, J. P., and Hauser-Cram, P. (1987). Early Intervention for Disabled Infants andTheir Families: A Quantitative Analysis. Pediatrics, 80, No. 5, 650-658.
Shonkoff, J. P., Hauser-Cram, P., Krauss, M. W., and Upshur, C. (1988). Early InterventionEfficacy Research: What Have We Learned and Where Do We Go From Here? Topics inEarly Childhood Special Education, 8, No. 1, 81-93.
168
Shonkoff, J. P., Hauser-Cram, P., Krauss, M. W., and Upshur, C. C. (1992). Developmentof Infants with Disabilities and Their Families: Implications for Theory and ServiceDelivery. Monographs of the Society for Research in Child Development, Serial No. 230,57, No. 6.
Snyder, K. D., Weeldreyer, J. C., Dunst, C. J., and Cooper, C. S. (1985). Parent self-awareness scale. Morganton: Western Carolina Center.
Songs, A., Jones, S., Lippert, J., Metzgen, K., Miller, J., and Borreca, C. (1984).Wisconsin Behavior Rating Scale: Measure of adaptive behavior for the developmentallevels of 0 to 3 years. American Journal of Mental Deficiency, 88, 401-410.
Spiker, D., and Hopmann, M. R. (1997). The Effectiveness of Early Intervention forChildren with Down Syndrome. In M. J. Guralnick (Ed.), The Effectiveness of EarlyIntervention (pp. 271-306). Baltimore: Paul H. Brookes Publishing Company.
Staples, L. H. (1990). Powerful Ideas About Empowerment. Administration in Social Work,14, No. 2, 29-42.
Strom, R. (1984). Parent as a Teacher Inventory. Bensenville: Scholastic Testing Service.
Taylor, M. (1993). The Cost Effectiveness of Increasing Hours Per Week of EarlyIntervention Services for Young Children with Disabilities. In K. White and G. Boyce(Eds.), Early Education and Development (pp. 238-254).
Tjossem, T. D. (1976). Early Intervention: Issues and Approaches. In InterventionStrategies for High Risk Infants and Young Children (pp. 3-33). Baltimore: BaltimoreUniversity Park Press.
Turnbull, A. P., and Turnbull, H. R. (in press). Evolution of family professional models:Empowerment as the model for the early 21st century. In S. J. Meisels and J. P. Shonkoff(Eds.), Handbook of Early Intervention (Second edition). Cambridge: CambridgeUniversity Press
Turnbull, A. P. and Turnbull H. R. (1997). Families, Professionals, and Exceptionality: ASpecial Partnership. Upper Saddle River: Prentice-Hall.
U. S. Department of Education Program Performance Plans (FY1999). (1998).Washington DC: U. S. Department of Education
U. S. Department of Health and Human Services. (1991). Healthy People 2000: NationalHealth Promotion and Disease Prevention Objectives. Washington DC: Public HealthService.
Vaux, A., and Harrison, D. (1985). Support network characteristics associated withsupport satisfaction and perceived support. American Journal of Community Psychology,13, 245-268.
169
Vulpe, S. G. (1994). Vulpe Assessment Battery (Revised edition). New York: SlossonEducational Publications.
Walsh, W. M., and Wood, J. I. (1983). Family Assessment: Bridging the gap betweentheory, research, and practice. American Mental Health Counselor Association Journal,111-120.
Weiler, I. J., Hawrylak, N., and Greenough, W. T. (1995). Morphogenesis in MemoryFormation: Synaptic and Cellular Mechanisms. Behavioral Brain Research, 66, 1-6.
White, K. R., and Casto, G. C. (1985). An Integrative Review of Early Intervention EfficacyStudies with At-Risk Children: Implications for the Handicapped. Analysis andIntervention in Developmental Disabilities, 5, 7-31.
White, K. R., Bush, D. W., and Casto, G. C. (1985). Learning From Reviews of EarlyIntervention. The Journal of Special Education, 19, No. 4, 417-428.
Wolery, M. (1985). The Evaluation of Two Levels of a Center Based Early InterventionProject. Topics in Early Childhood Special Education, 5, No. 2, 66-77.
Zero to Three, National Center for Clinical Infant Programs. (1992). Heart Start: TheEmotional Foundations of School Readiness. Arlington: Zero to Three, National Center forInfant Programs.
Zigler, E., and Balla, D. (1982). Selecting outcome variables in evaluations of earlychildhood special education programs. Topics in Early Childhood Special Education, 4, 11-22.

170

APPENDICES

172

173
APPENDIX A
ADVISORY GROUP BIOSKETCHES
Nancy Anderson, M.D., M.P.H., is the lead consulting physician for the Medical AssistanceAdministration. She received her M.D. degree from Columbia University in 1980 and trained asa pediatrician at the University of Washington and Grady Hospital/Emory University. Afterworking in Atlanta, she returned to Seattle to complete an M.P.H. in Health Services/MaternalChild Health. Subsequently she lived and worked in Mozambique for five years and in Portugalfor three years. She is interested in women’s health and community health assessmentparticularly in the international and intercultural contexts.
Nancy Fisher, R.N., M.D., M.P.H., is the Medical Director for the Medical AssistanceAdministration of DSHS. She began her health care career in the U.S. Navy Nurse Corps. In1973 she started medical training at Baylor College of Medicine, where she received her M.D.and completed pediatrics internship and residency. In 1978 she began a Fellowship in MedicalGenetics in the Department of Medicine at the University of Washington, where, as an R.W.J.Clinical Scholar, she also completed a residency in Preventive Medicine and earned an M.P.H.She is currently a Clinical Associate Professor in Pediatrics at the University of Washington. Herpublications cover diverse topics in pediatrics, genetics, and cultural diversity. Dr. Fisher wasnamed to Who’s Who in America in 1986. She has a long history of community involvement andobtained a Certificate in Ethics from the University of Washington in 1993.
Jean Kelly, Ph.D., is a Research Associate Professor in the Department of Family and ChildNursing and an Adjunct Instructor in the Department of Special Education at the University ofWashington. She received an M.A. from San Francisco State University and a Ph.D. from theUW, both in Early Childhood Special Education. She currently acts as the Principal Investigatorof a birth to three early intervention grant and as Co-Principal Investigator on two grants (fundedby the MCH Bureau and the NICHD) related to Early Child Care for Typically DevelopingChildren and Children with Special Needs. Dr. Kelly serves on the Personnel PreparationCommittee of the Infant-Toddler Early Intervention Program’s Washington State InteragencyCoordinating Council. She is the author of numerous journal articles and book chapters aboutparent-child interactions, particularly for young children with special needs.
Katy Middleton, B.S., received a B.S. in Biology from the University of Alaska in Fairbanks.Katy is the loving mother of Wilson Parrish Middleton, born 8/6/91. Wilson, born at 26 weeks,was diagnosed with hydrocephalus during his 121 days in the NICU. Since 1992, Katy has beenactive in the early intervention field. After moving to Yakima in l995, she has been a member ofthe local ICC and has coordinated several public awareness efforts. Hired as an FRC in 1996,Katy assumed responsibility for coordinating the NICU follow up clinic, assisted in the design ofthe information system for Children’s Village, served on the SICC Data Committee andparticipated in the Special Education Forum. In addition, she is currently implementing a newscreening and reporting tool for use with birth to three year olds at Children’s Village, serving asSecretary for the Parent to Parent Advisory Board and facilitating community inclusion efforts.

174
Paulette (Paulie) Mills, Ph.D., is an Assistant Professor, Department of Human Development atWashington State University (Pullman). She received an M.A. from the University of Minnesotain Child Psychology and a Ph.D. from the University of Washington in Education/SpecialEducation. Prior to assuming her responsibilities at WSU, she served as Follow-Up ResearchCoordinator and Testing Coordinator for a number of studies at the UW Experimental EducationUnit. She also was the Coordinator for the Rural Services Providers Project and subsequentlyreceived the Member of the Year Award (1991) of the American Council on Rural SpecialEducation. At WSU, she has received numerous teaching awards. Her recent publications havefocused on cognitive referencing, language facilitation, and assessment of program designcharacteristics.
Judith (Judi) Moore, M.A., has been Executive Director of Boyer Children’s Clinic in Seattlesince l980. She received an M.A. in Counseling Psychology from Chapman College and a B.A.in Psychology from Willamette University. She has served as director of numerous projectsincluding the At Risk Project (Asian Tracking and Referral by Interagency Seattle Committees),Extending Family Resources, Foster Extended Family Project, and Staff Training for EarlyChildhood Development Centers. As a legislative liaison her activities included passage ofHouse Bill 1085 for neurodevelopmental therapy for children with disabilities, l990. Judith wasChair of the State of Washington Interagency Council for Infants and Toddlers with Disabilitiesand Their Families from 1993 to 1996 and first Chairperson of the Early Childhood DevelopmentAssociation of Washington.
Charles (Cap) Peck, Ph.D., is Professor of Special Education at Washington State University(Vancouver). He began his career in education in Santa Rosa, California, as an instructional aideserving children with severe multiple handicaps. He earned his teaching credentials in elementaryeducation and special education at Sonoma State University and his Ph.D. in Special Educationand Educational Psychology at University of California, Santa Barbara. He came to WSU in1984, serving first on the faculty in Pullman and then in Vancouver in 1989. His researchprojects have focused on the inclusion of children with disabilities in regular classrooms. Cap hasauthored or co-authored over fifty scholarly papers and edited two volumes related to childrenwith disabilities. He was Teacher of the Year at WSU (Vancouver) in 1993 and received theCollege of Education Faculty Excellence Award for Research in 1995.
Susan Sandall, Ph.D., is Research Coordinator of the Early Childhood Research Institute onInclusion at the University of Washington. Susan received her B.A. from the University ofCalifornia, Berkeley, her M.A. from the University of Oregon, and her Ph.D. from the Universityof Washington College of Education. After completing her Ph.D., she was Research AssistantProfessor at the University of Colorado and Associate Professor at the University of Delaware.She returned to the UW in 1996. She is co-author of two books, author or co-author of six bookchapters and numerous journal articles. In Delaware, she was project director for the Evaluationof IRMC Sponsored Early Childhood Programs. She has served as a consultant and providedtraining on topics including adult-child interaction, intervention methods, and mainstreaming.
Kristine (Kris) Slentz, Ph.D., is Associate Professor, Special & Elementary Education, WesternWashington University. Kris obtained her B.A. at the State University of New York in Sociologyand her M.A. and Ph.D. at the University of Oregon in Special Education. She came to WesternWashington University in 1989. She serves on numerous task forces and advisory boards and has

175
also been a consultant for a number of Educational Service Districts and for the Child OutcomesProject of the Nooksack Family Literacy Project. Her publications include journal articles andmonographs, in particular about the Assessment, Evaluation and Programming System forInfants and Young Children.
PROGRAM STAFF
Lou Colwell, Ed.D, is program support supervisor for early intervention services, birth to three,at the Office of the Superintendent of Public Instruction. She has experience as a teacher(preschool through third grade) and director of early childhood programs in both the private andpublic sectors. Her present position focuses on providing technical assistance and training toassist school districts in implementing the Individuals with Disabilities Education Act (IDEA).Lou received her M.Ed. and Ed.D. from Seattle University.
Deborah A. Lee, Ph.D., R.N., is a Public Health Nursing Consultant for the Department ofHealth (DOH), Children with Special Health Care Needs Program. She received a B.S.N. fromWestern Kentucky University, a M. N. from Emory University, and a Ph.D. in Nursing from theUniversity of North Carolina at Chapel Hill. Prior to her position at DOH, Dr. Lee completed apostdoctoral fellowship at the University of Washington School of Nursing, focusing on healthpolicy and children with special health care needs. Dr. Lee has been involved with children withspecial health care needs and their families in many different capacities-as clinician, educator andresearcher. Her research has focused on children with developmental delays, HIV, chronicillness, and most recently children who are medically fragile and technology-dependent.
Babs Roberts is a Grant Management Analyst for the DSHS Infant Toddler Early InterventionProgram and responsible for monitoring its agreement with Research and Data Analysis. Babshas been with the Infant Toddler Early Intervention Program for 3 1/2 years and is currentlyresponsible for coordinating contractual activities and federal reporting requirements. As part ofher duties, she is responsible for annual data reporting required by the Office of SpecialEducation Programs at the federal Department of Education. Babs is also responsible forcoordination of data collection from contractors according to their annual work orderrequirements.

176
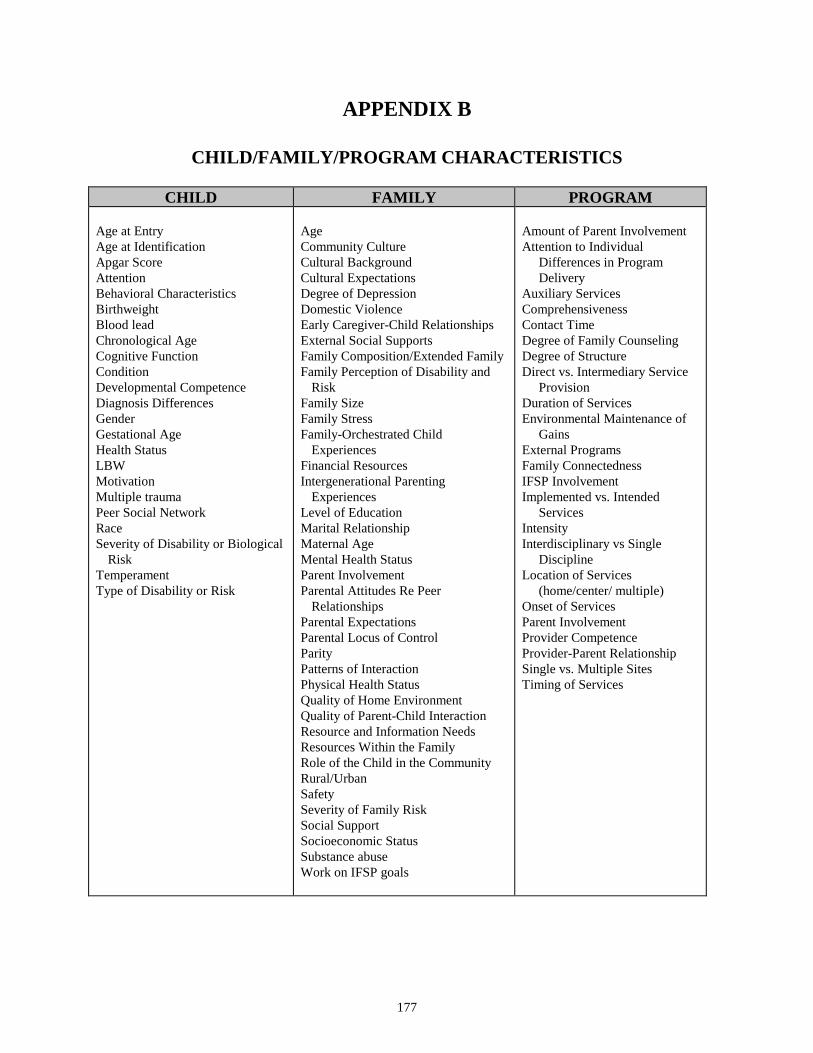
177
APPENDIX B
CHILD/FAMILY/PROGRAM CHARACTERISTICS
CHILD FAMILY PROGRAM
Age at EntryAge at IdentificationApgar ScoreAttentionBehavioral CharacteristicsBirthweightBlood leadChronological AgeCognitive FunctionConditionDevelopmental CompetenceDiagnosis DifferencesGenderGestational AgeHealth StatusLBWMotivationMultiple traumaPeer Social NetworkRaceSeverity of Disability or Biological
RiskTemperamentType of Disability or Risk
AgeCommunity CultureCultural BackgroundCultural ExpectationsDegree of DepressionDomestic ViolenceEarly Caregiver-Child RelationshipsExternal Social SupportsFamily Composition/Extended FamilyFamily Perception of Disability and
RiskFamily SizeFamily StressFamily-Orchestrated Child
ExperiencesFinancial ResourcesIntergenerational Parenting
ExperiencesLevel of EducationMarital RelationshipMaternal AgeMental Health StatusParent InvolvementParental Attitudes Re Peer
RelationshipsParental ExpectationsParental Locus of ControlParityPatterns of InteractionPhysical Health StatusQuality of Home EnvironmentQuality of Parent-Child InteractionResource and Information NeedsResources Within the FamilyRole of the Child in the CommunityRural/UrbanSafetySeverity of Family RiskSocial SupportSocioeconomic StatusSubstance abuseWork on IFSP goals
Amount of Parent InvolvementAttention to Individual
Differences in ProgramDelivery
Auxiliary ServicesComprehensivenessContact TimeDegree of Family CounselingDegree of StructureDirect vs. Intermediary Service
ProvisionDuration of ServicesEnvironmental Maintenance of
GainsExternal ProgramsFamily ConnectednessIFSP InvolvementImplemented vs. Intended
ServicesIntensityInterdisciplinary vs Single
DisciplineLocation of Services
(home/center/ multiple)Onset of ServicesParent InvolvementProvider CompetenceProvider-Parent RelationshipSingle vs. Multiple SitesTiming of Services

178
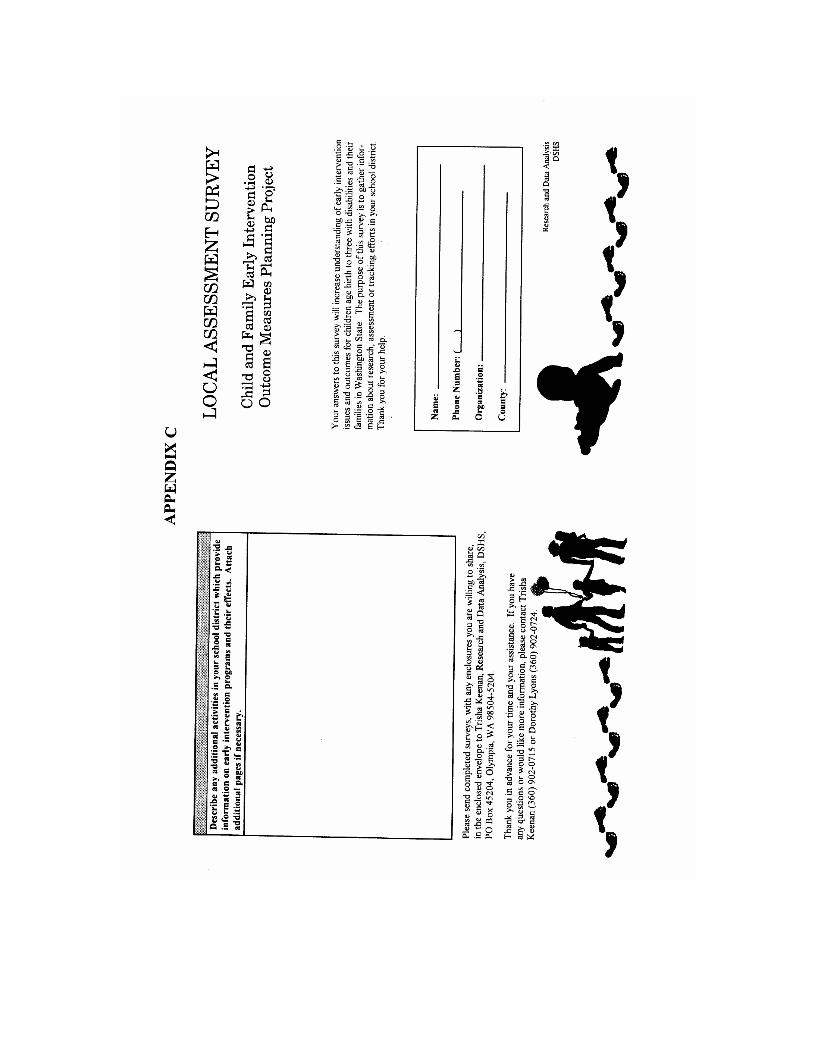


181
APPENDIX D
STATE AND NATIONAL EARLY INTERVENTION GOALS
National Goals
NATIONAL IDEA GOALS, PART H (1997)
• A child’s potential for developmental delay is minimized• A child’s potential for continuing services is minimized when school age is reached• A child’s potential to live independently is maximized• A family’s potential to meet the needs of their infants is enhanced• State and local agencies’ abilities to meet the needs of historically underrepresented
populations (e.g., minority, low-income, inner-city, rural) is enhanced.
NATIONAL STATE PROGRAM GOALS AS STATED IN IDEA (1997)
A statewide system shall include, at a minimum, the following components: A definition of the term `developmental delay ' that will be used by the State in carrying out
programs under this part. A State policy that is in effect and that ensures that appropriate early intervention services are
available to all infants and toddlers with disabilities and their families, including Indianinfants and toddlers and their families residing on a reservation geographically located inthe State.
A timely, comprehensive, multidisciplinary evaluation of the functioning of each infant ortoddler with a disability in the State, and a family-directed identification of the needs ofeach family of such an infant or toddler, to appropriately assist in the development of theinfant or toddler.
For each infant or toddler with a disability in the State, an individualized family service plan,including service coordination services in accordance with such service plan.
A comprehensive child find system, including a system for making referrals to serviceproviders that includes timelines and provides for participation by primary referral
A public awareness program focusing on early identification of infants and toddlers withdisabilities, including the preparation and dissemination by the lead agency designated orestablished under paragraph (10) to all primary referral sources, especially hospitals andphysicians, of information for parents on the availability of early intervention services, andprocedures for determining the extent to which such sources disseminate such informationto parents of infants and toddlers.
A central directory which includes information on early intervention services, resources, andexperts available in the State and research and demonstration projects being conducted inthe State.
A comprehensive system of personnel development, including the training ofparaprofessionals and the training of primary referral sources respecting the basiccomponents of early intervention services available in the State, and may include--
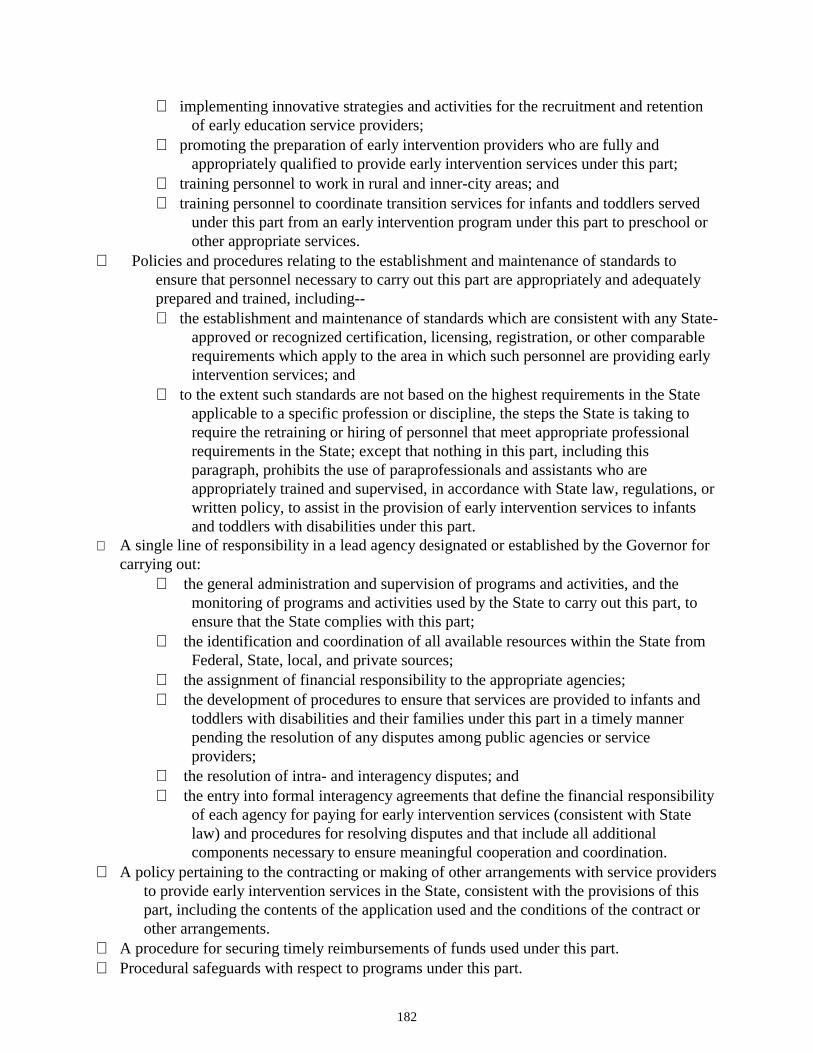
182
∗ implementing innovative strategies and activities for the recruitment and retentionof early education service providers;
∗ promoting the preparation of early intervention providers who are fully andappropriately qualified to provide early intervention services under this part;
∗ training personnel to work in rural and inner-city areas; and∗ training personnel to coordinate transition services for infants and toddlers served
under this part from an early intervention program under this part to preschool orother appropriate services.
Policies and procedures relating to the establishment and maintenance of standards toensure that personnel necessary to carry out this part are appropriately and adequatelyprepared and trained, including--∗ the establishment and maintenance of standards which are consistent with any State-
approved or recognized certification, licensing, registration, or other comparablerequirements which apply to the area in which such personnel are providing earlyintervention services; and
∗ to the extent such standards are not based on the highest requirements in the Stateapplicable to a specific profession or discipline, the steps the State is taking torequire the retraining or hiring of personnel that meet appropriate professionalrequirements in the State; except that nothing in this part, including thisparagraph, prohibits the use of paraprofessionals and assistants who areappropriately trained and supervised, in accordance with State law, regulations, orwritten policy, to assist in the provision of early intervention services to infantsand toddlers with disabilities under this part.
A single line of responsibility in a lead agency designated or established by the Governor forcarrying out:
∗ the general administration and supervision of programs and activities, and themonitoring of programs and activities used by the State to carry out this part, toensure that the State complies with this part;
∗ the identification and coordination of all available resources within the State fromFederal, State, local, and private sources;
∗ the assignment of financial responsibility to the appropriate agencies;∗ the development of procedures to ensure that services are provided to infants and
toddlers with disabilities and their families under this part in a timely mannerpending the resolution of any disputes among public agencies or serviceproviders;
∗ the resolution of intra- and interagency disputes; and∗ the entry into formal interagency agreements that define the financial responsibility
of each agency for paying for early intervention services (consistent with Statelaw) and procedures for resolving disputes and that include all additionalcomponents necessary to ensure meaningful cooperation and coordination.
A policy pertaining to the contracting or making of other arrangements with service providersto provide early intervention services in the State, consistent with the provisions of thispart, including the contents of the application used and the conditions of the contract orother arrangements.
A procedure for securing timely reimbursements of funds used under this part. Procedural safeguards with respect to programs under this part.

183
A system for compiling data requested by the Secretary that relates to this part. A State Interagency Coordinating Council. Policies and procedures to ensure that, consistent with section 636(d)(5)--
∗ to the maximum extent appropriate, early intervention services are provided innatural environments; and
∗ the provision of early intervention services for any infant or toddler occurs in asetting other than a natural environment only when early intervention cannot beachieved satisfactorily for the infant or toddler in a natural environment.
[The Individuals with Disabilities Education Act Amendments of 1997, “Part C--INFANTS AND TODDLERS WITHDISABILITIES, sec. 635, http://thomas.loc.gov/#laws, (P.L. 105-117): H.R. 5 -- Law Text -- Table of Contents: “Part C--Infantsand Toddlers with Disabilities"]
IFSP GOALS AS DETERMINED BY IDEA (1997)
A statewide system shall provide, at a minimum, for each infant or toddler with a disability, andthe infant's or toddler 's family, to receive-- a multidisciplinary assessment of the unique strengths and needs of the infant or toddler and
the identification of services appropriate to meet such needs; a family-directed assessment of the resources, priorities, and concerns of the family and the
identification of the supports and services necessary to enhance the family 's capacity tomeet the developmental needs of the infant or toddler; and
a written individualized family service plan developed by a multidisciplinary team, includingthe parents, as required by subsection (e).
Periodic Review.--The individualized family service plan shall be evaluated once a year andthe family shall be provided a review of the plan at 6-month intervals (or more oftenwhere appropriate based on infant or toddler and family needs).
Promptness After Assessment.--The individualized family service plan shall be developedwithin a reasonable time after the assessment is completed. With the parents' consent, earlyintervention services may commence prior to the completion of the assessment.
Content of Plan.--The individualized family service plan shall be in writing and contain--
∗ a statement of the infant's or toddler's present levels of physical development,cognitive development, communication development, social or emotionaldevelopment, and adaptive development, based on objective criteria;
∗ a statement of the family's resources, priorities, and concerns relating to enhancingthe development of the family's infant or toddler with a disability;
∗ a statement of the major outcomes expected to be achieved for the infant ortoddler and the family, and the criteria, procedures, and timelines used todetermine the degree to which progress toward achieving the outcomes is beingmade and whether modifications or revisions of the outcomes or services arenecessary;
∗ a statement of specific early intervention services necessary to meet the uniqueneeds of the infant or toddler and the family, including the frequency, intensity,and method of delivering services;

184
∗ a statement of the natural environments in which early intervention services shallappropriately be provided, including a justification of the extent, if any, towhich the services will not be provided in a natural environment;
∗ the projected dates for initiation of services and the anticipated duration of theservices;
∗ the identification of the service coordinator from the profession most immediatelyrelevant to the infant's or toddler's or family 's needs (or who is otherwisequalified to carry out all applicable responsibilities under this part) who will beresponsible for the implementation of the plan and coordination with otheragencies and persons; and
∗ the steps to be taken to support the transition of the toddler with a disability topreschool or other appropriate services.
Parental Consent.--The contents of the individualized family service plan shall be fullyexplained to the parents and informed written consent from the parents shall be obtainedprior to the provision of early intervention services described in such plan. If the parentsdo not provide consent with respect to a particular early intervention service, then theearly intervention services to which consent is obtained shall be provided.
[The Individuals with Disabilities Education Act Amendments of 1997, “Part C--INFANTS AND TODDLERS WITHDISABILITIES, sec. 636, http://thomas.loc.gov/#laws, (P.L. 105-117): H.R. 5 -- Law Text -- Table of Contents: “Part C--Infantsand Toddlers with Disabilities"]
PROCEDURAL RIGHTS AS DETERMINED BY IDEA (1997)
Minimum Procedures.--The procedural safeguards required to be included in a statewide systemshall provide, at a minimum, the following: The timely administrative resolution of complaints by parents. Any party aggrieved by the
findings and decision regarding an administrative complaint shall have the right to bring acivil action with respect to the complaint in any State court of competent jurisdiction or ina district court of the United States without regard to the amount in controversy. In anyaction brought under this paragraph, the court shall receive the records of theadministrative proceedings, shall hear additional evidence at the request of a party, and,basing its decision on the preponderance of the evidence, shall grant such relief as thecourt determines is appropriate.
The right to confidentiality of personally identifiable information, including the right ofparents to written notice of and written consent to the exchange of such informationamong agencies consistent with Federal and State law.
The right of the parents to determine whether they, their infant or toddler, or other familymembers will accept or decline any early intervention service under this part inaccordance with State law without jeopardizing other early intervention services underthis part.
The opportunity for parents to examine records relating to assessment, screening, eligibilitydeterminations, and the development and implementation of the individualized familyservice plan.
Procedures to protect the rights of the infant or toddler whenever the parents of the infant ortoddler are not known or cannot be found or the infant or toddler is a ward of the State,including the assignment of an individual (who shall not be an employee of the State lead

185
agency, or other State agency, and who shall not be any person, or any employee of aperson, providing early intervention services to the infant or toddler or any familymember of the infant or toddler) to act as a surrogate for the parents.
Written prior notice to the parents of the infant or toddler with a disability whenever the Stateagency or service provider proposes to initiate or change or refuses to initiate or changethe identification, evaluation, or placement of the infant or toddler with a disability, or theprovision of appropriate early intervention services to the infant or toddler.
Procedures designed to ensure that the notice fully informs the parents, in the parents' nativelanguage, unless it clearly is not feasible to do so, of all procedures available pursuant tothis section.
The right of parents to use mediation in accordance with section 615(e), except that—∗ any reference in the section to a State educational agency shall be considered to be
a reference to a State's lead agency established or designated under section635(a)(10);
∗ any reference in the section to a local educational agency shall be considered to bea reference to a local service provider or the State's lead agency under this part,as the case may be; and
∗ any reference in the section to the provision of free appropriate public educationto children with disabilities shall be considered to be a reference to the provisionof appropriate early intervention services to infants and toddlers withdisabilities.
[The Individuals with Disabilities Education Act Amendments of 1997, “Part C--INFANTS AND TODDLERSWITH DISABILITIES, sec. 639, http://thomas.loc.gov/#laws, (P.L. 105-117): H.R. 5 -- Law Text -- Table ofContents: “Part C--Infants and Toddlers with Disabilities"]
NATIONAL CHILD HEALTH GOALS: BIRTH TO THREE
Reduce growth retardation among low-income children aged 5 and younger to less than 10% Reduce to less than 10% the prevalence of mental disorders among children and adolescents Reduce homicides among children aged 3 and younger to no more than 3.1 per 100,000 Reduce to less than 25.2 per 1,000 children the rising incidence of maltreatment of children
younger than 18 Reduce deaths among children aged 14 and younger to no more than 5.5 per 100,000. Reduce drowning deaths among children aged 4 and younger to no more than 2.3 per 100,000 Reduce residential fire deaths among children aged 4 and younger to no more than 520
emergency department treatments per 100,000 Reduce nonfatal poisoning among children aged 4 and younger to no more than 520
emergency department treatments per 100,000 Reduce asthma morbidity among children aged 14 and younger, as measured by a reduction
in asthma hospitalizations to no more than 225 per 100,000 Reduce the prevalence of blood lead levels exceeding 15 µg/dL and 25µg/dL among children
aged 6 mos-5 yrs. To no more than 500,000 and zero respectively Reduce infant mortality rate to no more than 7 per 1,000 live births Reduce the prevalence of serious mental retardation in school-aged children to no more than
2 per 1,000 children.
186
Reduce infectious diarrhea by at least 25% among children in licensed child care centers andchildren in programs that provide an Individualized Education Program (IEP) orIndividualized Health Plan
Reduce acute middle ear infections among children aged 4 and younger, as measured by daysof restricted activity or school absenteeism, to no more than 105 days per 100 children
Reduce pneumonia-related days of restricted activity for children aged 4 and younger to 24days per 100 children
Reduce iron deficiency to less than 3% among children aged 1 through 4 and among womenof childbearing age
Reduce to no more than 20% the proportion of children aged 6 and younger who are regularlyexposed to tobacco smoke at home.
Achieve for all disadvantaged children and children with disabilities access to high qualityand developmentally appropriate preschool programs that help prepare children for school,thereby improving their prospects with regard to school performance, problem behaviors, andmental and physical health
Increase use of occupant protection systems, such as safety belts, child safety seats, etc., to atleast 95% of children aged 4 and younger who are motor vehicle occupants
Basic immunization for children under 2-90%; in day care facilities-95% Increase to at least 75% the proportion of providers of primary care for children who include
assessment of cognitive, emotional, and parent-child functioning, with appropriatecounseling, referral, and follow-up, in their clinical practices
Increase to at least 90% the proportion of all children entering school programs for the firsttime who have received an oral health screening, referral, and follow-up for necessarydiagnostic, preventative, and treatment services
Increase to at least 90% the proportion of babies aged 18 months and younger who receiverecommended primary care services at the appropriate intervals
Increase to at least 80% the proportion of providers of primary care for children whoroutinely refer or screen infants and children for impairments of vision, hearing, speech andlanguage, and assess other developmental milestones as part of well-child care.
Reduce average age at which children with significant hearing impairment are identified tono more than 12 months.
Improving financing and delivery of clinical preventative services so that virtually noAmerican has a financial barrier to receiving at a minimum, the screening, counseling, andimmunization services recommended by the U.S. Preventative Services Task Force.
[“Age-related Objectives”, Healthy People 2000, National Promotion and Disease Prevention Objectives, US Dept. of Health andHuman Services, Pub. No. (PHS) 91-50212, 1990, pp. 564-570]
GOALS FROM THE CARNEGIE FOUNDATION REPORT, MEETING THE NEEDS OFYOUNG CHILDREN
1) Promote Responsible Parenthood through:• Expanding education about parenthood in families, schools, and communities,
beginning in the elementary school years but no later than early adolescence

187
• Providing comprehensive family planning, pre-conception, prenatal, and postpartumservices and support as part of a minimum health care reform package
• Delaying adolescent pregnancy through the provision of services, counseling,support and age-appropriate life options
• Ensuring that all couples, when considering the possibility of having children, assesstheir age, health, and resources in order to avoid unnecessary risks and to providea healthy environment for raising a child
• Directing state and local funds to initiate and expand community-based parenteducation and support programs for families with infants and toddlers
2) Guarantee Quality Child Care Choices by:• Strengthening the Family and Medical Leave Act of 1993 by expanding coverage to
include employers with fewer than fifty employees, extending the twelve-weekleave to four to six months, and providing partial wage replacement
• Adopting family-friendly workplace policies such as flexible work schedules andassistance with child care
• Channeling substantial new federal funds into child care to ensure quality andaffordability for families with children under three and making the DependentCare Tax Credit refundable for low- and moderate-income families
• Providing greater federal incentives to states to adopt and monitor child carestandards of quality
• Developing community-based networks linking all child care programs andproviders offering parents a variety of child care settings
• Allocating federal and state funds to provide training opportunities so that all childcare providers have a grounding in the care and development of children underthree
• Improving salary and benefits for child care providers
3) Ensure Good Health and Protection through:• Making comprehensive primary and preventive care services, including
immunizations, available to infants and toddlers as part of a minimum benefitspackage in health care reform
• Offering home visiting services to all first-time parents with a newborn andproviding comprehensive home visiting services by trained professionals to allfamilies who are at risk for poor maternal and child health outcomes
• Expanding the Women, Infants and Children (WIC) nutritional supplementationprogram to serve all eligible women and children
• Making the reduction of unintentional injuries to infants and toddlers a nationalpriority
• Expanding proven parent education, support, and counseling programs to teachparents nonviolent conflict resolution in order to prevent child abuse and neglect,and implementing community-based programs to help families and children copewith the effects of living in unsafe and violent communities
• Enacting stringent national, state, and local laws to control possession of guns
4) Mobilize Communities to Support Young Children and Their Families by:

188
• Focusing the attention of every community in America on the needs of childrenunder three and their families, by initiating a community-based strategic planningprocess
• Experimenting broadly with the creation of family-centered communities throughtwo promising approaches: creating family and child centers to provide servicesand supports for all families; and expanding and adapting the Head Start model tomeet the needs of low-income families with infants and toddlers
• Creating a high-level federal group, directed by the President to coordinate federalagency support on behalf of young children and to remove the obstacles faced bystates and communities in their attempts to provide more effective services andsupports to families with young children
• Funding family-centered programs through the Community Enterprise Board in orderto strengthen families with infants and toddlers
• Establishing mechanisms, at the state level, to adopt comprehensive policy andprogram plans that focus on the period from before birth through the first threeyears of a child's life
From: Starting Points, Carnegie Task Force on Meeting the Needs of Our Youngest Children, Carnegie Foundation, 1994This text can be found in abridged form at the web site: http://www.carnegie.org/starting_points
NATIONAL EDUCATION GOALS
promoting coherent, nationwide, systemic education reform improving the quality of learning and teaching in the classroom and in the workplace; defining appropriate and coherent Federal, State, and local roles and responsibilities for
education reform and lifelong learning; establishing valid and reliable mechanisms for--
∗ building a broad national consensus on American education reform;∗ assisting in the development and certification of high-quality, internationally competitive
content and student performance standards;∗ assisting in the development and certification of opportunity-to-learn standards; and∗ assisting in the development and certification of high-quality assessment measures that
reflect the internationally competitive content and student performance standards; supporting new initiatives at the Federal, State, local, and school levels to provide equal
educational opportunity for all students to meet high academic and occupational skillstandards and to succeed in the world of employment and civic participation;
providing a framework for the reauthorization of all Federal education programs by--∗ creating a vision of excellence and equity that will guide all Federal education and related
programs;∗ providing for the establishment of high-quality, internationally competitive content and
student performance standards and strategies that all students will be expected toachieve;
∗ providing for the establishment of high-quality, internationally competitive opportunity-to-learn standards that all States, local educational agencies, and schools shouldachieve;

189
∗ encouraging and enabling all State educational agencies and local educational agencies todevelop comprehensive improvement plans that will provide a coherent framework forthe implementation of reauthorized Federal education and related programs in anintegrated fashion that effectively educates all children to prepare them to participatefully as workers, parents, and citizens;
∗ providing resources to help individual schools, including those serving students with highneeds, develop and implement comprehensive improvement plans
∗ promoting the use of technology to enable all students to achieve the National EducationGoals;
stimulating the development and adoption of a voluntary national system of skill standardsand certification to serve as a cornerstone of the national strategy to enhance workforceskills
assisting every elementary and secondary school that receives funds under this Act to activelyinvolve parents and families in supporting the academic work of their children at home andin providing parents with skills to advocate for their children at school.
[“Goals 2000: Educate America Act”, H.R.1804, Sec. 2 (http://thomas.loc.gov/#laws) Public Law 103-227 Goals 2000]
CARNEGIE TASKFORCE GENERAL HEALTH GOALS
Goals for Infants Under One Year
General
evaluation and support immediately after delivery complete physical exam laboratory tests to screen for genetic disease and thyroid function diagnosis of treatment of general health problems, both acute and chronic preventative procedures (Gonococcal eye infection prophylaxis, vitamin K) services of a neonatal intensive care unit, as appropriate nutritional assessment and supplementation (as needed) bonding, attachment support and extended contact with parents (including rooming-in—if
desired) linkage to continuous and comprehensive pediatric care after discharge home health services be alert for signs of abuse and neglect
Services for Children� History and systems review
medical history social setting family background genetic assessment age and developmental stage potential problems
� Complete physical exam
190
height/weighthead circumferencedevelopmental/behavioral assessmentvision and hearing evaluation
� Screening and laboratory testshemoglobin/hematocrittuberculin skin testlead poisoningparasitesscreening for sickle cell and other blood disorders
� Nutritional assessment and supplementation (as needed)ironvitamin Dfluoride
� Immunizations� Diagnosis and treatment of general health problems� Home health services
Services for Families During Infant’s First Year� Counseling and anticipatory guidance regarding
infant development and behaviormaternal nutritional needsinfant nutritional needs and feeding practiceshome and automobile accident preventioninfant stimulationa and parenting skills (including risk of abuse or neglect)immunizationshealth-damaging behavior by parents, including substance abuse and smokingcontinuous and comprehensive health carerecognition and management of illnesshygiene and first aidchild care arrangementsother relevant issues in response to parental concern
� Counseling and appropriate treatment or referral as needed for parentswho have chronic health problems which affect heir parental capacity such as
handicapping conditionssubstance-abuse problemsmental health problems (including maternal depression)
whose infant is seriously illwhose infant has a chronic illness or handicapping conditionwhose infant is or is about to be hospitalized
Health Education� Counseling and anticipatory guidance� Developing positive health habits� Using health services appropriately� Accessing community health and social services
191
Access-Related Services� Transportation as appropriate
emergencyregionalized perinatal or tertiary care networkfacilitate obtaining needed health services
� Outreach services� Hotline, translator 24-hour service� Child care services to facilitate obtaining needed health services
Children From One to Three Years
Services for Children� Periodic health assessment
History and systems reviewmedical historysocial settingfamily backgroundgenetic assessmentage and developmental stagepotential problems
Psychosocial historypeer and family relationshipschild care progress and problems
Complete physcial examinationheight/weighthead circumferencedevelopmental/behavioral assessmentvision and hearing evaluationScreening and laboratory tests
hemoglobin/hematocrittuberculin skin testlead poisoningparasitesscreening for sickle cell and other blood disorders
Nutritional assessment and supplementation (as needed)ironvitamin Dfluoride
� Immunizations� Diagnosis and treatment of general health problems� Diagnosis and treatment of mental health problems both acute and chronic
emotional disorderslearning disordersbehavioral disorderssubstance abuse
192
problems with family and peer group� Counseling and support services for children with chronic or handicapping conditions� Dental services, preventative and therapeutic� Home health services
Services for Children and their Families
� Counseling and anticipatory guidance regardingnutritional needshome and automobile accident preventionparenting skills (including risk of abuse or neglect)immunizationshealth-damaging behavior by parents, including substance abuse and smokingcontinuous and comprehensive health carephysical activity and exercisehygiene and first aidchild care arrangementsdental healthchildhood antecedents of adult illnesschild developmentenvironmental hazardsother relevant issues in response to child and parental concern
� Counseling and appropriate treatment or referral as needed for parentswho have chronic health problems which affect heir parental capacity such as
handicapping conditionssubstance-abuse problemsmental health problems (including maternal depression)
whose child is seriously illwhose child has a chronic illness or handicapping conditionwhose child is or is about to be hospitalized
Health Education
� Counseling and anticipatory guidance� Developing positive health habits� Using health services appropriately� Accessing social services and entitlements
Access-Related Services
� Transportation as appropriateemergencyregionalized or tertiary care networkfacilitate obtaining needed health services
� Outreach services� Hotline, translator 24-hour service
193
� Child care services to facilitate obtaining needed health services
From: Starting Points, Carnegie Task Force on Meeting the Needs of Our Youngest Children, Carnegie Foundation, 1994This text can be found in abridged form at the web site: http://www.carnegie.org/starting_points
State Goals
SPECIFIC INFANT TODDLER EARLY INTERVENTION PROGRAM GOALS
• Identify all infants and toddlers who are potentially eligible for services (Childfind andreferral)
• Assist families and child to gain access to 1) early intervention services (Part H) and 2) otherservices [Family Resource Coordinators (FRCs)]
• Educate families as to their rights and the procedural safeguards of the program (FRCs)• Determine initial and continuing eligibility (evaluation) (FRCs)• Identify strengths and needs on an on going basis (assessment) (FRCs)• Allow family to identify their concerns, priorities and resources (FRCs)• Develop Individualized Family Service Plans (IFSP) (FRCs)• Re-evaluate IFSPs (FRCs)• Ensure smooth transition from Early Intervention Services to Special Ed. Programs or other
services
[Source: Principles, Procedural Safeguards & Guidelines, ITEIP, DSHS, Feb.,1997]

194
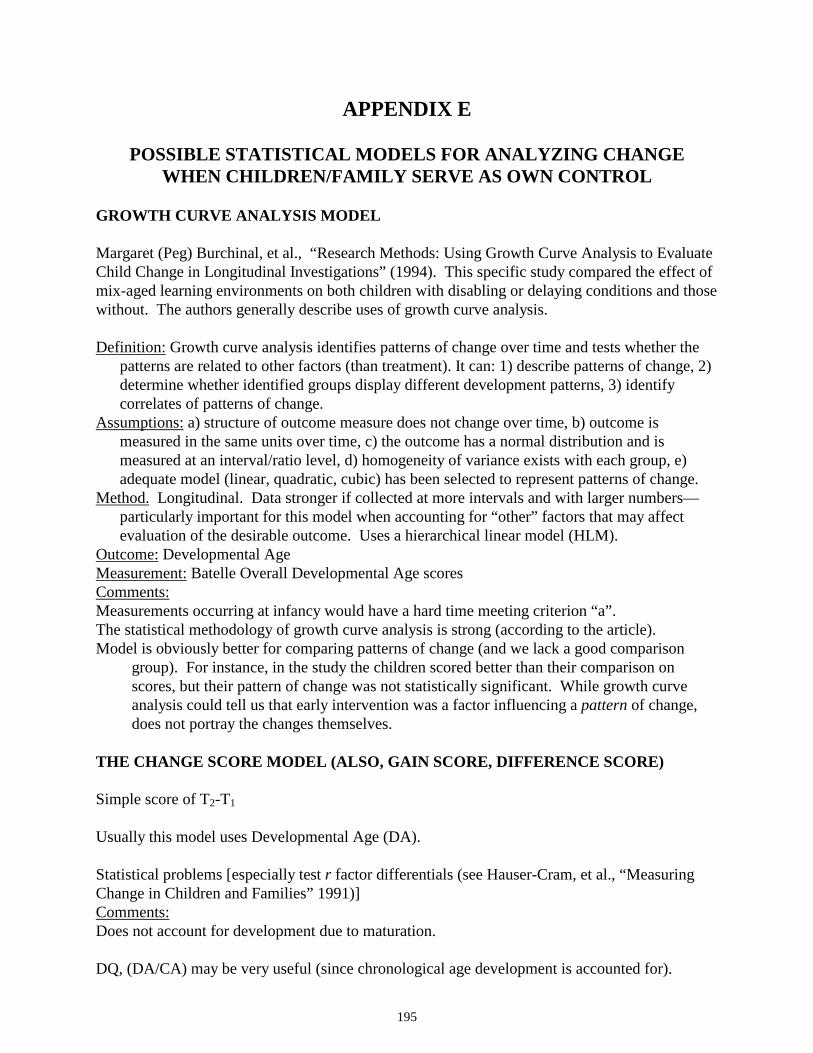
195
APPENDIX E
POSSIBLE STATISTICAL MODELS FOR ANALYZING CHANGEWHEN CHILDREN/FAMILY SERVE AS OWN CONTROL
GROWTH CURVE ANALYSIS MODEL
Margaret (Peg) Burchinal, et al., “Research Methods: Using Growth Curve Analysis to EvaluateChild Change in Longitudinal Investigations” (1994). This specific study compared the effect ofmix-aged learning environments on both children with disabling or delaying conditions and thosewithout. The authors generally describe uses of growth curve analysis.
Definition: Growth curve analysis identifies patterns of change over time and tests whether thepatterns are related to other factors (than treatment). It can: 1) describe patterns of change, 2)determine whether identified groups display different development patterns, 3) identifycorrelates of patterns of change.
Assumptions: a) structure of outcome measure does not change over time, b) outcome ismeasured in the same units over time, c) the outcome has a normal distribution and ismeasured at an interval/ratio level, d) homogeneity of variance exists with each group, e)adequate model (linear, quadratic, cubic) has been selected to represent patterns of change.
Method. Longitudinal. Data stronger if collected at more intervals and with larger numbers—particularly important for this model when accounting for “other” factors that may affectevaluation of the desirable outcome. Uses a hierarchical linear model (HLM).
Outcome: Developmental AgeMeasurement: Batelle Overall Developmental Age scoresComments:Measurements occurring at infancy would have a hard time meeting criterion “a”.The statistical methodology of growth curve analysis is strong (according to the article).Model is obviously better for comparing patterns of change (and we lack a good comparison
group). For instance, in the study the children scored better than their comparison onscores, but their pattern of change was not statistically significant. While growth curveanalysis could tell us that early intervention was a factor influencing a pattern of change,does not portray the changes themselves.
THE CHANGE SCORE MODEL (ALSO, GAIN SCORE, DIFFERENCE SCORE)
Simple score of T2-T1
Usually this model uses Developmental Age (DA).
Statistical problems [especially test r factor differentials (see Hauser-Cram, et al., “MeasuringChange in Children and Families” 1991)]Comments:Does not account for development due to maturation.
DQ, (DA/CA) may be very useful (since chronological age development is accounted for).
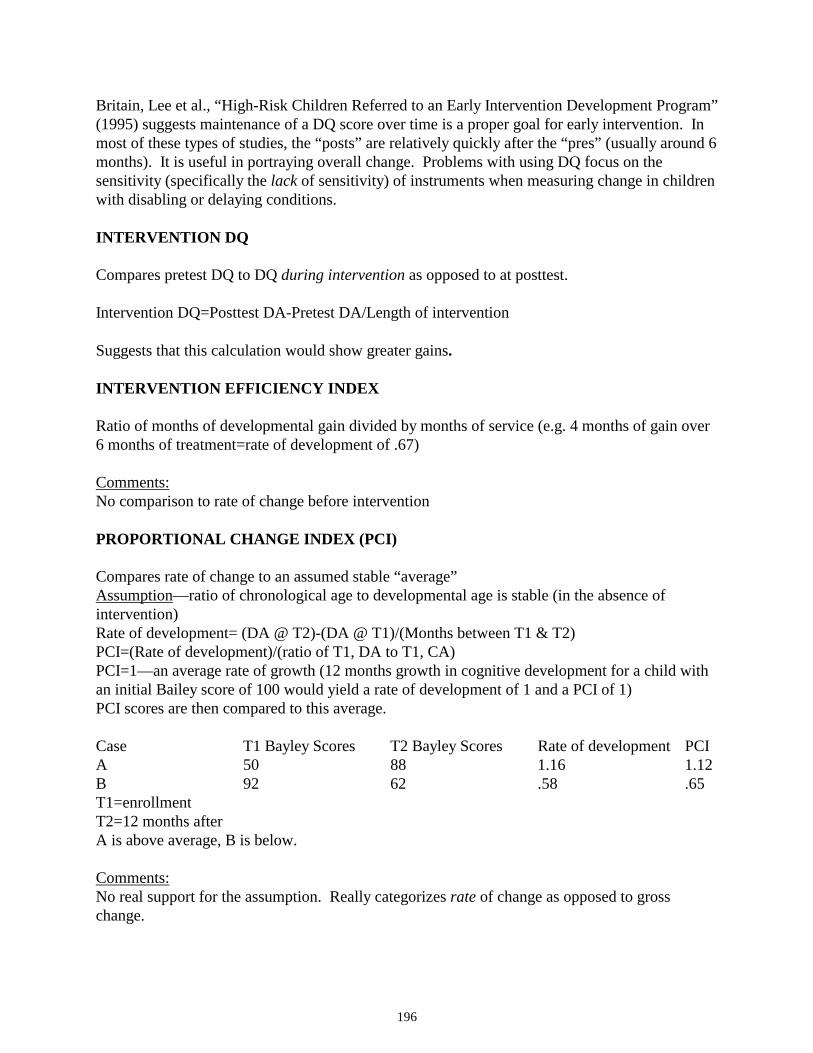
196
Britain, Lee et al., “High-Risk Children Referred to an Early Intervention Development Program”(1995) suggests maintenance of a DQ score over time is a proper goal for early intervention. Inmost of these types of studies, the “posts” are relatively quickly after the “pres” (usually around 6months). It is useful in portraying overall change. Problems with using DQ focus on thesensitivity (specifically the lack of sensitivity) of instruments when measuring change in childrenwith disabling or delaying conditions.
INTERVENTION DQ
Compares pretest DQ to DQ during intervention as opposed to at posttest.
Intervention DQ=Posttest DA-Pretest DA/Length of intervention
Suggests that this calculation would show greater gains.
INTERVENTION EFFICIENCY INDEX
Ratio of months of developmental gain divided by months of service (e.g. 4 months of gain over6 months of treatment=rate of development of .67)
Comments:No comparison to rate of change before intervention
PROPORTIONAL CHANGE INDEX (PCI)
Compares rate of change to an assumed stable “average”Assumption—ratio of chronological age to developmental age is stable (in the absence ofintervention)Rate of development= (DA @ T2)-(DA @ T1)/(Months between T1 & T2)PCI=(Rate of development)/(ratio of T1, DA to T1, CA)PCI=1—an average rate of growth (12 months growth in cognitive development for a child withan initial Bailey score of 100 would yield a rate of development of 1 and a PCI of 1)PCI scores are then compared to this average.
Case T1 Bayley Scores T2 Bayley Scores Rate of development PCIA 50 88 1.16 1.12B 92 62 .58 .65T1=enrollmentT2=12 months afterA is above average, B is below.
Comments:No real support for the assumption. Really categorizes rate of change as opposed to grosschange.
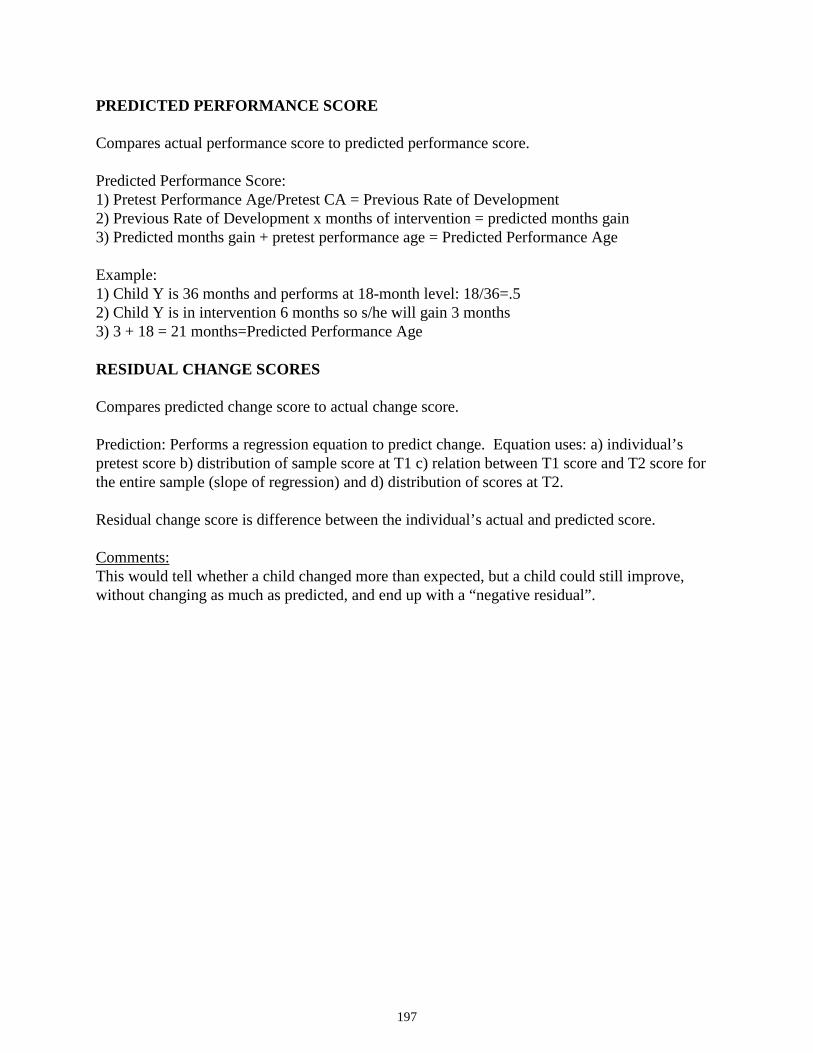
197
PREDICTED PERFORMANCE SCORE
Compares actual performance score to predicted performance score.
Predicted Performance Score:1) Pretest Performance Age/Pretest CA = Previous Rate of Development2) Previous Rate of Development x months of intervention = predicted months gain3) Predicted months gain + pretest performance age = Predicted Performance Age
Example:1) Child Y is 36 months and performs at 18-month level: 18/36=.52) Child Y is in intervention 6 months so s/he will gain 3 months3) 3 + 18 = 21 months=Predicted Performance Age
RESIDUAL CHANGE SCORES
Compares predicted change score to actual change score.
Prediction: Performs a regression equation to predict change. Equation uses: a) individual’spretest score b) distribution of sample score at T1 c) relation between T1 score and T2 score forthe entire sample (slope of regression) and d) distribution of scores at T2.
Residual change score is difference between the individual’s actual and predicted score.
Comments:This would tell whether a child changed more than expected, but a child could still improve,without changing as much as predicted, and end up with a “negative residual”.