evaluation of groundwater resources in wajid aquifer in wadi dawasir area southern saudi arabia...
TRANSCRIPT

8/7/2019 Evaluation of groundwater resources in Wajid aquifer in Wadi Dawasir area southern Saudi Arabia using computer si…
http://slidepdf.com/reader/full/evaluation-of-groundwater-resources-in-wajid-aquifer-in-wadi-dawasir-area-southern 1/164
Kingdom of Saudi Arabia
King Saud University
College of ScienceDepartment of Geology
EVALUATION OF GROUNDWATER
RESOURCES IN WAJID AQUIFER IN WADI
DAWASIR AREA SOUTHERN SAUDI ARABIA
USING COMPUTER SIMULATION
Submitted in partial fulfillment of the requirements for the Masters Degree in the Department of
Geology at the College of Science- King Saud
University
By:
Hussain .J A. Al-Faifi
November 2005

8/7/2019 Evaluation of groundwater resources in Wajid aquifer in Wadi Dawasir area southern Saudi Arabia using computer si…
http://slidepdf.com/reader/full/evaluation-of-groundwater-resources-in-wajid-aquifer-in-wadi-dawasir-area-southern 2/164
I
CONTENTS
Acknowledgements…………………………………………………….a
Abstract…………………………………………………………………c
CHAPTER I
INTRODUCTION
1.1 – LOCATION……………………………………………… 1
1.2 - PURPOSE OF THE STUDY……………………………. 3
1.3 – CLIMATE………………………………………………... 4
1.4 – PREVIOUS WORK……………………………………... 7
CHAPTER II
GEOLOGICAL SETTING
2.1 – GEOLOGICAL SETTING………………………………. 13
2.2 – WAJID FORMATION STRATIGRAPHY……………... 16
2.2.1 - DIBSIYAH MEMBER………………………………….. 16
2.2.2 - SANAMAH MEMBER…………………………………. 19
2.2.3 - KHUSAYYAN MEMBER……………………………… 20
2.2.4 - JUWAYL MEMBER…………………………………… 21
2.3 – STRUCTURE……………………………………………... 24

8/7/2019 Evaluation of groundwater resources in Wajid aquifer in Wadi Dawasir area southern Saudi Arabia using computer si…
http://slidepdf.com/reader/full/evaluation-of-groundwater-resources-in-wajid-aquifer-in-wadi-dawasir-area-southern 3/164

8/7/2019 Evaluation of groundwater resources in Wajid aquifer in Wadi Dawasir area southern Saudi Arabia using computer si…
http://slidepdf.com/reader/full/evaluation-of-groundwater-resources-in-wajid-aquifer-in-wadi-dawasir-area-southern 4/164
III
4.4.2 - WALTON’S METHOD ………………………………... 48
4.4.3 - HANTUSH’S METHOD ……………………………….. 48
4.5 - GROUNDWATER DYNAMIC…………………………... 54
4.6 - GROUNDWATER QUALITY…………………………… 59
4.6.1 - TOTAL DISSOLVED SOLIDS (TDS)………………… 594.6.2 - CALCIUM (Ca
++)……………………………………….. 62
4.6.3 - MAGNESIUM (Mg++
)…………………………………... 65
4.6.4 - SODIUM (Na+)…………………………………………... 67
4.6.5 - POTASSIUM (K -)……………………………………….. 69
4.6.6 - CHLORIDE (Cl--)……………………………………….. 69
4.6.7 - SULFATE (SO4--)……………………………………….. 71
CHAPTER V
MODFLOW RESULTS
5.1 – MODEL AREA…………………………………………… 76
5.2 - BOUNDARY CONDITIONS…………………………….. 76
5.3 - MATHEMATICAL MODEL…………………………….. 78
5.3.1 – MODEL APPROACH………………………………….. 78
5.3.2 - MODEL CODE…………………………………………. 78
5.3.3 - MODEL GRID…………………………………………... 79
5.3.4 - MODEL SETUP………………………………………… 79

8/7/2019 Evaluation of groundwater resources in Wajid aquifer in Wadi Dawasir area southern Saudi Arabia using computer si…
http://slidepdf.com/reader/full/evaluation-of-groundwater-resources-in-wajid-aquifer-in-wadi-dawasir-area-southern 5/164
IV
5.3.5 – STEADY STATE CALIBRITION……………………..
5.3.5.1 - HYDRAULIC CONDUCTIVITY…………………….
5.3.6 - TRANSIENT CONDITIONS…………………………...
82
82
82
5.3.7 - RESULTS AND PREDICTIONS IN MODEL……….. 87
CHAPTER VI
AQUACHEM RESULTS
6.1 – STATISTICS……………………………………………… 94
6.1.1 - CORRELATION COEFFICIENT…………………….. 966.1.2 - LINEAR RELATIONS…………………………………. 100
6.2- IDENTIFICATION OF GROUNDWATER
CHARACTER…………………………………………………... 104
6.2.1 - WATER TYPE IN THE STUDY AREA………………. 104
6.2.1.1 - PIPER TRILINEAR DIAGRAM……………………. 104
6.2.1.2 - DUROVE'S DIAGRAM……………………………... 105
6.3 - IDENTIFICATION OF CHEMICAL PROCESS
EFFECT OF GROUNDWATER QUALITY…………………. 108
6.3.1 - CHEMICAL WEATHERING OF SILICATE
MINERALS……………………………………………………... 108
6.3.2 - PRECIPITATION AND DISSOLUTION OF
MINERAL………………………………………………………. 112
6.3.3 - APPRAISAL OF GROUNDWATER UTILITY……… 112
6.4 - SUITABILITY OF GROUNDWATER FOR
DOMESTIC PURPOSES………………………………………. 112

8/7/2019 Evaluation of groundwater resources in Wajid aquifer in Wadi Dawasir area southern Saudi Arabia using computer si…
http://slidepdf.com/reader/full/evaluation-of-groundwater-resources-in-wajid-aquifer-in-wadi-dawasir-area-southern 6/164
V
6.4.1 - TOTAL HARDNESS (TH)……………………………... 112
6.5 – DRINK ABILITY OF GROUNDWATER……………… 118
6.6 - SUITABILITY OF GROUNDWATER FOR
AGRICULTURE ACTIVITY…………………………………. 119
6.6.1 - SODIUM ABSORPTION RATIO (SAR)……………... 122
6.6.2 - MAGNESIUM HAZARD (MH)……………………….. 127
CHAPTER VII
CONCLUSIONS AND RECOMMENDATIONS7.1 – CONCLUSIONS………………………………………….. 129
7.2 – RECOMMENDATIONS…………………………………. 131
REFERENCES………………………………………… 132
ARABIC SUMMARY…………………………………. i

8/7/2019 Evaluation of groundwater resources in Wajid aquifer in Wadi Dawasir area southern Saudi Arabia using computer si…
http://slidepdf.com/reader/full/evaluation-of-groundwater-resources-in-wajid-aquifer-in-wadi-dawasir-area-southern 7/164
VI
LIST OF FIGURES
Figure
No.
Titles Pages
No.
1 - 1 General location map of studied area in Wadi Dawasir. 2
1 - 2 Satellite Image of Wadi Dawasir Area. 5
1 - 3 Satellite image of clouds above Saudi Arabia. 8
2 - 1 Geological map of Wadi Dwasir area. 15
2 - 2 Summarizing the stratigraphic succession of the Wajid Sandstone in the
region. 17
2 - 3 Modified structural sketch of the southern Najd. 25
3 - 1 Collecting and checking samples. 30
3 - 2 Determination of water level by device. 31
4 - 1 Wajid Aquifer extent. 43
4 - 2 Wajid outcrop. 44
4 - 3 Pumping test curve using Theis Method. 51
4 - 4 Pumping test using Walton’s Method. 52
4 - 5 Pumping test using Hantush Method. 53
4 - 6 Water level in the Wajid Aquifer in Wadi Dawasir. 56
4 - 7 Present groundwater level in the study area. 58
4 - 8 Sites of sampling.
614 - 9 Concentration of TDS in the study area (mg/l). 64
4 - 10 Concentration of calcium ion in the stuy area (mg/l). 66
4 - 11 Concentration of Magnesium in the study area (mg/l). 68
4 - 12 Cocentration of Sodium in the study area (mg/l). 70
4 - 13 Concentration of potassium of the study area (mg/l). 72

8/7/2019 Evaluation of groundwater resources in Wajid aquifer in Wadi Dawasir area southern Saudi Arabia using computer si…
http://slidepdf.com/reader/full/evaluation-of-groundwater-resources-in-wajid-aquifer-in-wadi-dawasir-area-southern 8/164
VII
4 - 14 Concentration of chlore of the study area (mg/l). 73
4 - 15 Concentration of sulfate ion in the study area (mg/l). 75
5 - 1 Modified map show the extent of the modeled area and grid used for
modeling (x = y =100; total = 10000). 77
5 - 2 Elevation of top part of the Wajid Aquifer in meter above sea level. 80
5 - 3 Elevation of the bottom part of the Wajid Aquifer in meter above sea
level. 81
5 - 4 Values of hydraulic conductivity in the Wajid Aquifer. 83
5 - 5 Distribution of hydraulic conductivities in the calibration procedure in
the Wajid Aquifer. 84
5 - 6 Distribution of calibrated water level in Wajid Aquifer in Wadi Dawasir
Area. 85
5 - 7 Recharge in the modeled outcrop of the Wajid Aquifer found in the
calibration procedure. 86
5 - 8 Initial head distribution for transient simulation (calibrated inetial head).
88
5 - 9 Simulated head distribution in meter above mean sea level after 20years
of pumping from the Aquifer (m3/day). 90
5 - 10 Simulated drawdown distribution in meter after 40 years of pumping
from the aquifer (m3/day). 92
5 - 11 Simulated drawdown distribution in meter after 60 years of pumping
from the aquifer (m3/day). 93
6 - 1 Distribution of major ions concentration in Wajid Aquifer . 101
6 - 2 Distribution of TDS & EC of the wells in the study area. 101
6 - 3 Relation between Ca and HCO3. 102
6 - 4 Relation between Cl & Na. 102
6 - 5 Relationship between major Ions and TDS (meq/l). 103

8/7/2019 Evaluation of groundwater resources in Wajid aquifer in Wadi Dawasir area southern Saudi Arabia using computer si…
http://slidepdf.com/reader/full/evaluation-of-groundwater-resources-in-wajid-aquifer-in-wadi-dawasir-area-southern 9/164
VIII
6 - 6 Piper diagram of major ions in the study area. 106
6 - 7 Water type using Durove Diagram in the study area. 107
6 - 8 Water types in the study area according the Durove plot. 110
6 - 9 Saturation index of minerals. 114
6 - 10 Concentration of TH of the groundwater in the study area. 117
6 - 11 Concentration of sodium adsorption ratio (SAR) of groundwater in the
study area. 124
6 - 12 Classification of water on the basis of sodium absorption and electrical
conductivity on the study area. 126
6 - 13 Concentration of magnesium hazard of the groundwater in the study
area. 128

8/7/2019 Evaluation of groundwater resources in Wajid aquifer in Wadi Dawasir area southern Saudi Arabia using computer si…
http://slidepdf.com/reader/full/evaluation-of-groundwater-resources-in-wajid-aquifer-in-wadi-dawasir-area-southern 10/164

8/7/2019 Evaluation of groundwater resources in Wajid aquifer in Wadi Dawasir area southern Saudi Arabia using computer si…
http://slidepdf.com/reader/full/evaluation-of-groundwater-resources-in-wajid-aquifer-in-wadi-dawasir-area-southern 11/164
a
ACKNOWLEDGMENT
I wish to express his deepest gratitude to Dr. A.M.AL-BASSAM,
Associate Prof. Of Hydrogeology, Vice Dean of College of Science, King
Saud University, for his kind help, significant comments, critical review of
the thesis and continuous support throughout the term of this work..
The author is forever indebted to Dr. M.T.HUSSEIN, Geology
Department, College of Science, King Saud University, for his tremendous
efforts, continuous support, professional advises and invaluable guidance
throughout various steps of this work, especially the critical review of the
manuscript.
The efforts of the Dr. M.N.EL-SABROUTY, Geology Department,
College of Science, King Saud University, are deeply appreciated as he was
the man who pushed the registration of this thesis, was a kind man and a
good friend (may ALLAH bless him… …Amen).
To authorities of the Geology Department, College of Science, King
Saud University, especially the head of Department Dr. N.S.AL-ARIFI,
and Mr. H.S.AWAD, Mr. M.S.AL-YOUSSEF and all members of
Department, the author is very much grateful for hosting this work and
making necessary facilities ready.
Another word of gratitude is due to Mr. A.AL-HUMYEN, Mr. H.AL-
NAKHLY, Mr.H.F. AL-AJMI, Ministry of water and electricity, for them

8/7/2019 Evaluation of groundwater resources in Wajid aquifer in Wadi Dawasir area southern Saudi Arabia using computer si…
http://slidepdf.com/reader/full/evaluation-of-groundwater-resources-in-wajid-aquifer-in-wadi-dawasir-area-southern 12/164
b
invaluable help in the field work, continuous encouragement and fruitful
discussions.
So many words of thanks are due to all examination members especially
Prof. A.S.AL-TORBAK, College of engineering, Department of civil
engineering, and Dr. A.M.AL-DAKHIL, Geology Department, College of
Science, King Saud University, for successfully discussions, and important
remarks.
Last, but not least, I wish to express my deepest gratitude to my mother,
my brothers, my wife and my sons for their help, continuous
encouragement and support. Without their feelings, this work would have
never been completed.

8/7/2019 Evaluation of groundwater resources in Wajid aquifer in Wadi Dawasir area southern Saudi Arabia using computer si…
http://slidepdf.com/reader/full/evaluation-of-groundwater-resources-in-wajid-aquifer-in-wadi-dawasir-area-southern 13/164
8/7/2019 Evaluation of groundwater resources in Wajid aquifer in Wadi Dawasir area southern Saudi Arabia using computer si…
http://slidepdf.com/reader/full/evaluation-of-groundwater-resources-in-wajid-aquifer-in-wadi-dawasir-area-southern 14/164
d
Hantush methods. The average transmissivity of the three methods is 252.8
m
2
/day, the average hydraulic conductivity is 0.421 m/day and the average
storage coefficient is 0.0035. The regional value of the specific yield is about
21%. At present time Wajid Aquifer is under stress and the aquifer is in a non
equilibrium state. The discharge is much greater than the groundwater
recharge and the total change in storage is negative. Because of this, the Heads
declined from about 700 m to 550 above sea level (a.s.l). Groundwater flows
towards the northeast and Wadi Dawasir is the main discharge area of the
aquifer. Most of the groundwater stored in Wajid Aquifer is fossil water – non
renewable groundwater. Average recharge rate is about 15mm/year.
This area lies within the Orbit-hot desert range where temperature rises
with low rate of precipitation and high rate of evaporation. There is a high
exploitation of water from the Wajid Aquifer with a limited recharge in the
outcrop area.
In this study, Visual Modflow was selected within the model area. The
model grid consists of 100 columns and 100 rows. A finite difference grid
distance in each directions x and y equal 94.350 km., covering an area 8092
km2. The model contains only one layer which represents the Wajid Aquifer
confined and unconfined.

8/7/2019 Evaluation of groundwater resources in Wajid aquifer in Wadi Dawasir area southern Saudi Arabia using computer si…
http://slidepdf.com/reader/full/evaluation-of-groundwater-resources-in-wajid-aquifer-in-wadi-dawasir-area-southern 15/164
e
For the steady and transient simulation conductivity and storage
coefficient from confined to unconfined conditions where considered by using
distribution, the discharge assumed from 51 wells (Q = 1800 USG/min =
9816.5 m3/day), then the model was calibrated under steady state and transient
conditions. From the initial condition of water level, scenarios that made on
the model show that the drawdown will be 43 m below the ground surface
after 20 years of pumping from wills, 96 m after 40 years and 141 m after 60
years.
The present study also includes chemical analyses of 20 water samples
taking from twenty wells tapping the aquifer in the studied area. The
groundwater in this area is classified into three hydrochemical facies; type (2)
that’s HCO3-
dominant and eight Mg2+
dominant or cations indiscriminant,
with Mg2+
dominant or Ca2+
and Mg2+
important, indicates water often
associated with dolomites; where Ca2+
and Na+
are important partial ion
exchange may be indicated, type (5) no dominant cation or anion, indicates
water exhibiting simple dissolution or mixing, type (8) Cl-
dominant and no
dominant cation indicates that the groundwater may be related to reveres ion
exchange of Na+-Cl
-water.

8/7/2019 Evaluation of groundwater resources in Wajid aquifer in Wadi Dawasir area southern Saudi Arabia using computer si…
http://slidepdf.com/reader/full/evaluation-of-groundwater-resources-in-wajid-aquifer-in-wadi-dawasir-area-southern 16/164
f
Then determined the hydro-chemical processes that caused the
variation in the groundwater quality and also suitability of groundwater for
domestic purposes and agriculture in the study area.

8/7/2019 Evaluation of groundwater resources in Wajid aquifer in Wadi Dawasir area southern Saudi Arabia using computer si…
http://slidepdf.com/reader/full/evaluation-of-groundwater-resources-in-wajid-aquifer-in-wadi-dawasir-area-southern 17/164
CHAPTER I
INTRODUCTION

8/7/2019 Evaluation of groundwater resources in Wajid aquifer in Wadi Dawasir area southern Saudi Arabia using computer si…
http://slidepdf.com/reader/full/evaluation-of-groundwater-resources-in-wajid-aquifer-in-wadi-dawasir-area-southern 18/164
1
CHAPTER I
INTRODUCTION
1.1 - LOCATION:
The study area is entirely located within Wadi Dawasir. It is located
between latitudes 19o30
/00
//N, 21
o00
/00
//N and longitudes 44
o00
/00
//E,
46o30
/00
//E some 650 km south Riyadh (Fig 1-1). The largest towns in the
study area are Al-Sulayyel, Al-Nuwayma, Al-Khamasin and Ledam.
Wajid Aquifer is the most important aquifer in the southern part of
Saudi Arabia. It is supplying Wadi Dawasir and vicinity areas with a fresh
water for drinking and agriculture.
The mean objective of the groundwater modeling of this study is to
predict the groundwater direction, drawdown, respectively the development of
groundwater heads, caused by pumping from the wells for the next 60 years of
pumping, and to predict of the future drawdown position and the assessment
of the groundwater resources a mathematical groundwater flow model was
developed, then analyze samples taken from the pumping wells that for known
their properties and suitable for drinking and irrigation in agriculture or other
purposes.

8/7/2019 Evaluation of groundwater resources in Wajid aquifer in Wadi Dawasir area southern Saudi Arabia using computer si…
http://slidepdf.com/reader/full/evaluation-of-groundwater-resources-in-wajid-aquifer-in-wadi-dawasir-area-southern 19/164
2
Fig. (1-1): General location map of studied area in Wadi Dawasir.

8/7/2019 Evaluation of groundwater resources in Wajid aquifer in Wadi Dawasir area southern Saudi Arabia using computer si…
http://slidepdf.com/reader/full/evaluation-of-groundwater-resources-in-wajid-aquifer-in-wadi-dawasir-area-southern 20/164
3
1.2 - PURPOSE OF THE STUDY:
Wadi Dawasir is one of huge agricultural areas in the kingdom of
central province of Saudi Arabia (Fig. 1-2). Wajid Aquifer is the most
important aquifer in Wadi Dawasir. The main objective of this study is to
evaluate the groundwater resources in Wadi Dawasir quantitatively and
qualitatively. It is supplying Wadi Dawasir and vicinity areas with afresh
water for drinking and irrigation water for agriculture.
The present study is also intended to predict the future conditions of
these resources under present and future management plans. The following
points will help to achieve the above mentioned objectives:
1- Preparation of well location map using Garmen 12 Global Positioning
System (GPS).
2- Realization of complete well inventory in the study area. The inventory
includes, groundwater depths, levels, well diameter, well depth, in-situ
measurement of water temperature, pH, Electrical conductivity
(EC)…etc.
3- Collection of water samples for major ionic composition.
4- Laboratory analysis of water samples.
5- Construction of water level contour map to predict groundwater movement.

8/7/2019 Evaluation of groundwater resources in Wajid aquifer in Wadi Dawasir area southern Saudi Arabia using computer si…
http://slidepdf.com/reader/full/evaluation-of-groundwater-resources-in-wajid-aquifer-in-wadi-dawasir-area-southern 21/164
4
6- Determination of aquifer properties permeability (K), storage coefficient
(S) and aquifer extension. Aquifer tests and geophysical electrical
methods are to be applied.
7- All these field and measurement data will be used for the construction of
modflow and aquachem models to predict the future scenario.
The main objective of the groundwater modeling of this study is to
predict the groundwater direction, drawdown, respectively the development of
groundwater heads, caused by pumping from the wells for the next 60 years of
pumping, and to predict of the future drawdown position and the assessment
of the groundwater resources a mathematical groundwater flow model was
developed, then analyze samples taken from the pumping wells that for known
their properties and suitable for drinking and irrigation in agriculture or other
purposes
Wajid Aquifer is the most important aquifer in the southern part of Saudi
Arabia.
1.3 – CLIMATE:
The importance of Wadi Dawasir area, it is consider one of the biggest
agricultural areas in the Kingdom of Saudi Arabia (Fig. 1-3). The climate in
study area is depend on several parameters like:

8/7/2019 Evaluation of groundwater resources in Wajid aquifer in Wadi Dawasir area southern Saudi Arabia using computer si…
http://slidepdf.com/reader/full/evaluation-of-groundwater-resources-in-wajid-aquifer-in-wadi-dawasir-area-southern 22/164
5
Fig. (1-2): Satellite Image of Wadi Dawasir Area

8/7/2019 Evaluation of groundwater resources in Wajid aquifer in Wadi Dawasir area southern Saudi Arabia using computer si…
http://slidepdf.com/reader/full/evaluation-of-groundwater-resources-in-wajid-aquifer-in-wadi-dawasir-area-southern 23/164
6
A - Temperature:
Annual average temperature is about 29
o
C. Maximum average
temperature is 43oC. Minimum average temperature is 6
oC. Mean average
temperature during summer is about 35oC. June is the hottest during the year.
During winter mean average temperature is about 25oC.
B - Relative humidity:
Annual average relative humidity is about 24%. It is probably more
than 70% during winter. Decrease of relative humidity occurs during summer.
C - Winds:
The wind direction is mostly eastward. This could be a dangerous factor
if wind is strong enough to carry Rub Al-Khaly sand dune eastern of the area.
The mean average of wind velocity is 7 knots/h (=13km/h). The maximum
velocity could reach 25 knots/h still not threatening building and farms.
D - Solar radiation:
The Sky is clear most of the year. Sunrise duration average at Wadi
Dwasir is about 11 hours daily.
E - Rainfall:
Rainfall is essential in agricultural development planning. Rainfall
average is 37.6 mm/year. Maximum rainfall was registered in March, which
indicate Mediterranean storm affect on winter rainfall.

8/7/2019 Evaluation of groundwater resources in Wajid aquifer in Wadi Dawasir area southern Saudi Arabia using computer si…
http://slidepdf.com/reader/full/evaluation-of-groundwater-resources-in-wajid-aquifer-in-wadi-dawasir-area-southern 24/164
7
1.4 – PREVIOUS WORK :
Previous work in Saudi Arabia on Wajid Sandstone comprise many
articles. Detailed description of the fluvial environment of the southern part of
Wajid Sandstone was presented by:
Dabbagh (1981) studied the environmental interpretation and tectonic
significance of Wajid Sandstone southwestern part of Saudi Arabia. Fining
upward sequence with channel systems and unimodal paleo-current trends
suggest a fluvial environment in southern outcrops. Littoral trace fossils in
more lithologically and structurally homogenous units in the north suggest a
shallow marine environment. Paleocurrents analysis based on cross-bed
measurements, indicate a unimodal northwesterly and northerly paleocurrent
trend pointing toward the Arabian Shield in the south and a unimodal
northeasterly trend in the north. The Wajid Sandstone has been deposited in a
platform-type basin in an area now occupied just after the cratonization of the
Arabian Shield in Late Precambrian and Early Paleozoic.
Dabbagh and Rogers (1983) studied the depositional environments and
tectonic significance of the Wajid Sandstone of southern Saudi Arabia.

8/7/2019 Evaluation of groundwater resources in Wajid aquifer in Wadi Dawasir area southern Saudi Arabia using computer si…
http://slidepdf.com/reader/full/evaluation-of-groundwater-resources-in-wajid-aquifer-in-wadi-dawasir-area-southern 25/164
8
Fig. (1-3): Satellite image of clouds above Saudi Arabia

8/7/2019 Evaluation of groundwater resources in Wajid aquifer in Wadi Dawasir area southern Saudi Arabia using computer si…
http://slidepdf.com/reader/full/evaluation-of-groundwater-resources-in-wajid-aquifer-in-wadi-dawasir-area-southern 26/164
9
The southern part of the formation consists of fluvial sandstone and
very minor siltstone and silty shale. The fluvial origin is very well
demonstrated. The northern part of the outcrop area consists of internally
homogeneous, tabular cross-bedded horizontally bedded sandstone apparently
formed in a shallow marine environment. Abundant cross bedding in both
facies of the Wajid Sandstone indicates a northward transport direction,
towards what is now the center of the Arabian Shield. The conversion from
basin to uplifted source may indicate a prolonged process of shield maturation
after initial stabilization.
Moshrif (1989) made a study with the help of applied technique
including vertical variation in grain size parameters, grain size distribution
curves, multivariation grain size parameter plots and the linear discriminate
function tests, he suggested that the southern part of Wajid Sandstone was
dominantly deposited in a fluvial environment. In addition, the sampled
outcrops can be characterized as negatively skewed, moderately to poorly
sorted, relatively coarse and are thus more likely to be fluvial, rather than
beach or eolian.
Moshrif and El-Hitti (1989) described six lithofacies in the Wajid
Sandstone. These lithofacies are identified as: silty and argillaceous sandstone,
fine-grained sandstone, coarse grained sandstone; conglomerate and massive

8/7/2019 Evaluation of groundwater resources in Wajid aquifer in Wadi Dawasir area southern Saudi Arabia using computer si…
http://slidepdf.com/reader/full/evaluation-of-groundwater-resources-in-wajid-aquifer-in-wadi-dawasir-area-southern 27/164
10
sandstone. Mineralogic composition suggests that the Wajid Sandstone is
considered clean sands for it consists 95% of quartz grains 5% heavy
minerals, mica, potash feldspar, clay matrix, ferruginous cement. In addition,
spectroscopic analysis reveals the presence of Si, Mg and Ca elements as
major constituents in the Wajid Sandstone.
Stump and van der Eem (1994) studied the Wajid Formation belt in
southwestern Saudi Arabia. They proved that the Paleozoic sediments are
represented by the Wajid Formation. The Early Devonian to Middle
Carboniferous Khusayyan Member, Wajid Formation unconformably overlies
the Qusaiba Member and was deposited in shallow marine, lagoon, eolian and
fluvial-deltaic settings. Major periods of uplift and subsequent erosion
produced the members of the Wajid Formation.
Pertaining Hydrogeology, Italconsult (1969) made a report about
water agriculture development in Wadi Dawasir. Their study includes the
geological setting, groundwater movement, recharge, groundwater
temperature, groundwater salinity and aquifer characteristics. They prepared
maps for water level and flow lines. The occurrence of about 100 meter
thickness of alluvial materials along Wadi Dawasir overlies the Khuff and
Sudair Formations, and comprises the alluvial aquifer. The main apparent
recharge to this system appears to be upward leakage from the Wajid and

8/7/2019 Evaluation of groundwater resources in Wajid aquifer in Wadi Dawasir area southern Saudi Arabia using computer si…
http://slidepdf.com/reader/full/evaluation-of-groundwater-resources-in-wajid-aquifer-in-wadi-dawasir-area-southern 28/164
11
Khuff Formations along the faulted and fractured zone. Much of the water in
the alluvial system is subsequently lost via evapotranspiration. The
construction of an piezometric map of the Wajid Aquifer from the well
exploration programs reveals several interesting and perplexing
hydrogeological features. The occurrence of the depression, cone appears to
be associated with the major wrench fault and indicates upward leakage along
this pressure relief zone. The water levels in the alluvial deposits corroborate
the upward leakage and there ft good correlation of the chemical quality of
water indicating, a source from the Wajid Sandstone. The northeastern
elongation of the depression cone indicates this configuration is controlled by
several geological features:
The western limit of the Wajid Sandstone on the north side of the fault.
The possible occurrence of tensional faults in the Wajid Sandstone. It has a
high transmissivity (up to 2 x 10⁻²
m2/sec) and a storage coefficient of 3 x 10
-3.
However, it was not evident that the above mentioned geological features
were reflected in the data.
Thickness of the Wajid sandstone is increasing as compared to a
thickness of 380 meters north of the fault.Wajid Formation extends westward
for a distance of more than 70 km, thus forming a vast reservoir.

8/7/2019 Evaluation of groundwater resources in Wajid aquifer in Wadi Dawasir area southern Saudi Arabia using computer si…
http://slidepdf.com/reader/full/evaluation-of-groundwater-resources-in-wajid-aquifer-in-wadi-dawasir-area-southern 29/164

8/7/2019 Evaluation of groundwater resources in Wajid aquifer in Wadi Dawasir area southern Saudi Arabia using computer si…
http://slidepdf.com/reader/full/evaluation-of-groundwater-resources-in-wajid-aquifer-in-wadi-dawasir-area-southern 30/164
CHAPTER II
GEOLOGICAL SETTING

8/7/2019 Evaluation of groundwater resources in Wajid aquifer in Wadi Dawasir area southern Saudi Arabia using computer si…
http://slidepdf.com/reader/full/evaluation-of-groundwater-resources-in-wajid-aquifer-in-wadi-dawasir-area-southern 31/164
13
CHAPTER II
GEOLOGICAL SETTING
2.1 – GEOLOGICAL SETTING:
The study area is found within the Wadi Tathlith quadrangle, which is
bounded by latitudes 19o30
/00
//N, 21
o00
/00
//N and longitudes 44
o00
/00
//E,
46o30
/00
//E (Fig. 2-1). It covers a surface area 8902 km
2of the southern Najd
province of Saudi Arabia. About two thirds of the quadrangle are underlain by
basement rocks of the Arabian Shield, much of it comprises an almost flat
pediment surface. The remaining third of the Wadi Tathlith quadrangle is in
the southwest is underlain by almost horizontally bedded Phanerozoic
sedimentary rocks. An agglomeration of villages including Al Khamasin, Al
Quwayz and Nuaimah lies at the edge of Irq al Wadi and is loosely known as
Wadi Dwasir. These villages, centered on an area of extensive agriculture
using ground water from the aquifers, contain about more than 50,000
inhabitants and lies on a major road between Riyadh, some 650 km away to
the north-northeast, and Tathlith to the southwest.
The oldest rocks of the southeastern Arabian Shield are interpreted to
have been formed in an 800-700-Ma-oldensimatic island arc (Schmidt et al.
1979; Greenwood et al. 1980, 1982). These rocks comprise a highly
deformed and metamorphosed succession of dominantly andesitic

8/7/2019 Evaluation of groundwater resources in Wajid aquifer in Wadi Dawasir area southern Saudi Arabia using computer si…
http://slidepdf.com/reader/full/evaluation-of-groundwater-resources-in-wajid-aquifer-in-wadi-dawasir-area-southern 32/164
14
metavolcanic rocks and interbedded volcaniclastic metasedimentary rocks (the
Halaban Group). The Halaban Group is intruded by nearly coeval sequence of
gabbro,diorite, tonalite, and culminant orogeny and resulted in the deposition
of a thick clastic and subordinate volcanic and carbonate succession upon the
older deformed rocks. This succession is interpreted by Hadley and Schmidt
(1980) to be a molasse-carbonate sequence and is correlated with the
Murdama group (Hadley, 1976; Kellogg, 1982a,b; Schmidt, 1981a; Brock,
1983) that crops out extensively in the central and northern parts of the shield
(Jackson et al. 1963) and that includes the Bani Ghayy group of the Wadi
Tathlith quadrangle. Voluminous and mostly undeformed postorogenic
intrusive rocks that either predated or intruded the Murdama group consist
predominantly of monzogranite, but include minor gabbro and alkali
granite. Metamorphic aureoles with grades up to biotite hornfels are
associated with these intrusive rocks. The smaller stocks tend to be circular or
elliptical in plan view. The southernmost of three major Najd fault zones,
striking northwestward across the Arabian shield and of latest Proterozoic or
Early Cambrian age, bisects the Wadi Tathlith quadrangle. Left-lateral
faulting along the Najd fault, and associated diapiric rise of gneiss antiforms
and small granitic intrusions along the zone marks the last

8/7/2019 Evaluation of groundwater resources in Wajid aquifer in Wadi Dawasir area southern Saudi Arabia using computer si…
http://slidepdf.com/reader/full/evaluation-of-groundwater-resources-in-wajid-aquifer-in-wadi-dawasir-area-southern 33/164
15
Fig. (2-1): Geological map of Wadi Dwasir area

8/7/2019 Evaluation of groundwater resources in Wajid aquifer in Wadi Dawasir area southern Saudi Arabia using computer si…
http://slidepdf.com/reader/full/evaluation-of-groundwater-resources-in-wajid-aquifer-in-wadi-dawasir-area-southern 34/164
16
major structural or plutonic event before the region was planed to a nearly flat
erosional surface. Platform sedimentation began during the Cambrian and
continued into the Ordovician with deposition of the Wajid Sandstone.
Subsidence during the Permian gave rise to the deposition of platform
carbonate sediments (Khuff Formation) under relatively calm conditions.
The Phanerozoic rocks lie unconformably on the Proterozoic of the
Arabian Shield. The contact, nowhere clearly exposed in the Wadi Tathlith
quadrangle, is commonly concealed by debris from the poorly consolidated
basal conglomerate of the Wajid Sandstone. Rough topography of the
Proterozoic rocks is preserved locally, as for example at Jabal Musayqirah
where Proterozoic marble is surrounded by the lower beds of the Wajid
Sandstone.
2.2 – WAJID FORMATION STRATIGRAPHY:
Wajid Formation is divided into four members from bottom to top (Fig.
2-2):
2.2.1 - DIBSIYAH MEMBER:
The Dibsiyah Member is 145 meters thick at its reference section on the
west flank of Jabal Dibsiyah latitute 200
12/40
//N and longitude 44
012
/00
//E.

8/7/2019 Evaluation of groundwater resources in Wajid aquifer in Wadi Dawasir area southern Saudi Arabia using computer si…
http://slidepdf.com/reader/full/evaluation-of-groundwater-resources-in-wajid-aquifer-in-wadi-dawasir-area-southern 35/164
17
Fig. (2-2): Summarizing the stratigraphic succession of the Wajid Sandstone in the
region.
8/7/2019 Evaluation of groundwater resources in Wajid aquifer in Wadi Dawasir area southern Saudi Arabia using computer si…
http://slidepdf.com/reader/full/evaluation-of-groundwater-resources-in-wajid-aquifer-in-wadi-dawasir-area-southern 36/164
18
The lower of the member, very poorly exposed on a pediment that is partly
covered by fluvial gravel and other detritus, begins with a poorly sorted basal
conglomerate of uncertain thickness composed largely of fragments of milky
quartz as much as 8 cm across. The remainder of the succession is composed of
very poorly sorted sandstone that, except for some layers with a siliceous and
ferruginous matrix, is fairly friable.
Conglomerate or microconglomeratic beds, with a clast size of generally
smaller than 2 cm, are present particularly in the lower third of the member. The
member is well stratified with beds ranging in thickness from a bout 10 cm to 15
cm; in places they display cross-bedding or inclined sets of diverse orientation.
The member as whole, except for the basal beds, shown abundant evidence of
bioturbation, the most common being tigillites (Scolithus pro syn.), which are
vertical tubular structures that probably present worm trails and range in diameter
from 5 to 20 mm and in length from 15 to 50 cm. The distribution of the tigillites
appears to depend on the grain size and stratonomic features of the rock; they are
most abundant in the massive sandstone beds and in fine-grained sandy layers,
are spares in beds with cross stratification or inclined sets, and are absent from
the coarsest grained layers. Trace fossils of unilobate, contorted, vermiform, and
irregular shapes occur on some bedding surfaces. Petrographic examination
shows the rocks to be poorly sorted and composed almost entirely of quartz. The

8/7/2019 Evaluation of groundwater resources in Wajid aquifer in Wadi Dawasir area southern Saudi Arabia using computer si…
http://slidepdf.com/reader/full/evaluation-of-groundwater-resources-in-wajid-aquifer-in-wadi-dawasir-area-southern 37/164
19
original clayey-ferruginous matrix is commonly replaced by a siliceous, clayey,
and calcite matrix.
The Dibsiyah Member is overlain by the Sanamah Member, or by Khusayyan
Member in place where the Sanamah Member is missing. The contact with the
Sanamah Member is distinct and the contact surface appears to by very irregular,
showing that intense erosion preceded deposition of the Sanamah Member. The
residual thickness of the Dibsiyah Member thus varies considerably from one
place to another.
2.2.2 - SANAMAH MEMBER:
The Sanamah Member, whose reference section is on an outlier of Jabal
Sanamah (lat 200
12/
25//
N., long 44014
/55
//E.) is 55 meter thick and rests on
tigillite-bearing sandstone of the Dibsiyah Member. The lower 20m consist of a
basal conglomerate, containing rounded quartz fragments as much as 5 cm in
size, overlain by massive coarse-grained conglomeratic sandstone that has eroded
to bold outcrops. Several rough joints are visible in detail and are associated with
intraformational channel surfaces marked by conglomeratic intervals. Several
sandstone beds, higher in the member and about 0.5 m thick, are overlain by
layers of irregularly bedded, pink to yellowish sandstone that, in places, contains
marble-size poikilitic calcite crystals. These beds are in turn overlain by
alternating beds of medium to fine-grained sandstone and red or white,

8/7/2019 Evaluation of groundwater resources in Wajid aquifer in Wadi Dawasir area southern Saudi Arabia using computer si…
http://slidepdf.com/reader/full/evaluation-of-groundwater-resources-in-wajid-aquifer-in-wadi-dawasir-area-southern 38/164
20
micaceous, fine grained sandstone. The rocks are all poorly sorted and composed
of quartz and feldspar (predominantly microcline with rare plagioclase). The
matrix is in places ferruginous and in places is composed of poikilitic calcite.
The Sanamah Member is laterally discontinuous sedimentary body and
commonly wedges out between the Dibsiyah and Khusayyan Members. It thus
varies considerably in thickness, attaining a maximum of 140 m in some places.
The sedimentologic characteristics of the Sanamah Member also vary; for
instance, at Jibal al Qahr the member appears to be distinctly bedded and meter-
scale slump structures are developed in some layers.
2.2.3 - KHUSAYYAN MEMBER:
The Khusayyan Member, with a thickness of about 200 meters, is the thickset
of the four member of the Wajid Sandstone. It is nowhere exposed in its entirety
and the reference section is made up of partial sections on the western flank of an
outlier of Jibal al Qahr latitude 200
02/25
//, 20
015
/00
//N, longitude 44
012
/05
//,
44040
/00
//E.
The Khusayyan Member is remarkably homogeneous, generally beginning
with a thin conglomeratic layer. It consist of white, medium to coarse-grained
sandstone that weathers to pale brown, with regular beds ranging in thickness
from 20 cm to 30 m and normally displaying cross-stratification inclined at 100
to
300
to the bedding. The cross-bedded layers strike predominantly northwest to

8/7/2019 Evaluation of groundwater resources in Wajid aquifer in Wadi Dawasir area southern Saudi Arabia using computer si…
http://slidepdf.com/reader/full/evaluation-of-groundwater-resources-in-wajid-aquifer-in-wadi-dawasir-area-southern 39/164
21
north-northwest and the bases commonly contain microconglomeratic streaks. In
places the sandstone contains of red and white, micaceous, fine-grained
sandstone. Cross-bedding toward the top of the member at Jabal Khusayyan
appears as imbricate festoons, the cores of which are composed of red platy
pelite.
In thin section, the sandstone shows mostly poorly sorted detrital quartz grains
together with rare muscovite. The matrix is clayey and commonly replaced by
micrite, calcitic microsparite, or poiklitic calcite. The layers at the top of the
sequence are abruptly overlain by yellowish-brown sandstone with irregular
stratification containing fragments of red reworked pelite. This change in
sedimentation marks the passage to the Juwayl Member, although deposition of
the latter was preceded by an erosion interval which a relief of some tens of
meters was cut into the Khusayyan Member, similar to that in the Dibsiyah
Member.
2.2.4 - JUWAYL MEMBER:
Several partial reference sections were required to establish a type section for
the Juwayl Member. This is on a north flank of the southern part of Jibal Juwayl
latitude 20o09
/30
//N, longitude 44
o28
/00
//E.
The Juwayl Member at Jabal Fard al Ban rest on anerosion surface is inclined
at about 40o
and contains scattered small quartz pebbles. The basal part of the

8/7/2019 Evaluation of groundwater resources in Wajid aquifer in Wadi Dawasir area southern Saudi Arabia using computer si…
http://slidepdf.com/reader/full/evaluation-of-groundwater-resources-in-wajid-aquifer-in-wadi-dawasir-area-southern 40/164
22
member consist of pink and white, fine-grained sandstone, thoroughly
disorganized, and without visible stratification, passing upward into yellowish,
medium-grained sandstone containing fragments of equally disorganized fine-
grained sandstone.
The section of Jibal al Juwayl consists of fine to coarse-grained sandstone,
micro-conglomeratic and conglomeratic toward the base with fragments of
quartz, and of very fine grained sandstone and pinkish, whitish, or yellowish
pelite. The conglomerate generally occur at the base of small sedimentary bodies
that occupy channels in fine-grained deposits. Bedding is nonexistent or poorly
defined in the lower part of the section, but higher up the sandstone displays
massive horizontal beds, beds with inclined sets, cross-stratification, and wavy
stratification.
The section at Bani Ruhayyah and the surrounding area succeeds the Jibal al
Juwayl section and consists of coarse to medium-grained sandstone in beds either
with inclined sets or with millimeter-thick laminae. Here a ferruginous crust, only
a centimeter thick and containing small rounded quartz pebbles, marks an abrupt
passage, without any angular discordance, to pale-gray dolomite of the Khuff
Formation. The basal of the Juwayl Member consist of rounded grains, 500 to
600 micron in diameter, dispersed in a silty matrix with angular fragments; a
texture reminiscent of deposits with a glacial component. The sandstone of Jibal

8/7/2019 Evaluation of groundwater resources in Wajid aquifer in Wadi Dawasir area southern Saudi Arabia using computer si…
http://slidepdf.com/reader/full/evaluation-of-groundwater-resources-in-wajid-aquifer-in-wadi-dawasir-area-southern 41/164
23
Juwayl is generally moderately well to poorly sorted and consist of grains of
quartz and rare feldspar; the sorting improves nearer to the contact with the Khuff
Formation. The matrix everywhere is varied and complex, being clayey,
ferruginous, siliceous, and calcitic, and having undergone several episodes of
alteration.
The Juwayl Member crops out of two distinct belts within the Wadi Tathlith
quadrangle; one trend north between the meridians 44o48/ 00// E. and disappears
beneath Quaternary deposits near Wadi Dwasir, and the other, between 3 and 8
km wide trends north-northwestward for some 35 km from the southern edge of
the quadrangle to latitude 20o16
/00
//N. the nature of the contact with the
underlying rocks and the sedimentologic characteristics of the member in the
latter belt suggest a paleochannel in which the earliest sediments display
pervasive slump structure, at least on the borders, and later sediments have fairly
clearly defined bedding and eventually regular stratification. Slump structure,
probably at the base of the Juwayl Member, are very well developed in the Jabal
Khurb al Ahmar area latitude 30o00
/45
//N, longitude 44
o35
/20
//E.
In the other sides out of the study area there are some stratified as following
sequences: Wajid formation, Khuff formation, Sudair formation, Minjur
formation, Dhruma formation, Tuwaiq, mountain formation, Hanifa formation,

8/7/2019 Evaluation of groundwater resources in Wajid aquifer in Wadi Dawasir area southern Saudi Arabia using computer si…
http://slidepdf.com/reader/full/evaluation-of-groundwater-resources-in-wajid-aquifer-in-wadi-dawasir-area-southern 42/164
24
Jubaila formation, Hith-Arab formation, Buwaib formation, Biyadh formation,
Alluvium deposits.
2.3 – STRUCTURE:
Wadi Dawasir Area forms part of the interior homocline structural
province. The recent investigations have played determinant role in clarifying the
structural conditions of the area, which have a marked influence on the
geohydrological conditions.
The structural outline of the Southern Tuwayq Segment of the interior
homocline (Fig. 2-3). This may subdivided into the following units:
-Northern Trough
-Southern Najd Uplift
-Wadi Dwasir Step-Fault System
-Al Arid Structural Trough
The structural unit having the greatest influence on the tectonic
development of the Wadi Dawasir Area is the Southern Najd uplift. This unit is
the southeasterly extension of a 150 to 200 km wide belt of the Shield,
characterized by very considerable tectonic disturbance. This belt is bordered to
the NE and SW in the shield area by wrench faults, along which the central
blocks has moved in a SE direction.

8/7/2019 Evaluation of groundwater resources in Wajid aquifer in Wadi Dawasir area southern Saudi Arabia using computer si…
http://slidepdf.com/reader/full/evaluation-of-groundwater-resources-in-wajid-aquifer-in-wadi-dawasir-area-southern 43/164
25
Fig. (2-3): Modified structural sketch of the southern Najd (Italconsult, 1969).

8/7/2019 Evaluation of groundwater resources in Wajid aquifer in Wadi Dawasir area southern Saudi Arabia using computer si…
http://slidepdf.com/reader/full/evaluation-of-groundwater-resources-in-wajid-aquifer-in-wadi-dawasir-area-southern 44/164

8/7/2019 Evaluation of groundwater resources in Wajid aquifer in Wadi Dawasir area southern Saudi Arabia using computer si…
http://slidepdf.com/reader/full/evaluation-of-groundwater-resources-in-wajid-aquifer-in-wadi-dawasir-area-southern 45/164
27
The Wadi Dawasir Area lies on the southern border of the Southern Najd
Uplift, which cuts diagonally across it. Hence the Area has been subject to
intense structural disturbance of considerable dimension. These disturbance
profoundly modified the original structure of the lower Paleozoic, which
consisted of a gentle homocline, and divided it into a number of blocks flanked
by fault striking mainly NW-SE, thus producing the typical step and horst-graben
structures. The faults are apparently of the normal gravity type.
The structure of the Lower Paleozoic is largely masked by the Pre-Khuff
unconformity when produced erosion rendered the surface of the Lower
Paleozoic virtually flat.
Reactivation of certain faults, probably in the Upper Triassic, again
brought out the structural trend of the Lower Paleozoic.
It is possible to identify two main step-fault systems and numerous
secondary faults en-echelon in the Wadi Dawasir Area. The main fault systems
lead to the formation of three major stepped blocks rising to the northeast, while
the secondary faults produce step and horst-graben structures.
The main southern fault system, having a NW-SE trend is clearly
recognizable on the basis of both surface and subsurface data. On the surface it is
marked by the large fault system running on the Crystalline Shield parallel to the

8/7/2019 Evaluation of groundwater resources in Wajid aquifer in Wadi Dawasir area southern Saudi Arabia using computer si…
http://slidepdf.com/reader/full/evaluation-of-groundwater-resources-in-wajid-aquifer-in-wadi-dawasir-area-southern 46/164
28
lower reaches of Wadi Bishah to the SE. In the subsurface the gravity anomaly
map indicate its presence.
The southern fault brings about a considerable diminution in the width of
the Wajid Formation outcrop, while that the north causes the total disappearance
of this formation both in outcrop and in subsurface, making an increase in
truncation as the major blocks rise northeastwards.
The throw along the main fault is considerable. It is thought that the
northern one causes vertical displacement of around 400 to 500 meters. There is
not sufficient information available to determine the throw of the southern fault,
but in any case it must be of the order of several hundred meters.
The most important of the secondary structural elements is the Kumdah
Graben. This has been outline on the basis of subsurface and surface information.
It can be followed from Nuemah up to Khashm Kumdah.
It is thought that the actual number of faults is far greater than that
identified of date. The presence of faults (mostly tension faults) has a great
influence on groundwater conditions.
Dips drop from about 19 m/km at the Pre-Wajid unconformity to 12
m/km at the top of the Khuff Formation. The strike of the strata swings from ESE
to ENE in a southerly direction.

8/7/2019 Evaluation of groundwater resources in Wajid aquifer in Wadi Dawasir area southern Saudi Arabia using computer si…
http://slidepdf.com/reader/full/evaluation-of-groundwater-resources-in-wajid-aquifer-in-wadi-dawasir-area-southern 47/164
CHAPTER III
APPLIED PROCEDURE
AND
METHODOLOGY
8/7/2019 Evaluation of groundwater resources in Wajid aquifer in Wadi Dawasir area southern Saudi Arabia using computer si…
http://slidepdf.com/reader/full/evaluation-of-groundwater-resources-in-wajid-aquifer-in-wadi-dawasir-area-southern 48/164
29
CHAPTER III
APPLIED PROCEDURE AND METHODOLOGY
3.1 – METHODOLOGY:
The geological and topographical maps in this study were used. Well
sites and their elevation were determined using a Global Position System
devise (GPS) type Garmen 12. Water level, temperature, pH, and electrical
conductivity where measured in site (Figs. 3-1 and 3-2) .
A pumping tests were performed for both wells, new and old, drilled by
the Ministry of Water and Electrecity in the study area. Step-drawdawn tests
were carried out in three stages 300 gallon/minutes, 400 gallon/minutes and
550 gallon/minutes and wells drilled by Italconsult (1969).
During the hydrological investigation groundwater samples were taken and
bottled for chemical analysis in the laboratory from both supply and
observation wells. The hydrogeologic investigation included complete
characterization of the following:
1- Subsurface extent and thickness of aquifers and confining units
(hydrogeologic framework).
2- Hydrologic Boundaries (also referred to as boundary conditions) which
control the rate and direction of movement of groundwater.

8/7/2019 Evaluation of groundwater resources in Wajid aquifer in Wadi Dawasir area southern Saudi Arabia using computer si…
http://slidepdf.com/reader/full/evaluation-of-groundwater-resources-in-wajid-aquifer-in-wadi-dawasir-area-southern 49/164
30
Fig. (3-1): Collecting and checking samples.

8/7/2019 Evaluation of groundwater resources in Wajid aquifer in Wadi Dawasir area southern Saudi Arabia using computer si…
http://slidepdf.com/reader/full/evaluation-of-groundwater-resources-in-wajid-aquifer-in-wadi-dawasir-area-southern 50/164
31
Fig. (3-2): Determination of water level by device.

8/7/2019 Evaluation of groundwater resources in Wajid aquifer in Wadi Dawasir area southern Saudi Arabia using computer si…
http://slidepdf.com/reader/full/evaluation-of-groundwater-resources-in-wajid-aquifer-in-wadi-dawasir-area-southern 51/164
32
3- Hydraulic Properties of the aquifer and confining units.
4- Description of the horizontal and vertical distribution of hydraulic head
throughout the modeled area for both beginning conditions (initial
conditions) and later conditions that may vary with time (transient
conditions).
5- Predict future of the aquifer with pumping from the wells and drawing
drawdown maps after periodic time.
6- After sample analyses, estimate the errors in analyses and making
distribution maps of ions concentration, statistical methods then suitability
of water for drinking and irrigation.
3.2 – GROUNDWATER MODELING THEORY:
3.2.1 - INTRODUCTION AND PURPOSE:
The use of groundwater models is prevalent in the field of
environmental science. Models have been applied to investigate a wide variety
of hydrogeologic conditions. More recently, groundwater models are being
applied to predict the fate and transport of contaminants for risk evaluation. In
general, models are conceptual descriptions or approximations that describe
physical systems using mathematical equations; they are not exact
descriptions of physical systems or processes. By mathematically representing

8/7/2019 Evaluation of groundwater resources in Wajid aquifer in Wadi Dawasir area southern Saudi Arabia using computer si…
http://slidepdf.com/reader/full/evaluation-of-groundwater-resources-in-wajid-aquifer-in-wadi-dawasir-area-southern 52/164
33
a simplified version of a hydrogeological system, reasonable alternative
scenarios can be predicted, tested, and compared. The applicability or
usefulness of a model depends on how closely the mathematical equations
approximate the physical system being modeled.
Groundwater models, however, even as approximations, are a useful
investigation tool that groundwater hydrologists may use for a number of
applications (Freeze and Cherry, 1979). Among these are:
* Wellhead protection area delineation.
* Evaluation of regional groundwater resources.
* Prediction of the effect of future groundwater withdrawals on groundwater
levels.
* Tracking the migration of groundwater contamination.
* Evaluation of design of hydraulic containment and pump-and-treat systems.
* Design of groundwater monitoring networks.
* Prediction of the possible fate and migration of contaminants for risk
evaluation.
This study deals mainly with flow modeling. Groundwater flow model
is intended to calculate the bulk, or average, rate and direction of movement of
groundwater through aquifers and confining units in the subsurface. These
calculations are referred to as simulations.

8/7/2019 Evaluation of groundwater resources in Wajid aquifer in Wadi Dawasir area southern Saudi Arabia using computer si…
http://slidepdf.com/reader/full/evaluation-of-groundwater-resources-in-wajid-aquifer-in-wadi-dawasir-area-southern 53/164
34
This requires a thorough understanding of the hydrogeologic characteristics of
the site. The hydrogeologic investigation should include a complete
characterization of the following:
1- Subsurface extent and thickness of aquifers and confining units
(hydrogeologic framework).
2- Hydrologic Boundaries (also referred to as boundary conditions) which
control the rate and direction of movement of groundwater.
3- Hydraulic Properties of the aquifers and confining units.
4- A description of the horizontal and vertical distribution of hydraulic head
throughout the modeled area for both beginning conditions (initial
conditions) and later conditions that may vary with time (transient
conditions).
5- Distribution and magnitude of groundwater recharge, pumping or injection
of groundwater, leakage to or from surface water bodies, etc. (sources or
sinks, also referred to as stresses). These stresses may be constant
(unvarying with time) or may change with time (transient).
The output from the model simulations are the hydraulic heads and
groundwater flow rates which are in equilibrium with the hydrogeologic
conditions (hydrogeologic framework, hydrologic boundaries, initial and
transient conditions, hydraulic properties, and sources or sinks) defined for the

8/7/2019 Evaluation of groundwater resources in Wajid aquifer in Wadi Dawasir area southern Saudi Arabia using computer si…
http://slidepdf.com/reader/full/evaluation-of-groundwater-resources-in-wajid-aquifer-in-wadi-dawasir-area-southern 54/164
35
modeled area. Through the processes of model calibration and verification, the
values of the different hydrogeologic conditions are varied to reduce any
disparity between the model simulations and field data, and improve the
accuracy of the model. The model can also be used to simulate possible future
changes to hydraulic head or groundwater flow rates as a result in future
changes in stresses on the aquifer system.
3.2.2 - TYPE OF FLOW MODELS:
There are two types of models, analytical and numerical. An analytical
model is a very simplified equation that can be solved exactly. A numerical
model approximates the partial differential equations describing groundwater
flow and solute transport. Numerical models, though still simplifications of
the actual hydrogeology, are typically much more complex than analytical
models. Each model may also simulate one or more of the processes that
govern groundwater flow or contaminant migration rather than all of the flow
and transport processes.
3.2.3 - MODEL CALIBRATION:
Model calibration consists of changing values of model input
parameters in an attempt to match field conditions within some acceptable
criteria. The calibration process typically involves a steady-state and transient
simulation. With steady-state simulations, there are no observed changes in

8/7/2019 Evaluation of groundwater resources in Wajid aquifer in Wadi Dawasir area southern Saudi Arabia using computer si…
http://slidepdf.com/reader/full/evaluation-of-groundwater-resources-in-wajid-aquifer-in-wadi-dawasir-area-southern 55/164
36
hydraulic head or contaminant concentration with time for the field conditions
being modeled. Transient simulations involve the change in hydraulic head
with time (e.g. aquifer test or and aquifer stressed by a well field). Models
may be calibrated without simulating steady-state flow conditions, but not
without some difficulty.
3.2.4 - MODEL VERIFICATION:
A calibrated model uses selected values of hydrogeologic parameters,
sources and sinks and boundary conditions to match historical field
conditions. The choice of the parameter values and boundary conditions is not
unique, another combination of parameter values and boundary conditions
may give very similar model results. History matching uses the calibrated
model to reproduce historic field conditions. The most common history-
matching scenario consists of reproducing a change in the hydraulic head of
the aquifer. The best scenarios for verification are ones that use the calibrated
model to simulate the aquifer under stressed conditions. The process of model
verification may result in further calibration refinement of the model. After the
model has successfully reproduced measured changes in field conditions, it is
ready for predictive simulations.

8/7/2019 Evaluation of groundwater resources in Wajid aquifer in Wadi Dawasir area southern Saudi Arabia using computer si…
http://slidepdf.com/reader/full/evaluation-of-groundwater-resources-in-wajid-aquifer-in-wadi-dawasir-area-southern 56/164
37
3.3 - COMPUTER METHODS:
After filtering of the hydrogeological data used in this study several
computer software were used for processing, graphical presentation and
analyzing of the study data. Following is brief description of each of the used
computer software:
3.3.1 - VISUAL MODFLOW PROGRAM:
Visual Modflow is a complete and modeling environment for practical
applications in three-dimensional groundwater flow and contaminant transport
simulations. This fully-integrated package combines MODFLOW,
MODPATH, Zone-Budget, MT3Dxx/RT3D, and Win-Pest with the most
intuitive and powerful graphical interface available. The logical menu
structure and easy-to-use graphical tools allow you to:
• Easily dimension the model domain and select units.
• Conveniently assign model properties and boundary conditions.
• Run the model simulations (MODFLOW, MODPATH, Zone-Budget,
MT3D/RT3D, and Win-Pest are seamless integrated).
• Calibrate the model using manual or automated techniques.
• Visualize the results using 2D or 3D graphics.

8/7/2019 Evaluation of groundwater resources in Wajid aquifer in Wadi Dawasir area southern Saudi Arabia using computer si…
http://slidepdf.com/reader/full/evaluation-of-groundwater-resources-in-wajid-aquifer-in-wadi-dawasir-area-southern 57/164
38
The model input parameters and results can be visualized in 2D (cross-
section and plan view) or 3D at any time during the development of the model
or the displaying of the results. For complete three-dimensional groundwater
flow and contaminant transport modeling.
3.3.2 – AQUACHEM PROGRAM:
AqauChem (Calmbach and Waterloo hydrogeologic) is designed
specifically for numerical and graphical processing of hydrochemical data.
The program has many functions ranging from simple unit transformation,
charge balance calculation, hydrochemical facies definition to more complex
mixing and geothermometry calculations. The graphical functions present the
data in the most commonly used hydrochemical diagrams (i.e. Piper, Durov,
Schoeller) and maps. The most powerful feature of AquaChem is the graphical
interface to the geochemical modeling program PHREEQC.
3.3.3 – PHREEQC PROGRAM:
PHREEQC (pH redox-equilibrium-equation) is a powerful C language,
geochemical modeling program (Parkhurst et al., 1980; Parkhurst, 1995;
Parkhurst and Appelo, 1999) based on an ion association aqueous modeling.
It has capabilities for speciation and saturation index calculations; reaction
path and advective transport calculations, and inverse modeling. Input data

8/7/2019 Evaluation of groundwater resources in Wajid aquifer in Wadi Dawasir area southern Saudi Arabia using computer si…
http://slidepdf.com/reader/full/evaluation-of-groundwater-resources-in-wajid-aquifer-in-wadi-dawasir-area-southern 58/164
39
include major and trace ions, alkalinity, Eh, pH, temperature, partial pressure
of gases, and aquifer geology. The output of PHREEQC is very extensive.
3.3.4 - SURFER PROGRAM:
Surfer (Golden Software Inc., 1997) is a contouring and three-
dimensional surface plotting program. The basic function of the program is
interpolating irregularly spaced XYZ data onto a regularly spaced grid, then
using this grided data to construct contour maps and surfaces. The program
uses two categories of griding methods, exact interpolators and smoothing
interpolators. Exact interpolator honors (uses) exactly the value of the data
point when the data point coincides with interpolated grid node. Kriging is the
exact interpolating method used for girding the study data. Smoothing
interpolators are used when there is no strict confidence in the data
measurements.
Surfer also has the capability of producing a file containing cross
section data, which can be imported to any plotting program.
3.3.5 - DUROV PLOT PROGRAM:
DurovPlot (Al-Bassam et al., 1997) is a QuickBASIC program that
calaculates and plots the expanded version of Durov diagram (Durov, 1948;
Burdon and Mazlum, 1958; Lloyd and Heathcote, 1985). This diagram

8/7/2019 Evaluation of groundwater resources in Wajid aquifer in Wadi Dawasir area southern Saudi Arabia using computer si…
http://slidepdf.com/reader/full/evaluation-of-groundwater-resources-in-wajid-aquifer-in-wadi-dawasir-area-southern 59/164
40
removes some of the shortcomings of Hill and Piper diagrams, also it allows
not only the classification of groundwater into types, but also definition of the
possible hydrochemical processes responsible for producing these types of
water.
3.3.6 - INFINITE EXTENT PROGRAM:
Infinite Extent (Starpoint Software) is a computer program designed for
analysis of pumping test data and estimating aquifer hydraulic properties. The
program utilizes the traditional graphical data analysis using type curve
matching (Theis, 1935; Hantush, 1956 and 1960; Walton, 1962; Neuman,
1975) and automatic parameter estimation, also it include special subroutines
to estimate the behavior of aquifer under the stress of pumping. The basic
input data of Infinite Extent is discharge, time or distance, and drawdown.
8/7/2019 Evaluation of groundwater resources in Wajid aquifer in Wadi Dawasir area southern Saudi Arabia using computer si…
http://slidepdf.com/reader/full/evaluation-of-groundwater-resources-in-wajid-aquifer-in-wadi-dawasir-area-southern 60/164
CHAPTER IV
HYDROGEOLOGY
&
HYDROCHEMISTRY

8/7/2019 Evaluation of groundwater resources in Wajid aquifer in Wadi Dawasir area southern Saudi Arabia using computer si…
http://slidepdf.com/reader/full/evaluation-of-groundwater-resources-in-wajid-aquifer-in-wadi-dawasir-area-southern 61/164
41
CHAPTER IV
HYDROGEOLOGY AND HYDROCHEMISTRY 4.1 – INTRODUCTION:
In this chapter, the input data required by the computer model is
printed from the developed data bank. This bank of data represents the
input interface of the used numerical model (Herbert and Anderson, 1982).
The data is ready for request, development and renewal. Request of data is
answered in the form of tables of maps.
4.2 - WAJID AQUIFER DESCRIPTION:
Wajid aquifer is considered as one of the most important
hydrostratigraphical units in the kingdom of Saudi Arabia (Fig. 4-1 and 4-
2). It is fairly well delimited in the Wadi Dawasir area. It is only to the East
that there remain any doubts as to its extent. The depth of the aquifer
which, from the zone where the formation disappears from outcrop to a
pointless than 75 km eastwards, reaches 1000 m has made it impossible to
detect the aquifer East of longitude 45o35/ 00// E. The unconfined part of
the aquifer in and near the outcrop zone of the Wajid formation is very
extensive. It can be followed from the southern bank of Wadi Dawasir to
the Yemen border in the South. The unconfined part of the aquifer seems to
be absent to the North of Wadi Dawasir. The confined part of the aquifer is
more extensive. The border between the unconfined and confined

8/7/2019 Evaluation of groundwater resources in Wajid aquifer in Wadi Dawasir area southern Saudi Arabia using computer si…
http://slidepdf.com/reader/full/evaluation-of-groundwater-resources-in-wajid-aquifer-in-wadi-dawasir-area-southern 62/164

8/7/2019 Evaluation of groundwater resources in Wajid aquifer in Wadi Dawasir area southern Saudi Arabia using computer si…
http://slidepdf.com/reader/full/evaluation-of-groundwater-resources-in-wajid-aquifer-in-wadi-dawasir-area-southern 63/164
43
Fig. (4-1): Wajid Aquifer extent.

8/7/2019 Evaluation of groundwater resources in Wajid aquifer in Wadi Dawasir area southern Saudi Arabia using computer si…
http://slidepdf.com/reader/full/evaluation-of-groundwater-resources-in-wajid-aquifer-in-wadi-dawasir-area-southern 64/164
44
Fig. (4-2): Wajid outcrop.

8/7/2019 Evaluation of groundwater resources in Wajid aquifer in Wadi Dawasir area southern Saudi Arabia using computer si…
http://slidepdf.com/reader/full/evaluation-of-groundwater-resources-in-wajid-aquifer-in-wadi-dawasir-area-southern 65/164
45
4.4 - AQUIFER PARAMETERS:
Any aquifer is characterized by two main properties. The first is its
ability to transmit water under natural field conditions. The second
property is its storage capability. These two parameters are named the
transmissivity and storage coefficient.
A pumping test was conducted, for this purpose in the Wajid Aquifer
of the study area at Al-Sharafa wells (Table 4-1). The pumping test data
was analyzed using Infinite Extent Program. It comprises three methods
Thesis, Walton and Hantush, assume the following:
• The aquifer has a seemingly infinite a real extent.
• The aquifer is homogeneous, isotropic and of uniform thickness over the
area influenced by the pumping test.
• Prior to pumping, the piezometric surface and /or phreatic surface are
(nearly) horizontal over the area influenced by the pumping test.
• The aquifer is pumped at a constant discharge rate.
• The pumped well penetrates the entire aquifer and thus receives water
from the entire thickness of the aquifer by horizontal flow.
It is be clear that the first assumption in particular is seldom satisfied in
nature. However, slight deviations are not prohibitive to the application of
the methods. When greater deviations from the above assumptions occur,
we come into the field of special flow problems. To understand the
assumptions of each individual method, Thesis assumes the following:

8/7/2019 Evaluation of groundwater resources in Wajid aquifer in Wadi Dawasir area southern Saudi Arabia using computer si…
http://slidepdf.com/reader/full/evaluation-of-groundwater-resources-in-wajid-aquifer-in-wadi-dawasir-area-southern 66/164
46
Client: MW
Title: MSc Project
Site Name: Sharafa
Location:WadiDawasir
Project Number: 1
Well DischargeRate: 1090.24 M3/day
Pumping WellRadius 0.35 meters
Aquifer Thickness: 600 meters
r=0.35meters
A = 0 meters
B = 600 meters
Time Drawdown
days meters
0.000 0
0.001 0.85
0.001 3.05
0.002 3.2
0.003 3.25
0.003 3.35
0.004 3.39
0.005 3.42
0.006 3.42
0.006 3.42
0.007 3.42
0.008 3.42
0.010 3.42
0.011 3.42
0.013 3.42
0.014 3.42
0.017 3.43
0.021 3.44
0.024 3.5
0.028 3.5
0.031 3.50.035 3.5
0.042 3.5
0.049 3.5
0.056 3.51
0.063 3.51
0.069 3.51
0.076 3.51
0.097 3.51
0.118 3.51
0.139 3.51
Table (4-1): Step drawdown of pumping test of Al-Sharafa Well in the study area.

8/7/2019 Evaluation of groundwater resources in Wajid aquifer in Wadi Dawasir area southern Saudi Arabia using computer si…
http://slidepdf.com/reader/full/evaluation-of-groundwater-resources-in-wajid-aquifer-in-wadi-dawasir-area-southern 67/164
47
4.4.1 - THEIS’S METHOD:
Besides the assumptions mentioned above, the following limiting
conditions should be satisfied:
• The aquifer is confined.
• The flow to the well is in unsteady state, i.e. the drawdown differences
with time are not negligible nor are the hydraulic gradient constant with
time.
• The water removed from storage is discharged instantaneously with
decline of head.
• The diameter of the pumped well is very small, i.e. the storage in the
well can be neglected.
∫ ∞−
π=
π=
u
y uW kD
Q y
dyekD
Q s )(44
Where:
u =kDt
S r
4
2
and, consequently 2
4
r
kDtuS =
s = The drawdown is m measured in a piezometer at a distance r in m
form the pumped well.
Q = The constant well discharge in m3/day.
S = The dimensionless coefficient of storage.
kD = The transmissivity of the aquifer in m
2
/day.

8/7/2019 Evaluation of groundwater resources in Wajid aquifer in Wadi Dawasir area southern Saudi Arabia using computer si…
http://slidepdf.com/reader/full/evaluation-of-groundwater-resources-in-wajid-aquifer-in-wadi-dawasir-area-southern 68/164
48
t = The time in days since pumping started.
4.4.2 - WALTON’S METHOD:
Besides the assumptions, the following limiting conditions should be
satisfied:
• The aquifer is semi-confined.
• The flow to the well is in an unsteady state, i.e. the drawdown
differences with time are not negligible nor are the hydraulic gradient
constant with time.
• The water removed from storage is discharged instantaneously with
decline of head.
• The well diameter is very small, so that the storage in the well can be
neglected.
Walton (1962) developed a method of solution along the same line of
reasoning as was followed for the Theis method, but instead of one type
curve, there is a type curve for each value for r/L. This means that using
the tables of values for the function W(u, r/L) as published by Hantush
(1956), a family of type curves has to be drawn.
4.4.3 - HANTUSH’S METHOD:
The following assumptions and conditions should be satisfied:
• Those listed for the Walton method and in addition the conditions.
• q > 2r/L
8/7/2019 Evaluation of groundwater resources in Wajid aquifer in Wadi Dawasir area southern Saudi Arabia using computer si…
http://slidepdf.com/reader/full/evaluation-of-groundwater-resources-in-wajid-aquifer-in-wadi-dawasir-area-southern 69/164
49
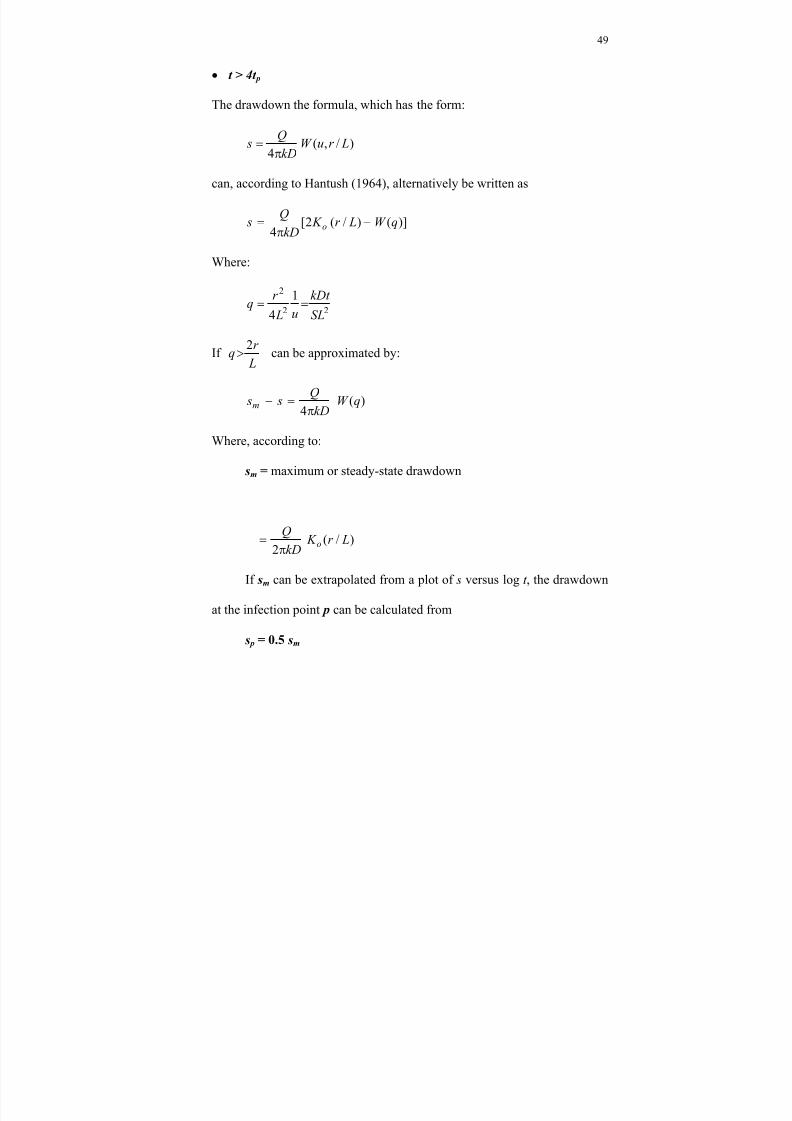
• t > 4t p
The drawdown the formula, which has the form:
)/,(4
Lr uW kD
Q sπ
=
can, according to Hantush (1964), alternatively be written as
)]()/(2[4
qW Lr K kD
Q s o −
π=
Where:
22
2 1
4 SL
kDt
u L
r q ==
If L
r q
2> can be approximated by:
)(
4
qW
kD
Q s sm
π
=−
Where, according to:
sm = maximum or steady-state drawdown
)/(
2
Lr K
kD
Qo
π
=
If sm can be extrapolated from a plot of s versus log t , the drawdown
at the infection point p can be calculated from
s p = 0.5 sm

8/7/2019 Evaluation of groundwater resources in Wajid aquifer in Wadi Dawasir area southern Saudi Arabia using computer si…
http://slidepdf.com/reader/full/evaluation-of-groundwater-resources-in-wajid-aquifer-in-wadi-dawasir-area-southern 70/164
50
and t p, the time corresponding with s p, can be read from the time-drawdown
curve. If a sufficient number of data fall within the period t > 4t p the
following procedure can be used.
The average of transmissivity is 252.8 m2/day. The average hydraulic
conductivity is 0.421 m/day and the average storage coefficient is 0.002.
The permeability of an aquifer is described by its transmissivity and
hydraulic conductivity. Transmissivity estimated from pumping tests in the
aquifer are in the range from 5.7x 10⁻⁴ to 2.1x 10⁻² m/sec (Italconsult,
1969). The average transmissivity, calculated as the geometric mean, from
all pumping tests is T = 49.248 m2/day. The values of hydraulic
conductivity show a range from 5.5x10⁻⁷ m/s found in the unconfined part
to 3.0x10⁻⁸ m/s in the eastern confined part of the aquifer. The storativity of
an aquifer is defined by its storage coefficient, specific storage and specific
yield. The storage coefficient has been obtained from pumping test data in
the range of 0.004 to 0.0408 with average of 0.0224. Specific storage
ranges from 2x 10⁻¹
(unconfined) to 2x 10⁻⁴
(confined). The specific yield
has been found to be 0.045 to 0.21 from pumping tests. The regional value
is about 21%.

8/7/2019 Evaluation of groundwater resources in Wajid aquifer in Wadi Dawasir area southern Saudi Arabia using computer si…
http://slidepdf.com/reader/full/evaluation-of-groundwater-resources-in-wajid-aquifer-in-wadi-dawasir-area-southern 71/164
51
Fig. (4-3): Pumping test curve using Theis Method.

8/7/2019 Evaluation of groundwater resources in Wajid aquifer in Wadi Dawasir area southern Saudi Arabia using computer si…
http://slidepdf.com/reader/full/evaluation-of-groundwater-resources-in-wajid-aquifer-in-wadi-dawasir-area-southern 72/164
52
Fig. (4-4): Pumping test using Walton’s Method.

8/7/2019 Evaluation of groundwater resources in Wajid aquifer in Wadi Dawasir area southern Saudi Arabia using computer si…
http://slidepdf.com/reader/full/evaluation-of-groundwater-resources-in-wajid-aquifer-in-wadi-dawasir-area-southern 73/164
53
Fig. (4-5): Pumping test using Hantush Method.

8/7/2019 Evaluation of groundwater resources in Wajid aquifer in Wadi Dawasir area southern Saudi Arabia using computer si…
http://slidepdf.com/reader/full/evaluation-of-groundwater-resources-in-wajid-aquifer-in-wadi-dawasir-area-southern 74/164
54
4.5 - GROUNDWATER DYNAMIC:
The static water level of Wajid aquifer in the area varies from beyond 40
m below ground level to more than 90 m above ground level, depending on
the topographic elevation. Table (4-2) and figure (4-6) show generalized
head distribution of the Wajid aquifer, the groundwater heads are dipping
gently from the outcrop area in the southwest towards the northeast. At
present time table (4-3) fig (4-7) Wajid aquifer is under huge withdrawal
quantities from the agricultural companies that mean the aquifer is in a non
equilibrium state, so the groundwater outflow discharge is greater than the
groundwater recharge, and that the total change in storage is negative. The
heads decrease from about 700 m to 550 above sea level (a.s.l). The
groundwater flow is directed to the northeast which is the main discharge
area for the aquifer especially in Wadi Dawasir area which is the maximum
withdrawal.
The groundwater inflow consists of direct groundwater recharge
from precipitation and of recharge caused by infiltration of run-off to
stream beds or of run-off pounded on the outcrop of the aquifer. For the
study area the average groundwater recharge in the outcrop area is
estimated to about 15 mm/year.
It must be mentioned, that most of the groundwater stored in Wajid
aquifer is fossil – non renewable – groundwater. The age of the
groundwater is dated up to several thousand years. Most of this

8/7/2019 Evaluation of groundwater resources in Wajid aquifer in Wadi Dawasir area southern Saudi Arabia using computer si…
http://slidepdf.com/reader/full/evaluation-of-groundwater-resources-in-wajid-aquifer-in-wadi-dawasir-area-southern 75/164
55
Well. Name Longitude Latitude WELL. deph ElevationDepth to
Water Water Level
SU 45.57 20.46 1318.5 601.35 9.14 610.49
T4 45.13 20.33 552.4 636.91 5.63 642.54
T5 45.15 20.48 559.65 634.27 5.22 639.49
T6 45.19 20.63 569 623.07 6.22 629.29
T7 45.13 20.33 551.5 634.94 5.72 640.66
T8 45.14 20.33 799.5 635.71 5.7 641.41
T11 45.4 19.95 1109 665 3.76 668.76
T12 45.13 19.87 603.5 711.98 12.3 724.28
T20 45.05 20.28 749 662 2.5 664.5
T21 45.06 20.24 793 675 1.79 676.79
T22 45.07 20.48 624 639 4.1 643.1
P1 45.14 20.34 798 635.16 5.65 640.81
Table (4-2): Ancient (Initial) well information in the Wajid Aquifer in Wadi
Dwasir Area.

8/7/2019 Evaluation of groundwater resources in Wajid aquifer in Wadi Dawasir area southern Saudi Arabia using computer si…
http://slidepdf.com/reader/full/evaluation-of-groundwater-resources-in-wajid-aquifer-in-wadi-dawasir-area-southern 76/164
56
4900000 4920000 4940000 4960000 4980000 5000000 5020000
2220000
2240000
2260000
2280000
2300000
2320000
2340000
Fig. (4-6): Water level in the Wajid Aquifer in Wadi Dawasir 1969.

8/7/2019 Evaluation of groundwater resources in Wajid aquifer in Wadi Dawasir area southern Saudi Arabia using computer si…
http://slidepdf.com/reader/full/evaluation-of-groundwater-resources-in-wajid-aquifer-in-wadi-dawasir-area-southern 77/164
57
WellName Long Latit
WellDepth
D toWater Elevation W.L
WD1 45.02 20.39 500 80 648.25 568.25
WD2 45.02 20.19 300 80 680.5 600.5
WD3 45.099 20.47 450 80 636.75 556.75
WD4 44.86 20.18 300 80 685 605
WD5 44.91 20.34 250 80 664 584
WD6 44.98 20.156 500 90 685.5 595.5
WD7 44.93 20.406 350 90 655.5 565.5
WD8 44.97 20.08 350 80 693.5 613.5
WD9 44.86 20.256 300 80 676.5 596.5
WD10 45.216 20.459 600 90 627.25 537.25
WD11 45 20.09 350 100 691.6 591.6
WD12 44.98 20.12 350 90 689.25 599.25
WD13 45.016 20.174 350 90 682.5 592.5
WD14 45 20.11 350 90 689.5 599.5
WD15 44.914 20.394 250 70 658 588
WD16 44.94 19.95 300 80 705 625
WD17 44.98 20.32 300 80 661 581
WD18 44.915 20.41 200 80 659.5 579.5
WD19 44.91 20.45 200 100 653.35 553.35
WD20 44.87 20.12 300 80 691 611
WD21 44.907 20.38 250 70 660 590
WD22 44.89 20.11 300 90 691.75 601.75
WD23 45.196 20.43 550 90 630 540
WD24 45.189 20.44 550 90 630.5 540.5
WD25 45.287 20.439 600 90 623 533
WD26 44.95 20.417 250 70 653 583
WD27 44.91 20.136 300 80 689 609WD28 44.97 20.24 300 80 675 595
WD29 44.95 20.39 250 60 625.5 565.5
WD30 44.97 20.144 300 100 687 587
WD31 44.9 20.173 300 80 685 605
WD32 44.97 20.168 350 100 684.5 584.5
WD33 44.91 20.14 300 80 688.5 608.5
WD34 44.97 20.106 350 100 691 591
WD35 45.2 20.44 600 90 629.5 539.5
WD36 44.98 20.22 300 80 677.75 597.75
WD37 44.97 20.34 250 80 659 579
WD38 44.91 20.38 250 80 659.5 579.5WD39 44.907 20.162 300 80 686.5 606.5
WD40 44.97 20.23 350 85 676.5 591.5
WD41 44.99 20.3 250 80 663 583
WD42 44.92 20.34 250 80 663.5 583.5
WD43 45.21 20.495 550 90 627 537
WD44 45.264 20.49 600 90 622.5 532.5
WD45 45.31 20.47 600 90 625.25 535.25
WD46 45.11 20.55 450 70 632 562
WD47 44.91 20.327 300 80 665.5 585.5
Table (4-3): Wells information of Wajid Aquifer in Wadi Dawasir 2002

8/7/2019 Evaluation of groundwater resources in Wajid aquifer in Wadi Dawasir area southern Saudi Arabia using computer si…
http://slidepdf.com/reader/full/evaluation-of-groundwater-resources-in-wajid-aquifer-in-wadi-dawasir-area-southern 78/164
58
4900000 4920000 4940000 4960000 4980000 5000000 5020000
2220000
2240000
2260000
2280000
2300000
2320000
2340000
Fig.(4-7): Present groundwater level in the study area 2002.

8/7/2019 Evaluation of groundwater resources in Wajid aquifer in Wadi Dawasir area southern Saudi Arabia using computer si…
http://slidepdf.com/reader/full/evaluation-of-groundwater-resources-in-wajid-aquifer-in-wadi-dawasir-area-southern 79/164

8/7/2019 Evaluation of groundwater resources in Wajid aquifer in Wadi Dawasir area southern Saudi Arabia using computer si…
http://slidepdf.com/reader/full/evaluation-of-groundwater-resources-in-wajid-aquifer-in-wadi-dawasir-area-southern 80/164
Table (4-4): Results of groundwater analysis in the study area (mg/l).
Well Ca Mg Na K Cations HCO3 Cl SO4 NO3 Anions Er
SU 2.56 1.56 3.59 0.46 8.18 2.56 2.64 2.74 0 7.95 0T4 4.09 2.22 4.13 1.3 11.75 2.54 4.94 4.17 0 11.64 0
T5 4.14 1.89 4 1.38 11.42 2.54 4.65 4.17 0 11.36 0
T6 3.24 1.48 2.83 1.38 8.93 2.54 3.1 3.13 0 8.77 0
T8 4.34 2.38 3.69 0.46 10.87 2.56 3.77 4.6 0 10.94 0
T11 4.77 1.54 2.3 0.52 9.12 2.71 3.47 3.11 0 9.3 0
T12 4.24 2.28 4.68 0.32 11.52 2.76 4.79 4.1 0 11.66 0
T20 5.39 2.72 6.12 0.43 14.67 1.74 7.32 5.37 0 14.43 0
T21 4.74 2.32 4.8 0.4 12.26 4.25 5.55 4.33 0 14.13 1
T22 4.82 2.39 4.88 0.46 12.55 2.32 5.47 4.76 0 12.55K1 9.98 3.21 4.83 1.48 19.5 2.89 12.97 8.33 0.35 24.54 5
D1 3.54 5.67 9.61 0.26 19.09 2.84 7.93 4.83 0 15.59
D2 2.59 4.28 7.87 0.36 15.1 3.26 6.01 3.75 0 13.02 2
D3 1.95 4.03 4.18 0.5 10.66 3.1 4 3.46 0 10.56 0
D4 1.8 4.77 2.65 0.28 9.5 3.3 7.64 3.29 0.37 14.6
D5 1.1 2.14 1.44 0.35 5.02 3.43 0.96 2.29 0 6.68 1
D6 3.24 6 7.52 0.54 17.31 2.66 4.63 3.81 0 11.09 6
D7 1.8 3.95 4.44 0.53 10.71 3.1 3.27 4.02 0 10.39 0
D8 0.95 2.38 1.7 0.33 5.36 3.84 1.04 2.27 0 7.15 1M1 3.74 2.47 1.48 0.41 8.1 1.97 7.05 2.56 0.35 11.93 3

8/7/2019 Evaluation of groundwater resources in Wajid aquifer in Wadi Dawasir area southern Saudi Arabia using computer si…
http://slidepdf.com/reader/full/evaluation-of-groundwater-resources-in-wajid-aquifer-in-wadi-dawasir-area-southern 81/164
61
44.8 44.9 45 45.1 45.2 45.3 45.4 45.5 45.6
19.8
19.9
20
20.1
20.2
20.3
20.4
20.5
20.6
SU
T4
T5
T6
T8
T11
T12
T20
T21
T22
K1
D1
D2 D3
D4
D5
D6
D7
D8M1
0 10 20 Km
Fig. (4-8): Sites of sampling.

8/7/2019 Evaluation of groundwater resources in Wajid aquifer in Wadi Dawasir area southern Saudi Arabia using computer si…
http://slidepdf.com/reader/full/evaluation-of-groundwater-resources-in-wajid-aquifer-in-wadi-dawasir-area-southern 82/164
62
For irrigation water and most other natural waters, 1 millimho
customarily is taken as equal to 640 mg/1 (Salinity Laboratory, 1954).
Groundwater is classified according to its TDS content as (Hem, 1970)
(Table 4-5):
Davis and DeWiest (1966) classified water with a TDS content of
1000 to 10000 ppm as brackish, of 10000 to 100000 ppm as salty, and of
more than 100 000 ppm as brine. By way of comparison, the TDS content of
seawater is about 34000 mg/1 and that of a saturated NaCI solution more
than 300000 mg/1. The recommended maximum limit for the TDS content
of drinking water is 500 mg/1, but water of double or even triple this
concentration is used if no other water is available.
In this study there are a three parts have a high cocentration of
TDS, one along the west and the other near to north east and the third one in
the south, the lowest values in far north east (Fig. 4-9).
4.6.2 - CALCIUM (Ca++
):
Calcium is one of the principal cations in groundwater. Sources of
calcium are igneous rock minerals like silicates, pyroxenes, amphiboles,
feldspars, and silicate minerals produced in metamorphism. Since the
solubility of these minerals is low, water from igneous or metamorphic rock

8/7/2019 Evaluation of groundwater resources in Wajid aquifer in Wadi Dawasir area southern Saudi Arabia using computer si…
http://slidepdf.com/reader/full/evaluation-of-groundwater-resources-in-wajid-aquifer-in-wadi-dawasir-area-southern 83/164
63
Type of water Measured disolved solids
(mg/l)
Fresh < 1000
Moderately saline 3 000-10 000
Very saline 10 000-35 000
Briny > 3 5 000
Table (4-5) : Classification of water according to the TDS (Hem, 1970).

8/7/2019 Evaluation of groundwater resources in Wajid aquifer in Wadi Dawasir area southern Saudi Arabia using computer si…
http://slidepdf.com/reader/full/evaluation-of-groundwater-resources-in-wajid-aquifer-in-wadi-dawasir-area-southern 84/164
64
44.8 44.9 45 45.1 45.2 45.3 45.4 45.5 45.6
19.8
19.9
20
20.1
20.2
20.3
20.4
20.5
20.6
500
550
600
650
700
750
800
850
900
950
1000
1050
1100
1150
1200
1250
0 10 20 Km
Fig. (4-9): Concentration of TDS in the study area (mg/l).

8/7/2019 Evaluation of groundwater resources in Wajid aquifer in Wadi Dawasir area southern Saudi Arabia using computer si…
http://slidepdf.com/reader/full/evaluation-of-groundwater-resources-in-wajid-aquifer-in-wadi-dawasir-area-southern 85/164

8/7/2019 Evaluation of groundwater resources in Wajid aquifer in Wadi Dawasir area southern Saudi Arabia using computer si…
http://slidepdf.com/reader/full/evaluation-of-groundwater-resources-in-wajid-aquifer-in-wadi-dawasir-area-southern 86/164
66
Km
44.8 44.9 45 45.1 45.2 45.3 45.4 45.5 45.6
19.8
19.9
20
20.1
20.2
20.3
20.4
20.5
20.6
10
20
30
40
50
60
70
80
90
100
110
120
130
140
150
160
170
180
190
0 10 20
Fig. (4-10 ): Concentration of calcium ion in the stuy area (mg/l).

8/7/2019 Evaluation of groundwater resources in Wajid aquifer in Wadi Dawasir area southern Saudi Arabia using computer si…
http://slidepdf.com/reader/full/evaluation-of-groundwater-resources-in-wajid-aquifer-in-wadi-dawasir-area-southern 87/164
67
rock, magnesium occurs as magnesite and other carbonates, sometimes
mixed with calcium carbonate. Dolomite contains calcium and magnesium
in equal amounts. Most groundwater contain relatively small amounts of
Mg, except where they have been in contact with dolomite (amounts of Ca
and Mg about the same), or with Mg-rich evaporites that could cause Mg to
become the dominant cation in the groundwater.
In the study area magnissium cocentration varies from less than 18
mg/l to more than 70 mg/l, the maximum cocentration is found in the north
west and in the south part of the study area. The minimum values distributed
in the east and a lettel in the north in two points. In the middel of the study
area, magnessium has a moderatly concentrations (Fig. 4-11).
4.6.4 - SODIUM (Na+):
Sodium is primarily derived from feldspars in igneous rock and its
weathering products (clay minerals) in other material. Shale and clay layers
often yield water with a relatively high sodium content. Other sources of
sodium are leachate and deep percolation water from the upper soil layers
(including atmospheric precipitation that has been subject to concentration
effects), and contamination of groundwater by salty connate water or water
of marine origin. Brines and other salty waters which usually occur at great
depths contain large amounts of sodium.
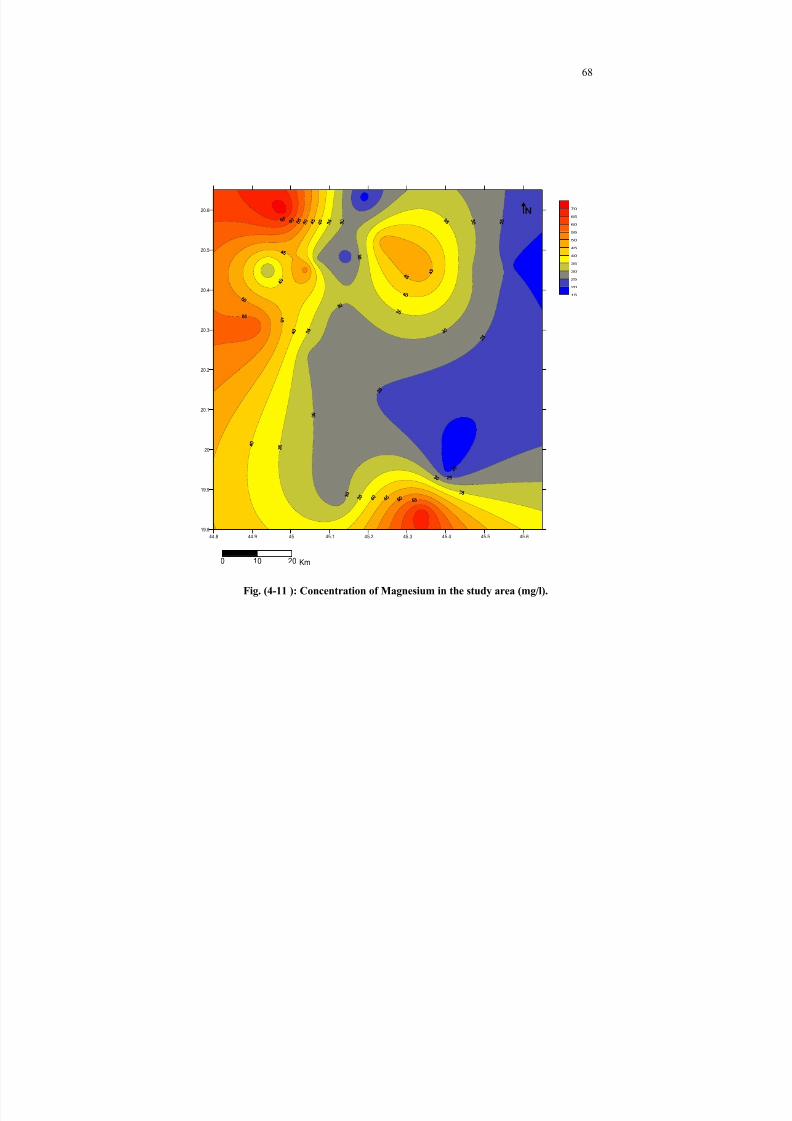
8/7/2019 Evaluation of groundwater resources in Wajid aquifer in Wadi Dawasir area southern Saudi Arabia using computer si…
http://slidepdf.com/reader/full/evaluation-of-groundwater-resources-in-wajid-aquifer-in-wadi-dawasir-area-southern 88/164

8/7/2019 Evaluation of groundwater resources in Wajid aquifer in Wadi Dawasir area southern Saudi Arabia using computer si…
http://slidepdf.com/reader/full/evaluation-of-groundwater-resources-in-wajid-aquifer-in-wadi-dawasir-area-southern 89/164
69
Sodium concentration varies in the study area from 30 mg/l to
more than 200 mg/l (Fig. 4-12). The maximum sodium concentration is
appear in the south and in the north parts of the study area and the minimum
values is found near along the east part and in two areas near the west part of
the study area. In the middel of the area sodium concentration has a
moderatly values.
4.6.5 - POTASSIUM (K -):
Potassium is less common than sodjum in igneous rock, but more abundant
in sedimentary rock as potassium feldspars. These minerals, however, are
very insoluble so that potassium levels in groundwater normally are much
lower than sodium concentrations. Potassium concentration ranges in the
study area from 10 mg/l to more than 55 mg/l, the minimum cocentration
values is found from the middel of the study area to along the south part and
the high cocentrations (more than 55 mg/l) occures mainly in the north and
north west (Fig. 4-13).
4.6.6 - CHLORIDE (Cl
--
):
Primary sources of chloride in groundwater are evaporites, salty
connate water, and marine water. Igneous rock materials contribute little
chloride. Ground- waters containing significant amounts of chloride also

8/7/2019 Evaluation of groundwater resources in Wajid aquifer in Wadi Dawasir area southern Saudi Arabia using computer si…
http://slidepdf.com/reader/full/evaluation-of-groundwater-resources-in-wajid-aquifer-in-wadi-dawasir-area-southern 90/164
70
44.8 44.9 45 45.1 45.2 45.3 45.4 45.5 45.6
19.8
19.9
20
20.1
20.2
20.3
20.4
20.5
20.6
30
40
50
60
70
80
90
100
110
120
130
140
150
160
170
180
190
200
210
0 10 20 Km
Fig. (4-12): Cocentration of Sodium in the study area (mg/l).

8/7/2019 Evaluation of groundwater resources in Wajid aquifer in Wadi Dawasir area southern Saudi Arabia using computer si…
http://slidepdf.com/reader/full/evaluation-of-groundwater-resources-in-wajid-aquifer-in-wadi-dawasir-area-southern 91/164
71
tend to have high amounts of sodium, indicating the possibility of contact
with water of marine origin.
Leaching of chlorides that have accumulated in upper soil layers
may be a significant chloride source in dry climates. The recommended
maximum concentration for chloride in drinking water is 250 mg/1,
primarily for reasons of taste.
Over the investigated area the chloride cocentration varies from 20
mg/l in the north west to more than 440 mg/l in the north east so it is take an
increasing from east to west (Fig. 4-14).
4.6.7 - SULFATE (SO4--):
Sulfate is formed by oxidation of pyrite and other sulfides widely
distributed in igneous and sedimentary rocks. The most important sulfate
deposits are found in evaporite sediments (gypsum, anhydrite, sodium
sulfate). In arid regions, leaching of sulfate from the upper soil layers may
also be significant, causing sulfate to be the principal anion of the underlying
groundwater. Sulfate concentrations in drinking water should not exceed 250
mg/1 because the water will have a bitter taste and can produce laxative
effects at higher levels.

8/7/2019 Evaluation of groundwater resources in Wajid aquifer in Wadi Dawasir area southern Saudi Arabia using computer si…
http://slidepdf.com/reader/full/evaluation-of-groundwater-resources-in-wajid-aquifer-in-wadi-dawasir-area-southern 92/164
72
Km
44.8 44.9 45 45.1 45.2 45.3 45.4 45.5 45.6
19.8
19.9
20
20.1
20.2
20.3
20.4
20.5
20.6
10
15
20
25
30
35
40
45
50
55
0 10 20
Fig. (4-13): Concentration of potassium of the study area (mg/l).

8/7/2019 Evaluation of groundwater resources in Wajid aquifer in Wadi Dawasir area southern Saudi Arabia using computer si…
http://slidepdf.com/reader/full/evaluation-of-groundwater-resources-in-wajid-aquifer-in-wadi-dawasir-area-southern 93/164
73
44.8 44.9 45 45.1 45.2 45.3 45.4 45.5 45.6
19.8
19.9
20
20.1
20.2
20.3
20.4
20.5
20.6
20
40
60
80
100
120
140
160
180
200
220
240
260
280
300
320
340
360
380
400
420
440
0 10 20 Km
Fig. (4-14): Concentration of chlore of the study area (mg/l).

8/7/2019 Evaluation of groundwater resources in Wajid aquifer in Wadi Dawasir area southern Saudi Arabia using computer si…
http://slidepdf.com/reader/full/evaluation-of-groundwater-resources-in-wajid-aquifer-in-wadi-dawasir-area-southern 94/164
74
In the study area sulphate cocentration varies from 100 mg/l in the
north west to more than 380 mg/l in the north east in the miiddel and south
parts of the study area sulphate cocentration has a moderatly values (Fig. 4-
15).

8/7/2019 Evaluation of groundwater resources in Wajid aquifer in Wadi Dawasir area southern Saudi Arabia using computer si…
http://slidepdf.com/reader/full/evaluation-of-groundwater-resources-in-wajid-aquifer-in-wadi-dawasir-area-southern 95/164
75
44.8 44.9 45 45.1 45.2 45.3 45.4 45.5 45.6
19.8
19.9
20
20.1
20.2
20.3
20.4
20.5
20.6
100
120
140
160
180
200
220
240
260
280
300
320
340
360
380
0 10 20 Km
Fig. (4-15): Concentration of sulfate ion in the study area (mg/l).

8/7/2019 Evaluation of groundwater resources in Wajid aquifer in Wadi Dawasir area southern Saudi Arabia using computer si…
http://slidepdf.com/reader/full/evaluation-of-groundwater-resources-in-wajid-aquifer-in-wadi-dawasir-area-southern 96/164
CHAPTER V
MODFLOW RESULTS

8/7/2019 Evaluation of groundwater resources in Wajid aquifer in Wadi Dawasir area southern Saudi Arabia using computer si…
http://slidepdf.com/reader/full/evaluation-of-groundwater-resources-in-wajid-aquifer-in-wadi-dawasir-area-southern 97/164
76
CHAPTER V
MODFLOW RESULTS
5.1 – MODEL AREA:
The area has a length of 118.06 km and a width of 129.19 km. The
model includes the apart of outcrop of the Wajid Aquifer in the west
recharge area. The eastern boundary is artificial and is defined by the 590
m head flux. The northern and southern boundaries are far away from the
well field to make sure that the total groundwater flux is much greater than
the discharge rate by pumping in the well field (Fig. 5-1).
5.2 - BOUNDARY CONDITIONS:
The boundary conditions for the flow model are shown in Fig. (5-1).
The east and west boundaries are no-flow boundary the second kind or
Cauchy type boundary defined by flow lines. The distance of these
boundaries from the well field are selected such, that they will be not
effected by the drawdown caused by the pumping within the well field.
The west boundary again is another no-flow boundary defined by the
outcrop of Wajid Aquifer The downstream boundary in the north is
modeled as a prescribed head boundary (flux boundary: the first kind or
Dirichlet type boundary) with a fixed head of 590 m (a.s.l). Its distance is

8/7/2019 Evaluation of groundwater resources in Wajid aquifer in Wadi Dawasir area southern Saudi Arabia using computer si…
http://slidepdf.com/reader/full/evaluation-of-groundwater-resources-in-wajid-aquifer-in-wadi-dawasir-area-southern 98/164
Fig. (5-1): Modified map show the extent of the modeled area and grid used for modeling (x =

8/7/2019 Evaluation of groundwater resources in Wajid aquifer in Wadi Dawasir area southern Saudi Arabia using computer si…
http://slidepdf.com/reader/full/evaluation-of-groundwater-resources-in-wajid-aquifer-in-wadi-dawasir-area-southern 99/164
78
far enough from the aquifer, to make sure that this boundary is not
affected by the drawdown caused by the well field. Aquifer top and
bottom are no-flow boundaries defined by the Khuff and overlay
formations. Groundwater recharge occurs in the outcrop area of the Wajid
Aquifer.
5.3 - MATHEMATICAL MODEL:
5.3.1 – MODEL APPROACH:
For the flow simulation a 2D groundwater flow model was
developed. Simulations were carried out for transient conditions. Because
of the non equilibrium flow conditions a steady state approach was not
meaningful.
5.3.2 - MODEL CODE:
The Visual Modflow was selected in the present study. The
simulations were done using the groundwater flow model MODFLOW
from the United States Geological Survey (McDonald and Harbaugh,
1948). MODFLOW is a 3D groundwater flow model. For the numerical
solution of the flow equation MODFLOW uses a block centered finite
difference scheme. The calculation of pathlines is done by Pollock’s
method (Pollock, 1994). Within the calibration process the parameter
optimization was carried out mainly manually, partly automatically using
the program PEST (Dohertyet al.
, 1994).
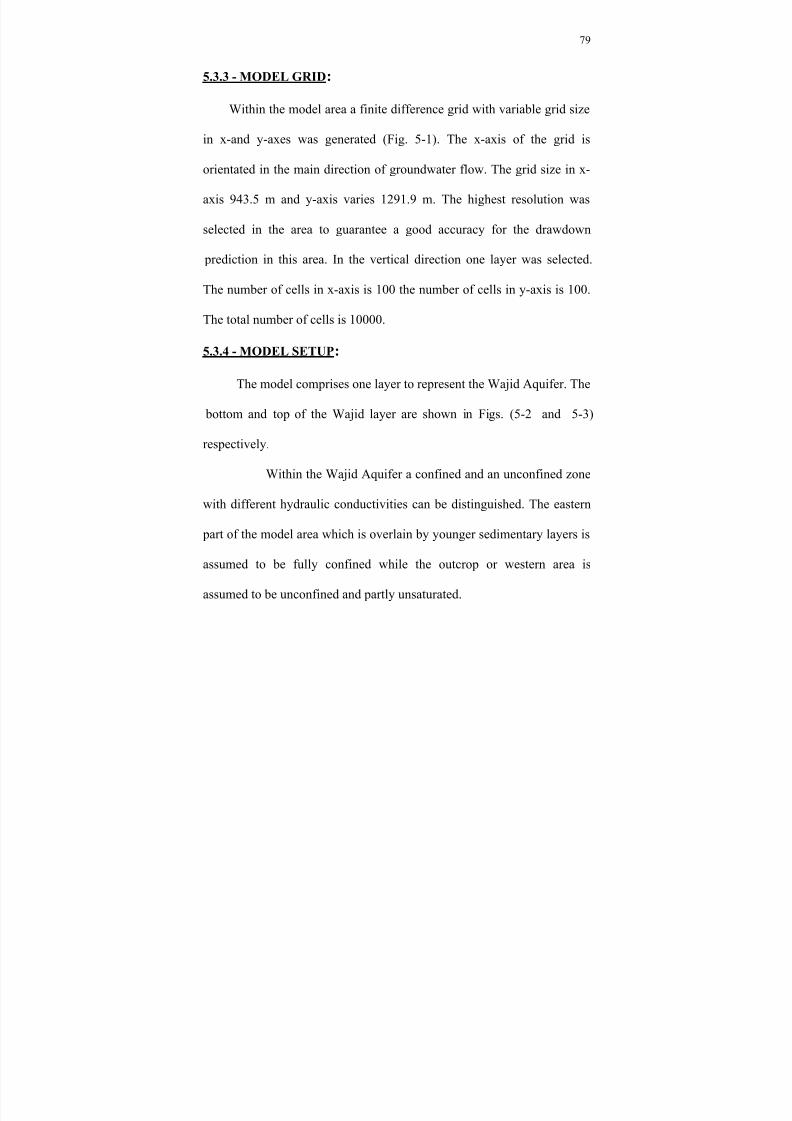
8/7/2019 Evaluation of groundwater resources in Wajid aquifer in Wadi Dawasir area southern Saudi Arabia using computer si…
http://slidepdf.com/reader/full/evaluation-of-groundwater-resources-in-wajid-aquifer-in-wadi-dawasir-area-southern 100/164
79
5.3.3 - MODEL GRID:
Within the model area a finite difference grid with variable grid size
in x-and y-axes was generated (Fig. 5-1). The x-axis of the grid is
orientated in the main direction of groundwater flow. The grid size in x-
axis 943.5 m and y-axis varies 1291.9 m. The highest resolution was
selected in the area to guarantee a good accuracy for the drawdown
prediction in this area. In the vertical direction one layer was selected.
The number of cells in x-axis is 100 the number of cells in y-axis is 100.
The total number of cells is 10000.
5.3.4 - MODEL SETUP:
The model comprises one layer to represent the Wajid Aquifer. The
bottom and top of the Wajid layer are shown in Figs. (5-2 and 5-3)
respectively.
Within the Wajid Aquifer a confined and an unconfined zone
with different hydraulic conductivities can be distinguished. The eastern
part of the model area which is overlain by younger sedimentary layers is
assumed to be fully confined while the outcrop or western area is
assumed to be unconfined and partly unsaturated.

8/7/2019 Evaluation of groundwater resources in Wajid aquifer in Wadi Dawasir area southern Saudi Arabia using computer si…
http://slidepdf.com/reader/full/evaluation-of-groundwater-resources-in-wajid-aquifer-in-wadi-dawasir-area-southern 101/164
80
4900000 4920000 4940000 4960000 4980000 5000000 5020000
2220000
2240000
2260000
2280000
2300000
2320000
2340000
Fig. (5-2): Elevation of top part of the Wajid Aquifer in meter above sea level.

8/7/2019 Evaluation of groundwater resources in Wajid aquifer in Wadi Dawasir area southern Saudi Arabia using computer si…
http://slidepdf.com/reader/full/evaluation-of-groundwater-resources-in-wajid-aquifer-in-wadi-dawasir-area-southern 102/164
81
4900000 4920000 4940000 4960000 4980000 5000000 5020000
2220000
2240000
2260000
2280000
2300000
2320000
2340000
Fig. (5-3): Elevation of the bottom part of the Wajid Aquifer in meter above sealevel.
8/7/2019 Evaluation of groundwater resources in Wajid aquifer in Wadi Dawasir area southern Saudi Arabia using computer si…
http://slidepdf.com/reader/full/evaluation-of-groundwater-resources-in-wajid-aquifer-in-wadi-dawasir-area-southern 103/164
82
Groundwater recharge is restricted only to the outcrop. For this
area an average recharge rate of 10mm/year is assumed. For the steady
and transient simulation conductivity and storage conversion from
confined to unconfined conditions are considered using distribution.
5.3.5 – STEADY STATE CALIBRITION:
5.3.5.1 - HYDRAULIC CONDUCTIVITY:
Before the calibration under steady state conditions started,
conductivities and the value of recharge must be defined for every knot
of the mesh as initial values. The hydraulic conductivities show a range
from 5.5x10⁻⁵
unconfined part to 3.0x10⁻⁸
m/s in the eastern confined part
of the aquifer. For the area an average recharge rate of 10mm/year is
assumed.
5.3.6 - TRANSIENT CONDITIONS:
Modeling under non steady state conditions started from the initial
state 1980 A.D (Fig. 5-8) taking into account the groundwater abstraction
via production wells. Model calibration involves changing input
parameters until model results match field observations. In case of a flow
model the calibration target is the spatial and temporal head distribution
as well as a plausible groundwater budget for the model domain. Initial
head distribution for transient simulation performing several runs (Figs.
5-9 to 5-11).

8/7/2019 Evaluation of groundwater resources in Wajid aquifer in Wadi Dawasir area southern Saudi Arabia using computer si…
http://slidepdf.com/reader/full/evaluation-of-groundwater-resources-in-wajid-aquifer-in-wadi-dawasir-area-southern 104/164
83
Fig. (5-4): Values of hydraulic conductivity in the Wajid Aquifer.

8/7/2019 Evaluation of groundwater resources in Wajid aquifer in Wadi Dawasir area southern Saudi Arabia using computer si…
http://slidepdf.com/reader/full/evaluation-of-groundwater-resources-in-wajid-aquifer-in-wadi-dawasir-area-southern 105/164
84
Fig. (5-5): Distribution of hydraulic conductivities in the calibration procedure
in the Wajid Aquifer.
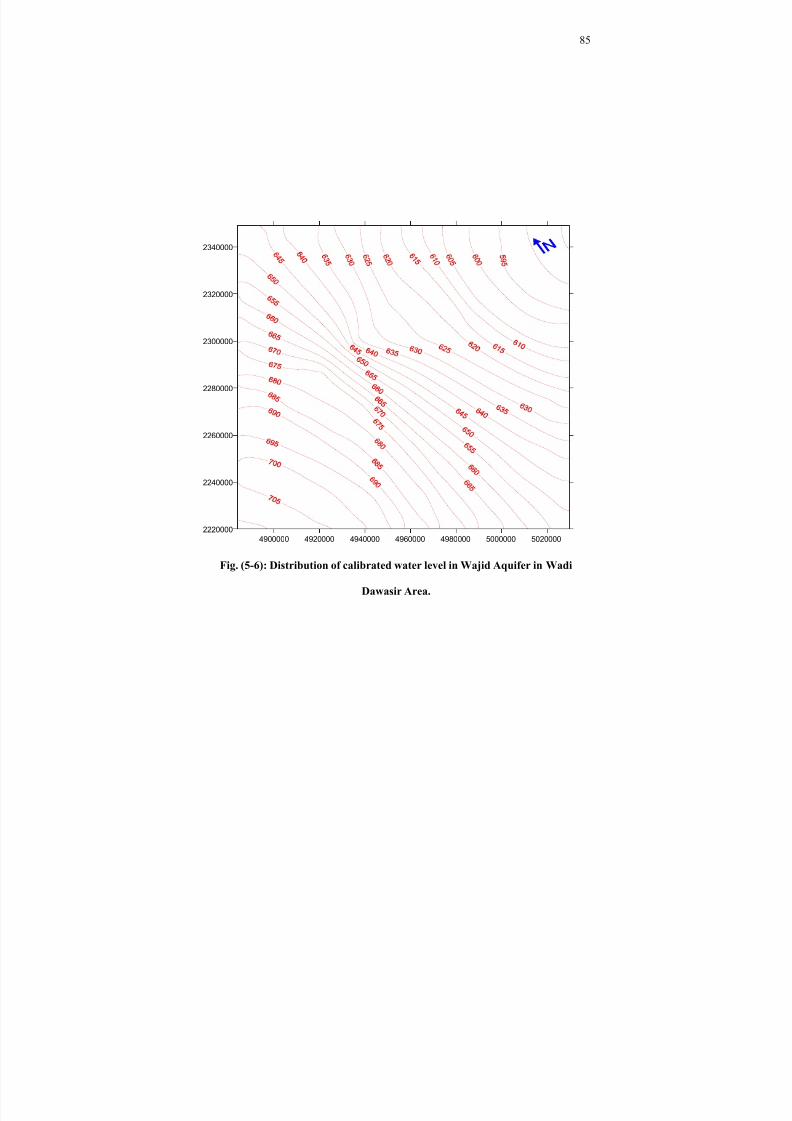
8/7/2019 Evaluation of groundwater resources in Wajid aquifer in Wadi Dawasir area southern Saudi Arabia using computer si…
http://slidepdf.com/reader/full/evaluation-of-groundwater-resources-in-wajid-aquifer-in-wadi-dawasir-area-southern 106/164
85
4900000 4920000 4940000 4960000 4980000 5000000 5020000
2220000
2240000
2260000
2280000
2300000
2320000
2340000
Fig. (5-6): Distribution of calibrated water level in Wajid Aquifer in Wadi
Dawasir Area.

8/7/2019 Evaluation of groundwater resources in Wajid aquifer in Wadi Dawasir area southern Saudi Arabia using computer si…
http://slidepdf.com/reader/full/evaluation-of-groundwater-resources-in-wajid-aquifer-in-wadi-dawasir-area-southern 107/164
86
R e c h
a r g e A r e a
I n f l o
w ( f l u x )
O u t f l o
w ( f l u x )
Fig.(5-7): Recharge in the modeled outcrop of the Wajid Aquifer found in the
calibration procedure.

8/7/2019 Evaluation of groundwater resources in Wajid aquifer in Wadi Dawasir area southern Saudi Arabia using computer si…
http://slidepdf.com/reader/full/evaluation-of-groundwater-resources-in-wajid-aquifer-in-wadi-dawasir-area-southern 108/164
87
For the area an average recharge rate of 10mm/year is assumed.
Transient simulation without pumping from the Aquifer resolution:
One time period of 60 years, time interval .20 years number of time steps
50.
5.3.7 - RESULTS AND PREDICTIONS IN MODEL:
Application On the basis of the calibrated model prognostic runs
with the maximum pumping rate from every well Q = 1800 USG/min
(6.8 m3/min) were simulated. The distribution in 51 pumping wells…
In the following the results of the Pumping rate (1800 USG/min), after 20
years, drawdown distribution descending to 43 m (Fig. 5-9) beneath the
ground surface and its Water budget (Table 5-4) then prediction
drawdown in the aquifer after 40 descending to 96 m beneath the ground
surface, and after 60 years descending to 141 m beneath the ground
surface.

8/7/2019 Evaluation of groundwater resources in Wajid aquifer in Wadi Dawasir area southern Saudi Arabia using computer si…
http://slidepdf.com/reader/full/evaluation-of-groundwater-resources-in-wajid-aquifer-in-wadi-dawasir-area-southern 109/164
88
4900000 4920000 4940000 4960000 4980000 5000000 5020000
2220000
2240000
2260000
2280000
2300000
2320000
2340000
Fig.( 5-8) Initial head distribution for transient simulation (calibrated inetial head) .
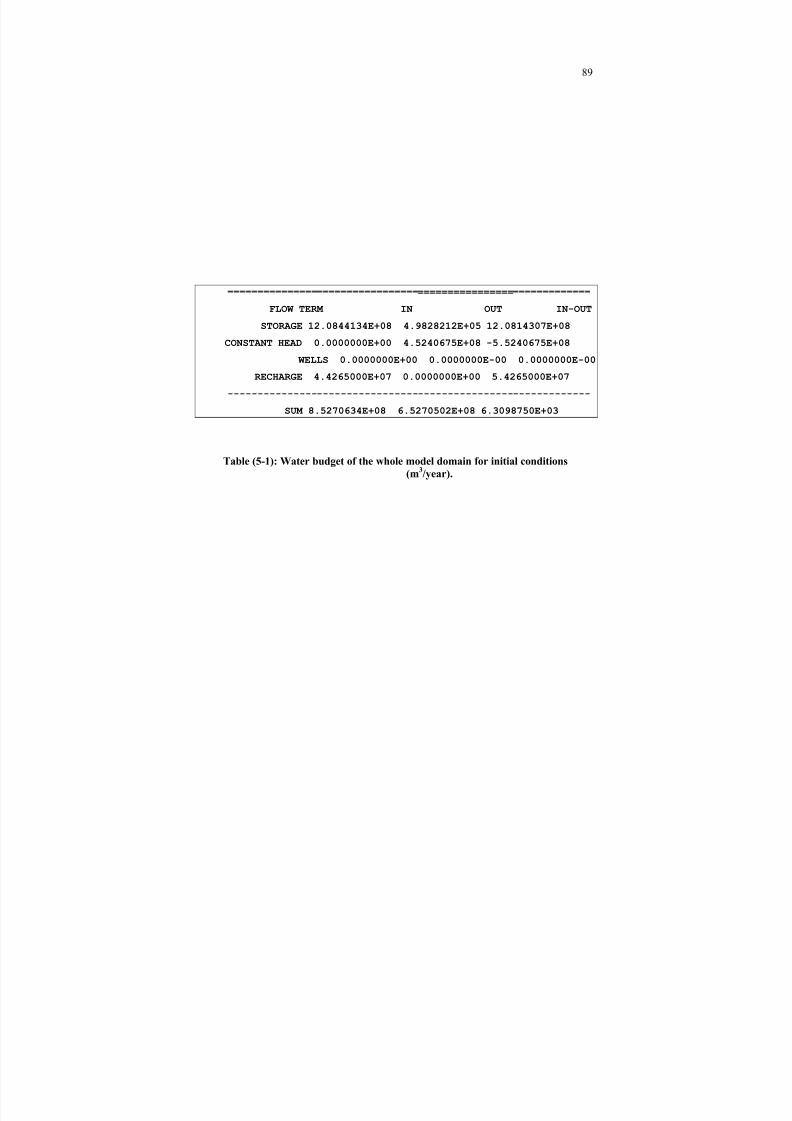
8/7/2019 Evaluation of groundwater resources in Wajid aquifer in Wadi Dawasir area southern Saudi Arabia using computer si…
http://slidepdf.com/reader/full/evaluation-of-groundwater-resources-in-wajid-aquifer-in-wadi-dawasir-area-southern 110/164
89
=============================================================
FLOW TERM IN OUT IN-OUT
STORAGE 12.0844134E+08 4.9828212E+05 12.0814307E+08
CONSTANT HEAD 0.0000000E+00 4.5240675E+08 -5.5240675E+08
WELLS 0.0000000E+00 0.0000000E-00 0.0000000E-00
RECHARGE 4.4265000E+07 0.0000000E+00 5.4265000E+07
-------------------------------------------------------------
SUM 8.5270634E+08 6.5270502E+08 6.3098750E+03
Table (5-1): Water budget of the whole model domain for initial conditions
(m3/year).

8/7/2019 Evaluation of groundwater resources in Wajid aquifer in Wadi Dawasir area southern Saudi Arabia using computer si…
http://slidepdf.com/reader/full/evaluation-of-groundwater-resources-in-wajid-aquifer-in-wadi-dawasir-area-southern 111/164
90
4900000 4920000 4940000 4960000 4980000 5000000 5020000
2220000
2240000
2260000
2280000
2300000
2320000
2340000
Fig. (5-9) : Simulated head distribution in meter above mean sea level after 20years
of pumping from the Aquifer (m3/day).
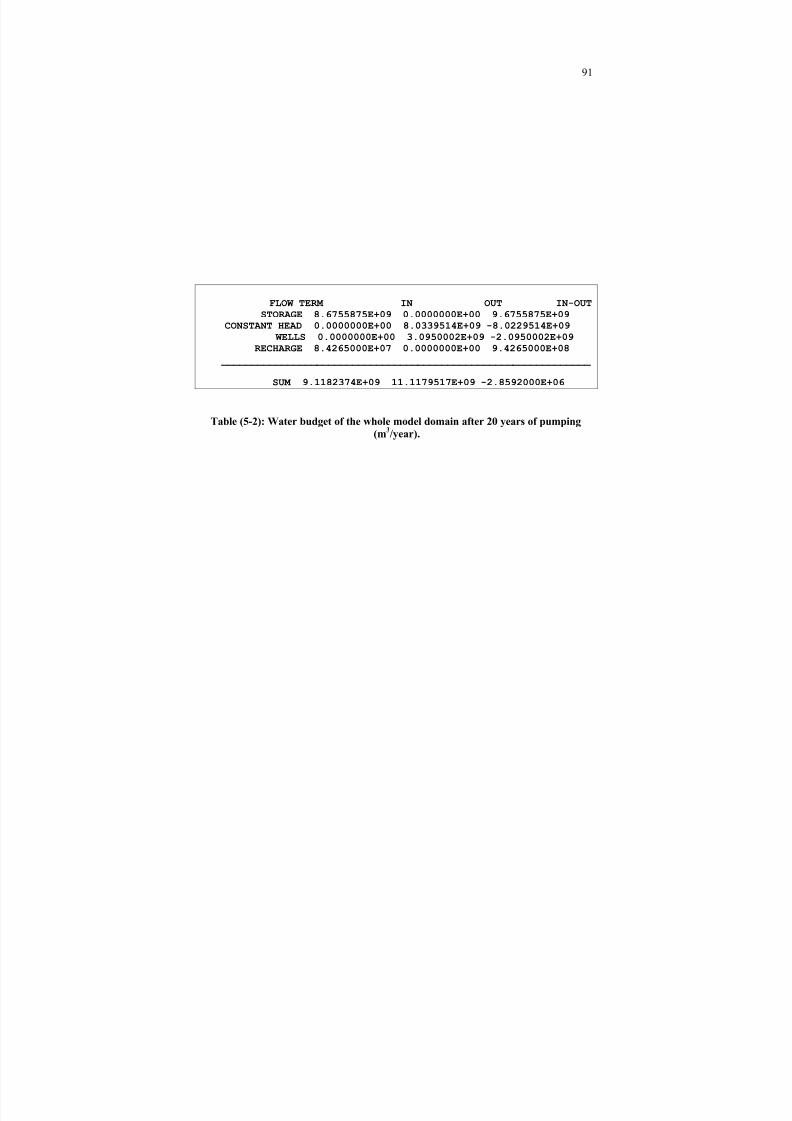
8/7/2019 Evaluation of groundwater resources in Wajid aquifer in Wadi Dawasir area southern Saudi Arabia using computer si…
http://slidepdf.com/reader/full/evaluation-of-groundwater-resources-in-wajid-aquifer-in-wadi-dawasir-area-southern 112/164
91
FLOW TERM IN OUT IN-OUTSTORAGE 8.6755875E+09 0.0000000E+00 9.6755875E+09
CONSTANT HEAD 0.0000000E+00 8.0339514E+09 -8.0229514E+09 WELLS 0.0000000E+00 3.0950002E+09 -2.0950002E+09
RECHARGE 8.4265000E+07 0.0000000E+00 9.4265000E+08 ______________________________________________________________
SUM 9.1182374E+09 11.1179517E+09 -2.8592000E+06
Table (5-2): Water budget of the whole model domain after 20 years of pumping
(m3/year).

8/7/2019 Evaluation of groundwater resources in Wajid aquifer in Wadi Dawasir area southern Saudi Arabia using computer si…
http://slidepdf.com/reader/full/evaluation-of-groundwater-resources-in-wajid-aquifer-in-wadi-dawasir-area-southern 113/164
92
4900000 4920000 4940000 4960000 4980000 5000000 5020000
2220000
2240000
2260000
2280000
2300000
2320000
2340000
Fig. (5-10): Simulated drawdown distribution in meter after 40 years of pumpingfrom the aquifer (m
3/day).

8/7/2019 Evaluation of groundwater resources in Wajid aquifer in Wadi Dawasir area southern Saudi Arabia using computer si…
http://slidepdf.com/reader/full/evaluation-of-groundwater-resources-in-wajid-aquifer-in-wadi-dawasir-area-southern 114/164
93
4900000 4920000 4940000 4960000 4980000 5000000 5020000
2220000
2240000
2260000
2280000
2300000
2320000
2340000
Fig. (5-11): Simulated drawdown distribution in meter after 60 years of pumping
from the aquifer (m3/day).

8/7/2019 Evaluation of groundwater resources in Wajid aquifer in Wadi Dawasir area southern Saudi Arabia using computer si…
http://slidepdf.com/reader/full/evaluation-of-groundwater-resources-in-wajid-aquifer-in-wadi-dawasir-area-southern 115/164
CHAPTER VI
AQUACHEM RESULTS

8/7/2019 Evaluation of groundwater resources in Wajid aquifer in Wadi Dawasir area southern Saudi Arabia using computer si…
http://slidepdf.com/reader/full/evaluation-of-groundwater-resources-in-wajid-aquifer-in-wadi-dawasir-area-southern 116/164
94
CHAPTER VI
AQUACHEM RESULTS
6.1 – STATISTICS:
Statistical analyses are considered to be a tool of research and organized
scientific study. It depends on the digital features (elements) to detect what
controls these elements or show the relationships between them. In addition to
analysis and expression of the values of these elements, these analyses are
scientifically used in water chemistry field. Table (6-1) shows a summary
statistics of the groundwater quality in the study area. The total dissolved
solids (TDS) varies from 284 mg/l to 2725 mg/l with an average of sum 854.6
mg/l. calcium (Ca
++
) concentration varies from 18 to 73 mg/l with an average
of about 36 mg/l. Magnesium (Mg++
) concentration varies from 19 to 200 mg/l
with an average of about 73 mg/l. Sodium (Na+) concentration varies from 33
to 221 mg/l with an average of about 99.7 mg/l. Potassium (K +) concentration
varies from 10 to 58 mg/l with an average of about 23.7 mg/l. Bicarbonate
(HCO3--) concentration varies from 106.3 to 259 mg/l with an average of about
173.5 mg/l. Chloride (Cl-) concentration varies from 34 to 460 mg/l with an
average of about 179.4 mg/l. sulfates (SO4--) concentration varies from 109 to
400 mg/l with an average of about 189.8 mg/l. Nitrates (NO3-) concentration
varies from 0 to 23 mg/l with an average of about 3.3 mg/l.

8/7/2019 Evaluation of groundwater resources in Wajid aquifer in Wadi Dawasir area southern Saudi Arabia using computer si…
http://slidepdf.com/reader/full/evaluation-of-groundwater-resources-in-wajid-aquifer-in-wadi-dawasir-area-southern 117/164
95
Table (6-1): Summary Statistics of Anions, Cations and TDS of wells in the study area.
Statistics Ca Mg Na K HCO3 Cl SO4
NO3 TDS
Average 73.165 36.285 99.72 23.775 173.545 179.43 189.86 3.33 854.665
Max 200 73 221 58 259 460 400 23 2725
Min 19 18 33 10.3 106.3 34 109 0 284
Standard
Deviation 39.6554 16.3865 49.6302 15.9722 35.7957 96.0569 64.6195 8.13602 501.848

8/7/2019 Evaluation of groundwater resources in Wajid aquifer in Wadi Dawasir area southern Saudi Arabia using computer si…
http://slidepdf.com/reader/full/evaluation-of-groundwater-resources-in-wajid-aquifer-in-wadi-dawasir-area-southern 118/164
96
6.1.1 - CORRELATION COEFFICIENT:
This type of statistical analysis is used in the study of the relation
between two elements so as to know the degree of correlation between them.
If we take a number of values for two elements or more differing in contents,
we shall find a natural relationship between these elements. This kind of
relationship among elements is called the correlation. Indeed, it has different
degrees of strength and solidity in correlating between each other. Such
correlation ranges between full-correlation and no-correlation. Between these
two ranges lies the incomplete correlation. In the degree of its variation, it
follows one of the variables with the other.
Indeed, all coefficients of correlation between elements are under study
in this research (Table 6-2). The degree of correlation between elements, in
this field, varies from one element to another. Some of the relations are so
strong to the degree of semi-completeness; others are so weak to the degree of
no-being. Table (6-2) represents this relation between the total components
and chemical elements. However, the general trend between two variables
expresses the correlation between them. It is not necessary that the two
elements increase together, or decreases together so as to correlate. In some
case, the relationship between two variables arises form the increase of the
content

8/7/2019 Evaluation of groundwater resources in Wajid aquifer in Wadi Dawasir area southern Saudi Arabia using computer si…
http://slidepdf.com/reader/full/evaluation-of-groundwater-resources-in-wajid-aquifer-in-wadi-dawasir-area-southern 119/164
97
Table (6-2): Correlation matrix between dissolved chemical elements in groundwater
in the study area.
8/7/2019 Evaluation of groundwater resources in Wajid aquifer in Wadi Dawasir area southern Saudi Arabia using computer si…
http://slidepdf.com/reader/full/evaluation-of-groundwater-resources-in-wajid-aquifer-in-wadi-dawasir-area-southern 120/164
98
values of one of them and the decrease of the other. Results from the increase
of the existence of a somewhat element against another. But, if the two
variables increase or decrease together, then the correlation between them is
called the direct relation. When one variable decreases against the other, their
correlation is called the reverse. Moreover, the straight-line equation that
represents the mathematical relation between the two variables can be found.
And the method of computing the minimum square is one of the methods used
in finding the straight line. This method is used in finding a straight line of a
set of pair points between two variables. This, however, requires/provides that
the total squares of point deviations from the drawn line must be minimum as
possible. It is known that the line drawn does not pass through all pair points
except in case of full correlation between the two variables.
In the sphere of water chemistry, this statistical analysis is used in
detecting basic ions causing the salinity of the geological component,
especially in the case of the correlation between water ability in connecting
electric current passing through and the other chemical elements under study
in the area.
Indeed, among the most important correlations in water chemistry, from
the statistical point of view, is the correlation between water ability in
connecting an electrical current and the total solids dissolved in water on one

8/7/2019 Evaluation of groundwater resources in Wajid aquifer in Wadi Dawasir area southern Saudi Arabia using computer si…
http://slidepdf.com/reader/full/evaluation-of-groundwater-resources-in-wajid-aquifer-in-wadi-dawasir-area-southern 121/164
99
hand, and between such ability, the total solids, other elements and the
chemical components under study (Table 6-2). In the following, the reader
will find a detailed explanation about the toughness of the correlation between
multiple chemical elements; the electric connectivity and the total dissolved
solids in water.
Moreover, from the previous table, we may conclude the following
results about the strength of the correlation of the previous two compositions
TDS and BC with the elements and multiple components in the study area.
The strongest correlations recorded were between NO3 and Mg. and total
solids dissolved in water. Their strength was 0.87. This strong relation shows
that salts, NO3 compounds, and Mg dissolved in water, caused the increase of
total solids. As known before, most of the water affected with the type of
sodium chloride compound. Perhaps, the NO3 and Mg common salts found in
water, have a great role in the increase of water salinity.
Then comes the relation of total solids dissolved in water, and the ions of
both Ca, SO4. Their strengths reach 0.87. These strengths have a great relation
with the increase of salts. In addition, Cl, Ca have also shown a strong relation
in increasing the quantity of salts. For correlation between the other elements
is moderately to wake.

8/7/2019 Evaluation of groundwater resources in Wajid aquifer in Wadi Dawasir area southern Saudi Arabia using computer si…
http://slidepdf.com/reader/full/evaluation-of-groundwater-resources-in-wajid-aquifer-in-wadi-dawasir-area-southern 122/164
100
6.1.2 - LINEAR RELATIONS:
From the linear relations we notice that there is a direct relation
represented in the increase of every element with the increase of another. This
is indeed what is shown by the strong relation in the correlation between the
two elements.
Figure (6-1) shows the distribution of Ions concentration (meq/l)
of the wells in the study area. Figure (6-2) shows the distribution of TDS &
EC (meq/l) of the wells in the study area. Figure (6-3) shows the relation
between Ca and HCO3(meq/l) of the wells in the study area. Figure (6-4)
shows the relation between chloride and sodium of the wells in the study area.
Figure (6-5) shows the relation between major Ions and TDS (meq/l) - of the
wells in the study area.

8/7/2019 Evaluation of groundwater resources in Wajid aquifer in Wadi Dawasir area southern Saudi Arabia using computer si…
http://slidepdf.com/reader/full/evaluation-of-groundwater-resources-in-wajid-aquifer-in-wadi-dawasir-area-southern 123/164
101
0
50
100
150
200
250
S U
T 4
T 5
T 6
T 8
T 1 1
T 1 2
T 2 0
T 2 1
T 2 2
K 1
D 1
D 2
D 3
D 4
D 5
D 6
D 7
D 8
M 1
Well No
C o n c e n t r a t i o n ( m g )
Ca Mg Na
0
100
200
300
400
500
S U
T 4
T 5
T 6
T 8
T 1 1
T 1 2
T 2 0
T 2 1
T 2 2
K 1
D 1
D 2
D 3
D 4
D 5
D 6
D 7
D 8
M
1
Well No
C o n c e n t r a t i o n
( M g )
K HCO3 SO4
Fig. (6-1): Distribution of major ions concentration in Wajid Aquifer
0
500
10001500
2000
2500
3000
S U T 4 T 5 T 6 T 8 T 1 1 T 1
2 T 2
0 T 2
1 T 2
2 K 1 D 1 D 2 D 3 D 4 D 5 D 6 D 7 D 8 M 1
Well No
C o n c e n
t r a t i o n
TDS (mg/l) Ec (us/cm)
Fig. (6-2): Distribution of TDS & EC of the wells in the study area.

8/7/2019 Evaluation of groundwater resources in Wajid aquifer in Wadi Dawasir area southern Saudi Arabia using computer si…
http://slidepdf.com/reader/full/evaluation-of-groundwater-resources-in-wajid-aquifer-in-wadi-dawasir-area-southern 124/164
102
0
50
100
150
200
250
0 50 100 150 200 250 300
HCO3 (mg/l)
Ca
Fig. (6-3): Relation between Ca and HCO3.
0
2
4
6
8
10
12
0 2 4 6 8 10 12 14
Cl
N a
Fig. (6-4): Relation between Cl & Na.

8/7/2019 Evaluation of groundwater resources in Wajid aquifer in Wadi Dawasir area southern Saudi Arabia using computer si…
http://slidepdf.com/reader/full/evaluation-of-groundwater-resources-in-wajid-aquifer-in-wadi-dawasir-area-southern 125/164
103
0
1
2
3
4
5
6
7
0 10 20 30 40 50
TDS
M
g
0
2
4
6
8
10
12
0 10 20 30 40 50
TDS
C
a
0
0.2
0.4
0.6
0.8
1
1.2
1.4
1.6
0 10 20 30 40 50
TDS
K
0
2
4
6
8
10
12
0 10 20 30 40 50
TDS
N a
0
1
23
4
5
6
7
8
9
0 10 20 30 40 50
TDS
S O
4
0
2
4
6
8
10
12
14
0 10 20 30 40 50
TDS
C l
Fig. (6- 5): Relationship between major Ions and TDS (meq/l).

8/7/2019 Evaluation of groundwater resources in Wajid aquifer in Wadi Dawasir area southern Saudi Arabia using computer si…
http://slidepdf.com/reader/full/evaluation-of-groundwater-resources-in-wajid-aquifer-in-wadi-dawasir-area-southern 126/164
104
6.2 - IDENTIFICATION OF GROUNDWATE CHARACTER:
6.2.1 - WATER TYPE IN THE STUDY AREA:
Identification of water type in the study area is so important in
determining the size of the most existing salts contained in water.
6.2.1.1 - PIPER TRILINEAR DIAGRAM:
This representation of chemical data is the most common, and the oldest
use of chemistry in recognizing the type of water in geological components.
The process of manifestation/demonstration, in case of the representation
in this method, is by dropping the percentages of chemical analysis involved
in groundwater. This is done in two separate triangles, one of which represents
the element concentration ratios cation half (epm) of calcium ions, sodium
potassium and magnesium. The other represents the percentages of anion
element concentrations with the same unit (emp) of bicarbonate sulfate and
Chloride ions.
Then the points shown on the two triangles of the percentages of the two
sides will be moved to the specific figure in a parallel line (from the two
points) until they cross each other. The points where they meet represent the
type of water of the sample to be detected. In this study, I have used the
Aquachem Program for the drawing of piper trilinear diagram (Fig. 6-6).

8/7/2019 Evaluation of groundwater resources in Wajid aquifer in Wadi Dawasir area southern Saudi Arabia using computer si…
http://slidepdf.com/reader/full/evaluation-of-groundwater-resources-in-wajid-aquifer-in-wadi-dawasir-area-southern 127/164
105
6.2.1.2 - DUROVE'S DIAGRAM:
The expanded of Durove diagram has the distinct advantage over
the piper diagram in that it provides a better display of hydrochemical types
and some processes, and in practical terms has less line work in the main
field.
Generally, thee types of water saturate with dissolved salts, which differ in
construction from one place to another in the study area (Fig. 6-7). These
types are as follows:
1-Type 2: HCO3- dominant and eight Mg
2+dominant or cations
indiscriminant, with Mg2+
dominant or Ca2+
and Mg2+
important, indicates
waters often associated with dolomites; where Ca2+
and Na+
are important
partial
ion exchange may be indicated. This type of water represented in
wells (D5, D8,T11).
2- Type 5: this type represented in wells (D3,D6,D7,SU, T4, T5, T6, T8, T12,
T21, T22.) it is indicate that no dominant anion or cation, indicates water
exhibiting simple dissolution or mixing.
3- Type 8: represented by wells (D1,D4,K1,M1T20,) that mean Cl-
and no
dominant cation indicates that the groundwater may be related to reverse
ion exchange of Na+- Cl
-water.

8/7/2019 Evaluation of groundwater resources in Wajid aquifer in Wadi Dawasir area southern Saudi Arabia using computer si…
http://slidepdf.com/reader/full/evaluation-of-groundwater-resources-in-wajid-aquifer-in-wadi-dawasir-area-southern 128/164
106
Fig. (6-6): Piper diagram of major ions in the study area.

8/7/2019 Evaluation of groundwater resources in Wajid aquifer in Wadi Dawasir area southern Saudi Arabia using computer si…
http://slidepdf.com/reader/full/evaluation-of-groundwater-resources-in-wajid-aquifer-in-wadi-dawasir-area-southern 129/164
107
Fig. (6-7): Water type using Durove Diagram in the study area.

8/7/2019 Evaluation of groundwater resources in Wajid aquifer in Wadi Dawasir area southern Saudi Arabia using computer si…
http://slidepdf.com/reader/full/evaluation-of-groundwater-resources-in-wajid-aquifer-in-wadi-dawasir-area-southern 130/164
108
Figure (6-8) concerns the type of water in the study-area wells, there is a
milliequivalent as shown in Table (6-3).
6.3 - IDENTIFICATION OF CHEMICAL PROCESS EFFECT OF
GROUNDWATER QUALITY:
6.3.1 - CHEMICAL WEATHERING OF SILICATE MINERALS:
In the chemical evolution of groundwater in Igneous and Metamorphic
rocks, the dissolution of these minerals is strongly influenced by the chemical
aggressive nature of water caused by dissolved (CO2). When water has an
abundant supply of (CO2), carbonic acid (H2CO3) will form as a result of (Co2)
combining with water. In the presence of (H2Co3), silicate minerals,
Aluminum, silica, and cations are leached, leaving an aluminosilicate residue,
which is usually a clay mineral such as kaolinite. The cations released to the
water are normally Na+, K
+, Mg
++, silica and Ca
++.
The chemical analysis of the groundwater showed that the concentration
of all these constituents (Na+, K
+, Mg
++and Ca
++) are many tines greater than
the in rain water which indicates that the weathering of silicate minerals are
likely the main source that lead to increasing the ions concentrations in the
groundwater. Weathering of Albite and Anorthite are a good example showing
a release of Na+
and Ca++
to groundwater. On the other hand, (Mg++
) can also

8/7/2019 Evaluation of groundwater resources in Wajid aquifer in Wadi Dawasir area southern Saudi Arabia using computer si…
http://slidepdf.com/reader/full/evaluation-of-groundwater-resources-in-wajid-aquifer-in-wadi-dawasir-area-southern 131/164
109
Table (6-3) :Water type in the study area according to Durove plot.

8/7/2019 Evaluation of groundwater resources in Wajid aquifer in Wadi Dawasir area southern Saudi Arabia using computer si…
http://slidepdf.com/reader/full/evaluation-of-groundwater-resources-in-wajid-aquifer-in-wadi-dawasir-area-southern 132/164
110
Fig. (6-8): Water types in the study area according the Durove plot.

8/7/2019 Evaluation of groundwater resources in Wajid aquifer in Wadi Dawasir area southern Saudi Arabia using computer si…
http://slidepdf.com/reader/full/evaluation-of-groundwater-resources-in-wajid-aquifer-in-wadi-dawasir-area-southern 133/164
111
enter the solution as a result of weathering of biotite. The weathering reaction
involved is given by the following equation:
* KMg3ALSi3O10(OH)2(s)+7H2CO3+1/2H2O=K+Mg+7HCO3+2H4SiO4+1/2Al2Si2O5(OH)4(s)
(Biotite) (Kaolinite)
* CaAl2Si2O8+H2O+2H= Al2Si2O5(OH)4+Ca
(Anorthite)
* 2NaAlSi3O82H+9H2O=Al2Si2O5(OH)4+4H4SiO4+2Na
(Albite)
However, the ions concentration released to the groundwater mainly the
degree of weathering taking place in silicate minerals. The differences in
weathering processes can be noticed from the relationship between Ca++
and
Mg++
which shows Ca++
is predominating over Mg++
suggesting that
dissolution of plagioclase may be twice as important as dissolution of
ferromagnesium.

8/7/2019 Evaluation of groundwater resources in Wajid aquifer in Wadi Dawasir area southern Saudi Arabia using computer si…
http://slidepdf.com/reader/full/evaluation-of-groundwater-resources-in-wajid-aquifer-in-wadi-dawasir-area-southern 134/164
112
6.3.2 - PRECIPITATION AND DISSOLUTION OF MINERAL:
Saturation of indices are calculated (Table 6-4). Figure (6-9) show that
most of the groundwater samples tend to in little precipitate calcite, dolomite,
and partially gypsum but capable to dissolving halite.
6.3.3 - APPRAISAL OF GROUNDWATER UTILITY:
The all chemical analysis process of water aim at recognizing the extent of
the utilization of the consuming sectors. They make of these waters for
multiple consumption purposes in agriculture, industry and civil purposes.
6.4 - SUITABILITY OF GROUNDWATER FOR DOMESTIC
PURPOSES:
6.4.1 - TOTAL HARDNESS (TH):
Water hardness appears as a result of the existence of high concentrations
of ions that have binary valence in water, especially ions of Ca++
and Mg++
.
The effect of the degree of hardness appears in water interaction with soap to
form foam. Foam formations appear to be hard in water having great hardness.
Water hardness is considered to be a measurement of the: content of both
magnesium and calcium elements. Water hardness is normally expressed
through its valence to CaCO3 which are measured by ppm and which gives
the following relation:

8/7/2019 Evaluation of groundwater resources in Wajid aquifer in Wadi Dawasir area southern Saudi Arabia using computer si…
http://slidepdf.com/reader/full/evaluation-of-groundwater-resources-in-wajid-aquifer-in-wadi-dawasir-area-southern 135/164
113
WellName Calcite Dolomite Gypsum Anhydrite
D1 0.348114 1.029889-
1.44992 -1.66963
D2 0.468834 1.284979-
1.63562 -1.8554
D3 0.434554 1.315125-
1.74924 -1.96911
D4 0.032065 0.617599-
1.82138 -2.04121
D5 0.212429 0.844969-
2.07637 -2.29631
D6 0.27837 0.953837-
1.56119 -1.78098
D7 0.27926 1.028482-
1.72015 -1.94002
D8 0.297434 1.127663-
2.15488 -2.37481
K1 1.313423 2.263041-
0.84992 -1.06956
M1 0.260376 0.469243-
1.57173 -1.79162
SU -0.73307 -1.55345 -1.6564 -1.87632
T11 -0.77818 -1.9202-
1.38162 -1.60151
T12 -0.31069 -0.76481-
1.35183 -1.57168
T20 0.427399 0.684143-
1.18617 -1.40596
T21 0.683244 1.185416-
1.30897 -1.52878
T22 0.375269 0.573414-
1.25635 -1.47618
T4 -0.46249 -1.06416 -1.35965 -1.57949
T5 -0.5148 -1.24391-
1.34754 -1.56739
T6 -1.0265 -2.26701 -1.5208 -1.74068
T8 -0.77362 -1.68367-
1.29266 -1.51253
Table (6-4): Saturation indices of various minerals.

8/7/2019 Evaluation of groundwater resources in Wajid aquifer in Wadi Dawasir area southern Saudi Arabia using computer si…
http://slidepdf.com/reader/full/evaluation-of-groundwater-resources-in-wajid-aquifer-in-wadi-dawasir-area-southern 136/164
114
Fig. (6-9): Saturation index of minerals.
-2.5
-2
-1.5
-1
-0.5
0
0 500 1000 1500 2000
Saturation Indix
c a l c u l a t
e d
T D S ( m
g / l )
Gypsum_si Anhydrite_si
-2.5
-2
-1.5
-1
-0.5
0
0.5
1
1.5
2
2.5
0 200 400 600 800 1000 1200 1400 1600
Saturation Index
C
a l c u
l a t e d
T
D
S
m
/ L
#Calcite_si
#Dolomite_si

8/7/2019 Evaluation of groundwater resources in Wajid aquifer in Wadi Dawasir area southern Saudi Arabia using computer si…
http://slidepdf.com/reader/full/evaluation-of-groundwater-resources-in-wajid-aquifer-in-wadi-dawasir-area-southern 137/164
115
TH =Ca*(CaCO3/Ca)*Mg (CaCO3/Mg)
The equation above, however, can be reduced to give the total hardness
value of water as in the following:
TH = 3.15 *Mg++
+ (2.14 *Ca++
)
The two ions involved in calculating the total hardness amount with the
same measurements unit as above (ppm). Whereas, averaging the degree of
total water hardness depends on the classification measurement shown in
Table (6-5) (Todd, 1980).
The total hardness value of the groundwater in the study area ranges between
128.98 mg/l as minimum and 550.85 mg/l as maximum. This shows an
average value of 270.871 mg/l.
Figure (6-10) shows the distribution of groundwater's total hardness in the
study area, although most of the calcium compounds are easily dissolved in
pure water. Certainly, the existence of C02 increases the average of its easy
dissolution. And most salts containing magnesium are easy to dissolve. As for
alkaline waters, they closely correlate with the hardness of water (Marier,
1979). In the study area, the total hardness value of groundwater ranges
between 128.98

8/7/2019 Evaluation of groundwater resources in Wajid aquifer in Wadi Dawasir area southern Saudi Arabia using computer si…
http://slidepdf.com/reader/full/evaluation-of-groundwater-resources-in-wajid-aquifer-in-wadi-dawasir-area-southern 138/164
116
Type of water Total Harness Value (TH)
1. Soft water Less than 75
2. Mean Hardness 75-150
3. Hard Water 150-300
4. Very Hard Water More than 300
Table (6-5): Classification of Water According of the Total Hardness Value (TH)
(Todd, 1980).

8/7/2019 Evaluation of groundwater resources in Wajid aquifer in Wadi Dawasir area southern Saudi Arabia using computer si…
http://slidepdf.com/reader/full/evaluation-of-groundwater-resources-in-wajid-aquifer-in-wadi-dawasir-area-southern 139/164
117
Fig. (6-10): Concentration of TH of the groundwater in the study area.

8/7/2019 Evaluation of groundwater resources in Wajid aquifer in Wadi Dawasir area southern Saudi Arabia using computer si…
http://slidepdf.com/reader/full/evaluation-of-groundwater-resources-in-wajid-aquifer-in-wadi-dawasir-area-southern 140/164
118
mg/l as minimum, and 550.85 mg/I as maximum. Whereas, the average
amount value is 270.871 mg/l.
6.5 – DRINK ABILITY OF GROUNDWATER:
The civil sector is the first among the sectors making use of natural
water. To identify the degree of this utilization, water features must be
characterized with some satisfaction/acceptance by the consumer and with a
good quality.
Indeed, the use of waters for human purposes has multiple sides and forms.
The degree of utilization, however, depends on the following criteria:
• Change in water physical features, which include the difference in
taste, smell, color and disturbance.
• The existences of substances with physiological effect: sulfur, sodium,
chloride, nitrate, etc….
Natural water, in fact, divides into multiple categories according to its
suitability for human utilization, mainly drinking water. This division is on the
basis of the values of the dissolved solids concentration in water as shown in
Table (6-6) (classification of water for human drinking purposes as per the
degree of the dissolved solids concentration (Davis & De Wiest, 1966).
Table (6-7) shows the maximum limits of the concentration of elements
dissolved in water valid for drinking by:

8/7/2019 Evaluation of groundwater resources in Wajid aquifer in Wadi Dawasir area southern Saudi Arabia using computer si…
http://slidepdf.com/reader/full/evaluation-of-groundwater-resources-in-wajid-aquifer-in-wadi-dawasir-area-southern 141/164
119
• Saudi Arabian standards Organization (SASO), 1984.
• Environmental Protection Agency (EPA, USA), 1990.
• World Health Organization (WHO)-Europe, 1971 & Worldly, 1984.
Consequently and compare the analysis with different standards, we find non
suitable groundwater for domestic purposes and drink ability except after
treatment.
6.6 - SUITABILITY OF GROUNDWATER FOR AGRICULTURE
ACTIVITY:
The validity of water for agricultural purposes is governed by the chemical
effect of such water, both on the soil penetrative and plant growth. Among the
most important factors identifying the validity of water for irrigation purposes
is the ability of such waters in absorbing the sodium element. Some of the
soils containing sodium which is highly subject to ion exchange show
invalidity for agricultural uses.
The reason is because of the increase of sodium in irrigation water, which
results in decreasing the penetrative of the soil.
The soil is penetrative, indeed, when irrigation water contains quantities
equal or more than the sodium concentration in water, even when the total

8/7/2019 Evaluation of groundwater resources in Wajid aquifer in Wadi Dawasir area southern Saudi Arabia using computer si…
http://slidepdf.com/reader/full/evaluation-of-groundwater-resources-in-wajid-aquifer-in-wadi-dawasir-area-southern 142/164
120
The general extent of the values of the
dissolved solid substances concentration in
water Type of water
0-1,000 ppm Fresh water
1,000-10,000 Little saline water
10,000-100,000 Saline water
More than 100,000 Very saline water
Table (6-6): Classification of water for human drinking purposes as per the degree
of the dissolved solids concentration. (Davis & De Wiest, 1966).

8/7/2019 Evaluation of groundwater resources in Wajid aquifer in Wadi Dawasir area southern Saudi Arabia using computer si…
http://slidepdf.com/reader/full/evaluation-of-groundwater-resources-in-wajid-aquifer-in-wadi-dawasir-area-southern 143/164
121
MAXIMUM LIMIT IN mg/l
WHOEPA
1990
SASO
1984
PARAMETERS
EUROPE1971WORLD1984
75-2002000.05200Ca
30-12530-15020150Mg
200Na
10K Fe
0.05NH4
SiO2
200-600250250600Cl
F
HCO3
NO2
50-10045-104445NO3
250400250400SO4
PO4
7.5-8.56.5-8.58.5PH
10001500TDS
1500Cond
500500500500TH
SASO: SAUDI ARABIAN STANDARDS ORGANIZATIONEPA : ENVIRONMENTAL PROTECTION AGENCY
WHO : WORLD HEALTH ORGANIZATION
Table (6-7): Locally and international drinking water standards.

8/7/2019 Evaluation of groundwater resources in Wajid aquifer in Wadi Dawasir area southern Saudi Arabia using computer si…
http://slidepdf.com/reader/full/evaluation-of-groundwater-resources-in-wajid-aquifer-in-wadi-dawasir-area-southern 144/164
122
solids dissolved in water is high. The ratio of sodium absorption shows the
validity of water for irrigation purposes in general.
6.6.1 - SODIUM ABSORPTION RATIO (SAR):
Water content of sodium shows sodium absorption ratio (SAR), which is
given according to the following mathematical equation:
SAR = Na /((Mg+Ca)/2)1/2)
The concentrations of sodium, magnesium, calcium are measured by the
unit of milliequivalent. As for the ratio of sodium absorption, it does not have
a measurement unit.
Table (6-8) shows the ratio of sodium absorption in the study area. The
contour map (Fig 6-11) also shows the distribution of sodium absorption
(SAR) in the study area. That is in addition to the area, which are the most
suitable for irrigation water. Figure (6-12) shows the classification of water
on the basis of sodium absorption and electric connectivity on the study area.
So far, the following shows in Table (6-9) (Dradka, 1988; Abu-Rizaiza, 1985).
The values of electric connectivity in the study area lie within the saline water
(which is used for some types of plants), and within the very saline water
(which is not suitable for irrigation and which is rarely used for some types of
plants). That is when comparing the results of electric connectivity in Table

8/7/2019 Evaluation of groundwater resources in Wajid aquifer in Wadi Dawasir area southern Saudi Arabia using computer si…
http://slidepdf.com/reader/full/evaluation-of-groundwater-resources-in-wajid-aquifer-in-wadi-dawasir-area-southern 145/164
123
Well
name SAR MH
D1 4.47726 61.5719
D2 4.24703 62.24569
D3 2.41542 67.44208
D4 1.46415 72.64954
D5 1.12831 66.08409
D6 3.4992 64.93224
D7 2.61768 68.73312
D8 1.3139 71.56218
K1 1.88018 24.32826
M1 0.83924 39.74022
SU 2.50235 37.91254
T11 1.29606 24.4048
T12 2.59209 34.9502
T20 3.03998 33.54731
T21 2.5567 32.88233
T22 2.5705 33.2075
T4 2.32583 35.18556
T5 2.3039 31.35969
T6 1.83957 31.34529
T8 2.01481 35.38687
Table (6-8) : Data of SAR, MH, in the study area.

8/7/2019 Evaluation of groundwater resources in Wajid aquifer in Wadi Dawasir area southern Saudi Arabia using computer si…
http://slidepdf.com/reader/full/evaluation-of-groundwater-resources-in-wajid-aquifer-in-wadi-dawasir-area-southern 146/164
124
44.8 44.9 45 45.1 45.2 45.3 45.4 45.5 45.619.8
19.9
20
20.1
20.2
20.3
20.4
20.5
20.6
0.8
1
1.2
1.4
1.6
1.8
2
2.2
2.4
2.6
2.8
3
3.2
3.4
3.6
3.8
4
4.2
4.4
4.6
0 10 20 Km
Fig. (6-11): Concentration of sodium adsorption ratio (SAR) of groundwater in the
study area.

8/7/2019 Evaluation of groundwater resources in Wajid aquifer in Wadi Dawasir area southern Saudi Arabia using computer si…
http://slidepdf.com/reader/full/evaluation-of-groundwater-resources-in-wajid-aquifer-in-wadi-dawasir-area-southern 147/164
125
Water salinity Appllances Electric connection
microohm/cm at 25oC
Low
For most of crops in
the majority type of
soil
250
Intermediate
Suitable for most
conditions and for the
soil which has
moderate drainage
250-270
High
For plants resisting
salts and soil with
suitable drainage
270-2250
Very high
Can be used in
special conditions
and for very resistant
plants (with very high
drainge)
2250-5000
Table (6-9): Classification of irrigation water in the USA
(Dradka, 1988; Abu-Rizaiza, 1985)

8/7/2019 Evaluation of groundwater resources in Wajid aquifer in Wadi Dawasir area southern Saudi Arabia using computer si…
http://slidepdf.com/reader/full/evaluation-of-groundwater-resources-in-wajid-aquifer-in-wadi-dawasir-area-southern 148/164
126
Fig. (6-12): Classification of water on the basis of sodium absorption and electrical
conductivity on the study area.
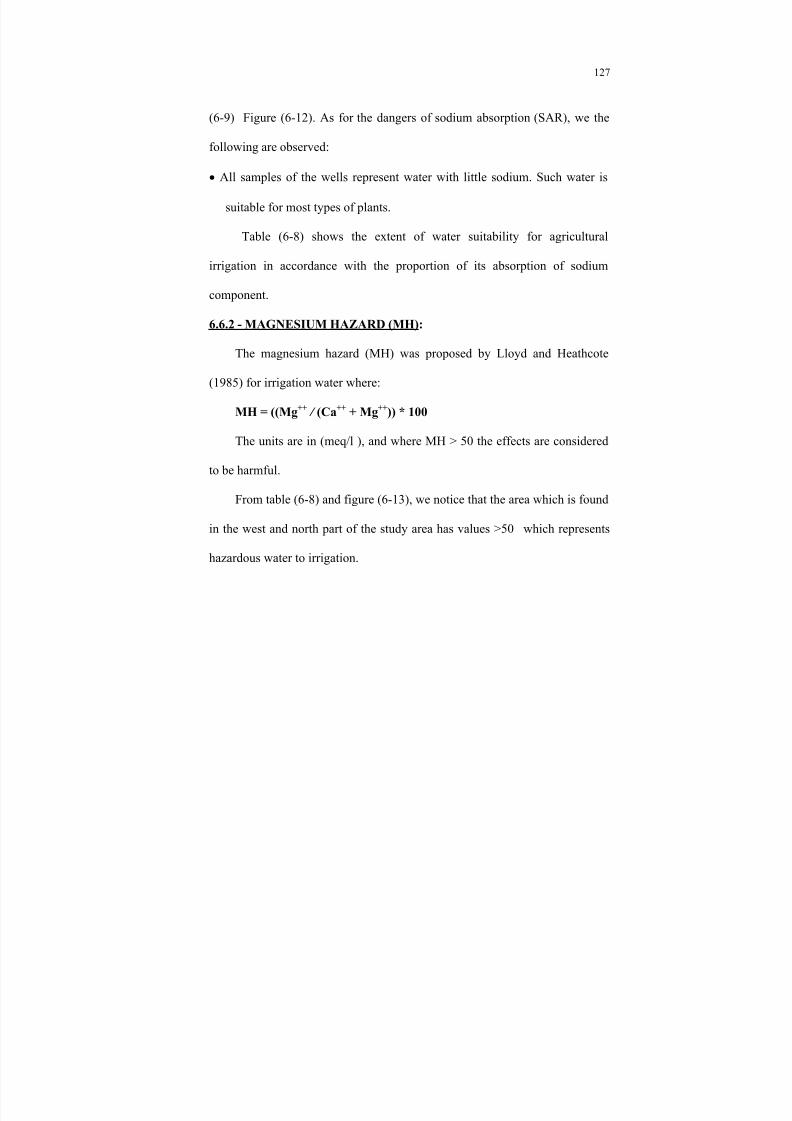
8/7/2019 Evaluation of groundwater resources in Wajid aquifer in Wadi Dawasir area southern Saudi Arabia using computer si…
http://slidepdf.com/reader/full/evaluation-of-groundwater-resources-in-wajid-aquifer-in-wadi-dawasir-area-southern 149/164
127
(6-9) Figure (6-12). As for the dangers of sodium absorption (SAR), we the
following are observed:
• All samples of the wells represent water with little sodium. Such water is
suitable for most types of plants.
Table (6-8) shows the extent of water suitability for agricultural
irrigation in accordance with the proportion of its absorption of sodium
component.
6.6.2 - MAGNESIUM HAZARD (MH):
The magnesium hazard (MH) was proposed by Lloyd and Heathcote
(1985) for irrigation water where:
MH = ((Mg++
/ (Ca++
+ Mg++
)) * 100
The units are in (meq/l ), and where MH > 50 the effects are considered
to be harmful.
From table (6-8) and figure (6-13), we notice that the area which is found
in the west and north part of the study area has values >50 which represents
hazardous water to irrigation.

8/7/2019 Evaluation of groundwater resources in Wajid aquifer in Wadi Dawasir area southern Saudi Arabia using computer si…
http://slidepdf.com/reader/full/evaluation-of-groundwater-resources-in-wajid-aquifer-in-wadi-dawasir-area-southern 150/164
128
44.8 44.9 45 45.1 45.2 45.3 45.4 45.5 45.6
19.8
19.9
20
20.1
20.2
20.3
20.4
20.5
20.6
24
26
28
30
32
34
36
38
40
42
44
46
48
50
52
54
56
58
60
62
64
66
68
70
72
0 10 20 km
Fig. (6-13): Concentration of magnesium hazard of the groundwater in the study area.

8/7/2019 Evaluation of groundwater resources in Wajid aquifer in Wadi Dawasir area southern Saudi Arabia using computer si…
http://slidepdf.com/reader/full/evaluation-of-groundwater-resources-in-wajid-aquifer-in-wadi-dawasir-area-southern 151/164
CHAPTER VII
CONCLUSIONS
&
RECOMMENDATIONS

8/7/2019 Evaluation of groundwater resources in Wajid aquifer in Wadi Dawasir area southern Saudi Arabia using computer si…
http://slidepdf.com/reader/full/evaluation-of-groundwater-resources-in-wajid-aquifer-in-wadi-dawasir-area-southern 152/164

8/7/2019 Evaluation of groundwater resources in Wajid aquifer in Wadi Dawasir area southern Saudi Arabia using computer si…
http://slidepdf.com/reader/full/evaluation-of-groundwater-resources-in-wajid-aquifer-in-wadi-dawasir-area-southern 153/164
130
Probably there is a leakage occurring from Wajid Aquifer to the
overlaying aquifers especially Khuff Formation due to high piezometeric
pressure and the faults.
Salinity of the groundwater of the Wajid Aquifer varies from 550 to
1300 ppm of TDS. The high salinity values were concentrated in agricultural
areas because high of withdrawal.
Data analyses shows that the Wajid has a high transmissivity up to
2x10⁻²
square meter per second and storage coefficient of 2x10⁻⁴
The water level in Wajid Aquifer was very flowing (91.4 above the ground
surface in Sulayyil village (ITALCONSULT 1969)) to about 150 meters
below ground surface (2002) in the agriculture areas.
Iniquitous exploitation of groundwater in Wajid Aquifer caused
decreasing of water level so it well be affecting of water quality.
In the following the results of the Pumping rate (1800 USG/min),
drawdown distribution after 20 years equal 43m, then prediction drawdown in
the aquifer after 40 reach to 90 m and after 60 years drawdown in the aquifer
arrives 141m.

8/7/2019 Evaluation of groundwater resources in Wajid aquifer in Wadi Dawasir area southern Saudi Arabia using computer si…
http://slidepdf.com/reader/full/evaluation-of-groundwater-resources-in-wajid-aquifer-in-wadi-dawasir-area-southern 154/164
131
7.2 – RECOMMENDATIONS:
* This study recommends to determine the extent of the aquifer from the east
side under Rub`Alkhaly desert.
* A chemical analysis of water taken from Wajid Aquifer should be conducted
periodically and solute transport model is recommended to monitor future
deterioration of the water quality.
* Stop wells drilling. This management action can help to avoid water
level decreasing and to avoid increasing in water salinity.
* New wells when drilled should take into consideration not to be close
to each other so that their cone of depression do not interfere. The
radius of influence should be taken in consideration.
* Restrict the agriculture crops to low water demanding products.
* Find alternatives for traditional agricultural irrigation through modern
irrigation such as sprinkle system.

8/7/2019 Evaluation of groundwater resources in Wajid aquifer in Wadi Dawasir area southern Saudi Arabia using computer si…
http://slidepdf.com/reader/full/evaluation-of-groundwater-resources-in-wajid-aquifer-in-wadi-dawasir-area-southern 155/164
132
REFERENCES
Al-Bassam, A.M.; H.S. Awad; and J.A. Al-Alawi, (1997): "Durov Plot: a computer
program for processing and plotting of hydrochemical data" Groundwater
Journal, Vol. 35, No. 2 , pp. 362-367.
Abu Rizaiza, O.S., (1985): "Study of growndwater in north Jeddah(Sponsored by
Water and Sewage Department Western Region). Kingdom of Saudi Arabia,
King Abdulaziz University, College of Engineering, Volume 1, Final Report.
Bouwer, H., (1979)(ed.): "Groundwater Hydrology" McGraw- Hill Book, New York,
499p.
Brock, M.R., (1983): "Reconnaissance geologic map of the Jabal Zain quadrangle,
sheet 20/44 A, Kingdom of Saudi Arabia: Saudi Arabian Deputy Ministry for
Mineral Resources Open-File Report USGS-OF-03-106, scale 1:100 000.
Burdon, D.J., and S. Mazlum, (1958): "Some chemical types of groundwater from
Syria" UNESCO Symposium, Tehran, pp. 73-90.
Dabbagh, M.E., (1981)(ed.):" Environmental interpretation and tectonic significanceof the Wajid Sandstone, Saudi Arabia" M.Sc. of Science, University of North
Carolina, U.S.A., 84p.
Dabbagh, M.E. and J.J.W. Rogers, (1983): "Depositional environments and tectonic
significance of the Wajid Sandstone of southern Saudi Arabia" Journal of African Earth Sciences, Volume 1, Issue 1, pp. 47-57 .
Davis, S.N., and R.J.M. De Wiest., (1966)(eds.): "Hydrogeology" John Wiley and
Sons, New York, 463 p.
Dradka, K., (1988): "Hydrogeology" (in Arabic), Al Basheer House, Amman, Jordan.
Durove, S.A., (1948): "Natural waters and their graphic representation of their
composition" Doklady Akad. Nauk., U.S.S.R., Volume 59, pp. 87-90.
Freeze A.R. and J.A. Cherry, (1979) (eds.): "Groundwater" Prentice - Hall, Inc.Englewood Cliffs, New Jersey, 604p.
Greenwood, W.R.; R.E. Anderson; R.J. Fleck and R.J. Roberts, (1980):
"Precambrian geologic history and plate tectonic evolution of the Arabian
Shield" Saudi Arabian Directorate General of Mineral Resources Bulletin, No.
24, 35p.
Greenwood, W.R.; D.B. Stoeser; R.J. Fleck and J.S. Stacey, (1982): "Late
Proterozoic island-arc complexes and tectonic belts in the southern part of the
Arabian Shield, Kingdom of Saudi Arabia" Saudi Arabian Deputy Ministry for
Mineral Resources Open-File Report USGS-OF-02-8, 46p.

8/7/2019 Evaluation of groundwater resources in Wajid aquifer in Wadi Dawasir area southern Saudi Arabia using computer si…
http://slidepdf.com/reader/full/evaluation-of-groundwater-resources-in-wajid-aquifer-in-wadi-dawasir-area-southern 156/164

8/7/2019 Evaluation of groundwater resources in Wajid aquifer in Wadi Dawasir area southern Saudi Arabia using computer si…
http://slidepdf.com/reader/full/evaluation-of-groundwater-resources-in-wajid-aquifer-in-wadi-dawasir-area-southern 157/164
134
Moshrif. M.A. and El-Hiti. A. (1989): "Lithofacies and petrography of Wajid
sandstone (Cambrian-Ordovician) Saudi Arabia" Journal of African Earth
Sciences, Volume 9, Issues 3-4, 1989, pp. 401-412.
Neuman, S.P., (1975): "Analysis of pumping test data from anisotropic unconfined
aquifers considering delayed gravity response" Water Resources Research,Volume 11, pp. 329-342.
Shcmidt, D.L., (1981)(a): "Geology of the Jabal Yafikh quadrangle, sheet 20/43 B,
Kingdom of Saudi Arabia: U.S. Geological Survey Saudi Arabian Mission
Miscellaneous Document 39 (Interagency Report 397), 99p.
Shcmidt, D.L., (1981)(b): "Geology of the Jabal al Qarah quadrangle, sheet 20/43 C,
Kingdom of Saudi Arabia: U.S. Geological Survey Saudi Arabian Mission
Miscellaneous Document 31 (Interagency Report 367), 52p.
Shcmidt, D.L.; D.G. Hadley; and D.B. Stoeser, (1979): "Late Proterozoic crustahistory of the Arabian Shield, southern Najd province, Kingdom of Saudi
Arabia" in Evolution and mineralization of the Arabian-Nubian Shield: King
Abdulaziz University, Faculty of Earth Sciences, Institute of Applied Geology
Bulletin No. 3, Volume 2, pp. 41-58.
Stump, T.E., and Van der Eem J.G.,(1994):"The stratigraphy, depositional
environments and periods of deformation of the Wajid outcrop belt,
southwestern Saudi Arabia" Journal of African Earth Sciences, Volume 21,
Issue 3, pp. 421-441.
Theis, C.V., (1935): "The relation between lowering of piezometric surface and rate
and duration of discharge of a well using groundwater storage" Transctions of
the American Geophysical Union, Volume 2, pp. 519-524.
Todd, D.K. (1980)(ed.): "Ground Water Hydrology" 2nd Edition, John Wiley and
Sons, New York.
Walton, W.C., (1962): "Selected analytical methods for well and aquifer evaluation"
Illinois State Water Survey Bulletin No. 49.

8/7/2019 Evaluation of groundwater resources in Wajid aquifer in Wadi Dawasir area southern Saudi Arabia using computer si…
http://slidepdf.com/reader/full/evaluation-of-groundwater-resources-in-wajid-aquifer-in-wadi-dawasir-area-southern 158/164
i
المستخلص
قع 19عرض بين خطي الدراسة منطقة تo30
/00
21و //o
00/00
ي خط ـ شماال وبين //
44oطول 00/ / 46o30و//00 00// ًاقرش ةي د وع ـ سل ا ةـ يب رعل ا ةكلمملا نم يبونجلا ءزجلا يف .
فة تبعدالتي و وتتوسط منطقة الدراسة وادي الدواسر ا سم 650مك ضايرلا ةنيدم نع.
ة مت تنكشف صخور ي ب و ـ س ر روخص نم نوكتي ثيح رساودلا يداو ةقطنم يف ديجولا نوك
ياه من تستخر). األوردوفيشي– الكمبري( تعود في عمرها إلى الباليوزوي األقدم مل ا جا ذ ـ ه
أسفل متكون الوجيد يحد.المتكون ألغراض الشرب والزراعة نم ربتعت يتلا ةدعاق ل ا روخص ياه وتعلوه طبقات مختل مل ل ةذ ف ن م ريغلفطلا نم ةف ة ذ ف ن م ل ا ريغ.
ـز منطقة الدراسة من المعلوم أن يمت ي راح يوارحص قاطن لخاد عق ات ب ت ج ـرد عاـ فت را
لة تساقط األمطار و ق و ةرارحلاة داي ز رخبتلا تالدعم .يف ةيفوجل ا هاي مل ا ةيذغت نإف كلذل ارظنو
يلة مقارنة بكميات السحب العالية وخاصة أن ل ق نوكت نوكتملالا يداو ةقطنم دحأ ربتعت رساود
يات أكبر المناطق الزراعية في المملكة العربية السعودية وت ـ سم صقا ـ ن ت ىلإ كلذ يدؤي امم ،
ياه في هذا المتكون مل ا .
ا ـ هجئ ا ت ن ىلع لوصحلا مت ثيحديجولا نوكتم ىلع ةروفحملا رابآلل خض تارابتخا تلمع
امج ـ نرب مادختساب جئاتنلا هذه اهل ي ل حتو Infinite Extentن ت ـ س ال نوـ كتملا تالما ع ـم جات
ية ،الموصلية الهيدروليكية ،ومعامل التخزين( ل قا ن ل ا .(ي ه ـ قرـ ط ثالث قيبطتبو Walton,
Hantush, and Theisنأ ىلع لوصحلا مت ةيل وقن مل ا طسوتم 252.8م 2/موي طـ سوت م و
متكون ويعتبر.21%العطاء النوعي كان و 0.002،يوم ومعامل التخزين/ م0.421التوصيل
ياه الخارجة منهاآلن غير متوازنالوجيد مل ا ةيمكو هيل ا ةلخادلا هاي مل ا ةيمك ةيحان نم نأ ثيح
ه من المنكشفات أكبر من التغذية اآلبار كمية الضخ من ـ ي ف لماء ا ىوتسمو يبلس هي والتغير ف

8/7/2019 Evaluation of groundwater resources in Wajid aquifer in Wadi Dawasir area southern Saudi Arabia using computer si…
http://slidepdf.com/reader/full/evaluation-of-groundwater-resources-in-wajid-aquifer-in-wadi-dawasir-area-southern 159/164
ii
د. متر فوق مستوى سطح البحر 550متر إلى 700تناقص من ـ ي جول ا نوـ كتم يف هاي مل ا نإ
ياه أحف م هتافشكنم نم ةيذغتلاو ةددجتم ريغ ةيرو غلبت 15ملم /ةنس .
ت لعمل نموذج Visual Modflowتم اختيار برنامج ن ـوكت ثيح ديجولا نوكتمل يضاير
ية ورأسية قدرها 100عمود و100الشبكة من ق ف أ ةحاسم ىلع نيعزوم فص 94.350م ك ـ .
ء مُثل المتكون ب. 2كم 8902يغطي مساحة قدرها وكان النموذج الرياضي ز ـ ج ةد ـ حا و ةق ب ط
نها غير محصور واآلخر محصور م .و خضلا رابآ ددع ناك 51ناك ثيح رئب ن م ـ خضلا لدعم
قة أي ما يعادل/ جالون 1800كل بئر ي ق د 9816.5م 2
. يوم/
صبح مستويات بعد معايرة النموذج الرياضي وذلك بتوزيع الموصلية الهيدروليكية حتى ت
ـد يدحتو ةـ سا رد ل ا ةقطنم يف نوكتملا يف ةيئادتبالا هاي مل ا تايوتسمل ةبراقم ةبوسحمل ا هاي مل ا
وف نخفاض حدود النموذج الرياضي الطبيعية واالفتراضية تم توقع ا ـ س يذلا هاي مل ا تايوتسم
سنة 40متر بعد 96من الضخ من اآلبار و 20متر تحت مستوى سطح األرض بعد 43يصبح
. سنة 60متر بعد 141و
ـار20على نتائج التحليل الكيميائي ل ـ شملت الدراسة بآ ن م ـ ةذوخأم ةيفوج هاي م ةني ع
لجوفية في المنطقة إلى. الدراسة تخترق الخزان المائي بمنطقة ا هاي مل ا تفنص ثال ث ـ نح ـ س
ئية ا م ةيئايميك عونلا نم ىلوألا )2(ةداي س HCO3 Mgو -
ع أو عدم تميز الكاتيونات 2+ م ـ
يادة س Mg+2
Caأو وجود كمية هامة من Mgو 2+
+2 ًابلاغ ةبحاصم هاي مل ا نأ نيبي كلذ نإف
أهمية دادزت ثيحو تيامولودلل Ca Naو 2+
. فإن ذلك قد يشير إلى حدوث تبادل أيوني جزئي +
نية من النوع ا ث ل ا )5(وأ طيسب ةباذإ هبث دح يذلا ءامل ا ىلع لدي دئاس نويأ كانه سيل هن حيث أ
لثة من النوع. زاج بسيطامت ا ث ل ا )8(ةداي س رهظي ثيح Cl مع عدم تميز أي كاتيون يدل على -
ياه م يف يسكع ينويأ لدابت ىلإ ةعجار ةيفوجل ا هاي مل ا نأ Cl- -Na+

8/7/2019 Evaluation of groundwater resources in Wajid aquifer in Wadi Dawasir area southern Saudi Arabia using computer si…
http://slidepdf.com/reader/full/evaluation-of-groundwater-resources-in-wajid-aquifer-in-wadi-dawasir-area-southern 160/164
iii
دى أيضا تضمنت الدراسة كما ـ مو ةـ ي ف وجل ا ه ا ـ ي م ل ا ةيعون ىلع ةرثؤملا تايلمعلا ديدحت
ياه لألغراض المحلية مل ا ةمئالم برشلاو .

8/7/2019 Evaluation of groundwater resources in Wajid aquifer in Wadi Dawasir area southern Saudi Arabia using computer si…
http://slidepdf.com/reader/full/evaluation-of-groundwater-resources-in-wajid-aquifer-in-wadi-dawasir-area-southern 161/164

8/7/2019 Evaluation of groundwater resources in Wajid aquifer in Wadi Dawasir area southern Saudi Arabia using computer si…
http://slidepdf.com/reader/full/evaluation-of-groundwater-resources-in-wajid-aquifer-in-wadi-dawasir-area-southern 162/164

8/7/2019 Evaluation of groundwater resources in Wajid aquifer in Wadi Dawasir area southern Saudi Arabia using computer si…
http://slidepdf.com/reader/full/evaluation-of-groundwater-resources-in-wajid-aquifer-in-wadi-dawasir-area-southern 163/164
داء ـ ـ ـ ـ ـ ـ ـ ـ ـ ـ ـ ـ ـ هـإ
: أهدي خالصة جهدي هذا ىلإ
روح والدي محره هللا محرة واسعة وأسأل
.هللا أن يسكنه جلانة
والدتي العزيزة حفظها هللا ومتعها
بطاعته
.إخواني األعزاء و ىنمتأ هلم التوفيق
ي وأوالدي ـ تـ ـ ـ ـ ـ جـوز.
ي ـ ـ ئـا ـ قـد ـ صـأ ل ـ آـ.
.آل من ساعدني وشد من أزرى
وآخر دعوانا أن حلامد هللا رب العنيملا
,,,,,

8/7/2019 Evaluation of groundwater resources in Wajid aquifer in Wadi Dawasir area southern Saudi Arabia using computer si…
http://slidepdf.com/reader/full/evaluation-of-groundwater-resources-in-wajid-aquifer-in-wadi-dawasir-area-southern 164/164