evaluation of models and tools for assessing groundwater availability and sustainability
TRANSCRIPT

Evaluation of Models and Tools for Assessing Groundwater Availability and Sustainability
Evaluation of Models and Tools for Assessing Groundwater
Availability and Sustainability
Groundwater Technical Workgroup
Priorities for Investment
Minnesota Department of Natural ResourcesDivision of Ecological and Water Resources500 Lafayette RoadSt. Paul, MN 55155

Evaluation of Models and Tools for Assessing Groundwater Availability and SustainabilityGroundwater Technical Workgroup
Kelton Barr, Braun Intertec, MinneapolisMark Collins, HDR Engineering, Inc., MinneapolisTim Cowdery, U. S. Geological Survey, Water Science Center, Mounds ViewChris Elvrum, Metropolitan Council, St. PaulJay Frischman, Minnesota Department of Natural Resources, St. PaulJeanette Leete, Minnesota Department of Natural Resources, St. PaulDave Leuthe, Minnesota Department of Natural Resources, St. PaulJoy Loughry, Minnesota Department of Natural Resources, St. PaulBill Olsen, Dakota County Water Resources Department, Apple ValleyHans-Olaf Pfannkuch, Department of Geology and Geophysics, University of Minnesota, MinneapolisSteve Robertson, Minnesota Department of Health, St. PaulLanya Ross, Metropolitan Council, St. PaulJim Stark, U. S. Geological Survey, Water Science Center, Mounds ViewBrian Stenquist, Minnesota Department of Natural Resources, St. PaulDan Stoddard, Minnesota Department of Agriculture, St. PaulAndrew Streitz, Minnesota Pollution Control Agency, DuluthBob Tipping, Minnesota Geological Survey, University of Minnesota, MinneapolisPrincesa VanBuren Hansen, Environmental Quality Board, St. PaulRay Wuolo, Barr Engineering Company, Minneapolis
Collaborators
Ian Chisholm, Minnesota Department of Natural Resources, St. PaulSharon Kroening, Minnesota Pollution Control Agency, St. PaulAnn Pierce, Minnesota Department of Natural Resources, St. PaulDave Wright, Minnesota Department of Natural Resources, St. Paul
Web Address: mndnr.gov/waters
Twin Cities: (651) 296-6157Minnesota Toll Free: 1-888-646-6367 (or 888-MINNDNR)Telecommunication Device for the Deaf: (TDD): (651) 296-5484TDD Toll Free: 1-800-657-3929
This information is available in an alternate format on request.Equal opportunity to participate in and benefit from programs of the Minnesota Department of Natural Resources is available regardless of race, color, national origin, sex, sexual orientation, marital status, status with regard to public assistance, age, or disability. Discrimination inquiries should be sent to Minnesota DNR, 500 Lafayette Road, St. Paul, MN 55155-4049; or the Equal Opportunity Office, Department of the Interior, Washington, DC 20240.
This information is available in an alternative format upon request© 2010 State of Minnesota, Department of Natural Resources
DNR Ecological and Water Resources500 Lafayette RoadSt. Paul, MN 55155-4032(651) 259-5700

Evaluation of Models and Tools for Assessing Groundwater Availability and Sustainability
Table of Contents
Preamble..............................................................................................................................4Executive Summary..............................................................................................................5 Recommendations..................................................................................................... 5Background..........................................................................................................................8Introduction........................................................................................................................11Assessment of Water Availability and Sustainability............................................................14 Statements of Consensus...........................................................................................14Knowledge Gaps................................................................................................................16Data Adequacy....................................................................................................................17 Statements of Consensus..........................................................................................17 What Data are Needed to Support Management Decisions?.....................................17 Workgroup Process.............................................................................................18 Conceptual Models.......................................................................................18 A. Precipitation..............................................................................................19 B. Recharge to the water table aquifer...........................................................21 C. Aquifer Storage.........................................................................................22 D. Flow Between Aquifers..............................................................................23 E. Discharge to or Recharge from Surface Water............................................24 F. Withdrawals from Pumping.........................................................................26 G. Return Flows.............................................................................................26 H. Evaporation and Transpiration..................................................................27 I. Ecosystem Needs.......................................................................................28 J. Characteristics of the Matrix and Channels that Contain Groundwater and Surface Water..........................................................30Summary of Priorities for Improvements to Minnesota’s Data Collection Programs............31Method and Tool Adequacy................................................................................................32 Statements of Consensus..........................................................................................32 Existing Tools and Methodologies............................................................................32 Water Supply Planning and Permitting...........................................................32 Aquifer and Surface Water Management........................................................33 Water Appropriation and Use Management Planning (Groundwater Management Areas)..........................................................................33 Management of Impaired Waters (TMDL Process)................................33 Wellhead Protection Planning..............................................................34 Hydrogeologic Mapping/GIS Modeling.........................................................34 Hydrogeologic Mapping/Quantitative Aquifer Computer Modeling..............34 Web Mapping of Published Data....................................................................34 GIS Modeling with Limited Hydrogeologic Inputs..........................................35 Framework for Assessing Ecological Needs...................................................36Recommended Sustainability Efforts..................................................................................39APPENDIX A. Comparison of Programs and Studies Regarding Minnesota Water Resource Supply and Demand..................................................................................40Appendix B: Principal Types of Data and Data Compilations Required for Analysis for Groundwater Systems.........................................................................................43
3 P a g e

Evaluation of Models and Tools for Assessing Groundwater Availability and Sustainability
Preamble
Technical experts in any field are not known for their ability to reach agreement with efficiency or without disagreement; therefore, you risk time and energy when you assemble any group of knowledgeable, professional scientists. However, the work of the Groundwater Technical Working Group (GTWG) is a testament to the consensus among professionals on the clear and urgent need for unified efforts and improving our understanding of Minnesota’s groundwater systems.
In fact, this consensus extends far beyond the group assembled to support this current effort. As early as 1950 , groundwater professionals in Minnesota noted declining water levels in several of major aquifers and expressed concern that water supply for humans might be seriously affected if such downward trends continued. In 1985, a statewide groundwater management strategy called for coordinated interagency hydrogeologic data collection, analysis and dissemination and for long-term funding of these efforts. Support for these concepts were voiced most recently in the Minnesota Environmental Quality Board’s (EQB’s) 2007 Water Sustainability Project and a 2008 Freshwater Society report, Water is Life: Protecting a Critical Resource for Future Generations.
Unfortunately, a lack of consistent commitment to mapping efforts, monitoring networks, and multi-jurisdictional management strategies has resulted in still-inadequate hydrogeologic data and assessment tools and methods for sustainable groundwater management. These challenges are exacerbated by the growing complexity of the problem; sustainable groundwater manage-ment must now consider water quality and ecosystem health along with more straight-forward groundwater supply issues.
Yet even while we continue to discuss the issue of groundwater sustainability, we have seen the serious implications of leaks, spills and the broad application of chemicals and other compounds — and how they end up in our surface and groundwater systems as a result of different types of land use. Our ability to protect and manage our groundwater resources is extremely limited once water moves below the surface of the land; therefore, we must err on the side of protection of these essential yet highly vulnerable groundwater systems.
We trust that the knowledge and understanding shared in this document, summarized in Tables 4 and 5, will be seriously considered and actively applied in all future decision-making processes regarding Minnesota’s groundwater resources.
Finally, while the group unanimously agreed over the importance of our effort needing to be understood and utilized by local decision-makers, the group recognized they were not the proper body to determine how to deliver, nor adapt these tools effectively into the hands of planners and decision-makers. With the delivery of this report comes the expectation that subsequent efforts will be needed by water planners and educational outreach specialists so that water supply planning and groundwater protection strategies are built into private, local and state government decision-making processes.
For most Minnesotans, groundwater is invisible because it moves beneath our feet every day deep through unseen geologic layers; unfortunately, its invisibility also makes it easy to take for granted. Those who work with water, such as water managers, planners and decision-makers have a better understanding of the value of water; they know that our public, economic and environmental health and stability depend on clean and sustainable groundwater sources.
2
1
3
4 P a g e

Evaluation of Models and Tools for Assessing Groundwater Availability and Sustainability
Executive Summary
This report is produced in response to a resolution of the Minnesota Environmental Quality Board which directed the Minnesota Department of Natural Resources to lead an evaluation of the models and tools that need to be developed for assessing water availability and sustainability. Core participants who had been involved in several previous and parallel efforts, and who are known for their expertise, were invited to continue discussions in a facilitated forum. As a result of the forum, the group reached significant agreement regarding the type, accuracy, and precision of information needed to make wise management decisions.
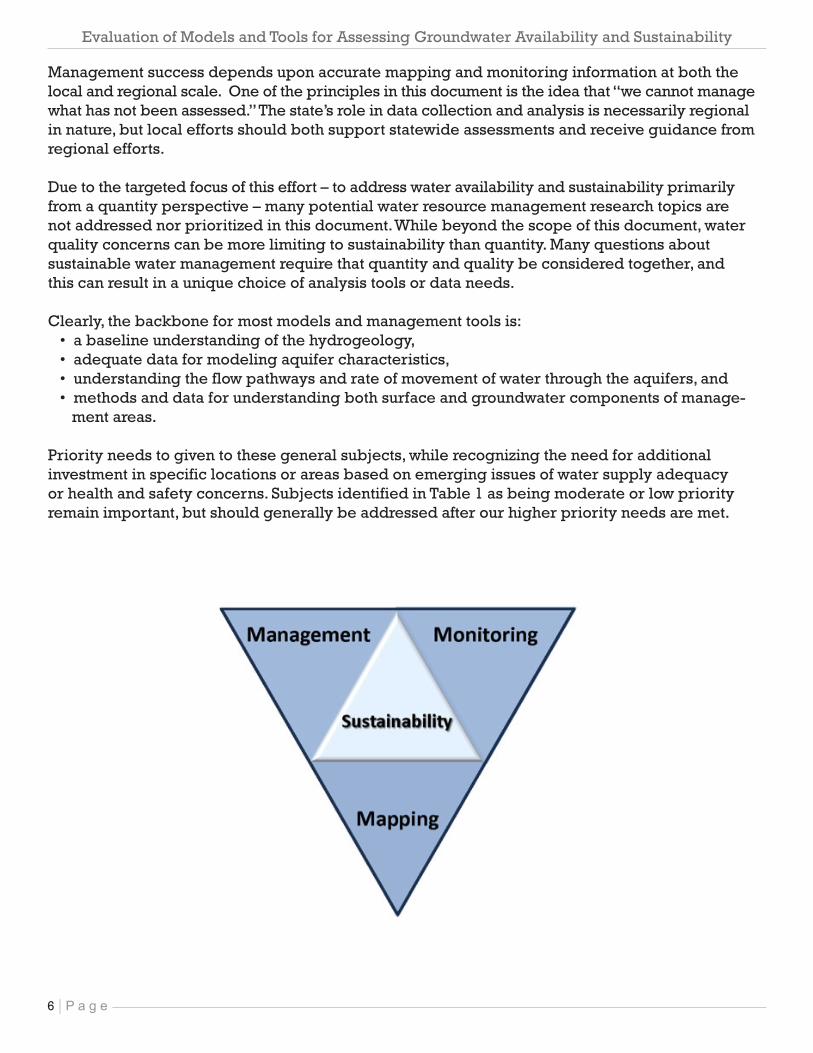
This document presents a three-pronged approach – monitoring, mapping, and management – to achieve sustainable groundwater management in the face of increasing demand for water resources in growing urban, industrial, and agricultural areas. Implementation of this report’s recommenda-tions will deepen our understanding of groundwater systems’ character and function and their relationships to our land use management practices, surface water systems, and ecological and public health.
The information contained in this report represents a consensus reached by the members of the Groundwater Technical Workgroup after lengthy and robust discussion. The group sought the latest information regarding water usage and replacement; they discussed the primary weaknesses and strengths of different assessment tools, and they reviewed the data that must be collected to make these approaches effective for a long-term management strategy. As a result, the recommenda-tions in this report represent something unique – broad agreement among water resource profes-sionals regarding how to approach sustainable water resource management.
The strong assumption this report makes is that all Minnesotans desire sustainable economies, strong public health, highly-functioning ecosystems, and the high quality of life enjoyed in this state – all of which are supported by a stable and abundant supply of water. Therefore, this report is presented with the hope that the findings and recommendations will be seriously considered with future generations in mind.
Recommendations
Sustainable management of Minnesota’s water resources will require complementary efforts that fall within three broad categories. Table 1 summarizes these efforts that will provide measureable results and inform today’s investment priorities: • Mapping • Monitoring • Managing
Mapping provides the data and information needed to develop an accurate inventory of ground-water resources, including the classification of aquifers and other water resources; mapping also provides assessments of resource vulnerability.
Monitoring provides critical data about system behavior throughout the monitoring network. A statewide, state-of-the-art, hydrologic monitoring network integrates data from all aspects of the hydrologic cycle. These data support a variety of models that relate aquifer levels to the health and status of our drinking water supplies and other ecological systems.
7
5 P a g e
Evaluation of Models and Tools for Assessing Groundwater Availability and Sustainability
Management success depends upon accurate mapping and monitoring information at both the local and regional scale. One of the principles in this document is the idea that “we cannot manage what has not been assessed.” The state’s role in data collection and analysis is necessarily regional in nature, but local efforts should both support statewide assessments and receive guidance from regional efforts.
Due to the targeted focus of this effort – to address water availability and sustainability primarily from a quantity perspective – many potential water resource management research topics are not addressed nor prioritized in this document. While beyond the scope of this document, water quality concerns can be more limiting to sustainability than quantity. Many questions about sustainable water management require that quantity and quality be considered together, and this can result in a unique choice of analysis tools or data needs.
Clearly, the backbone for most models and management tools is: • a baseline understanding of the hydrogeology, • adequate data for modeling aquifer characteristics, • understanding the flow pathways and rate of movement of water through the aquifers, and • methods and data for understanding both surface and groundwater components of manage- ment areas.
Priority needs to given to these general subjects, while recognizing the need for additional investment in specific locations or areas based on emerging issues of water supply adequacy or health and safety concerns. Subjects identified in Table 1 as being moderate or low priority remain important, but should generally be addressed after our higher priority needs are met.
6 P a g e

Evaluation of Models and Tools for Assessing Groundwater Availability and Sustainability
7 P a g e

Evaluation of Models and Tools for Assessing Groundwater Availability and Sustainability
Background
As early as 1950 , groundwater professionals in Minnesota noted declining water levels in the major aquifers of the Twin Cities artesian basin, in particular the Mt. Simon-Hinckley aquifer, and ex-pressed concern that water supply for humans might be in doubt if such trends continued. In 1985 a statewide groundwater management strategy called for coordinated interagency hydrogeologic data collection, analysis and dissemination and for long-term funding of these efforts.
A pattern can be seen in the extremely abbreviated history of groundwater sustainability efforts presented here: hydrogeologic data and assessment tools and methods were and still are inade-quate for the task of sustainable groundwater management. The most significant change over time is that the nature of the concern has evolved to include ecosystem health.
The Minnesota Environmental Quality Board’s (EQB’s) 2007 Water Sustainability Project reached these conclusions (among others): • methods currently in use for determining water availability and sustainability were not useful for site-specific decision-making, and • research and data needs remain unmet while per capita water use trends are increasing.
The 2008 Statewide Conservation and Preservation Plan urged that: • groundwater resources be assessed for their sustainability. • understanding of groundwater resources be improved.
Though not specifically referenced, groundwater flows to and from surface waters are important to all of the Plan’s water quality and water quantity-related recommendations.
A Freshwater Society report, Water is Life: Protecting a Critical Resource for Future Generations (2008) called out the lack of agreement among groundwater professionals past and present about the long-term sustainability of Minnesota’s groundwater resource. A primary source of such dis-agreement is a lack of a common definition of sustainability and a lack of criteria and indicators to establish whether sustainability has been achieved. This report recommended: • a scientifically rigorous study of sustainability be undertaken.
1
2
3
4
5
Bradley, E. 1950. Report of the Artesian Water Supply of the Twin City Basin. Minnesota Geological Survey, St. Paul, Min-nesota. Bruemmer, L. 1985. Ground Water Management Strategy Issue Team Report. Minnesota State Planning Agency. Minnesota Environmental Quality Board and Minnesota Department of Natural Resources, 2007. Use of Minnesota’s Renewable Water Resources - Moving Toward Sustainability. Swackhamer, D. et al. 2008. Statewide Conservation and Preservation Plan, a report to the Legislative-Citizen Commit-tee on Minnesota Resources. In framing criteria for work products required of the DNR and the University of Minnesota, the Minnesota Legisla-ture has recently provided statements about sustainability, e.g. “water use is sustainable when the use does not harm ecosystems, degrade water quality or compromise the ability of future generations to meet their own needs”. 2009 Minnesota Session Laws Chapter 172 Article 2 Sections 5, 8 and 30.
1
5
4
2
3
8 P a g e

Evaluation of Models and Tools for Assessing Groundwater Availability and Sustainability
The Freshwater Society and the University of Minnesota’s Water Resource Center responded by hosting two technical workshops attended by approximately 70 water resource professionals. Results of the workshops were synthesized in a report and guidance document for developing sustainable groundwater management plans. Echoing results of other efforts, the workshop report authors state ‘the foundation of groundwater analysis is the availability of high-quality data’ and refer to their work as a call to action for those who are responsible for groundwater decisions to:
• change the paradigm of plentiful water. • adopt a systems perspective that considers all components of the hydrologic (water) cycle. • plan for groundwater protection and use at a scale that matches the scale of the aquifer. • recognize ecosystem needs. • increase efforts to understand groundwater systems through research. • share data and results of groundwater modeling and analysis widely.
In late 2007, faced with environmental review of several ethanol plants and desiring a clearer un-derstanding of any possible water use impacts, the Minnesota Pollution Control Agency’s Citizen Board asked EQB to address water availability in light of the cumulative impact of high water-using industries. EQB convened a technical panel of over 50 groundwater professionals to consider water appropriations made by significant users and put the water use by individual facilities into a broader context. The group considered and discussed Minnesota’s ‘safe yield’ standards under MR 6115.0630, how thresholds are set to prevent damage due to overpumping, and how ground-water level monitoring is used for groundwater management. The group’s primary technical recommendations include:
• the state should establish a long-term strategy for managing the information needed to integrate water sustainability assessment into regulatory programs, • continue to build, maintain and use models, • assess water availability and sustainability using a variety of methods, models and mapping, and • develop a plan that sets priorities and standards for the next decade of data collection and funding.
This current report is produced in response to a resolution of the EQB, after the presentation of the 2008 report to that Board, which directs the Minnesota Department of Natural Resources to lead an evaluation of the models and tools that need to be developed for assessing water avail-ability and sustainability . Core participants who had been involved in the earlier and parallel efforts listed above, and who are known for their expertise, were invited to continue discussions in a facilitated forum.
Due to the targeted focus of this effort – to address water availability and sustainability primarily from a quantity perspective – many potential water resource management research topics are not addressed nor prioritized in this document. While beyond the scope of this document, water quality concerns can be more limiting to sustainability than quantity. Many questions require that quantity and quality be considered together, and this can result in a unique choice of analysis tools or data needs.
6
7
University of Minnesota Water Resources Center and Freshwater Society. 2009. Groundwater Sustainability: Towards a Common Understanding. Report Summary of Workshop held May 12, 2009. Minnesota Environmental Quality Board Meeting Minutes, Thursday November 20, 2008.7
6
9 P a g e

Evaluation of Models and Tools for Assessing Groundwater Availability and Sustainability
8
The reader is referred to the 1991 Minnesota Water Research Needs Assessment, based in part on a 1989 Water Resource Center technical workshop attended by 35 groundwater experts, for the Minnesota EQB’s broader evaluation of potential research priorities . Progress has been made over the past two decades and the remaining stated needs are very similar to current needs.
8
EQB Water Research Advisory Committee, Minnesota Environmental Quality Board, 1992.
10 P a g e

Evaluation of Models and Tools for Assessing Groundwater Availability and Sustainability
Introduction
Water resources are managed on farms, in com-munities, in homes, and in businesses. Effective communication to promote sustainability must happen at the local level so that individuals understand what to do and why. The state’s role in sustainable water resource management data collection and analysis is necessarily regional. The state’s efforts must be coordinated with and be supportive of stakeholders’ efforts. The pro-cess scientists use to study, evaluate and respond to problems is iterative, allowing new informa-tion to be incorporated as problem resolution proceeds (Figure 1). Natural processes underlie all sustainability questions and changes occur over periods of years. The Water Resources Center/Freshwater Society workshops developed a graphic description of a scalable long-term iterative management process to express these precepts. This process of adaptive management is what this workgroup recommends for ground-water management in Minnesota.
Figure 1. Process diagram for developing an adaptive management plan for groundwater 9
University of Minnesota Water Resources Center and Freshwater Society. 2009. Groundwater Sustainability: Towards a Common Understanding. Report Summary of Workshop held May 12, 2009.
9
11 P a g e
Convene Stakeholders and DefineBroad Protection Goals
Develop a Conceptual Model ofThe Hydrologic System
Define a Management Area
Collect Data andCharacterize System
Choose AnalysisTool Based onQuestion and
Data Availability
Conduct Analysis and CompareAvailable
Quantity/Quality Against Needs
Develop Water Allocation andMonitoring Plan
Define ResourceProtection Thresholds
Monitor for ThresholdExceedence
Continue DataCollection to Improve
SystemUnderstanding and toReduce Uncertainty

Evaluation of Models and Tools for Assessing Groundwater Availability and Sustainability
Figure 2. Data-Intensive Technical Core of the Groundwater Management Planning Process.
Plan development cannot advance past creation of a conceptual model without high-quality data and well-documented and robust groundwater sustainability analysis tools. Improved data collection efforts and model and tool refinements must be a priority for investment, in order to assess the effect of today’s management of Minnesota’s groundwater resources on future systems (Figure 2).
10
A conceptual groundwater model is a basic representation of a complex natural aquifer system. The scientist defines the area to be studied, explores ideas about the nature of the geological materials in the area, and develops an under-standing of groundwater flow directions, sources, and discharge areas. Such a model starts out as a mental framework for understanding and is usually graphically communicated to others in the form of maps and geologic cross-sections. Once the important relationships and the available data are known, data gaps can be filled and the conceptual model is used to guide efforts to create an analytical or numerical model.
10
12 P a g e
Collect Data and Characterize
System
Choose Analysis Tool
Based on Question
and Data Availability
Define a Management Area
Develop a Conceptual Mode
of the Hydrologic System
Evaluation of Models and Tools for Assessing Groundwater Availability and Sustainability
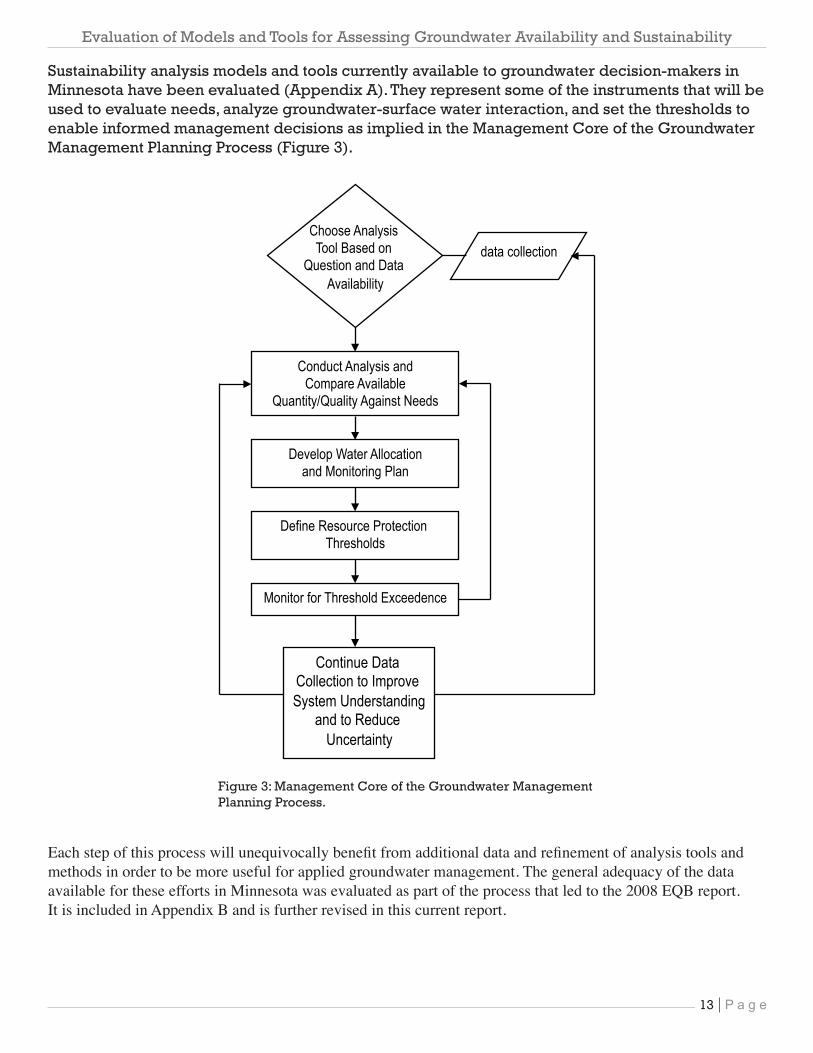
Sustainability analysis models and tools currently available to groundwater decision-makers in Minnesota have been evaluated (Appendix A). They represent some of the instruments that will be used to evaluate needs, analyze groundwater-surface water interaction, and set the thresholds to enable informed management decisions as implied in the Management Core of the Groundwater Management Planning Process (Figure 3).
Each step of this process will unequivocally benefit from additional data and refinement of analysis tools and methods in order to be more useful for applied groundwater management. The general adequacy of the data available for these efforts in Minnesota was evaluated as part of the process that led to the 2008 EQB report. It is included in Appendix B and is further revised in this current report.
Figure 3: Management Core of the Groundwater Management Planning Process.
13 P a g e
data collection
Choose Analysis
Tool Based on
Question and Data
Availability
Continue Data Collection to Improve
System Understanding and to Reduce
Uncertainty
Conduct Analysis and
Compare Available
Quantity/Quality Against Needs
Develop Water Allocation
and Monitoring Plan
Define Resource Protection
Thresholds
Monitor for Threshold Exceedence

Evaluation of Models and Tools for Assessing Groundwater Availability and Sustainability
Assessment of Water Availability and Sustainability
Figure 4: Hydrologic cycle, adapted from www.isws.illinois.edu/docs/watercycle/
Long-term systematic measurements of the status and trends of hydrologic cycle components can be indicators of water availability (Table 2). With the addition of biologic and land use indicators, a complete assessment of sustainability could be possible. Quantification of each indicator requires specific information collected under a strict set of standards. “Indicators tell us ‘where we are’ in the quest for short-term and long-term equilibrium between social, economic, and ecological needs” An indicator is neutral information.12
11
Barlow, P. M. et al. 2002. Concepts for National Assessment of Water Availability and Use. USGS Circular 1223. Wells, J. R. 2006. Selecting Sustainability Indicators. Water Resources Impact. Vol. 8 No. 4 pp 11-14.
11
12
Statements of Consensus: Groundwater, surface water and atmospheric water are a single interconnected resource (Figure 4). Use of groundwater and surface water unavoidably alters the natural environment. Changes in natural flow regimes will change ecosystems. It can take years before the impacts of increasing water use are fully realized – and without background data, the measurement of change and the prediction of change will not be quantitative. Information about all parts of the hydrologic cycle and information about the physical and chemical parameters of the water are the building blocks of understanding. Water management considerations vary with scale, geography, time, and the values (economic, political, spiritual, etc.) of the people using the water resources. Value judgments must be made when balancing competing demands on the resource. To better understand the consequences of decisions, society needs enhanced understanding of all components of the hydrologic cycle. Sustainability means different things to different people yet all definitions include a goal of future continued availability of water resources.
14 P a g e

Evaluation of Models and Tools for Assessing Groundwater Availability and Sustainability
IndictorsandCriteriainUse
InmanyPaleozoicbedrockaquifers,
theconcentrationofchlorideinthe
watercanbeanindicatorofrecent
(<50yearold)recharge.Thecriterion
forthisindicatoris5to10mg/L
chloride.Lessthan5to10mg/Lis
consideredbackgroundlevel.More
than5to10mg/Lsuggeststhatwater
fromthesurfacereachesthe
groundwaterrelativelyquickly.Such
anindicatorcanshowchangesinflow
patternsandhelptodefineorrefine
conceptualflowmodels.
Environmental Quality Board. 2008. Managing for Water Sustainability: Report of the EQB Water Availability Project.13
Table2.Indicatorstomeasureimpacts1.
Surface- and groundwater interaction
Streamflowreachcomparisons–arestreamreachesgainingorlosing?
Long‐termstreamflowtrends
Aquifer–surfacewaterimpacts
Aquifer–surfacewatertrends
Climate–waterleveltrendsGroundwater
Groundwaterrechargeeffects–dowaterwithdrawals(includingminedewateringandlanddrainage)
affectrecharge?
Intensityofgroundwateruse–number,capacityandspatialdistribution
Observationwellvariations–duetoseasonalhydrographordroppingwaterlevels?
Groundwaterlevel–aquiferthresholdrelationships
Wellinterferenceincidence–doaquifertestsindicatelikelihoodofinterferencewithexistingusers?
Aquiferstress–doesthepumpedaquifershowriskofstressduringtests?
Water use
Totalwithdrawalsbysource(surface‐andgroundwater)andsector(publicsupply,domestic,
commercial,irrigation,livestock,industrial,mining,thermoelectricpowerandhydropower)
Conveyancelosses
Consumptiveuses
Water sustainability
Relativeintensityofresourceuse–past,presentandfuture
TheratioofwaterwithdrawnorconsumedtorenewablesupplyWater quality
Waterchemistrytrendsovertime
Physicalparametertrendsovertime
Tritium
Stableisotopes
Chlorideandbromideratios
Nitrateconcentrations
1EnvironmentalQualityBoard.2008.ManagingforWaterSustainability:ReportoftheEQBWaterAvailabilityProject.
13
Methods for evaluating status and trends of indicators – thresholds, perhaps, are known as ‘criteria’. Criteria allow conclusions to be drawn about success or progress toward management goals.
There is a logical progression of investigations that lead to the ability to make management decisions: What information do we need to understand hydrologic and biologic systems (indicators)? What information do we need to set targets (criteria)? What information do we need to evaluate against targets (continued measurement of indicators)? What information do we need to make decisions (adaptive management)?
15 P a g e

Evaluation of Models and Tools for Assessing Groundwater Availability and Sustainability
Knowledge Gaps
Conceptual models are a first step in defining the list of data needed to evaluate a given water resource issue in a given setting. Analysis tools of increasing sophistication and with increasing data needs will be necessary to address specific management questions. For example, after making a model to predict impacts of a management decision based on available data, the model results could be used to frame new questions and reveal data needs. A statewide set of regional models could be used to systematically quantify data gaps and information needs to address the basic questions of:
What types of water use are anticipated for the future and what are the implications of the different types of water use? What are the anticipated future land uses and population patterns and what are the water resource implications? What is the resultant water level or flow rate? What is the resultant water quality? What is the flow path? Where is it coming from? Where is it going? How will flow paths change? What is the recharge? How will it change? What is the surface water/groundwater connection? How is health and integrity of biologic communities related to the flux of water through the system? What is the capacity of the system to deliver water? What happens to water levels, flows and flow paths when water is withdrawn? What will the trends in the above be over time as the cumulative impacts of all water uses are expressed?
16 P a g e

Evaluation of Models and Tools for Assessing Groundwater Availability and Sustainability
Data Adequacy
Statements of Consensus: Management of all data is required to make them accessible, relatable, and mappable. Data management must have a high priority in ongoing funding. Groundwater dependent ecosystems must be mapped and assessed. Groundwater and surface water are an interconnected single resource. As a result, ground and surface water monitoring should be integrated. High priority must be given to funding research and data collection where uncertainty is large and risk is high that ecosystems or aquifer systems will be negatively impacted. Appropriate indicators of the health of biological communities must be chosen, or where they are lacking they must be developed, and related to monitored water resource indicators. Water resource and ecosystem monitoring activities must be long term, adaptive, and comprehensive enough to be adequate for current and future management efforts. As water management needs intensify, so do data needs. More parameters need to be measured at more locations more often. It would be cost-effective to invest in preserving existing data and making it more easily obtainable.
What Data are Needed to Support Management Decisions?
The Groundwater Technical Workgroup (Workgroup) maintains that predictions based on water resource analysis tools, in particular groundwater models, are in general based on far too little data. The state of the art is such that it is relatively expensive and difficult to use more data rather than less. That creates an incentive to base models and predictions on less data rather than more. It would be good policy for the State to subsidize the storage and retrieval of groundwater data, and to make it freely and easily available so users will be encouraged to use all of the data to its greatest potential.
The individual hydrologic processes that are emphasized for regional work may differ from those in need of more thorough study during local-scale implementation and problem-solving. In addi-tion, settings differ significantly across our state that data and analysis needs will vary.
During the process that led to the 2008 EQB report “Managing for Sustainability” , it was agreed that a generic set of data elements for analysis of groundwater systems should be listed in an effort to provide a structured approach to enhanced water resources data collection. These data elements support the methods and tools in use now and will be available as background and trend data for managers in the future. The list of principal data types provided in USGS Circular 1186 was adapted for Minnesota (Appendix B). The Workgroup invited professionals involved in ecosystem analysis to assist us in gathering and evaluating data elements required for analysis of ecosystem dependencies, in particular at the interface of groundwater and surface water.
15
14
15
14 Environmental Quality Board. 2008. Managing for Water Sustainability: Report of the EQB Water Availability Project. Alley, W. M. et al. 1999 Sustainability of Ground-Water Resources. USGS Circular 1186.
17 P a g e

Evaluation of Models and Tools for Assessing Groundwater Availability and Sustainability
Workgroup Process
To expand on the review process detailed above, the Workgroup was asked to detail the most im-portant next steps to achieve the goal of having information and tools to enhance decision-making and to enhance the state of the science and the underlying relationships between hydrosphere and ecosystem.
Information is needed for: Research: cause and effect Monitoring: trends Evaluation: performance or risk assessment System description: context Management of anthropogenic factors: decision-making
The first three information needs for research, monitoring and evaluation are closely related, and, in many ways, overlap one another. For example, monitoring can also point to cause and effect; evaluation can be viewed as hypothesis testing. By their nature, groundwater systems are difficult to characterize.
Conceptual Models
Very often, a conceptual model (as an example, the conceptual model used by this workgroup for discussion purposes is shown in Figure 5) is used to start the characterization, identify relation-ships and guide continuing work. Time scales range from hours to millennia, and spatial scales range from meters to tens of kilometers or greater. As a consequence, information gathering and decision-making and policy-making based on this information will always be an iterative process.
To enhance decision-making, results of data collection and analysis must be regularly presented to managers and policy makers in a tangible way so they can use the technical information togeth-er with other factors. Most often, this involves being able to show cause and effect in the context of short-term fluctuations and long-term trends. For example, continuous water level (hydraulic head) monitoring can demonstrate the impacts of high capacity pumping on neighboring wells, or how flow directions change both seasonally and hourly based on pumping amounts. Continu-ous temperature and conductivity monitoring can show changes, often unexpected, to the ground-water system in response to both seasonal changes and individual storm events. Collection of historic chemical and isotopic data, along with continual data collection into the future will help establish baseline compositions and identify changes in groundwater flow paths and residence times. With new knowledge, current conceptual models and the policy decisions based on them may need to change.
18 P a g e

Evaluation of Models and Tools for Assessing Groundwater Availability and Sustainability
Figure 5: Components of a conceptual model in a simplified hydrogeologic setting: A=Precipitation, B=Recharge to the water table aquifer, C= Aquifer storage, D=Flow between aquifers, E=Discharge to or recharge from surface water, F=Withdrawals from pumping, G=Return flows to surface water or groundwater, H= Evaporation and Transpiration, I=Ecosystem needs, and J=Container (land surface through crystalline bedrock).
To evaluate if water use in a particular location is sustainable, the flows represented by the arrows in Figure 5 must be quantified. The following questions were posed for each component identified in Figure 5:
Why is it important? How well do we understand it? How is this information used? What is the state of knowledge and data?
A. Precipitation
Why is precipitation important?Precipitation is the source of almost all recharge to groundwater systems - both shallow and deep. However, only a fraction of precipitation reaches the groundwater system - the majority of precipi-tation is routed to other processes such as evapotranspiration and to surface water bodies.
How well do we understand precipitation?Precipitation is one of the best understood and measured parameters. Meteorological stations throughout Minnesota collect data on precipitation. The Minnesota Climate Center has an excel-lent historical database. The frequency of data varies from hourly to yearly, but is typically report-ed daily for most stations. The high spatial variability of precipitation makes it necessary to have a robust network of measurement stations.
How are precipitation data used?Until recently, precipitation data were not directly used to assess groundwater sustainability. In the past 10 years, however, precipitation has become more relevant to the evaluation of groundwater sustainability as a parameter in estimating infiltration and recharge.
19 P a g e

Evaluation of Models and Tools for Assessing Groundwater Availability and Sustainability
Recharge and infiltration estimation models typically require, at a minimum, daily precipitation records. The more sophisticated models require hourly or more frequent data to account for effects of intensity. Because we know that precipitation can vary from one place to the next, we also need digital maps depicting how precipitation varies over the landscape.
In Minnesota, precipitation falls as snow for four to five months of the year and is stored on the landscape as snowpack. Snowpack measurements are valuable for flood planning and for recharge estimates.
Precipitation chemistry and isotopic composition is important because it gives groundwater scientists composition information – a ‘fingerprint of that water’ before it enters the groundwater system as recharge. Tracing the movement of ‘fingerprinted’ water through the aquifer is possible.
What is the state of knowledge and data about precipitation?We generally have long historical records of precipitation amounts - particularly near National Oceanic and Atmospheric Administration (NOAA) stations and major airports. New techniques have been developed to assess patterns of hourly and daily precipitation over a large area (e.g., the metro area) using automated processes and interpolation between data-collection stations. In the long term we need to at least maintain the current density of precipitation monitoring stations and begin to store the data generated from radar and other remote sensing tools to allow evalua-tion of precipitation intensity and extremes.
Current data sets are not detailed enough to meet the needs of transient groundwater models and soil water balance models. Frequency of measurements and distribution of monitoring points must be reevaluated. As work on the understanding and prediction of precipitation and recharge continues, detailed precipitation intensity data will begin to be used for more detailed modeling and it will become even more important to validate the accuracy of the data being collected.
Characterization of the chemistry of precipitation needs a great deal more work and has not received enough attention. Results are typically in the form of single measurements. The composition of the water as it enters the ground can be established by measuring the major anions and cations. In addition, there are several types of tracers that are very useful to track water movement into and through the groundwater system: stable isotopes , tritium , and anthropogenic compounds such as CFC’s and SF6 . Trends in composition and variability over the landscape should also be evaluated by creating and maintaining a network of monitoring points over time. As noted above, water’s movement through the subsurface can be traced when the chemical and isotopic character of the water can be measured.
16 17
18
Some elements have more than one form. Isotopes of a given element often have the same chemical and biological properties but have different masses. The stable (not subject to radioactive decay) isotopes most frequently used in groundwater studies include nitrogen, oxygen, sulfur, carbon and hydrogen. The different masses cause the proportions of the isotopes to change as the water moves through the hydrologic cycle. Tritium is a radioactive isotope of hydrogen. It occurs naturally in very low amounts. Large quantities of tritium were produced as a result of atmospheric testing of nuclear bombs beginning in the early 1950s and is present in groundwater that entered aquifers after the early 1950s. Thus, the presence of large concentrations of tritium in groundwater indicates the presence of “modern water,” that is, water that entered the aquifer after the early 1950s. CFC (chlorofluorocarbons) and SF6 (sulfur hexafluoride) are anthropogenic gases produced since the middle of the last century. CFC and SF6 analysis provides an estimate of the vulnerability of groundwater. Any trace of these gases in deep aquifers indicates a non-negligible proportion of recent water (0-50 years) potentially marked by anthropogenic activities.
17
16
18
20 P a g e
Evaluation of Models and Tools for Assessing Groundwater Availability and Sustainability
B. Recharge to the water table aquifer
Why is recharge to the water table important?Recharge refers to precipitation that infiltrates below the root zone and migrates downward to the water table. It is the source of nearly all inputs to groundwater systems. If we could reliably quantify recharge, we would have a much more certain understanding of groundwater sustainability. In a natural system, recharge is the source of all natural discharges and should be understood to be naturally fully allocated to ecosystem needs. This means that an estimate of recharge is not equivalent to an estimate of allowable groundwater withdrawals for human use.
How well do we understand recharge to the water table?The overall processes are generally well-understood from a conceptual point-of-view, but the process that routes precipitation to the water table can be complex and involve a number of variables that are generally difficult to quantify. Recharge is dependent on a number of biological, soil, and climate processes at the ground surface and below the surface through the root zone. It is very dynamic and operates at a time scale that is much smaller (during storms and snowmelt) than generally used in groundwater evaluations.
Recharge values can be estimated deterministically by modeling each component of the recharge process, or derived indirectly by modeling each other component in the water balance equation, or estimated as an unknown parameter in a groundwater model. Results of recharge analyses are usually at watershed scale, depend on many related datasets, and include the errors of all measured parameters . Accurate estimates of recharge remain elusive, yet are critical to estimating flux through the system and thus sustainable withdrawal amounts. The most promising approaches include those based on physical tracers in the water (chemicals, isotopes, physical parameters). The most useful are those that relate recharge rates to land use.
Recent work in Minnesota has provided a base-level understanding of regional recharge. Results support the need for more detailed data collection efforts including very detailed measurements of groundwater levels and streamflows over time. Parameters that lead to calculations of recharge directly include: soil-moisture profiles; hydrostratigraphy of the unsaturated zone (i.e. saturated vertical hydraulic conductivity of strata above the water table), antecedent moisture content, crop type and albedo, rooting depth as a function of time, and a number of climatic conditions such as temperature, wind speed, relative humidity, sun angle, reference-plot transpiration, and cloud cover.
How are recharge data used?Recharge data are used as an input to groundwater flow models and to develop water budgets. Until recently, it was very difficult to deterministically estimate recharge (i.e. to simulate or otherwise model the actual process). Typically, recharge was estimated by guessing or through a process of inverse estimation (i.e. estimating recharge as an unknown parameter in a calibration process). The ability to simulate these processes numerically allows recharge calculations to be a function of
20
21
19
19
20
Seiler, K.P. and J. R. Gat. 2007. Research Tools and Methods in the Study of Recharge, Chapter 4 in: Groundwater recharge from run-off, infiltration and percolation. Water Science and Technology Library Volume 55. Springer. Delin, G. N. et al. 2007. Comparison of local to regional-scale estimates of groundwater recharge in Minnesota, USA. Journal of Hydrology 334, 231-249. Delin, G. N. and J. D. Falteisek. 2007. Ground-Water Recharge in Minnesota. USGS Fact Sheet 2007-3002.21
21 P a g e
Evaluation of Models and Tools for Assessing Groundwater Availability and Sustainability
precipitation/climate, soils, and land use. Models can be used to evaluate how changes in precipi-tation, soils, and land use will alter recharge (and thereby change the conditions in which ground-water sustainability can be evaluated). The ability to measure the the appropriate parameters (discussed above) and calibrate the models in site-specific applications is still in its infancy.
What is the state of knowledge and data about recharge to the water table?We must improve spatial resolution of recharge measurements and increase the number of site-specific studies before we can investigate cause and effect relationships. The pathways for and chemical nature of recharge should be evaluated regionally and subregionally for major aquifers.
Recharge modeling offers the potential for evaluating the effects of long-term climate change on water supplies by simulating the effects of temperature and precipitation changes. Knowledge of the parameters for use in the models should come from small-scale watershed studies that carefully quantify the water budget and evaluate the parameters (and their relative sensitivities). Because of the sensitivity of the water budget components to changes in pumping and other groundwater uses, emphasis should be placed on locations where long-term changes in land use are anticipat-ed to be minimal.
The role that changing land use has on recharge is another question that recharge modeling can help investigate. It has been assumed that developed areas reduce recharge to groundwater due to increases in impervious area. Recent quantitative site specific research shows that storm water management efforts that store water within the watershed may efficiently focus enough recharge to compensate for losses of recharge area. An understanding of the chemical and physical nature of targeted recharge from storm water ponds and other infiltration facilities is needed to complete the picture of recharge in developed areas.
Refinement of information about recharge may be a side benefit of improving groundwater level monitoring through capture of detailed water level data in and near areas where wells are being pumped (stressed). High quality information from hydrographs from wells completed at different depths (continuous monitoring in nested wells) must be evaluated as it is collected for this and other purposes.
C. Aquifer Storage
Why is aquifer storage important?Aquifer storage is often understood by lay persons as the answer to ‘how much we have’. In fact, the volume of total water in storage is not directly relevant to sustainability in Minnesota’s hydro-geologic settings. While there may be literally ‘billions of gallons’ in storage, it is possible that withdrawals from that storage could cause harm after a very small portion was withdrawn. Impacts on ecosystems can indeed begin upon initiation of withdrawals.
How well do we understand aquifer storage?The volume of water added or withdrawn for a given change in water level is an aquifer character-istic measured during aquifer testing. Pumping tests provide reliable approximations for storage parameters. For unconsolidated, unconfined aquifer systems, specific yield (drainable porosity) can be guessed at with reasonable accuracy if well logs are available and measured where samples
22
Erickson, T.O., Stefan H.G. 2009. Projecting natural groundwater recharge response to urbanization in the Vermilion River Watershed, Minnesota. Journal of Water Resources Planning and Management 135(6)512-520.22
22 P a g e

Evaluation of Models and Tools for Assessing Groundwater Availability and Sustainability
are collected during drilling. Water level monitoring provides reasonable information about changes in storage. In this sense, storage is reasonably well understood.
Reasonable approximations as described above have provided a starting point for modeling efforts in the metro area and in certain local aquifers. These should be refined through additional targeted data collection. The Health Department and DNR are building an aquifer test database to make mea-sured aquifer parameters more available to modelers. How are data about aquifer storage used?Storage is important primarily where changes in inputs or outputs are important. For example, mass balance studies rely on accurate, repeated, measurements of storage). Storage is a particularly important control in evaluating potential aquifer storage and recovery projects, for example where treated water is pumped back underground for later use.
What is the state of knowledge and data about aquifer storage?Geologic atlases provide generalized information on aquifer storage to begin the groundwater modeling process. For areas where aquifers are not previously mapped, aquifer storage is essentially unknown and must be addressed as mapping is done.
Synoptic water level measurements are very important to our understanding of aquifer storage because they provide the data from which volumetric changes are calculated. The existing water level observation network needs significant improvement but has potential to provide crucial data to water resource managers .
D. Flow Between Aquifers
Why is inter-aquifer flow important?Hydraulic interaction between aquifers is always an important consideration in the water balance. For example, flow between aquifers must be understood in order to be able to predict the propagation of pumping impacts between aquifers and resultant indirect withdrawals from other sources (e.g. streams and other surface waters). Preferential flow paths between aquifers are very important to our understanding of water chemistry (including contamination) and aquifer productivity.
How well do we understand flow between aquifers?Aquifer interaction is a head-dependent process and is therefore inherently dynamic as water levels (heads) change in response to climate and pumping. Our understanding of flow between aquifers is limited by sparse (both spatially and temporally) water level, flow, and chemistry data. Mapping of preferential flow paths is also limited. Our understanding of inter-aquifer flow is best in areas of urban development, where a useful (if unfortunate) combination of wells and contamination provide the densest monitoring network and presence of tracers. Better information is needed for the deeper aquifer systems and for complex glacial drift aquifers throughout the state because fewer wells are drilled into these deeper zones. Data needs include hydraulic properties of the materials that limit (confine) flow between the aquifers, head differences that drive flow between aquifers, and chemical differences above, below and within confining units that can trace flow between aquifers. Nested wells (completed at different depths so vertical comparisons of heads are possible) provide indispensable information about flow between aquifers as can flow logging and geophysical logging.
23
23 Minnesota Department of Natural Resources. 2009. Groundwater: Plan to Develop a Groundwater Level Monitoring Network for the 11-County Metropolitan Area.
23 P a g e

Evaluation of Models and Tools for Assessing Groundwater Availability and SustainabilityWhere water travels through fractures (cracks and other larger openings) rather than through a porous media (between packed particles), the water can move more quickly. Faster movement be-tween aquifers may translate into faster movement of contaminants. The use of geochemical data is a burgeoning area of research, and we hope in the near future that a well-designed monitoring network could collect enough temperature and other geochemical information to allow identifica-tion of fracture flow versus porous media flow and to quantify flow between aquifers.
How is information about flow between aquifers used?Understanding the flow between aquifers is an important component in the development of man-agement plans, because it is important in the overall water budget. It can also be used to delineate areas at higher risk for water quality degradation and areas where strategic sampling is war-ranted. When managers assess possible drawdowns due to pumping from one aquifer, changes in water levels due to flow between the pumped aquifer and any hydraulically connected aquifers must also be considered. Inter-aquifer flow information must be reflected in conceptual flow sys-tem models and flow data are used to verify numerical flow system models.
What is the state of knowledge and data about flow between aquifers?Decades of aquifer tests and water level observations have led to an acceptable regional under-standing of flow between bedrock aquifers in the metropolitan area, but interconnection through fracture zones at a local scale is still poorly quantified. There is poor understanding about flow between glacial drift aquifers except where site specific studies have been conducted. Improve-ments in groundwater level monitoring will help, because continuous hydrograph analysis can provide essential information as pumping stresses change heads across confining units. Use of tracer observation data can also be expanded and used as described above.
There is room for additional research if one can obtain real-time data from nested wells to com-pare to conceptual and numerical modeled results. New data may provide insight regarding the amount of water transmitted through discrete intervals in confining units, or the component of vertical versus horizontal flow through an aquifer.
E. Discharge to or Recharge from Surface Water
Why is it important to understand groundwater/surface water interaction?Baseflow in streams is discharge from the groundwater system. That is why the quantitative deter-mination of interaction between surface water and groundwater is probably the single most im-portant indicator of groundwater sustainability. In many cases, the “acceptability” of groundwater withdrawals is predicated on how groundwater discharge and surface water flows are affected. If this component of the hydrologic cycle can be better quantified, it should be possible to balance the needs of biological communities within the ecosystem with the needs of society.
How well do we understand groundwater/surface water interaction?From a conceptual point of view, we have a good understanding of how interactions take place but in a technical sense it is important to realize that specific settings have their own peculiarities. Springs, seeps and groundwater-fed wetlands are not yet inventoried statewide. Only rarely do we have groundwater discharge flow measurements at springs, seeps and groundwater-fed wetlands. For rivers and streams, there are several ways to evaluate changes in streamflow over time (Figure 6) to estimate base flows. Highest-quality stream flow and spring flow measurements at appro-priate locations and with adequate frequency are essential to accurately define the connections between surface water and shallow groundwater. It should be noted that the connection between deeper aquifers and surface waters is very difficult.
24 P a g e

Evaluation of Models and Tools for Assessing Groundwater Availability and Sustainability
Figure 6: Concept of Hydrograph Separation – Streamflow is separated into that which came more directly from the most recent precipitation event and baseflow discharged from groundwater.
24
How are these data used?Groundwater discharge to surface water data are extremely critical in the overall evaluation of groundwater sustainability. While recharge cannot be directly measured in a groundwater basin, discharge can be measured through stream flow monitoring. These types of data are very important in calibrating groundwater models.
Coupling continuous streamflow measurements with appropriately detailed groundwater levels and chemistry measurements from nested wells would allow a new level of understanding of groundwater/surface water interaction. This in turn will allow estimates of impacts of changing precipitation regimes and pumping withdrawals on vulnerable surface waters. Measured physical characteristics and the measured chemical/isotopic composition of recharging and discharging waters can be analyzed as tracers. High quality streamflow data are especially critical for modeling purposes.
What is the state of knowledge and data about groundwater/surface water interaction?The state of knowledge is spotty. In the large river systems, there are many technical challenges to stream gauging. Measurement of increases in river flow due to groundwater influx and separating the hydrograph into surface flows and groundwater flows can be challenging. Technological advances in equipment for stream measurements may improve measurement accuracy in larger channels.
Smaller streams typically have limited data that do not characterize seasonal and longer term variability. The state’s network of stream gauging stations is inadequate to characterize streamflow from minor watersheds and gauging in major watersheds has been cut back due to cost. In partic-ular, baseflow in small streams needs more attention as do flow rates and total volumes discharged from springs. These data are needed to estimate the water balance within an aquifer or within a watershed (mass balance water flows).
http://jan.ucc.nau.edu/~doetqp-p/courses/env302/lec6/Image41.gif accessed on 10-13-2010.24
25 P a g e

Evaluation of Models and Tools for Assessing Groundwater Availability and Sustainability
There is a great need to identify the degree of connection between surface water bodies and the groundwater system. The role of upland lakes and wetlands in groundwater/surface water interac-tion remains to be studied in adequate detail. In addition, springs, seeps and wetlands to which groundwater discharges are inadequately mapped and inventoried.
F. Withdrawals from Pumping
Why is it important to quantify pumping withdrawals (water use)?Pumping alters the water balance. Issues of sustainability revolve around how much pumping occurs. The natural water budget’s discharge component is allocated to ecosystem needs, and over time, continued pumping for human needs has a direct impact on groundwater-dependent and surface-water-dependent ecosystems.
How well do we understand water use by pumping?The DNR water appropriation permit requirements for monthly reporting provide a database of reported withdrawals. There is room to improve compliance with metering and reporting require-ments. In some locations, such as areas where ecosystem needs are under study or where use is large (e.g. in the metropolitan area), more frequently collected data would be valuable. Domestic water use from individual wells and all withdrawals under the permit threshold of 10,000 gallons per day or 1,000,000 gallons per year are not reported but may be important in some locations.
How are water use data used?Well pumping is an important discharge component in a groundwater flow system and is almost always included in models. For modeling purposes, the locations of wells, the aquifers from which they pump, and potential withdrawal rates and volumes are needed. When coupled with high-quality groundwater level monitoring, the data sets allow interpretations of water availability to be made.
What is the state of knowledge and data about water use in Minnesota?The accuracy of reported water use data depends more than it should on the equipment and the operator. Some of the currently allowable water use measurement methods are not accurate. Water use data would be improved if all water users metered the water used and kept the meters in good repair. High quality water use data, water levels measurements from the pumped aquifer and adjacent aquifers or surface water bodies, and measurements of the chemical and isotopic com-position of the pumped water are the data sets required to evaluate the impacts of water withdrawals and thus determine water availability and whether ecosystem needs will be met in the future.
G. Return Flows
Why are return flows important?Wastewater and septic system water returns can be important sources of water to the flow system. In general, septic system returns are approximately equal to the amount withdrawn less the amount of water used for household landscape irrigation. The physical and chemical characteristics of the returned water may cause traceable changes in groundwater’s physical and chemical characteristics. Recharge of treated water can mitigate impacts of pumping-induced decline in aquifer levels but it is not necessarily returned to the aquifer from which it was pumped.
26 P a g e

Evaluation of Models and Tools for Assessing Groundwater Availability and Sustainability
Return flows from irrigated lands vary with soil type, crop type, and water management practices of the land manager. Irrigation returns can be very important but do not necessarily return water to the aquifer from which it was pumped.
How well do we understand the implications of return flows?Return flows from septic systems are relatively well understood. Larger wastewater returns can be measured and modeled.
Aquifer storage and recovery involves recharging water into an aquifer for subsequent recovery and use. It is most often used to store water for future use during peak demand periods, capitalizing on unused treatment capacity or water availability in off-peak periods. It is possible to recharge treated wastewater for similar purposes, although bacteria, viruses, and pharmaceuticals in the wastewater are formidable treatment hurdles. Most of the uncertainties surrounding these concepts involve the chemistry of the recharging water.
How are these data used?There are as yet not many applications. At this time, the most important reason to quantify return flows is that they can be a significant term in the water budget that, if ignored, can introduce errors in modeling and misinterpretation of the data.
What is the state of knowledge and data about return flows?Return flows are not typically measured. If needed for modeling, the volume of return flow is estimated based on site-specific studies where they have previously been quantified. Aquifer storage and recharge is in its infancy in Minnesota. Geochemical changes that occur within the aquifer in response to these return flows must be evaluated.
H. Evaporation and Transpiration
Why is it important?Evaporation is water loss from a free water surface such as a lake. Transpiration is return of water vapor to the atmosphere through vegetation. To avoid the need to separate the terms, the combined process that returns water to the atmosphere is called evapotranspiration. Evapotranspiration, combined with precipitation and runoff, control recharge.
How well do we understand evapotranspiration?We understand the overall process and we have deterministic models to simulate evapotranspiration (ET). Many parameters must be measured to quantify it – climatological/meteorological and bio-logical. Considerable agricultural research has gone into relating crop type, rooting depth, etc. to reference ET plots. We need to learn more about ET’s impacts on streamflow and baseflow during the growing season.
How are evapotranspiration data used?Currently, direct use of ET data is limited because so much data are needed. Some models can use ET data if enough information is available. Improved data will improve modeling efforts significantly because ET is a very large water budget term and a small percentage error in determination of ET volumes represents enormous amounts of water.
27 P a g e

Evaluation of Models and Tools for Assessing Groundwater Availability and Sustainability
What is the state of knowledge and data about evapotranspiration?Evapotranspiration information is very rarely available at the scale needed for applied management. Improvements in modeling of critical streamflows and lake or wetland levels during climatological stress could be achieved if there were more detailed information on losses to the atmosphere. This information could then be related to ecosystem response and considered when management decisions must be made.
This is an area where additional data and monitoring are needed to advance the applicability of tools used to estimate evapotranspiration. An approach toward enhanced understanding would be to do more monitoring of soil moisture content in and below the rooting zone under non-agricultural cover types.
I. Ecosystem Needs
Why is an understanding of the water requirements of the ecosystem important?We must not ignore that humans are part of the ecosystem and that human behaviors influence the hydrologic cycle directly. Supporting ecosystem function (both physical and biological) is one of the primary ‘uses’ of groundwater, and maintaining this function is one of the defined goals of sustainable groundwater management. Ecosystems are usually supported by a combination of groundwater and surface water, with groundwater acting as a buffer to the extremes of surface water flows to support specific species that would otherwise disappear after repeated drought cycles. Groundwater requirements of aquatic ecosystems dictate how sensitive a water body or hydrogeologic setting is to the effects of pumping and land use changes. How well do we understand ecosystem needs?Biological communities that exist at the interface of surface water and groundwater are adapted to certain seasonal changes in levels and fluxes and these communities have survived high and low extremes. Biological communities are often constrained by an input such as light, a nutrient, or moisture, called a limiting factor. Communities can be sensitive to inadequate levels of an input and sensitive to excessive levels of an input. Except in a few cases, we do not know quantitatively what are the limiting amounts of groundwater required by groundwater dependent biological communities. This is at least in part attributable to a general lack of quantitative knowledge of groundwater fluxes in those communities, which, if known, ecologists could relate to biological responses. What we understand conceptually is that there are changes in levels and fluxes that will change the nature of the biological community over time. To sustain valued biological communities we must learn what changes are too great, too frequent, or too lengthy, and avoid or mitigate for them. This task will be quite difficult because needed flows vary by species and what may be optimal for one may be detrimental to another.
Our understanding of the groundwater requirements of ecosystems is quite limited. We do not have a complete understanding of the range of species supported by natural groundwater discharge. The first step to establish such an understanding would be to map ecosystems supported by seeps and springs, and evaluate them for ecosystem function. Table 3 outlines data needs for improved understanding of ecosystem needs.
28 P a g e

Evaluation of Models and Tools for Assessing Groundwater Availability and Sustainability
Table3:PrincipalTypesofDataandDataCompilationsRequiredforAnalysisofGroundwater
DependentBiologicalCommunities
Status in Minnesota (scale dependent)
Data Type or Data Compilation
Generally Adequate
Limited Adequacy
Generally not
Adequate Data
Access Comments
Biological Framework
Topographic and bathymetric
maps showing zones of groundwater - surface water
interaction, dams and channels and diversions of
flow
X Good Springs and seepage faces
are not consistently mapped; gaining and
losing reaches and shorelines segments are
not typically mapped.
Identify critical windows of time where low water levels or
flows could coincide with increased human demand for
water
X Good Low flow and baseflow data for small watersheds
are limited. Demand factors are better known.
Refined biological survey maps identifying high value or
rare aquatic species and unique ecological communities
X Fair Trout stream mapping is adequate, biological
surveys at the county scale are not yet complete, trend
information not available because surveys have not
been repeated.
Biological integrity indicators and trends related to
hydrologic measurements
X Poor Model development must relate levels and flows (and
their statistical distributions) to ecosystem
health and continued integrity.
Structure adapted from USGS Circular 1186, Table 2, p. 69.
Note: “Generally adequate” implies data suitable for multiple scales; “Limited adequacy” implies data partially limited by scale, geographic extent, or completeness; “Generally not adequate” indicates data useability very limited due to completeness, geographic coverage, lack of historical information, or other restrictions.
Note: For “Data Access” Column, “Good” indicates data on-line and in useable format (image scans of data sheets, for example, are not inherently useable); “Fair” lacking one or both of “good” criteria, perhaps only available in published documents in paper format; “Poor” indicates “papers in a shoebox”: either data not collected, in unpublished paper form only, or not readily accessible.
How are these data used?To date, groundwater management for ‘ecosystem’ protection is not yet fully realized. Management has focused on single endangered or threatened species and on rare or vulnerable biological communities, for example, trout streams and calcareous fens.
29 P a g e

Evaluation of Models and Tools for Assessing Groundwater Availability and Sustainability
Relationships between water flows and levels and biological communities are understood more in a qualitative than a quantitative sense. Management focused on prevention of significant harm to ecosystems dictates that we adopt a conservative precautionary principle until we develop a bet-ter understanding of specific cause and effect relationships, and draw the appropriate correlations between groundwater use/changes and ecosystem health.
What is the state of knowledge and data about ecosystem needs?Predictive tools are needed. There is a need to merge water resource systems information with the science about the impacts of water fluctuations on biological populations, and determine data gaps. Ecologic study sites should be co-located with groundwater flux studies.
J. Characteristics of the Matrix and Channels that Contain Groundwater and Surface Water
Why is it important?‘Container’ is a simple term representing the complex integration of the effects of landuse, vegeta-tion, slope, soils, and geology (including the nature of aquifers and confining beds). The nature of the container influences all components previously discussed – even precipitation. The chemical nature of precipitation, for example, is influenced by the geochemical nature of dust that comes from the surface of the land. The nature of the material in a stream channel has a profound impact on aquatic organisms. The geology of a region is the determinant of the permeabilities and inter-connections between subsurface layers. How well do we understand the container?The character of the land surface is best understood. Soils are within a few feet of the surface and are mapped in the greatest detail. The characteristics of lake-bottom and stream channel materials are inadequately known for purposes of modeling groundwater/surface water interactions. Geo-logic mapping has advanced our, as yet very incomplete, understanding of the subsurface. How are these data used?In areas where recent geologic atlas work has been conducted, the locations of well information are accurately determined and the information is available in formats suitable for model input for regional scale models. It is essential that geologic and hydrogeologic mapping continue and that areas of older mapping be revisited and updated based on new information (primarily from the drilling of new wells or the conduct of geophysical or geochemical studies). What is the state of knowledge and data about the container?
The geologic maps that provide the base for all hydrogeologic studies improve with every map-ping project conducted. The ongoing major effort to complete LiDAR data collection throughout Minnesota will improve maps of stream networks, as will assessments of major river channels through improved floodplain mapping.
30 P a g e

Evaluation of Models and Tools for Assessing Groundwater Availability and Sustainability
Summary of Priorities for Improving Minnesota’s Data Collection Programs
Table 4 details the priorities for data collection for each component of the water resource system identified in Figure 5. It must be emphasized that none of these fluxes is unimportant. We are at-tempting to sequence further improvements and do not intend to neglect any of the hydrologic cycle components. We reiterate that management of all data is required to make them accessible, relatable, and mappable and that data management must have a high priority in ongoing funding.
31 P a g e

Evaluation of Models and Tools for Assessing Groundwater Availability and Sustainability
Method and Tool Adequacy
Statements of Consensus: Groundwater and surface water are an interconnected resource – but awareness of the implications of this fact is lacking among most users of land and water resources. Groundwater models at several levels of sophistication, depending on available information, can provide the framework for analysis of limiting conditions, determination of sustainability thresholds, and screening of proposed actions for unintended consequences. Public access to data for analysis must be targeted and uncomplicated. The results of data searches must be meaningful to citizens, scientists, and managers at all levels of government. There is a need for tools that put data into meaningful context at the access portal to inform decision-making and planning that supports sustainability. Appropriate and understandable management tools and best management practices will foster local involvement in sustainable water resource management by communicating the tie between land use and water resources.
Existing Tools and Methodologies
The intent of Minnesota Water Law is sustainability (i.e., to maintain adequacy of supply for a variety of uses and purposes) (MS 103G.265 and others). Over time, a number of methods to assess sus-tainability have been used in the state. Each suffers from a lack of adequate, targeted data to truly assess sustainability.
A brief description of each category of water sustainability assessment method or tool is given here. These methods are detailed in Appendix A and also summarized in Table 5 on page 35. Priorities indicated in the Table are from the perspective of the groundwater professional. Because decisions are being made everyday, decision-makers need information now. Data must be made available as soon as possible even if it continues to be refined in the future.
Water Supply Planning and Permitting
In Minnesota, users of more than one million gallons per year or ten thousand gallons per day are required to obtain a water appropriation permit (103G.271) and to report the volume of water used (103G.281). Certain de minimis uses are exempt and some lower volume use categories are eligible for General Permits. During the permitting process, projects are screened for potential problems. A subset of applications is given more rigorous evaluation to avoid predictable impacts on other users and the environment.
Drinking water supply planning (103G.291) is a process that promotes structured consideration of potential resource issues and water supply alternatives. The existing and future needs of the individual community are considered, and the sustainability of all interrelated water resources in that community is evaluated to the degree that existing data and resources will allow.
Where resource limitations are considered possible, and where water withdrawals may impact other resources, such as other aquifers, springs , streams, lakes or wetlands, it is prudent to require monitoring of the resources involved. Such monitoring (e.g., measuring water levels in wells, flows,
32 P a g e

Evaluation of Models and Tools for Assessing Groundwater Availability and Sustainability
and levels in surface waters, changes in plant or animal communities) is part of adaptive management. Adaptive management responds to observed conditions and allows changes to permits when impacts warrant the change. Adaptive management is inherently flexible and helps avoid economic damages while remaining protective of the natural environment. There is risk that slow-onset damages or damage to well-buffered systems could be expressed too slowly for timely detection. Essential to the success of this method, therefore, is better understanding of ecological response to water level and flow changes. Improved modeling techniques that would predict seasonal, site-specific hydrologic changes in response to water withdrawals would then be used to determine permitted water use at the onset of the adaptive management process.
Aquifer and Surface Water Management
Whereas the above discussion of issues surrounding water appropriation permitting applied to individual permits, evaluated one by one, aquifer and surface water management evaluates the cumulative impacts of all permitted uses. The specific needs of the local users and the local water resources and ecosystems provide the context for management.
Water Appropriation and Use Management Planning (Groundwater Management Areas)The authority to set up water management areas is laid out in Minnesota Rules 6115.0810. The technical tools that would allow defensible prediction of cause (impacts of water appropriations) and effect (changes in ecosystem function and water availability) are best understood for simple hydrogeologic settings; those for the multi-layered, interconnected, hydrogeologic settings typical of most of Minnesota must be refined. Where groundwater is a major source, management must be aquifer-based, and the management area based both on surface watersheds and aquifer boundar-ies. Site-specific hydrogeologic mapping and aquifer boundary determinations are prerequisites. Water sustainability, as we have chosen to define it, requires maintenance of adequate ecosystem function, thus site-specific inventory and mapping of biological resources are also prerequisites.
In concept, local managers would establish criteria that would be protective of aquifers, surface water resources, and ecosystem function, and determine critical levels or flows. Permits to appropriate water would be evaluated in functional groups with the goal of maintaining critical levels or flows under given antecedent conditions. When climate stress and/or demand for water makes limitations necessary, staged pumping limits, timing changes, or conjunctive use measures could be put into effect.
Monitoring will provide warning of hydrologic stress and allow adaptation to possible water use limitations. Monitoring of vulnerable surface water and groundwater dependent resources will allow better understanding of cause and effect and will allow ongoing reassessment of net water availability while preserving ecosystem functions.
Management of Impaired Waters (TMDL Process)Impaired waters are impaired ecosystems. Minnesota’s goal of sustainable water resources depends on mitigation of systems where functional integrity is negatively impacted by water quality and quantity issues. The concept of total maximum daily load (TMDL) and the process by which water resources are evaluated, and then designated for management improvements if found to be im-paired, will benefit from improved understanding of groundwater - surface water interaction in terms of both quantity and quality. Site specific by definition, TMDL projects depend on accurate measurement of the components of the hydrologic cycle and on detailed hydrogeologic and biologic inventories. In short, management of impaired waters fits within the concept of groundwater man-agement areas and may define a subregion of the management area.
33 P a g e

Evaluation of Models and Tools for Assessing Groundwater Availability and Sustainability
Wellhead Protection Planning Wellhead protection studies and subsequent planning actively seek to understand and limit risks to groundwater quality. Information gained during wellhead protection studies will inform any water appropriation and use planning. Wellhead protection areas may also define subregions of groundwater management areas. Data sharing will enhance both efforts.
Hydrogeologic Mapping/GIS ModelingThe Minnesota Geological Survey and the Minnesota Department of Natural Resources (DNR) are engaged in ongoing hydrogeologic and aquifer mapping. DNR is also engaged in systematic efforts to map biological resources. The more recent maps are produced as Geographic Information System (GIS) layers; older maps have been scanned to approximate GIS layers. Surface and sub-surface electronic maps from all available sources (soils information, water budget components, land use data, geophysical data, geochemistry) can be analyzed in three dimensions. Water resource professionals and others can freely access these data layers. Spatial relationships can be explored and qualitative assessments made; care must be taken to avoid misuse of these maps. Most of the geologic map scales are not appropriate for site-specific analysis without additional data.
Several data sets critical to a comprehensive understanding of water budget components have yet to be created, for example maps of groundwater – surface water interaction zones (springs, seeps, groundwater dependent wetlands and gaining and losing reaches of streams and shorelines). The water resource manager cannot assess impact on unknown resources.
Hydrogeologic Mapping/Quantitative Aquifer Computer ModelingExpert GIS tools, including statistical and other numerical techniques, can transform inputs from GIS modeling into derivative layers – and such layers can be exported into computer models. This results in much more efficient use of the professional’s time, with more time spent on critical decisions about model boundaries and parameters and less time transcribing information.
Computer models will need refinement in order to accurately represent pumping cycles (transient conditions) and to create detailed management zones within regional models. Predictions of cause and effect can be made and management scenarios explored. Fully developed groundwater models can inform management decisions.
Web Mapping of Published Data
Publically available GIS mapping tools allow anyone with internet access to explore spatial rela-tionships between existing data layers. In many cases, local decision-makers will be able to make their own specialized maps for consideration while deliberating management questions. It is im-portant that such online tools have well-written disclaimers about inappropriate application of the data (e.g. a pop-up warning when ‘zooming in’ to a local scale on a regional-scale map). Decision-making applications may be better served by development of tools specifically designed for the needs of the user group.
34 P a g e

Evaluation of Models and Tools for Assessing Groundwater Availability and Sustainability
GIS Modeling with Limited Hydrogeologic Inputs
For some users, a GIS data layer is not sufficient. Several research efforts recently undertaken rep-resent a type of analysis that is intermediate between simpler GIS modeling and GIS-based nu-merical flow modeling. Advanced geostatistical and multidimensional tools are used for regional analysis. Social and economic linkages to water resource issues can be effectively explored. All approaches to date have been weak due to a lack of a quantitative basis for assessment of ecologi-cal needs.
35 P a g e

Evaluation of Models and Tools for Assessing Groundwater Availability and Sustainability
36 P a g e

Evaluation of Models and Tools for Assessing Groundwater Availability and Sustainability
Framework for Assessing Ecological Needs
Ecological response (includes both biological and physical systems responses) to water level and flow variability must be better understood. Longer-term monitoring of relationships between hydrology and biological indicators will be necessary. A goal of near-term research must be se-lection of biological indicators or proxy organisms in vulnerable communities for comprehensive monitoring. Experimental work must be carried out to evaluate stressors and indicator or proxy response. Relationships thus determined can be used to guide the development of protection strategies. Examples of ecosystem protection needs and possible protective actions are listed in Table 6.
Table6:SpecificEcosystemProtectionNeedsandPossibleActions
EcosystemProtectionNeed PossibleProtectiveActions
Groundwater/SurfaceWater
Interaction
Inventoryandsubsequenthydrogeochemicalmonitoringofsprings,seeps
andgroundwaterdependentwetlandsshouldenhanceunderstandingof
fluxesacrosstheland/waterboundarywherecriticaldependenciesare
expressed.
SurfaceWaterAvailability
Identifytimingandfrequencyofcriticalhydrologicevents(e.g.,lowflows
inriversduringtheheightoftheirrigationseason);Provideincreased
protectionforstreamandlakeswhenflowsandlevelsreachcriticalstages;
Estimateimpactsofclimatechangeonfrequencyofcriticaleventsfor
groundwaterandsurfacewaterdependentecosystems.
SurfaceWaterQuality
Watershedassessment;TMDLprocessleadbyMPCAfocusesonlarger
lakesonthelandscape,subwatershedsforrivers.Byprotectinglarger
units,smallerwaterbodiesonthelandscapemaybeprotected.
Ecosystemservicesprovidedby
SurfaceWater
Developbiologicalassessmentmethods‐measurearepresentative
portionoftheaquaticcommunityandassessitsstatusasareflectionof
thewhole‐hasbeendoneforwetlandsandisunderdevelopmentfor
lakes.
Continuallyupdatewatershedassessmenttool‐assesstherelative
intensityofhumanstressorsonthelandscapetoguideprotectionefforts
towardlocationswherethelikelihoodofimpactsishigher.
Assessimpactsofecosystemadaptationtoclimatechange
GroundwaterAvailability
Identifycriticalhydrogeologicsettingswherewithdrawalsmayadversely
impactsurfacewaters.Developaframeworktoreserveflowsfor
ecosystemsustainabilityandlimitappropriationstoprovidethoseflows.
GroundwaterQuality
Focusprotectionandrestorationactivitiesinareasofimpairedwater
qualityandinareasthatarehydrogeologicallyvulnerableto
contamination.
Ecosystemservicesprovidedby
Groundwater
Developabiologicalsensitivitymodelforgroundwater‐dependent
communities.Determinelocationswheregroundwaterdependent
communitiesexistorwouldbepredictedtoexist.
Develop appropriate monitoring and models for prediction of impacts on groundwater dependent communities from appropriation and climate change.
Set regulatory standards that use criteria to evaluate indicators of the sustainability of groundwater dependent communities.
37 P a g e

Evaluation of Models and Tools for Assessing Groundwater Availability and Sustainability
Most advancements anticipated for sustainability assessments will be the results of refinements of quantitative numerical modeling approaches and incorporation of newly-gained information about ecosystem vulnerabilities. Modeling efforts to be undertaken include:
Evaluate cumulative impacts of the many changes induced by human use of resources and climate change Evaluate drought and flood scenarios through analysis of precipitation patterns Evaluate flows and contaminant movement in response to recharge and withdrawals Evaluate agricultural processing and energy transformation water needs Evaluate water level trends in response to pumping Evaluate ecosystem impacts of recharge and withdrawal Determine critical limits and set thresholds for controllable factors such as withdrawal rates or volumes and water quality of recharge/discharge.
38 P a g e
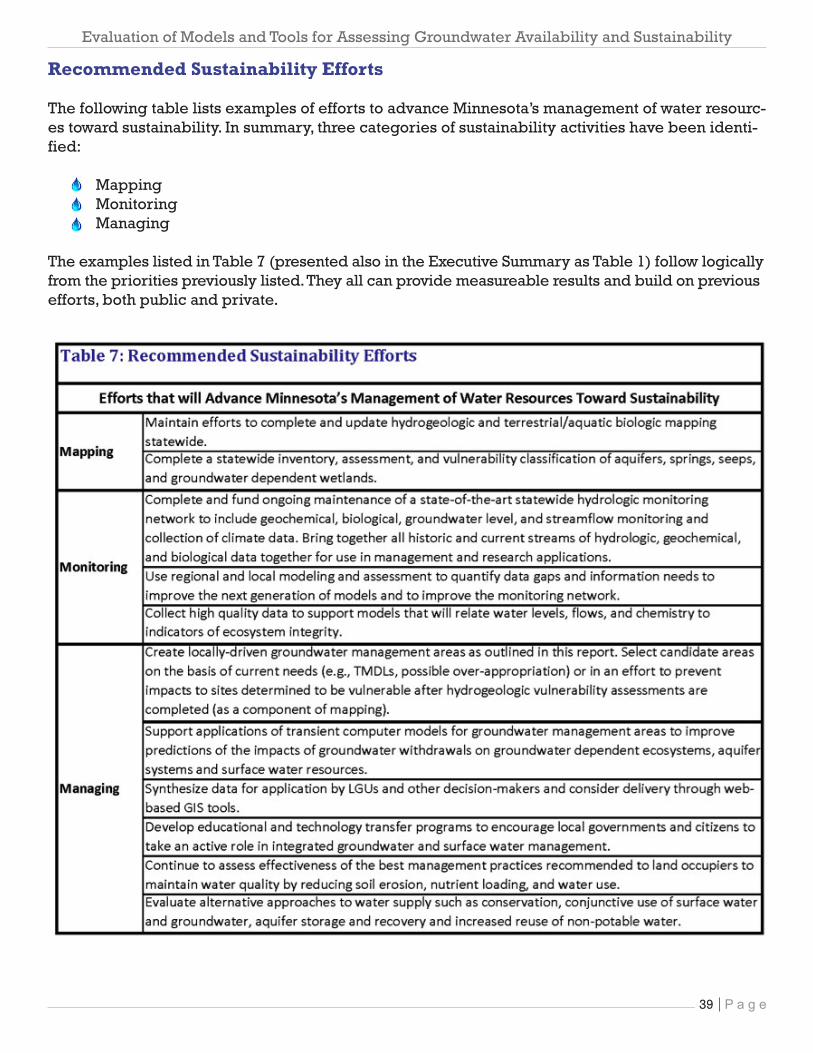
Evaluation of Models and Tools for Assessing Groundwater Availability and Sustainability
Recommended Sustainability Efforts
The following table lists examples of efforts to advance Minnesota’s management of water resourc-es toward sustainability. In summary, three categories of sustainability activities have been identi-fied:
Mapping Monitoring Managing
The examples listed in Table 7 (presented also in the Executive Summary as Table 1) follow logically from the priorities previously listed. They all can provide measureable results and build on previous efforts, both public and private.
39 P a g e

Evaluation of Models and Tools for Assessing Groundwater Availability and Sustainability
APPENDIX A. Comparison of Programs and Studies Regarding Minnesota Water Resource Supply and Demand
Evaluationcriteria
Descriptionof
program/studyandits
application Methods
Underlyingdatasets,
mainfactor(s)
Scale/
resolution
Watersupplyplanningandpermitting
WaterSupplyPlans
(MS103G.291)
Identificationofpotential
resourceissuesandwater
supplyalternativesto
addressexistingandfuture
needs
Sustainabilityand
availability
assessmentsusing
waterlevelsand
otherdata
Geologicmapping
(whereavailable),
monitoringdataand
resourcespecific
modeling
Local(publicwater
supplier)covering
theareaof
influence
DNRWaterAppropriation
PermitProgram
(MS103G.271)
Theevaluationofwater
appropriationrequests.
Waterusedatatoevaluate
resourceimpacts.
Structureforadaptive
management
Aquifertestsand
resourcemonitoring
Wellconstruction,
waterlevelandaquifer
testdata.Geological
mapping(where
available)andresource
specificmodeling.
Sitebasedwith
aquiferand
watershed
considerations
Hydrogeologicmapping/GISmodeling
DNR/MGSCountyAtlas
Program
Locallanduseplanning;
qualitativeanalysisof
pollutionsensitivityand
groundwaterrechargefor
shallowtomediumdepth
aquifers
Hydrogeologic
mapping/GIS3D
spatialanalysis
Surfaceandsubsurface
geologicmapping,
geochemistry,County
WellIndexwaterlevels
Variable,typically
1:100,000
Comparisonoflocalto
regionalscaleestimatesof
ground‐waterrechargein
MN,USGS2006
Constructandcalibrate
groundwaterflowmodels
forlargeareas
Algorithm/GIS Precipitation,growing
degreedays,soiltype
100km2/orderof
magnitudesoil
hydraulic
conductivity
40 P a g e

Evaluation of Models and Tools for Assessing Groundwater Availability and Sustainability
Hydrogeologicmappingwithquantitativeaquifercomputermodeling
MetroGroundWater
Model2.0
Predictivetoolfor
estimatingquantitative
effectsoflargeground
waterwithdrawalsor
climatechange
3Dsteady‐state
computermodel
Streamflow,surface
andsubsurfacegeologic
mapping,CWIwater
levels,aquifertestand
precipitationdata
Regionalandsub‐
regional
USGSAquiferStudies Predictivetoolfor
estimatingquantitative
effectsofgroundwater
withdrawalsorclimate
change
Waterlevel,aquifer
test,andprecipitation
analysis,aquifer
computermodeling
Surfaceandsubsurface
geologicmapping,
waterlevel,aquifer
test,geochemicaland
precipitationdata
Localandcounty
WellheadProtection
Studies
Predictivetoolfor
estimatingrechargeand
potentialcontaminant
capturezoneof
communitywellorwell
field.
Waterlevel,aquifer
testandprecipitation.
analysis,aquifer
computermodeling
Surfaceandsubsurface
geologicmapping,
waterlevel,aquifer
test,andgeochemical
data.
Local
Watersustainabilityplanningtoolsandstudies
WatershedAssessment
Tool,DNR
Quickaccesstoresource
information(land,water,
infrastructure)onaweb‐
basedGISplatform
Compilationof
publisheddata
presentedwithina5
componentresource
frameworktoassess
watershedhealth
FiveComponents:
Hydrology,
Geomorphology,
Biology,Connectivity,
andWaterQualityare
assessedthrough
approximately45GIS
baselayers
WatershedWatershedAssessment
Tool,DNR
Quickaccesstoresource
information(land,water,
infrastructure)onaweb‐
basedGISplatform
Compilationof
publisheddata
presentedwithina5
componentresource
frameworktoassess
watershedhealth
FiveComponents:
Hydrology,
Geomorphology,
Biology,Connectivity,
andWaterQualityare
assessedthrough
approximately45GIS
baselayers
Watershed
Water Sustainability
Planning Tool (WSPT), EQB 2008
Providebroadqualitative
andquantitative
perspectivefornewand
futurewateruses;support
locallanduseplanning
GIS,regionalwater
balance,compilation
ofpublishedquantity
andqualitydata
Rechargedata,
precipitationdata,land
use,impairedwaters,
CWI,DNRpermitdata
1300km2
UseofMinnesota’s
RenewableWater
Resources:Moving
TowardSustainability,
EQB2007
Providecounty‐wide
perspectiveonwateruse
andestimatedsustainable
supply
Comparedsupplyand
demandatthecounty
scalefortheyears
2005and2030
Rechargeanddischarge
data,precipitationdata,
climate‐adjustedwater
use,populationand
waterdemand
projections
County
41 P a g e

Evaluation of Models and Tools for Assessing Groundwater Availability and Sustainability
WaterResource
Sustainability,UofMN
2007
(LCCMRinprogress)
Quantificationand
regionalizationof
sustainable(renewable)
watersupplyfor
comparisonwithhuman
andecologicalneedsata
multiplescales
Multidimensional
statisticalmodels
relatingwatershed
waterbalance
componentfluxesto
watershed
geophysical
properties.
Selectedstreamflow
data,andearth
geophysicaldata
including:geological,
hydrogeological,soil,
vegetativecover,land
use,streamnetwork,
topography,and
climate.
County,regional,
state,national,
continental,global
FutureofEnergyand
MinnesotaWater
Resources,UofMN2007
(LCCMRinprogress)
Toexploresystemic
linkagesbetweenenergy
andwaterinMinnesota;to
identifyregionsofthe
statethatmaybewater
limitedinfutureunder
differentscenarios
Algorithms,GIS,
systemdynamics
modeling
Waterstocksandflows
(atmosphere,land
surface,aquifers),
waterconsumptionby
humansystems,energy
production,climate
change
100km2
42 P a g e

Evaluation of Models and Tools for Assessing Groundwater Availability and Sustainability
Ap
pen
dix
B: P
rin
cip
al T
ypes
of D
ata
and
Dat
a C
omp
ilat
ion
s R
equ
ired
for
An
alys
is fo
r G
rou
nd
wat
er S
yste
ms
Data
ty
pe o
r d
ata
co
mp
ilati
on
S
tatu
s in
Min
neso
ta (
scale
dep
en
den
t)
Gen
era
lly
Ad
eq
uate
Lim
ited
Ad
eq
uacy
Gen
era
lly
no
t A
deq
uate
Data
Access
Co
mm
en
ts
Ph
ysic
al F
ram
ew
ork
Topogra
phic
maps s
how
ing the
str
eam
dra
inage n
etw
ork
, surf
ace
-
wate
r bodie
s, la
ndfo
rms, cultura
l fe
atu
res, and locations o
f str
uctu
res
and a
ctivitie
s r
ela
ted to w
ate
r
X
Good
Geolo
gic
map
s o
f surf
icia
l deposits
and b
edro
ck
X
Good
1:1
00,0
00 s
cale
or
more
deta
il is
necessary
; C
ounty
Geolo
gic
Atlas P
rogra
m is p
rim
ary
sourc
e
Hydro
geolo
gic
maps s
how
ing e
xte
nt
and b
oundaries o
f aquifers
and
confinin
g u
nits
X
Good
1:1
00
,000 s
cale
or
more
deta
il is
necessary
; C
ounty
Geolo
gic
Atlas P
rogra
m is p
rim
ary
sourc
e.
Mappin
g
of buried g
lacia
l aquifers
is r
ela
tively
new
and n
eeds
attention.
Maps o
f to
ps a
nd b
ottom
s o
f aquifers
and c
onfinin
g u
nits
X
Good
Mostly a
vaila
ble
for
bedro
ck a
quifers
, and v
ery
recen
t C
ounty
Geolo
gic
Atlases
Satu
rate
d-t
hic
kness m
aps o
f
unconfined (
wate
r-ta
ble
) and
confined a
quifers
X
Fair
Som
e o
lder
maps n
eed d
igitiz
ing
Avera
ge h
ydra
ulic
conductivity m
aps
for
aquifers
and c
onfinin
g u
nits a
nd
transm
issiv
ity m
aps for
aquifers
X
Poor
Maps s
how
ing
variations in s
tora
ge
coeffic
ient fo
r aquifers
X
P
oor
Estim
ate
s o
f a
ge o
f gro
undw
ate
r at
sele
cte
d locations in a
quifers
X
G
ood
Data
ty
pe o
r d
ata
co
mp
ilati
on
Gen
era
lly
Ad
eq
uate
Lim
ited
Ad
eq
uacy
Gen
era
lly
no
t A
deq
uate
Data
Access
Co
mm
en
ts
Hy
dro
log
ic B
ud
gets
an
d S
tresses
Pre
cip
itation d
ata
X
G
ood
Evapora
tion d
ata
X
X
Fair
Evapo
transpiration d
ata
als
o n
eeded
43 P
a g
e

Evaluation of Models and Tools for Assessing Groundwater Availability and Sustainability
Data
ty
pe o
r d
ata
co
mp
ilati
on
Gen
era
lly
Ad
eq
uate
Lim
ited
Ad
eq
uacy
Gen
era
lly
no
t A
deq
uate
Data
Access
Co
mm
en
ts
Hy
dro
log
ic B
ud
gets
an
d S
tresses
Pre
cip
itation d
ata
X
G
ood
Evapora
tion d
ata
X
X
Fair
Evapotr
anspiration d
ata
als
o n
eeded
Str
eam
flow
da
ta, in
clu
din
g
measure
ments
of gain
and loss o
f
str
eam
flow
betw
een g
agin
g s
tations
X
X
Good
Good
covera
ge o
f str
eam
flow
, but
not
necessarily
unre
gula
ted s
tream
flow
, part
icula
rly in t
he c
entr
al
and e
aste
rn p
art
s o
f th
e s
tate
. G
ood c
overa
ge o
f gain
ing a
nd losin
g s
tream
s lim
ited.
Maps o
f th
e s
tream
dra
inage n
etw
ork
show
ing e
xte
nt of norm
ally
pere
nnia
l flow
, norm
ally
dry
channels
, and
norm
ally
seasonal flow
X
X
Good
Estim
ate
s o
f to
tal gro
und-w
ate
r
dis
charg
e to s
tream
s
X
X
F
air
Measure
ments
of spring d
ischarg
e
X
X
F
air
Measure
ments
of surf
ace-w
ate
r div
ers
ions a
nd r
etu
rn flo
ws
X
Fair
Quantities a
nd locations o
f in
terb
asin
div
ers
ions
X
Fair
His
tory
and s
patial dis
trib
ution o
f pum
pin
g r
ate
s in a
quifers
X
X
Fair
Am
ount
of gro
undw
ate
r consum
ed
for
each type o
f use a
nd s
patial
dis
trib
ution o
f re
turn
flo
ws
X
X
Good/F
air
Well
hydro
gra
phs a
nd h
isto
rical head
(wate
r-le
vel) m
aps for
aquifers
X
X
Good/F
air
Som
e h
isto
rical m
aps a
re n
ot
very
accessib
le.
Som
e
are
as lack c
om
pile
d h
isto
rical in
form
ation.
Poor
covera
ge o
f hydro
gra
phs s
uitable
for
estim
ating
recha
rge.
Location
of re
charg
e a
reas (
are
al
recharg
e fro
m p
recip
itation, lo
sin
g
str
eam
s, irrigate
d a
reas, re
charg
e
basin
s, and r
echarg
e w
ells
), a
nd
estim
ate
s o
f re
charg
e
X
X
Fair
44 P
a g
e

Evaluation of Models and Tools for Assessing Groundwater Availability and Sustainability
Gen
era
lly
Ad
eq
uate
Lim
ited
Ad
eq
uacy
Gen
era
lly
no
t A
deq
uate
Data
Access
Co
mm
en
ts
Ch
em
ical F
ram
ew
ork
Geochem
ical chara
cte
ristics o
f eart
h
mate
rials
and n
atu
rally
occurr
ing
gro
undw
ate
r in
aquifers
and
confinin
g u
nits
X
X
Fair
Spatial dis
trib
ution
of w
ate
r qualit
y in
aquifers
, both
are
ally
and w
ith d
epth
X
X
G
ood/F
air
Tem
pora
l cha
nges in w
ate
r qualit
y,
part
icula
rly for
conta
min
ate
d o
r pote
ntially
vuln
era
ble
unconfined
aquifers
X
X
Fair/P
oor
Sourc
es a
nd types o
f pote
ntial
conta
min
ants
X
X
G
ood/F
air
Chem
ical cha
racte
ristics o
f art
ific
ially
intr
oduced w
ate
rs o
r w
aste
liq
uid
s
X
---
???
Maps o
f la
nd c
over/
land u
se a
t
diffe
rent scale
s, dependin
g o
n s
tudy
needs
X
Good
Str
eam
flow
qu
alit
y (
wate
r-qualit
y
sam
plin
g in s
pace a
nd tim
e)
part
icula
rly d
uring p
eriods o
f lo
w flo
w
X
Fair?
Modifie
d fro
m U
SG
S C
ircula
r 1186, T
able
2, p. 69.
Note
: "G
enera
lly a
dequate
" im
plie
s d
ata
suitable
for
multip
le s
cale
s; "L
imited a
dequacy"
implie
s d
ata
part
ially
lim
ited b
y s
cale
, geogra
phic
exte
nt,
or
com
ple
teness; "G
enera
lly n
ot adequate
" in
dic
ate
s d
ata
useabili
ty v
ery
lim
ited d
ue to c
om
ple
teness, g
eogra
phic
covera
ge,
lack o
f his
torical
info
rmation, or
oth
er
restr
ictions.
Note
: F
or
"Data
Access"
Colu
mn, "G
ood"
indic
ate
s d
ata
on
-lin
e in u
seable
form
at; "
Fair"
lackin
g o
ne o
r both
of
"good"
crite
ria,
perh
aps o
nly
availa
ble
in p
ublis
hed d
ocum
ents
in p
aper
form
at; "
Poor"
indic
ate
s "
papers
in a
shoebox":
either
data
not
colle
cte
d,
in u
npublis
hed p
aper
form
only
,
or
not re
adily
accessib
le.
45 P
a g
e