groundwater availability for irrigation in sub-saharan africa
TRANSCRIPT

Groundwater availability for irrigationin Sub-Saharan Africa
Karen G. VillholthPrincipal Researcher and sub-Theme Leader
IWMI, International Water
Management InstitutePretoria, South Africa
2016 Water for Food Global ConferenceNebraska Innovation Campus, Lincoln, Nebraska, USA, 24-26 April, 2016
Outline
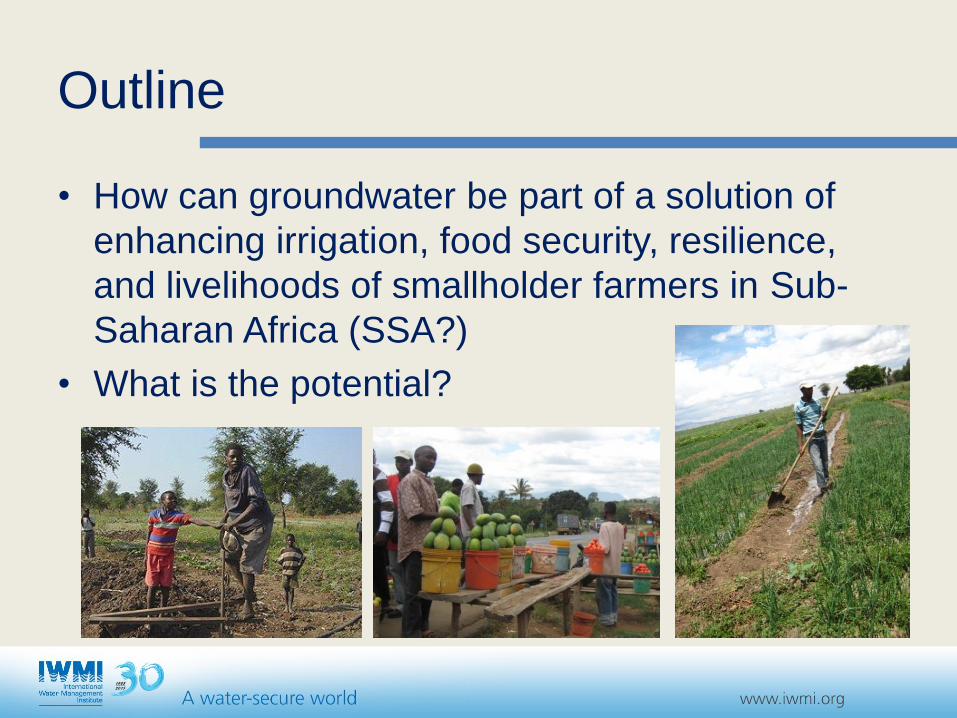
• How can groundwater be part of a solution of
enhancing irrigation, food security, resilience,
and livelihoods of smallholder farmers in Sub-
Saharan Africa (SSA?)
• What is the potential?

GW irrigated/cultivated land
Africa ~1 % Asia ~14 %Siebert et al., 2010
GW irrigation intensity
Percentage of 5 arc min grid cell area equipped for irrigationwith groundwater

Ph
oto
: Dav
id B
razi
er/I
WM
IP
ho
to :T
om
van
Cak
enb
ergh
e/IW
MI
Based on a water balance calculation done annually over a 41 year period (1960 –
2000) at a resolution of 50 km x 50 km
Some assumptions in computations
GW is the only water source for irrigation (no conjunctive use with SW)
GW is usable and accessible (no quality, yield, or socio-economic constraints)
GW is locally available
𝑮𝑾𝑰𝑷 (m2) =𝐺𝑊 𝐴𝑣𝑎𝑖𝑙𝑎𝑏𝑙𝑒 (m3 year−1)
𝐼𝑟𝑟𝑖𝑔. 𝑊𝑎𝑡𝑒𝑟 𝐷𝑒𝑚𝑎𝑛𝑑 (𝑚 year−1) (calculated annually)
𝑰𝒓𝒓𝒊𝒈. 𝑾𝒂𝒕𝒆𝒓 𝑫𝒆𝒎𝒂𝒏𝒅 ={σ𝑖=1
𝑛 σ𝑗=1𝑚 𝐶𝑟𝑜𝑝𝑊𝑎𝑡𝑒𝑟 𝐷𝑒𝑚𝑎𝑛𝑑−𝐺𝑟𝑒𝑒𝑛𝑊𝑎𝑡𝑒𝑟 𝑗 × % 𝑜𝑓 𝐴𝑟𝑒𝑎 𝑖 }
𝐼𝑟𝑟𝑖𝑔. 𝐸𝑓𝑓𝑖𝑐𝑖𝑒𝑛𝑐𝑦=
𝑁𝑒𝑡 𝐼𝑟𝑟𝑔. 𝑊𝑎𝑡𝑒𝑟 𝐷𝑒𝑚𝑎𝑛𝑑
𝐼𝑟𝑟𝑖𝑔. 𝐸𝑓𝑓𝑖𝑐𝑖𝑒𝑛𝑐𝑦(n= crop)
(Calculated monthly then summed on an annual value)
𝑮𝑾𝑨𝒗𝒂𝒊𝒍𝒂𝒃𝒍𝒆 = 𝐺𝑊 𝑅𝑒𝑐ℎ𝑎𝑟𝑔𝑒 – 𝐻𝑢𝑚𝑎𝑛 𝐺𝑊 𝐷𝑒𝑚𝑎𝑛𝑑 – 𝐸𝑛𝑣𝑖𝑟𝑜𝑛. 𝐺𝑊 𝑅𝑒𝑞
(calculated annually then averaged over 41 years to consider buffer effect of GW)
Mapping irrigation potential from renewable
GW in Africa Altchenko & Villholth, 2015

Ph
oto
: Dav
id B
razi
er/I
WM
IP
ho
to :T
om
van
Cak
enb
ergh
e/IW
MI
Hydrological data from the PCR-GLOBWB model
(Utrecht University, the Netherlands, Wada et al., 2011)
• Reference evapotranspiration
• Water available from rain for crop(green water = transpiration soil 1 and 2)
• Recharge
Other GW uses• human activities (domestic, livestock, industrial) based on ‘’present’’
human water demand derived from density of population and livestock, and unit requirement (FAO, geonetwork)
• environment based on according to three different scenarios: Scenario 1 : 70% of the recharge goes to environment Scenario 2 : 50% of the recharge goes to environment Scenario 3 : 30% of the recharge goes to environment
Different geographical data compiled in GIS
Resolution: 0.5 degree(≈ 50 km x 50 k cell)
Crop data• Crop distribution• Crop water demand• Irrigation efficiency
monthly calendar for crop group water demand
Methodology

Ph
oto
: Dav
id B
razi
er/I
WM
IP
ho
to :T
om
van
Cak
enb
ergh
e/IW
MI
Average Net Irrigation Water Demand (1960-2000)
Results
Rainfall
Cropland

Ph
oto
: Dav
id B
razi
er/I
WM
IP
ho
to :T
om
van
Cak
enb
ergh
e/IW
MI
Proportion of cropland irrigable with groundwater
A factor of 20 increase in overall GWI area possible (from 2 to ≈ 40 mill ha.)
Environmental requirements represent
70% of recharge 50% of recharge 30% of recharge
Area (106 ha) 44.6 74.9 105.3
% of cropland 20.5% 34.5% 48.5%
Results
70% 30%50%

Ph
oto
: Dav
id B
razi
er/I
WM
IP
ho
to :T
om
van
Cak
enb
ergh
e/IW
MI
Comparison with GW irrigated cropland in 2005 (Siebert et al., 2010)
(a) Actual area irrigated with groundwater in 2005 expressed in ha. per cell adapted from Siebert et al. (2010) and (b) groundwater irrigation potential for scenario 2 for the year 2000 expressed as the percentage of the area irrigated with groundwater in 2005
Results

9
The GWIDP is determined by combining the
socio-economic factors influencing the
groundwater irrigation development in Africa:
• Lack of access to surface water: the
GWIDP decreases closer to perennial
surface water resources
• Access to market: the GWIDP increases
closer to towns and roads as groundwater
irrigation is often associated with cash
crops
• Soil suitability for agriculture: irrigation
is more suitable for specific soil
characteristics.
• Borehole investment: the GWIDP
decreases with the depth of the
groundwater table
• Access to energy: the GWIDP increases
closer to the electrical grid as electricity is
the cheapest energy source for pumping.
Overlaying with socio-economic factors

Ph
oto
: Dav
id B
razi
er/I
WM
IP
ho
to :T
om
van
Cak
enb
ergh
e/IW
MI
(a) Average annual recharge (mm/year), and (b) its coefficient of variation (%), both over the period 1960-2000 (data from Wada et al., 2011)
Country
Recharge (mm/yr)
FAO, AQUAStat,
2009
Döll and
Fiedler, 2008
This study
Burkina Faso 34.6 39 39
Ethiopia 18.1 39 80
Ghana 110.3 105 127
Kenya 6.0 46 29
Malawi 21.1 164 170
Mali 16.1 22 23
Mozambique 21.3 104 82
Niger 2.0 12 4
Nigeria 94.2 163 154
Rwanda 265.8 68 78
Tanzania 31.7 93 90
Uganda 122.9 95 50
Zambia 62.4 108 117
Recharge variability
Recharge uncertainty and variability
Recharge uncertainty
Ph
oto
: Dav
id B
razi
er/I
WM
IP
ho
to :T
om
van
Cak
enb
ergh
e/IW
MI
11
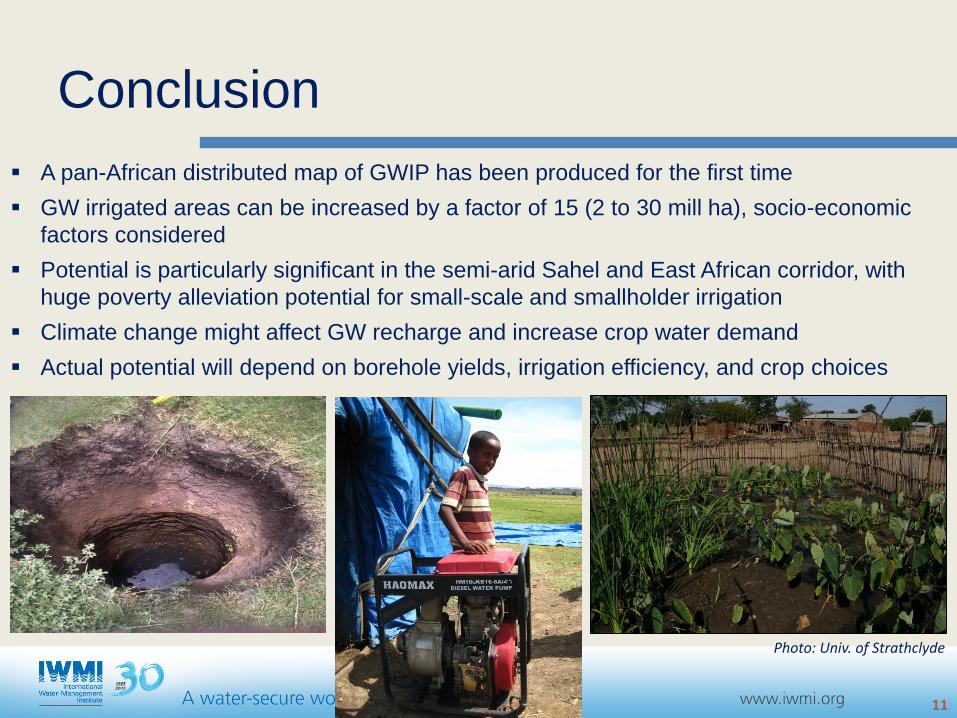
A pan-African distributed map of GWIP has been produced for the first time
GW irrigated areas can be increased by a factor of 15 (2 to 30 mill ha), socio-economic
factors considered
Potential is particularly significant in the semi-arid Sahel and East African corridor, with
huge poverty alleviation potential for small-scale and smallholder irrigation
Climate change might affect GW recharge and increase crop water demand
Actual potential will depend on borehole yields, irrigation efficiency, and crop choices
Conclusion
Photo: Univ. of Strathclyde
Ph
oto
: Dav
id B
razi
er/I
WM
IP
ho
to :T
om
van
Cak
enb
ergh
e/IW
MI
Altchenko, Y. and Villholth, K.G.: Mapping irrigation potential from renewable groundwater in Africa - a quantitative hydrological approach. Hydrol. Earth Syst. Sci., 19, 1055-1067. doi:10.5194/hess-19-1055-2015, 2015.
Siebert, S., Burke, J., Faures, J. M., Frenken, K., Hoogeveen, J., Döll, P., and Portmann, F. T.: Groundwater use for irrigation – a global inventory, Hydrol. Earth Syst. Sci., 14, 1863–1880, doi:10.5194/hess-14-1863-2010, 2010.
Wada, Y., Van Beek, L, Viviroli, D., Dürr, H., Weingartner, R., and Bierkens, M.: Global monthly water stress: 2. Water demand and severity of water stress, Water Resour. Res., 47, W07517, doi:10.1029/2010WR009792, 2011.
