evaluation of seismic damage indices for ... national center for earthquake engineering research...
TRANSCRIPT

PB91-171322
NATIONAL CENTER FOR EARTHQUAKE ENGINEERING RESEARCH
State University of New York at Buffalo
EVALUATION OF SEISMIC DAMAGE INDICES FOR REINFORCED CONCRETE STRUCTURES
by
S. Rodriguez-Gomez and A. S. Cakmak Department of Civil Engineering and Operations Research
School of Engineering and Applied Science Princeton University
Princeton, New Jersey 08544
REPRODUCED BY
u.s. DEPARTMENT OF COMMERCE NATIONAL TECHNICAL
INFORMATION SERVICE SPRINGFIELD, VA 22161
Technical Report NCEER-90-0022
September 30, 1990
This research was conducted at Princeton University and was partially supported by the National Science Foundation under Grant No. EeE 86-07591.

NOTICE This report was prepared by Princeton University as a result of research sponsored by the National Center for Earthquake Engineering Research (NCEER). Neither NCEER, associates of NCEER, its sponsors, Princeton University or any person acting on their behalf:
a. makes any warranty, express or implied, with respect to the use of any information, apparatus, method, or process disclosed in this report or that such use may not infringe upon privately owned rights; or
b. assumes any liabilities of whatsoever kind with respect to the use of, or the damage resulting from the use of, any information, apparatus, method or process disclosed in this report.

BIBLIOGRAPHIC INFORMATION
PB91-171322
Report Nos: NCEER-90-0022
Title: Evaluation of Seismic Damage Indices for Reinforced Concrete Structures.
Date: 30 Sep 90
Authors: S. Rodriguez-Gomez, and A. S. Cakmak.
Performing Organization: National Center for Earthquake Engineering Research, Buffalo, NY.**Princeton Univ., NJ. Dept. of Civil Engineering and Operations Research.
Sponsoring Organization: *National Science Foundation, Washington, DC.
Grant Nos: NSF-ECE86-07591
Type of Report and Period Covered: Technical rept.
Supplementary Notes: Prepared in cooperation with Princeton Univ., NJ. Dept. of Civil Engineering and Operations Research. Sponsored by National Science Foundation, Washington, DC.
NTIS Field/Group Codes: 89D, 89G, 50B
Price: PC A06/MF A01
Availability: Available from the National Technical Information Service, Springfield, VA. 22161
Number of Pages: 102p
Keywords: *Reinforced concrete, *Framed structures, *Earthquake resistant structures, *Damage assessment, Structural analysis, Softening, Computerized simulation, Buildings, Drift, Ductility, SARCF-II computer program.
Abstract: The report presents some new information about the correlation between various local and global damage indices and the damage level. The information is obtained by analyzing the results of numerical simulations of the seismic response of three code-designed reinforced concrete frames subjected to a set of artifically generated and recorded earthquakes. The results were computed by using an improved version of the computer code SARCF-II (Seismic Analysis of Reinforced Concrete Frames-Version II). The new version is tested by compring computed results to experimental ones obtained from a reinforced concrete model tested at the University of Illinois at Urbana-Champaign. The maximum softening as a global damage index is compared to weighted averages of local damage indices and to traditional measures of damage such as the maximum inters tory drift, the permanent inters tory drift and the maximum ductility ratio for beams and columns. The maximum softening index is also compared to the final softening one. The global softening indices are helpful for identifying structures that need careful
i Continued on next page

BIBLIOGRAPHIC INFORMATION
Cont inued ... PB9l-l71322
inspection after an earthquake and are applicable to reinforced concrete structures with or without shear walls.
11

I I /11 11----------
EVALUATION OF SEISMIC DAMAGE INDICES FOR REINFORCED CONCRETE STRUCTURES
by
S. Rodrlguez-G6mez1 and A.S. Cakmak2
September 30, 1990
Technical Report NCEER-90-0022
NCEER Project Number 89-1104
NSF Master Contract Number ECE 86-07591
1 Graduate Student, Department of Civil Engineering, Princeton University 2 Professor, Department of Civil Engineering, Princeton University
NATIONAL CENTER FOR EARTHQUAKE ENGINEERING RESEARCH State University of New York at Buffalo Red Jacket Quadrangle, Buffalo, NY 14261
1-1)


PREFACE
The National Center for Earthquake Engineering Research (NCEER) is devoted to the expansion and dissemination of knowledge about earthquakes, the improvement of earthquake-resistant design, and the implementation of seismic hazard mitigation procedures to minimize loss of lives and property. The emphasis is on structures and lifelines that are found in zones of moderate to high seismicity throughout the United States.
NCEER's research is being carried out in an integrated and coordinated manner following a structured program. The current research program comprises four main areas:
• Existing and New Structures • Secondary and Protective Systems • Lifeline Systems • Disaster Research and Planning
This technical report pertains to Program 1, Existing and New Structures, and more specifically to reliability analysis and risk assessment.
The long term goal of research in Existing and New Structures is to develop seismic hazard mitigation procedures through rational probabilistic risk assessment for damage or collapse of structures, mainly existing buildings, in regions of moderate to high seismicity. This work relies on improved definitions of seismicity and site response, experimental and analytical evaluations of systems response, and more accurate assessment of risk factors. This technology will be incorporated in expert systems tools and improved code formats for existing and new structures. Methods of retrofit will also be developed. When this work is completed, it should be possible to characterize and quantify societal impact of seismic risk in various geographical regions and large municipalities. Toward this goal, the program has been divided into five components, as shown in the figure below:
Program Elements:
I Seismicity, Ground Motions and Seismic Hazards Estimates
+ I Geotechnical Studies, Soils
and Soil-Structure Interaction
+ I System Response: I
Testing and Analysis I J 1"
I Reliability Analysis and Risk Assessment
l _ .. J -
I
, I J ,
Expert Systems
iii
Tasks: Earthquake Hazards Estimates,
Ground Motion Estimates, New Ground Motion Instrumentation,
EMhquake & Ground Motion Data Base.
Site Response Estimates,
Large Ground Deformation Estimates, Soil·Structure Interaction.
Typical Structures and Crttical Structural Components: Testing and Analysis;
Modern Analytical Tools.
Vulnerability Analysis,
Reliability Analysis,
Risk Assessment,
Code Upgrading.
Architectural and Structural Design, Evaluation of Existing Buildings.

Reliability analysis and risk assessment research constitutes one of the important areas of Existing and New Structures. Current research addresses, among others, the following issues:
1. Code issues - Development of a probabilistic procedure to determine load and resistance factors. Load Resistance Factor Design (LRFD) includes the investigation of wind vs. seismic issues, and of estimating design seismic loads for areas of moderate to high seismicity.
2. Response modification factors - Evaluation of RMFs for buildings and bridges which combine the effect of shear and bending.
3. Seismic damage - Development of damage estimation procedures which include a global and local damage index, and damage control by design; and development of computer codes for identification of the degree of building damage and automated damage-based design procedures.
4. Seismic reliability analysis of building structures - Development of procedures to evaluate the seismic safety of buildings which includes limit states corresponding to serviceability and collapse.
5. Retrofit procedures and restoration strategies. 6. Risk assessment and societal impact.
Research projects concerned with reliability analysis and risk assessment are carried out to provide practical tools for engineers to assess seismic risk to structures for the ultimate purpose of mitigating societal impact.
This report presents new information about the correlation between various local and global damage indices, and the damage level. This information is obtained by analyzing the results of numerical simulations of the seismic response of reinforced concrete frames. The Maximum Softening as a global damage index is compared to weighted averages of local damage indices and to traditional measures of damage such as the maximum interstory drift, the permanent interstory drift and the maximum ductility ratio for beams and columns. The Maximum Softening is also compared to the Final Softening. These different measures of damage are herein evaluated.
iv

ABSTRACT
This report presents some new information about the correlation between various local
and global damage indices, and the damage level. This information is obtained by ana
lyzing the results of numerical simulations of the seismic response of reinforced concrete
frames.
The seismic response of three code-designed reinforced concrete frames subjected to a
set of artificially generated and recorded earthquakes is computed by using an improved
version of the computer code SARCF-II, described herein. This new version is tested by
comparing computed results to experimental ones obtained from a reinforced concrete
model tested at the University of Illinois at Urbana-Champaign.
The Maximum Softening as a global damage index is compared to weighted averages
of local damage indices and to traditional measures of damage such as the maximum
inters tory drift, the permanent interstory drift and the maximum ductility ratio for beams
and columns. This Maximum Softening index is also compared to the Final Softening
one.
These discussed global softening indices are helpful for identifying structures that need
careful inspection after an earthquake and are applicable to reinforced concrete structures
with/without shear walls.
v

vi

ACKNOWLEDGEMENTS
This research was supported by a grant from the National Center for Earthquake Engi
neering Research, SUNY, Buffalo, NY. This support is gratefully acknowledged.
The authors are grateful to Y.S. Chung and Sashi K. Kunnath for providing information
about the computer programs SARCF and IDARC, respectively, and to Prof. Masanobu
Shinozuka for his comments and suggestions.
vii
Preceding page blank

! ( , \
V II \

TABLE OF CONTENTS
SECTION TITLE
1 INTRODUCTION ..
1.1 Statement of the Problem
1.2 Organization of the Work
2 LOCAL AND GLOBAL DAMAGE INDICES
2.1
2.1.1
2.1.2
2.2
2.2.1
2.2.2
Local Damage Indices
Chung, Meyer and Shinozuka's Local Damage Index
Park and Ang's Local Damage Index
Global Damage Indices
Weighted Average of the Local Damage Indices
Global Damage Indices Based on the Vibrational Parameters
PAGE.
1-1
1-1
1-2
2-1
2-1
2-2
2-4
2-9
2-9
2-11
2.2.3 Computation of the Maximum Softening by Averaging the Instantaneous Natural Period . . . . . . . . . . . . . . . . 2-13
3 COMPUTER PROGRAM SARCF-III 3-1
3.1 General Description 3-1
3.2 Improvements of the Program 3-6
3.3 Remaining Limitations 3-8
3.4 Comparison between Computed and Experimental Results 3-8
3.4.1 First Run (Run H 1-1) 3-11
3.4.2 Second Run (Run HI-2) 3-13
3.4.3 Third Run (Run Hl-3) 3-15
3.4.4 Conclusions 3-17
IX
Preceding page blank

SECTION TITLE PAGE
4 NUMERICAL SIMULATIONS FOR BUILDING STRUC-TURES . . . . . . . . . . . . . . . 4-1
4.1 Description of the Buildings to Be Analyzed 4-1
4.1.1 Two Bay Three Story Buiding Frame 4-1
4.1.2 TIrree Bay Four Story Buiding Frame 4-3
4.1.3 Three Bay Four Story Buiding Frame (Weak Columns) 4-3
4.2 Input Ground Acceleration . 4-3
4.3 Parameters to Be Computed 4-7
4.3.1 Traditional Measures of Damage 4-7
4.3.2 Local Damage Indices 4-9
4.3.3 Global Damage Indices 4-9
4.3.4 Response of the Damaged Structure to a Second Earthquake 4-11
5 ANALYSIS OF THE RESULTS . . . . . . . . 5-1
5.1 Systems Identification Program vs. Moving Average 5-1
5.2 Maximum Softening vs. Traditional Measures of Damage 5-4
5.2.1 Maximum Interstory Drift 5-7
5.2.2 Maximum Final Drift 5-9
5.2.3 Maximum Ductility Ratio for Beams and Columns 5-11
5.3 Maximum Softening vs. Weighted Averages of Local Damage Indices .................... 5-13
5.3.1 Energy Average of the Modified Park and Ang's Index 5-15
5.3.2 Energy Average of the Chung, Meyer and Shinozuka's Index 5-17
5.3.3 Weighted Average of Chung, Meyer and Shinozuka's Story In-dex ............... 5-19
5.4 Maximum Softening vs. Final Softening 5-19
6 CONCLUSIONS . . . . . . . . . . . . . . . . . . . 6-1
x

SECTION TITLE
6.1 Conclusions . . . . . . . .
6.2 Suggestions for Future Research
PAGE
6-1
6-3
7 REFERENCES .................... 7-1
xi


FIGURE
2-1
2-2
LIST OF ILLUSTRATIONS
TITLE
Strength Drop Due to Cycling Loading . . . . .
Cantilever Beam and Moment-Curvature Diagram
PAGE
2-3
2-5
2-3 Curvature and Bending Moment Diagram for a Cantilever Beam. 2-6
2-4 Original vs. Modified Park & Ang's Damage Index . . . . . . 2-8
2-5 Averaged Instantaneous Natural Period for Different Averaging Windows. . . . . . . . . . . . . . . . . . . . . . . . 2-15
2-6 Variance Function and Maximum Natural Period as a Function of the Length of the Averaging Window . . . . . . . . . . . 2-17
2-7 Maximum Natural Period as a Function of the Length of the Av-eraging Window
2-8 Instantaneous Natural Period and Local Average
2-9 Local Average of the Instantaneous Natural Period and Natural Period of an Equivalent Linear System . .
2-19
2-20
2-22
3-1 Hysteretic Moment-Curvature Relationship 3-2
3-2 Definition of Failure . . . . 3-3
3-3 Strength Deterioration Curve 3-5
3-4 Test Structure Used for the Comparison 3-10
3-5 Comparison between Experimental and Computed Results (First
Run) ......................... 3-12
3-6 Comparison between Experimental and Computed Results (Sec-ond Run). . . . . . . . . . . . . . . . . . . . . . . . 3-14
3-7 Comparison between Experimental and Computed Results (Third Run) ...................... 3-16
4-1 Details of the Two Bay Three Story Building Frame. 4-2
4-2 Details of the Three Bay Four Story Building Frame 4-4
Xlll
Preceding page blank

FIGURE
4-3
4-4
TITLE
Maximum Softening vs. Peak Ground Acceleration
Curvature vs. Displacement Ductility Ratio . . .
PAGE
4-6
4-8
4-5 Acceleration and Displacement Time History in a Case Defined as Collapse . . . . . . . . . . . . . . . . . . . . . . . 4-10
5-1 Maximum Softening. System Identification Program vs. Mov-ing Average . 5-2
5-2 Final Softening. System Identification Program vs. Moving Av-erage . . 5-3
5-3 Maximum Softening vs. Maximum Interstory Drift 5-5
5-4 Maximum Softening vs. Maximum Final Drift 5-8
5-5 Maximum Softening vs. Maximum Ductility Ratio for Columns . 5-10
5-6 Maximum Softening vs. Maximum Ductility Ratio for Beams 5-12
5-7 Maximum Softening vs. Energy Average of Park's Index 5-14
5-8 Maximum Softening vs. Energy Average of Chung's Index. 5-16
5-9 Maximum Softening vs. Chung's Weighted Average 5-18
5-10 Maximum Softening vs. Final Softening 5-20
xiv

1.1 Statement of the Problem
SECTION 1
INTRODUCTION
In the current practice of earthquake engineering, reinforced concrete structures are de
signed in such a way that only minor to moderate earthquakes can be withstood within
the elastic range. The safeguard against large earthquakes relies on the inelastic response
of the structural elements, which provides a mechanism for the dissipation of the earth
quake energy. When the inelastic response takes place, the seismic forces are consid
erably reduced compared to the internal forces that an elastic structure would sustain.
This is considered in the structural design practice by the use of a Response Modification
Factor. Thus, it is important to know which is the degree of damage for structures that
undergo inelastic deformations and dissipate the earthquake energy.
In the classical structural design for static loads, the structural safety is attained by keep
ing the stresses well below the material yield limit. This simple definition of safety is too
conservative for the evaluation of the state of a structural system after earthquakes. Even
moderate earthquakes may produce yielding in some of the structural members without
producing a dangerous situation. Since the beginning stages of the earthquake engineer
ing practice, both the expected performance of structures subjected to earthquakes, and
the state of damage after actual seismic events have been characterized using indicators
other than the stress level. The width and distribution of cracks, the interstory or global
drift and the ductility ratio have been used as traditional or engineering measures of seis
mic damage. On the other hand, many local and global damage indices have been created
as an indication of the remaining capacity after earthquakes.
The objective of this report is to evaluate and compare the traditional measures of seis
mic damage and the available local and global damage indices, studying their relationship
1-1

and correlation. These measures of damage can be used in three main fields: after earth
quake evaluation of damaged structures, performance prediction in the design stage, and
reliability studies of existing facilities.
This evaluation has to be done by means of numerical simulations, due to the scarcity
of experimental data and because this is the only option available for the computation of
some of the damage indices that have been considered. The response of several building
frames subjected to a set of artificially generated and recorded earthquakes has been ob
tained by using the computer code SARCF-II. Then the damage indices were computed.
This report presents the results of these numerical simulations and analyzes the resulting
database in order to draw conclusions about the correlation between different damage
indices and their applicability. In particular, two different damage indices, Maximum
Softening and Final Softening as defined by DiPasquale and Cakmak [10] are discussed
in some details. These global softening indices are helpful for identifying structures that
need careful inspection after an earthquake and they are applicable to reinforced concrete
structures with/without shear walls.
1.2 Organization of the Work
The local and global damage indices that have been utilized are described in Section 2.
It is also explained how the damage indices are computed. A new way of computing the
global damage index defined by DiPasquale and Cakmak [10] from the instantaneous
natural period is presented.
The computer code SARCF-II, used to simulate the seismic response of the building
frames, is introduced in Section 3. The modifications to this program, carried out for
the purpose of making possible this research, are also described. The computer program
SARCF-II has been validated by comparing its results to the experimental results on
a reinforced concrete model tested at the University of Illinois at Urbana-Champaign
1-2

(UIUC) by Sozen and his associates [5]. SARCF-II has also been compared to another
similar program, IDARC, developed at State University of New York at Buffalo by Y. J.
Park et aI. [18].
Section 4 is devoted to the numerical simulations that have been carried out. A descrip
tion of the building frames and input ground motions is included.
Section 5 presents an analysis of the results obtained. First, the two available procedures
for the computation of the Maximum Softening are compared. Secondly, the Maximum
Softening as a global damage index, is compared to the traditional measures of damage
and to the weighted averages of the local damage indices.
The final conclusions are included in Section 6.
1-3


SECTION 2
LOCAL AND GLOBAL DAMAGE INDICES
Many damage models have been proposed to characterize the state of reinforced con
crete structures after earthquakes. A very extensive review of the different definitions
of damage indices was made by Chung et al. [6]. They divided the damage indices for
reinforced concrete into three different groups: empirical damage definitions, normal
ized dissipated energy indices, and damage indices developed for reinforced concrete
structures on the basis of theoretical principles.
Another review of the methods to quantify seismic damage can be found in Reference [9].
Most of the definitions for damage consider the damage of simple elements and are based
on the ductility ratio or on dissipated energy. Global damage indices that give information
about the state of complex structural systems are usually defined as a weighted average
of the local damage in the simple structural elements that form the system. A different
approach for the definition of global damage indices was proposed by DiPasquale and
Cakmak [9]. They base their global damage indices on the vibrational parameters of the
structure.
In this section, the local and global damage indices utilized in this report will be de
scribed.
2.1 Local Damage Indices
Two of the most recent definitions of local damage indices have been used, the one pro
posed by Chung, Meyer and Shinozuka [6], and the definition by Park and Ang [15] with
the modifications described below.
2-1

2.1.1 Chung, Meyer and Shinozuka's Local Damage Index
Chung, Meyer and Shinozuka's local damage index combines a modified version of
Miner's Hypothesis with damage acceleration factors that reflect the effect of the loading
history. In Reference [6] it is defined as
where
De = """' (at nt + a7" ni ) ~ i Nt 1N;
i : indicator of different displacement or curvature levels M·-Mr Ni = ~Mi 1 : number of cycles up to curvature level i to cause failure
6.Mi : strength drop in one load cycle up to curvature level i, figure 2 - l.
ni : number of cycles up to curvature level i actually applied
ai : damage modifier
+, - : indicator of loading sense
(2.1)
The effect of the loading history is captured by introducing the damage modifier, ai,
which for positive moment loading, is defined as
(2.2)
where
(2.3)
is the stiffness during the j-th cycle up to load level i and,
N+
r = _1 ~ k"':. . N7~ 1)
, j=l
(2.4)
is the average stiffness during Nt cycles up to load level i.
2-2

.J.+ - ""1
Moment, M
.-: ,
/ Curvature, f
FIGURE 2-1 Strength Drop Due to Cycling Loading [7J
2-3

2.1.2 Park and Ang's Local Damage Index
Park and Ang's local damage index includes two tenns that reflect the influence of the
maximum defonnation and the absorbed hysteresis energy [15]
where, 8m ; Maximum defonnation
8u : Ultimate defonnation under monotonic loading
Py : Yield strength
dE : Dissipated energy increment
(2.5)
The strength deterioration parameter f3 has to be found experimentally. According to Y.
J. Park et aI. [18] f3 was found using a regression equation obtained from experimental
results with 400 reinforced concrete columns and beams. The values of f3 for the usual
reinforced concrete sections are small. In the example of Appendix B of Reference [18]
the greatest value of 13 is 0.06. In Reference [17] Y. J. Park et aI. established that the
value of f3 is of the order of 0.05 for reinforced concrete members. Since the second term
of Equation (2.5) is a nonnalized tenn always smaller than one, it can be neglected for
practical purposes, given the small value of 13.
The displacement and the ultimate displacement of Equation (2.5) are clearly defined
only for the case of a cantilever beam fixed at one end. The computation of 8m and 8u
for the case of beams or columns, for which bending moments, shear and axial forces are
considered, is not well defined. When the structural damage is due to bending, it seems
more appropriate to substitute curvature for displacement in the first term of Equation
(2.5).
A modified Park and Ang's Damage Index based on curvature instead of displacement
neglecting the energy term is given by;
2-4

Mu
M Y
, ", /' /'
o y
o u
J F
FIGURE 2-2 Cantilever Beam and Moment Curvature Diagram
2-5

M
My
--~------~~------------------------~--- x
o
o y
x
FIGURE 2-3 Curvature and Bending Moment Diagram for a Cantilever Beam
2-6

(2.6)
where, ¢m : Maximum curvature
¢u : Ultimate or failure curvature under monotonic loading
This modified Park and Ang's damage index, has been compared to the the first term of
the original definition (Equation 2.5) for the cantilever beam in figure 2-2, assuming the
bilinear moment curvature relationship of the same figure. Since the bending moment
diagram is a straight line, the curvature is a bilinear function (See figure 2-3). The first
term of Equation (2.5) can be computed by integrating twice the curvature diagram for
a given load. The modified index given by Equation (2.6) can be directly obtained as a
function of the applied load.
The relationship between the modified and the original definition of Park and Ang's dam
age index, depends on two parameters, i.e. p, the ratio between the post-yielding stiffness
and the elastic stiffness (See figure 2-2), and the ratio between the failure curvature and
the yielding curvature.
Figure 2-4 shows the value of the modified Park and Ang's damage index as a function
of the first term of the original definition (Equation 2.5) for the case of a failure curvature
50 times greater than the yielding curvature and for various values of the p parameter.
The reinforced concrete sections found in building frames usually have an approximate
ratio between failure curvature and yielding curvature of 50 with the value of p being
approximately 0.15. The value for p depends mainly on the kind of reinforcing steel
used.
One can see by looking at figure 2-4 that the difference between these two definitions is
small for important damage and for high values of the p parameter. For the worst cases,
2-7

00 o
o 0.1 0.2 0.3 0.4 0.5 0.6 0.7 Park & Ang's Damage Index (bm / bu)
p = 0.01 p = 0.02 p = 0.05 p = 0.10 p = 0.20 P = 0.50
0.8 0.9
FIGURE 2-4 Original vs. Modified Park & Ang's Damage Index
2-8
1

the difference between the two indices is of 0.1. In any case, the modified Park and Ang's
damage index should be seen as an alternative definition that will not always yield the
same results as the original.
2.2 Global Damage Indices
Two kinds of global damage indices have been considered: weighted averages of the local
damage indices described in the previous section, and the global damage indices based
on the vibrational parameters of the structure as defined by DiPasquale and Cakmak [10].
2.2.1 Weighted Average of the Local Damage Indices
Seismic damage in reinforced concrete structures is usually concentrated in small areas.
Even in the case of important damage, only a few joints are affected. Hence, if a global
damage index is to be obtained as an average of the local damage, it is necessary to
first define the locations at which the local damage will be evaluated and then, to use an
appropriate weighting function so that more weight is given to the more damaged areas.
In this report, the definitions of global damage as a weighted average of the local dam
age have been taken from the authors that defined the local damage indices. For both
Chung, Meyer and Shinozuka's and Park and Ang's damage indices, the global damage
is obtained as a weighted average of the local damage at the ends of each element, with
the energy dissipated as the weighting function [7 and 18].
The definition of the energy average of the local damage is given by
(2.7)
where, D 9 : Global damage index
2-9

Di : Local Damage at the location i
Ei : Energy dissipated at location i
n : Number of locations at which the local damage is computed
This definition is used as a global damage index by Park et aJ [18].
Chung et a1. used the same definition as a story damage index given by
where, D Sk : Story damage index for story k
D7 : Local damage at the location i on story k
E; : Energy dissipated at location i on story k
(2.8)
n : Number of locations at which the local damage is computed for story k
The global or structural damage index for building frames is obtained as a weighted
average of the story damage indices using a triangular shape, with the maximum at the
base, as the weighting function [7]
(2.9)
where, N+l-k "
h = N : Welgthmg factor for story k
N : N urn ber of stories
According to this definition, the structural damage index has a maximum value of two
when all the Story Damage Indices have a value of one, whereas Park's definition of
global damage has a value between zero and one.
2-10

The plain energy average has also been utilized in this study for Chung, Meyer and Shi
nozuka's Local Damage Index as a means of comparison with the definition of Park and
Ang's Global Damage Index.
It is important to note that a weighted average of the local damage could be computed
in many different ways. Weighting functions other than the energy dissipated could be
defined. The most crucial elements should have greater weight since their failure implies
a global failure. Therefore, the appropriate definition of the weighting function depends
on the structural configuration.
Importance factors that adapt the weighting function to the particular structural config-
uration have also been proposed. These importance factors would give more weight to
some of the elements known to be important for the structure's performance. The disad-
vantage of this approach is that a subjective judgement is introduced, making it difficult
to compare the damage substained by different structural configurations if different im
portance factors are used. This disadvantage is overcome by the global damage indices
in the next subsection described.
2.2.2 Global Damage Indices Based on the Vibrational Parameters
The damage indices based on the vibrational parameters avoid the averaging procedure
of the local damage indices. DiPasquale and Cakmak [10] developed a damage model
based on the evolution of the natural period of a time-varying linear system equivalent
to the actual nonlinear system for a series of non-overlapping time windows. They used
a maximum likelihood criteria for the identification of the time-varying equivalent linear
system from the acceleration records at the top and at the base of the structure.
Their global damage index, named Maximum Softening, is given by
To 8M = 1---
Tmax
2-11
(2.10)

where, OM : Maximum Softening
To : Initial natural period
Tmax : Maximum natural period of an equivalent linear system
It has been shown that the Maximum Softening depends on a combined effect of stiffness
degradation and plastic defonnations [11]. In order to compute the Maximum Softening
the response of the structure under study must be known. It is necessary to have the
input ground acceleration and the acceleration at another location such as at the top of
the structure.
The Final Softening is given by
where, OF : Final Softening
To : Initial natural period
Tfinal : Final natural period
(2.11)
The Final Softening has been shown to be approximately equal to a weighted average
of the local damage when the mode shape does not change significantly after damage
[11]. It is related to the global stiffness degradation. The Final Softening will also be
considered because if the initial natural period is known, it can be computed from the
results of post-earthquake vibration testing. Thus, it is not necessary to know what the
actual structural response was like.
DiPasquale and Cakmak [9, 10 and 11], proposed computing these damage indices from
the acceleration records at the base and at the top of a structure, dividing the records
in a series of time windows and computing the natural period of the equivalent linear
system for each of those windows. The equivalent linear system was to be found by
2-12

using Maximum Likelihood estimators by means of a System Identification Computer
Program named MUMOID [9].
In this study, numerical simulations of the seismic response of buildings have been cre-
ated. Therefore, besides the acceleration records at the base and at the top of the building,
information about the instantaneous natural period is available.
A new procedure for the computation of the damage indices based on vibrational pa
rameters from the instantaneous natural period has been developed. This procedure is
described in the next subsection.
2.2.3 Computation of the Maximum Softening by Averaging the Instantaneous Natural Period
If the Global Damage Index defined by DiPasquale and Cakmak [10], is to be applied
to the instantaneous natural period computed by a nonlinear dynamic analysis program,
the instantaneous natural period has to be smoothed out in some way. The instanta
neous natural period is computed from the first eigenvalue of the instantaneous tangent
stiffness matrix. The natural period computed for each time step of a dynamic analysis
presents a high variability. The maximum values are usually reached when some struc-
tural members yield; and the slope of the hysteresis loop is small before the next load
reversal occurs. The duration of these maximum values is very short, and therefore, their
influence in the natural period of an equivalent linear system is not significant. A more
meaningful indication of the change in the natural period can be obtained by observing
a moving average of the instantaneous natural period.
In figure 2-5 one can see a typical plot of the instantaneous natural period and several local
averages with different averaging windows. The maximum and final natural periods,
used for the computation of the damage indices, depend on the length of the averaging
window. In this section, a criterion for the definition of the appropriate length of the
averaging time window for the instantaneous natural period will be established.
2-13

If the instantaneous natural period (T), is known at intervals ~t, T is a discrete function
of the time step i.
T = T(i) i = 1, ...... ,n (2.12)
where, n = Number of time intervals ~t (Assumed to be an even number)
The averaged instantaneous natural period over j time steps (Tav j) is also a discrete
function of the time step i, and is defined as,
where,
i+1.-1
Tav j(i) = 7 [~T(i - %) + ~T(i +~) + t T(k)] k=i-~+1
J == 2,4,8, ..... , n
J <i<n-~ 2 - - 2
(2.13)
The variance function, I, is defined as the ratio of the variance of a local average and the
variance of the original process [26].
The variance of a local average process can be expressed as
2 zlnC,t d,(t)
(J'T. . == (J'T - --dt av J . dt
Jc,t
(2.14)
(2.15)
This equation shows that the variance of a local average process is directly proportional
to the area under the absolute value of the derivative of the variance function between
the value of the length of the averaging window, and the total length of the record. The
variance reduction due to the averaging procedure is the value of the variance function
2-14

Original time history -------. 1 sec window ---- 2 sec window - - -. 3 sec window -----. 6 sec window ------ 9 sec window
-
.. . ,
~ , . , , I; , ,
fY. . t-, 'j'1
.' f V lJ
~' - ~~ , U . , ,
I \t , ,
,
p '(' ;.
I" ~ II; . ,
1-_ . , , -
"
---- ;.; ~ f ' ' ---: lQ I,;
,-1"
I I
o 5 10 15 20 25
Time (sec)
FIGURE 2-5 Averaged Instantaneous Natural Period for Different Averaging Windows
2-15

for the time window used. This variance reduction is also proportional to the area under
the absolute value of the derivative of the variance function between a time window of
zero (no averaging) and the time window used to get the local average.
Looking at figure 2-5 it is clear that the instantaneous natural period can be split into
components with different scales of fluctuation [26]. The components with smaller scale
of fluctuation will be the random deviation from a deterministic trend that has a larger
scale of fluctuation. This deterministic trend is an indication of the global stiffness of the
structure, therefore, it is the component that should be used for the computation of the
global damage indices.
When a structure is subjected to an earthquake with a wide band frequency content,
the oscillations of the structure will have a narrow frequency content around its natu
ral frequency. For each cycle some structural members can go through a hysteresis loop,
changing their stiffness according to the slope of the moment-curvature trajectory. The
fluctuations of the instantaneous natural period around the main trend will have a fre
quency related to the natural frequency of the structure. The scale of fluctuation will also
be related to the natural period of the structure. In the case of nonlinear behavior, the
frequency content of the response will change according to the damage substained, but
the deviation of the instantaneous natural period from the deterministic trend will still
have a scale of fluctuation related to· the time-varying natural period of the structure.
If the scales of fluctuation of the different components are different enough, it is possible
to separate the component with the largest scale of fluctuation by averaging the instan
taneous natural period using a time window greater than the scale of fluctuation of the
random deviations and smaller than the scale of fluctuation of the deterministic trend. In
order to find the value of the averaging window that separates the main trend from the
local deviation, a set of plots like the one of figure 2-6 can be obtained for each case.
2-16

2B3S Building M = 8.8 x 1.5
.,., ~o
c~ ,...
0
0 10 15 20 25 30 35 40
T av / TO (Averaging window / Initial Narum! Period) .., 0
N 0
'> c" ..., ,?:o . .... " '0 ...... ";' 0
0 10 15 20 25 30 35 40
T av / To (Averaging window /Initial Natural Period)
~ ~t"')
"'8 .r: <.l
'" e 3 N
'" z E ::> E .~ -::;
0 10 15 20 25 30 35 40
T.v / To (Averaging window / Initial Natural Period)
~..,
u
~ "'8 ~N
e ::> ~ -Z '" ::>
8 § 0
c: 0 10 15 .:s 20 25 "- Time (sec) .5
FIGURE 2.6 Variance Function and Maximum Natural Period as a Function of the Length of the Averaging Window
2-17

The first plot of figure 2-6 shows the variance function (Equation 2.14) as a function
of the normalized length of the averaging window. The variance function has a value
of one when the length of the averaging window is zero and then decreases to a value
of zero when the length of the averaging window is equal to the record's length. The
variance function has three parts with very different slopes that suggest that the instanta
neous natural period has three components with different scales of fluctuation. The first
component, with a very small scale of fluctuation, causes the variance function to decay
very rapidly for very small values of the averaging window. This component is due to
the variations in the instantaneous natural period from one time step to the following.
The second component has a cyclic appearance, with a natural frequency similar to the
natural frequency of the structure. This component is due to the oscillations of the struc
tural stiffness about its main trend. Finally, the third component is considered to be the
deterministic trend that indicates how the natural period evolves.
In figure 2-6, there is also a plot with the maximum natural period as a function of the
averaging window. One can observe that the maximum period decreases rapidly until
the averaging window is between 2 and 2.5 times the initial natural period and then is
stabilized and decreases slowly tending to the average value when the averaging window
is equal to the length of the record. In figure 2-7 the maximum natural period as a function
of the length of the averaging window is shown for some of the numerical simulations
that will be described later.
Using averaging windows between 2 and 2.5 times the initial natural period the results
obtained for the maximum natural period are similar, but it is desirable to use a value
close to the upper limit in order to allow for an increase in the natural period produced
by softening. In this study an averaging window 2.4 times the initial natural period has
been used.
Figure 2-8 shows an example of the instantaneous natural period as a function of time,
plus the local average computed with a time window 2.4 times the initial natural period.
2-18

o~ ________________________________________________ ~
oc-
I r--
-- ........... _-- --.. - -- - - -- -- -- -----------------------------------------
O~--------_r--------~---------.----------~--------O
I I I I
246 8 10
Tav / TO (Averaging window / Initial Natural Period)
FIGURE 2-7 Maximum Natural Period as a Function of the Length of Averaging Window
2-19

00
Instantaneous Natural Period - - - - - - - - Local Average of the Instantaneos Natural Period
-c.
-O~ ____________ ~ __________ ~ ____________ -r ____________ ~ __________ -.
o 5 10 15 20 25
Time (sec)
FIGURE 2-8 Instantaneous Natural Period and Local Average
2-20

In figure 2-9 the local average is compared to the natural period of the time-varying linear
equivalent system obtained by using the program MUMOID [9]. It can be seen how the
two curves are close enough with a small difference between maximum values.
2-21

Local Average of the Instantaneos Natural Period - - - - - - - . Natural Period of the Equivalent Linear System (MUMOID)
O~------------.------------.-------------r------------.-----------~ o 5 10 15 20
Time (sec)
FIGURE 2-9 Local Average of the Instantaneous Natural Period and Natural Period of an Equivalent Linear System
2-22
25

SECTION 3
COMPUTER PROGRAM SARCF -III
3.1 General Description
SARCF-III is a computer program for the seismic analysis of reinforced concrete frames
which can simulate the strength and stiffness degradation observed in experimental tests
under strong load reversals. A general description of the initial version of this program
can be found in References [7] and [8]. The most important characteristics will be sum-
marized now.
The structure is idealized as an assembly of one dimensional beam or column elements
which interconnect the nodes or joints. Loads are applied to the nodes.
The stiffness and strength degradation parameters are determined internally from the
basic material and section properties. In figure 3-1 one can see the shape of the hysteresis
loops that define the moment curvature relationship.
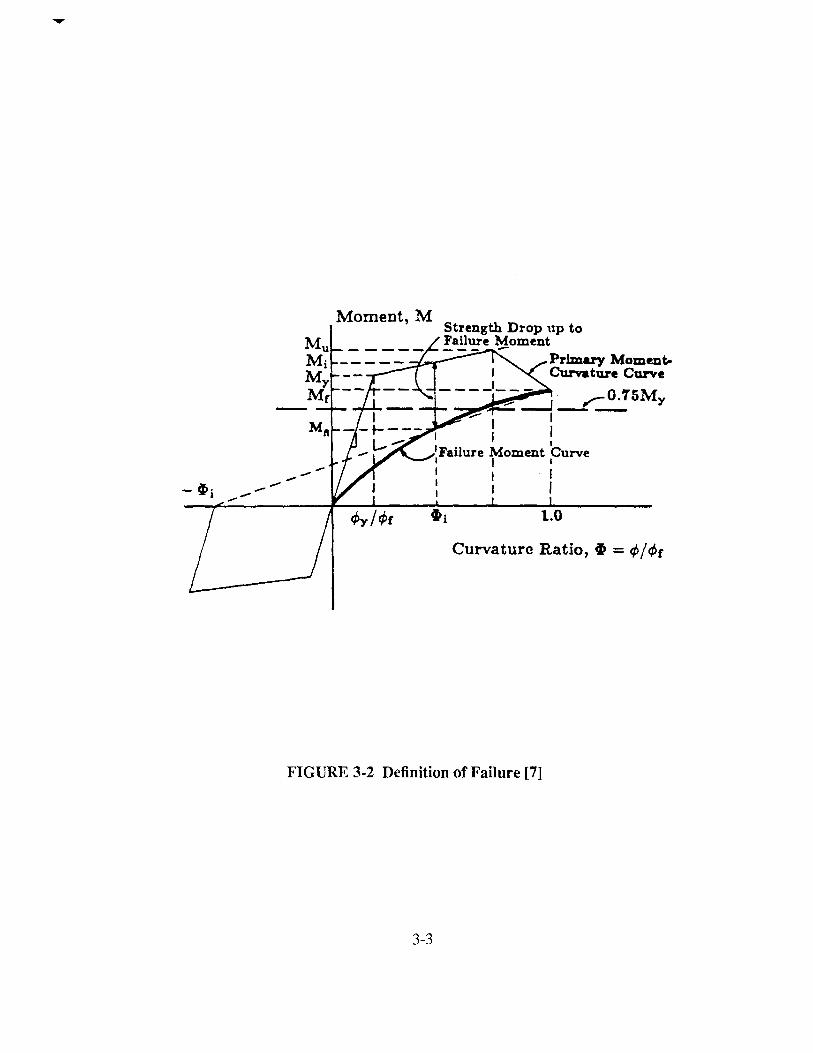
The failure moment level is related to the member's actual strength reserve or residual
strength, which is a function of the load history and maximum experienced curvature
level, cpo The failure moment is proposed as a function of the normalized curvature level
(See figure 3-2), given by
where
Mji : Failure moment for given curvature level cpj
M j : Failure moment for monotonic loading
if,. <Pi C . 'l'i = <P j: urvature ratIO
cp j : Failure curvature for monotonic loading
3-1
(3.1)

Moment, M
Mj .----
-~
,-'-_--7..'"
I I I I I I I
(EI)3 , I I <,,1'
--:;:-:-j. (El), ,. " ,.
(El) 1 = (El)e
FIGURE 3-1 Hysteretic Moment-Curvature Relationship [8]
3-2
--..... -..... .....
Moment, M Strength Drop up to Failure Moment - Prima:ry Momen~
I Curvature Curve
----'-;-~ ,..-O.'T5My ,--I I I
I
'Failure Moment Curve , I I
I I I I I I ,
1.0
Curvature Ratio, ~ = ¢/¢r
FIGURE 3-2 Definition of Failure [7]
3-3

This failure moment is used for the definition of the local damage index of Equation (2.1)
proposed by Chung et al. [6].
The strength deterioration is initiated as soon as the yield load level is exceeded, and the
strength deterioration accelerates as the critical load level is reached. As shown in figure
3-3, the amount of strength deterioration given a load level, 6"M, is represented by
(3.2)
where
6"Mf : Moment capacity (strength) reduction in a single load cycle
at failure curvature
<PY' cPf : Yield and failure curvature, respectively
w : Strength degradation parameter with a value between 1.5 and 2.5
The pinched shape of the hysteresis loops is simulated as a function of the shear span.
The point (M:, cP~), (figure 3-1) will be introduced with the following coordinates
), +n = ), - (ill) 'f' 'f'r (El) _ (El)e
where
(El) =
The coordinates of the crack-closing point can be expressed as [6]
where
{
0 if
Cip = JO.4J - 0.6 if 1 if
3-4
J :::; 1.5 1.5 < J ~ 4.0 J > 4.0
(3.3)
(3.4)
(3.5)

Moment, M
- - - - - - - - --=r;r=:::=---=~
p(EI)e:-__ ~~",--
Curvature, if;
FIGURE 3-3 Strength Deterioration Curve [7]
3-5

; : Shear span ratio
a : Shear span, assumed to be equal to ~
I : Clear span length
d : Cross-sectional depth
The "pinching factor", O:P' is such that O:p is equal to one if the shear effect is negligi
ble, and O:p is equal to zero if the shear effect completely controls the load-deformation
behavior.
The reinforced concrete element model takes into account the finite size of the plastic
regions. The structure is idealized as a plane frame ignoring out-of-plane motion. All
the mass of the structure is assumed to be lumped at the nodes.
The P - .6. effect is taken into account by adding the geometric stiffness to the columns
stiffness, using the axial forces produced by the static loads.
The shear deformation of the elements is not taken into consideration. The frame is
assumed to be fixed at a infinitely rigid foundation.
In the following section the modifications that have been carried out on the original pro
gram will be described.
3.2 Improvements of the Program
The program SARCF-III includes the following modifications from the original version:
1. Computation of the initial internal forces by means of a static analysis
The internal forces, shear, bending moments, and axial forces due to the dead loads,
can be computed using a linear static analysis prior to the nonlinear dynamic analysis.
2. Correction of the length of the plastic hinges
3-6

Plastic hinges are considered to extend on the part of the elements which has expe
rienced a bending moment larger than the yield moment, according to the original
definition found in Reference [8].
3. Computation of the inters tory drift and ductility ratio
4. Computation of the modified Park and Ang's Damage Index (Equation 2.6)
5. Preparation of data for the computation of the Maximum Softening
Files with the acceleration at the base and the acceleration at the top are created to
be used with the System Identification Program, MUMOID. Another file with the
history of the instantaneous natural period is created to be used for the computation
of the moving average of the instantaneous natural period.
6. Analysis of damaged structures
The state of damage and the internal forces in all the elements are saved at the end
of each dynamic analysis so that it is possible to study the response of a damaged
structure to a second earthquake.
7. Failure of elements
When the curvature exceeds the failure curvature, the bending stiffness is made equal
to a very small number. The failure curve described above was used in the original
program only for the definition of the strength drop for each cycle and for the com
putation of the local damage index. In this new version, a limit to the maximum
curvature is introduced to avoid results with a very large curvature without physical
meaning.
8. Generation of artificial earthquakes using ARMA model
The procedure proposed by Ellis and Cakmak [12 and 13] is followed. Single and
double peak earthquakes, statistically equivalent to the ones that take place in Japan,
can be generated given the duration, magnitude, and distance from the source or
sources, and the soil parameters.
3-7

3.3 Remaining Limitations
The computer program used for the numerical simulations, even after the improvements
that were carried out, presents limitations that should not be forgotten in the analysis of
the results.
1. Nonstructural elements, such as cladding, partitions, etc, are not included in the struc
tural model.
2. Shear deformations are neglected. It is assumed that the amount of shear reinforce
ment is enough to prevent shear failure. The failure due to shear is not considered.
3. The bending capacity of the elements is computed taking into consideration the ini
tial axial forces, but that capacity does not change with the axial forces during the
dynamic analysis.
4. The axial stiffness of the columns is computed assuming that they are under com
pression. The reduction in the axial stiffness due to the cracking produced by tensile
forces is not taken into consideration.
3.4 Comparison between Computed and Experimental Results
In order to assess the ability of the program SARCF-III to predict the seismic response of
reinforced concrete structures, computed results using the computer program have been
compared to the results of experimental tests on a reinforced concrete model carried out
at the University of Illinois at Urbana-Champaign (UIUC) by Sozen and his associates
[5].
The results computed using the program IDARC, Inelastic Analysis of Reinforced Con
crete Structures, developed at State University of New York at Buffalo by Y. J. Park et
a1. [18], have also been included in the comparison. The program IDARC has the same
3-8

purpose as the program SARCF-III, but contains a more general hysteresis rule which
includes the cracking of the concrete before yielding.
As one can see in figure 3-4, the test structure consisted of two ten story, three bay frames
working in parallel with ten story weights attached in between. The test structure had a
uniform distribution of the story heights. Nonstructural elements were not modeled. The
out-of-plane motion was impeded. The simulated earthquake runs had base motions that
were patterned after the North-South component of the acceleration history measured at
El Centro during the Imperial Valley Earthquake of 1940. The original earthquake time
scale was compressed by a factor of 2.5.
The same test structure, named HI [5], was subjected to three runs of scaled El Centro
Earthquake with increasing peak acceleration. Hence, the second and third runs affected
a damaged structure.
For this model, all the dimensions and material properties were known with a higher
degree of accuracy than is usual in reinforced concrete construction. An idealized com
puter model was constructed using the average actual properties of the microconcrete
and reinforcing wires. A damping of 3.5% of the critical was used.
The digitalized time history of the measured acceleration at the base of the test structures
was utilized as the base input acceleration. Since the test structures were subjected to
three different artificial earthquakes, the computer response was calculated using a time
history of the base acceleration obtained by appending the second and third runs to the
first one. In this way, at the beginning of the second and third runs, the model of the
structure had degraded its properties like the actual structure.
Since the general shapes for the response of the test structures were dominated by the first
mode, the time history of the displacement of the top floor was used for the comparison
between the experimental and the computed results.
3-9

FIGURE 3-4 Test Structure Used for the Comparison [5]
3-10

Both computer models for the computer programs SARCF-III and IDARC were devel
oped without using the information that could have been drawn from the experimental
results. In both computer programs there are parameters whose value could have ad
justed the computed results to the experimental results. Nevertheless, the average values
recommended by the authors of the programs have been used. For instance, the strength
degradation parameter, w, used in Equation (3.2), that defines the strength degradation
curve in the program SARCF-I1I, was given the value of 1.5.
In the input for the program IDARC, the parameters 0, which defines the stiffness degra
dation, and the slippage or pinching coefficient, " [18], were given a value of 2 and 10
respectively. The rate of strength degradation, f3 and the post-yielding stiffness ratio,
were computed internally by the computer program using correlation formulae [18].
The time step used for the numerical integration of the equations of motion was of 0.002
seconds in both cases. This small time step is required by the fact that both computer
programs carry out only one iteration for each time step. In the program SARCF-III
the unbalanced internal forces are applied to the following time step, thus correcting
the tendency to drifting by modifying slightly the input ground motion. In the program
IDARC the lack of correction for unbalanced internal forces makes an even smaller time
step necessary in order to get the right solution.
An analysis of the results of the comparison between experimental and computed results
for the three consecutive runs follows.
3.4.1 First Run (Run HI-I)
The maximum base acceleration was 0.36 g. The columns of test structure remained
elastic, but several beams started to develop plasticity. At the beginning of the record
shown in figure 3-5, the computed time history of the displacement of the tenth level using
3-11

o 2
E 8 flo E 0> ~ ~ is'!"
Of
0
...
E 8 50 5 a! ~ is'!"
Of
0 2
ILLINOIS TEST RUN Hl-l (pGA = 0.36 g) Tenth Level Displacement
Recorded Response
456 8 9 10 11 12 13 14 15 16 17 18
Time (sec)
Computed Response (IDARC ~t=O.OO2 sec.)
4 6 7 8 9 10 11 12 13 14 15 16 17 18 Time (sec)
Computed Response (SARCF-III ~t=O.OO2 sec.)
4 6 8 9 10 11 12 13 14 15 16 17 18
Time (sec)
FIGURE 3-5 Comparison between Experimental and Computed Results (First Run)
3-12

both computer codes is very close to the recorded time history. After the first 1.5 seconds
of strong motion, the test structure experienced a slight increase in the natural period that
the computer programs do not fully predict. Both computer programs underestimate the
displacements. The computed maximum relative displacement is approximately 30%
less than the recorded maximum for both programs.
In the case of the program SARCF-III, this lack of agreement seems to be due to the
nonlinear behavior of the reinforced concrete sections, even for bending moments below
the defined yield moment. The experimental results shown in Reference [14] suggest that
the stiffness of reinforced concrete sections after cracking decreases with cycling loading
even when the load level is below the yield moment. In the computed results, the initial
stiffness of the columns holds, whereas the experimental results suggest a reduction of
the stiffness of the columns.
In the case of the program IDARC, the stiffness degradation after cracking is controlled
by the stiffness degradation parameter CY. An cy parameter of 2, found to be appropriate
for the post-yielding behavior of reinforced concrete, does not seem to produce a suffi
cient stiffness degradation for loads between the cracking and the yielding points. Test
conducted with CY equal to 0.1 yielded results close to the experimental ones. However,
using that value of CY would have been against the principle of not using information
drawn from the experimental results when building the computer models.
3.4.2 Second Run (Run Hl-2)
The maximum base acceleration was 0.84 g. The columns of the test structure started to
develop plasticity. Most of the beams had plastic hinges.
At the beginning of the record shown in figure 3-6, the computed time history of the
displacement of the tenth level using SARCF-III is very close to the recorded time his
tory. After the first second of strong motion, the test structure experienced an increase in
3-13

E ~ CO .., 5 !I!l ~ is''!"
"!'
3.4 4.4 5.4
...
E ~ CO .., 5 al ~ is''!"
"!'
14 15 16
14 15 16
ILLINOIS TEST RUN Hl-2 (PGA = 0.84 g) Tenth Level Displacement
Recorded Response
6.4 7.4 8.4 9.4 10 II 12 13
Time (sec)
Computed Response (IDARC .1t=O.OO2 sec.)
17 18 19 20 21 22 23 24
Time (sec)
Co uted Response (SARCF-Ill ~t=O.OO2 sec.)
17 18 19 20 21 22 23 24
Time (sec)
14 15 16 17 18
25 26 27 28 29
25 26 27 28 29
FIGURE 3-6 Comparison between Experimental and Computed Results (Second Run)
3-14

the natural period greater than that predicted by the computer program. The computed
maximum relative displacement is 16% greater than the recorded maximum and it does
not take place exactly at the same time. In the last five seconds of strong motion, the
response computed with SARCF-III, and the recorded response are very close, both in
frequency content and amplitude.
The response computed using IDARC presents a numerical drift because of the lack of
correction of the unbalanced internal forces. The evolution of the zero crossings rate
differs more than in the response computed with SARCF-III.
3.4.3 Third Run (Run Hl-3)
The maximum base acceleration was 1.60 g. The columns and the beams of test structure
developed plasticity in most of the joints. Figure 3-7 shows the recorded and computed
responses.
The tenth level displacement time history computed by using IDARC is very close to the
recorded time history for the first two seconds of ground motion. After that, the com
puted results present a drift, and the natural period does not increase as in the recorded re
sponse. The computed maximum relative displacement is 18% smaller than the recorded
maXImum.
The the tenth level displacement computed using SARCF-III presents a maximum af
ter about two seconds of ground motion, which is approximately 40% greater than the
recorded maximum. However, the second half of the record is very close, both in fre
quency content and amplitude. SARCF-III predicts the increase in the natural period of
the test structure.
3-15

ILLINOIS TEST RUN Hl-3 (PGA = 1.6 g) 0 Tenth Level Displacement N
Recorded Response
~
E ~
50 5 ~ ]-0 o '"7
0 ":'
2.3 3.3 4.3 5.3 6.3 7.3 8.3 9.3 10 II 12 13 14 15 16
Time (sec)
0 N
Computed Response (!DARC At=O.OO2 sec)
~
E ~
50 5 ~ ]-0 0'"7
0 ":'
29 30 31 32 33 34 35 36 37 38 39 40 41
Time (sec)
0 N
Computed Response (SARCF-m At=O.OO2 sec)
~
5' ~
50 E ., u
io 0'"7
0 ":'
29 30 31 32 33 34 35 36 37 38 39 40 41 42 43
Time (sec)
FIGURE 3·7 Comparison between Experimental and Computed Results (Third Run)
3-16
3.4.4 Conclusions
The conclusion that can be extracted from the comparison of the recorded response to
the computed response is that, given the uncertainties that exist in the description of the
nonlinear behavior of reinforced concrete structures, a good approximation was obtained
using the program SARCF-Ill. The response of structures clearly in the nonlinear range
(test runs Hl-2 and Hl-3) is predicted with a higher degree of accuracy than that of
structures that start to develop plasticity (test run HI-I).
The probability of damage, based on the global damage indices as defined by DiPasquale
and Cakmak [10] was obtained for the experimental results and for the numerical simula
tions. For the experimental results the probabilities of damage were 0.5,0.9998 and 1.0
for the test runs HI-I, HI-2 and HI-3, respectively. Whereas for the numerical simula
tions 0.02, 0.9999 and 1.0 were the probabilities obtained for the same runs HI-I, HI-2
and HI-3. One can see that the numerical simulation gives a good approximation for the
damaged structures i.e. HI-2 and HI-3. For the test run HI-I, which is on the onset of
the damage, the probability of damage obtained from the computed results differs more
from the probability of damage obtained from the experimental results.
The program IDARC, although including a more complete hysteresis model, did not
yield an approximation as good as SARCF-III. Its main problem was the drifting of the
response, which could be reduced by using a smaller time step at the expense of longer
computations. Since its hysteresis model includes more parameters, it is possible to do
parametric studies in order to find the appropriate parameters to match the experimental
results. In this case, the standard parameters were used, which did not produce the best
possible results with IDARC.
3-17


SECTION 4
NUMERICAL SIMULATIONS FOR BUILDING STRUCTURES
4.1 Description of the Buildings to Be Analyzed
The numerical simulations have been carried out on three low rise buildings designed
according to the existing codes.
4.1.1 Two Bay Three Story Buiding Frame
The building frame described in Reference [21] has been used. A brief description of
its main characteristics taken from the already mentioned reference follows. The typical
office building of figure 4-1 has been designed according to the ACI 318-83 code [1],
to resist the equivalent static lateral loads specified in the Uniform Building Code [25].
The design base shear can be obtained by using
V=ZIC xW Rw
Z = 0.4 for seismic zone 4
I = 1.0 for occupancy importance factor
Rw = 12 for special moment-resisting space frame
C = 1.25S jT2/3 for site coefficient and structural period
S = 1.50 for soft to medium stiff clay
W is the dead weight
(4.1)
Details of this building frame, such as cross sections of the members and material prop
erties, can be found in figure 4-1. The Rayleigh damping parameters have been chosen
so that the damping is 8% of the criticaL The dead load has been applied as static loads
and fixed end bending moments on the nodes.
4-1

Bl
B2
B3
~I + ~I I
~r I
..!.....
U
N U
..., U
lj'///////////
BI BI
!
U U
B2 B2
N N U U
B3 B3
..., ..., U U
WhW///m ,v//////,Y'///. 20' .' ... 20'
ELEVATION Frame spacing 20'
fey = 60ksi f'c = 4ksi
As'
d'~ T L-,. __ ----I. I
b i
As h
BEAM COLUMN
d' As As' b h d' As As' ,
( in 1) ( in ) ( in ) ( in ) ( in-) ( in ) ( in 2) ( in:)
2.0 1.760 2.540 12.0 20.0 Cl 1.5 2.54 2.54
2.0 1.760 2.540 12.0 20.0 C2 1.5 2.54 2.54
2.0 1.760 2.540 12.0 20.0 C3 1.5 2.54 2.54
FIGURE 4-1 Details of the Two Bay Three Story Building Frame ( 1 in = 2.54 em ; 1 kip = 4.448 kN ) [21]
4-2
b
( in)
12.0
12.0
12.0
h
( in )
15.0
15.0
15.0

4.1.2 Three Bay Four Story Buiding Frame
The building frame described in Reference [7] has been used. This typical office build
ing was also designed according to the ACI 318-83 code [1], to resist the equivalent
static lateral loads specified in the Uniform Building Code [25] for seismic zone 4. The
occupancy importance factor was one. Figure 4-2 shows its dimensions, amount of rein
forcement, and material properties. The Rayleigh damping parameters have been chosen
so that the damping is 8% of the criticaL The dead load has been applied as static loads
and fixed end bending moments on the nodes.
4.1.3 Three Bay Four Story Buiding Frame (Weak Columns)
The three bay four story buiding frame described in the previous section, presents strong
columns and weak beams. In order to extend the scope of this study to the case of frames
with weaker columns, the same frame with the reinforcement of the columns reduced by
50% has also been considered. All the other dimensions and cross sections can be seen
in figure 4-2.
4.2 Input Ground Acceleration
Two types of input acceleration have been used: scaled versions of the N -S component
of the acceleration history recorded at EI Centro during the Imperial Valley Earthquake
(1940), and artificially generated earthquakes using an ARMA model according to the
method proposed by Ellis and Cakmak [12 and 13]. The parametric relationships between
modeling parameters and physical variables were obtained from a set of strong motion
accelerograms recorded from the following Japanese earthquakes: Tokachi-Ochi (1968),
Miyagiken-Oki (1978), Nihonkai-Chubu (1983) and Michoacan (1985) [12]. Single
event earthquakes have been generated using this capability of the program SARCF
III. The input parameters and their values used in this case are: an initial peak time of
4-3

Bl B2 Bl
C'1 C'1 0-( 0-(
C) C) C) C)
Ba B4 Ba
CO) ~ ~ CO)
C) C) U C)
B5 B6 B5
~ co co ~
C) C) C) C)
B'T BS B'T
t- ao ao lo-
C) C) U U
I-
rr 7.~1r "~Ir j~fr-"Wi I I , 20 20 -I 20
ELEVATION
BEAM COLUMN
.L 6" I - 5
A' A' • T
d'.L lJ d'J..
A.
T--i12"t- T r b
d' A. A' h • d' A. A' • (in) (in2 ) (in 2 ) (in) (in) (in 2 ) (in 2 )
Bl,B2 2.0 1.596 1.596 IS.0 Cl 1.500 2.160 2.160
B3,B4 2.0 2.400 2.400 20.0 C2,C3 1.875 2.993 2.993
B5,B6 2.0 2.622 2.622 22.0 C4,C5,C7 1.875 3.135 3.135
B7,BS 2.0 2.736 2.736 22.0 C6,CS 1.875 3.260 3.260
FIGURE 4-2 Details of the Three Bay Four Story Building Frame ( 1 in = 2.54 em ; 1 kip = 4.448 kN ) [7]
4-4
h
-t
b h
(in) (in)
12.0 15.0
12.0 IS.0
12.0 IS.0
12.0 1~,(l

two seconds, a duration of the earthquake of 20 seconds, a distance from the epicenter of
10 or 100 kilometers, different values of the earthquake magnitude, and a soil condition
factor, If, with a value of 0.10.
A total of 29 different earthquakes have been applied to the three structural models, a
complete list of them with their peak ground accelerations follows. In order to study the
onset of seismic damage, several quakes with a similar peak ground acceleration have
been utilized.
1. 3 story building
a. ARMA method (D = 10 kilometers). PGA (g): 0.46,0.50,0.70,0.71,0.72,0.72
and 0.82
b. ARM A method (D = 100 km.). PGA (g): 0.45, 0.69 and 0.81
2. 4 story building
a. El Centro. PGA (g): 0.25,0.35,0.50,0.75 and 1.0
b. ARM A method (D = 10 km). PGA (g): 0.26,0.40,0.51,0.70
c. ARMA method (D = 100 km). PGA (g): 0.23, 0.35, 0.62, 0.78
3. 4 story building (weak columns)
a. El Centro. PGA (g): 0.25,0.35, 0.50 and 0.60
b. ARMA method (D = 10 km). PGA (g): 0.40 and 0.45
Each building frame was subjected twice to these time histories. For the second occur
rence of the same earthquake the damaged properties were utilized. Even in the case
of artificially generated earthquakes, an identical repetition of the same earthquake was
used.
4-5

0 4 Story Building 0 3 Story Building
~-II! 4 Story Building (Weak Columns) 0
~-0
r--:_ 0 0
~-S
,-.., 0 0 ~ = 0 0 0 .-.... 0 ~ tr'l_
u 0 0 tC . - • .... = ~-0) "'0 0 0 - • ~ 0 S C'!_ 0 0) .... 0 ~ 0 0 ~
r:::n • '-" ::;C'!_ 0 c.o 0 0 • • •
..-;- 0 0 0
0 0 0
0 I I I I I I I I I I
0 0.1 0.2 0.3 0.4 0.5 0.6 0.7 0.8 0.9 1 1.1 PGA (g)
FIGURE 4-3 Maximum Softening vs. Peak Ground Acceleration
4-6

Figure 4-3 shows the peak ground accelerations of the earthquakes that have been applied
to each of the building structures that have been considered. The Maximum Softening
is also shown. It can be seen how, when artificial earthquakes are used, there is not a
clear correlation between the peak ground acceleration and the damage level, even for
the same building structure.
4.3 Parameters to Be Computed
For each of the nonlinear dynamic analysis that have been carried out, a vast amount of
information can be obtained using the program SARCF-III. From all that information,
parameters belonging to four groups have been selected: traditional measures of dam
age, local damage indices, global damage indices and parameters that characterize the
response of the damaged structure to a second earthquake.
4.3.1 Traditional Measures of Damage
Among the traditional measures of damage the maximum inters tory drift, the perma
nent inters tory drift and the maximum ductility ratio for beams and columns, have been
computed.
The interstory drift is defined as the the tangent of the angle between the original position
and the deformed position of the columns. The inters tory drift has been used as a measure
of damage by M. A. Sozen [22].
The permanent drift is the interstory drift after the earthquake. The permanent drift has
been used as an indication of damage by 1. E. Stephens and J. P. T. Yao [23 and 24].
The ductility ratio which has been computed is a curvature ductility ratio, defined as
the ratio between the curvature and the yield curvature. The relationship between the
displacement ductility ratio and the curvature ductility ratio depends on the nonlinear
4-7

0 .-~ CI:$
~ >. ~ .-...... . -~ u :::1 0 ~
= Q)
8 Q) u CI:$ ..... 0.. r:I) .-0
~ -r----------------------------------------------------------~
trl N
0 N
trl ......
0 ......
trl " ,,;
, , , ,
, , , , ,
, , , , ,
, , , , ,
, , , ,
p = 0.01 -------. P = 0.02
o ~----------_r----------_r----------_r----------_r----------~ o 10 20 30 40 50
Curvature Ductility Ratio
FIGURE 4-4 Curvature vs. Displacement Ductility Ratio
4-8

moment-curvature relationship and the member geometry. For the cantilever beam in
figure 2-2, with the bilinear moment-curvature relationship defined in the same figure,
the plot in figure 4-4 was obtained. This plot was obtained for a failure curvature 50
times greater than the yield curvature and for a value of the parameter p (figure 2-2) of
0.01 and 0.02.
One can see in figure 4-4 how the curvature ductility ratio is always greater than the
displacement ductility ratio. However, it is not possible to express one as a function of
the other since the functional relationship between them depends on the section and on
the material properties.
When the failure is controlled by bending moments, as it is for the moment resisting
frames that have been analyzed, the use of the curvature ductility ratio seems to be more
appropriate.
4.3.2 Local Damage Indices
Chung, Meyer and Shinozuka's damage index and the modified Park and Ang's damage
index have been computed at both ends of each beam or column. Both indices were
described in Section 2.1.
4.3.3 Global Damage Indices
The global damage indices described in Section 2.2 have been calculated.
1. Energy average of Chung, Meyer and Shinozuka's Local Damage Index, defined by
Equation (2.7).
2. Weighted average of Chung, Meyer and Shinozuka' s Local Damage Index, using the
triangular weighting function, defined by Equations (2.8) and (2.9).
4-9

3 BAYS 4 STORIES (we* columns) M = 8.5 D = 10 Ian
Relative displacement top level
0
'C ;::..
'5 5 !Ii 0
~v;>
is
~ 0 2 4 6 8 10 12 14 16 18
Time (sec)
~ Absolute acceleration top ie-:el
0
3 § .= ~
..!Iv>
8 9 u <
..,. 0 2 4 6 8 10 12 14 16 18
Time (sec)
v> 0 Acceleration t the base
""~----~------r-----~----~------r-----~----~----~r-----' o 8 18
Time (sec)
FIGURE 4-5 Acceleration and Displacement Time History in a Case Defined as Collapse
4-10

3. Energy Average of Park and Ang's damage index, defined by Equation (2.7).
4. Maximum and Final Softening defined by Equations (2.10) and (2.11). Both indices
have been computed in two different ways, using the Systems Identification Program,
MUMOID, and computing a moving average of the instantaneous natural period.
4.3.4 Response of the Damaged Structure to a Second Earthquake
The response of the building frames to a second identical earthquake is analyzed in or
der to obtain an objective measure of damage independent from all the damage indices
which have been previously considered. The first concern in the post-earthquake evalu
ation of damaged structures is the assessment of the damaged structure's ability to safely
withstand the occurrence of a similar future earthquake. The idea is to evaluate the dam
aged structure's performance for the second earthquake in a simple way, classifying the
structure after the second quake as either a collapsed or a standing structure.
The failure of structural elements has been included in the computer code SARCF-III in
such a way that when the failure curvature of a structural element is exceeded, its bending
stiffness is reduced to a small number. When this happens to the most important elements
of the system, the displacements increase monotonically. This situation can be observed
in figure 4-5, where the acceleration and displacement history of the top level are shown
for the second occurrence of an 8.5 magnitude artificial earthquake affecting a 3 bay 4
story building with weak columns. In a few cases, the deformations during the second
earthquake were very large, but they were nevertheless periodic. For these few cases, an
overall drift greater than 6% has been considered to be equivalent to a state of collapse.
This being the definition of collapse used by Roufaiel and Meyer [20].
4-11


SECTION 5
ANALYSIS OF THE RESULTS
In this section the results of the numerical simulation of the earthquake response of the
building structures will be analyzed.
5.1 Systems Identification Program vs. Moving Average
As mentioned in Sections 4.3.2 and 4.3.3, two different methods have been used for the
computation of the Maximum and Final Softening. The first one is the use of the systems
identification program, MUMOID [9], and the second one is the computation of a moving
average of the instantaneous natural period.
This second approach is more advantageous durill.g the design stage, when only a com
puter model is available. It is also useful in reliability studies carried out by Monte Carlo
simulations on computer models of structural systems. The instantaneous natural period
can be easily computed from the first eigenvalue of the instantaneous tangent stiffness
matrix.
On the other hand, when a damage analysis based on the acceleration recorded at the base
and at the top of the building is carried out, the only method for the computation of the
Maximum and Final Softening is the systems identification program. This program finds
the natural period of an equivalent linear system for a series of non overlapping time win
dows. The previous work done by DiPasquale and Cakmak has related the value of the
Maximum Softening, computed using the systems identification program, to the proba
bility of damage [10]. It has also been shown, from a Continuum Mechanics approach,
that the global damage indices based on the vibrational parameters are related to the local
stiffness degradation through operations of averaging over the body volume.
5-1

0\ 0
00
0
r-0
1.0 0
---O1)tn Q . '5h 0
C\$ ~ Cl)
-.::t > < 0 '-"
:E to M
0
C'l 0
.-<
0 0
0
0 0.1
o
o
o
00
D 4 Story Building o 3 Story Building
o o
0.2 0.3 0.4 0.5 0.6 OM (Systems Identification)
0.7 0.8 0.9 1
FIGURE 5-1 Maximum Softening. System Identification Program vs. Moving Average
5-2

Systems Identification Program vs. Moving Average
-0\ 0
00
0
t-o
\D 0
--OJ) tr)
r:: 0 .-OJ) C':I ~ ~ -.::t ;> 0 --< '-" ~
c-o ~ 0
C"J 0
- o 4 Story Building 0 o 3 Story Building
0
0 0.1 0.2 0.3 0.4 0.5 0.6 0.7 0.8 0.9 1
bF (Systems Identification)
FIGURE 5-2 Final Softening. System Identification Program vs. Moving Average
5-3

These two methods for the computation of the Maximum and Final Softening come from
different definitions and it is important to know what the relationship is between the
results obtained by their usage.
Figure 5-1 shows the correlation between the Maximum Softening, D M, obtained using
these two methods, for the database created from the numerical simulations of the build
ing frames earthquake response. One can see by looking at figure 5-1 that, from a prac
tical point of view, these two methods for the computation of the Maximum Softening
are equivalent. Greater differences between the two methods occur in the 3 bay 4 story
building for values of the Maximum Softening greater than 0.5. As will be shown later,
a value of the Maximum Softening greater than 0.5 implies a high degree of damage.
Therefore, the exact value for a damage index greater than 0.5 it is not overly significant.
Figure 5-2 shows the correlation between the Final Softening, Dp, obtained by using the
same two methods. Since the Final Softening depends only upon the initial and final
natural periods, the results obtained by using these two methods are closer than in the
case of the Maximum Softening. These two methods can be considered to be equivalent.
5.2 Maximum Softening vs. Traditional Measures of Damage
In this section, the Maximum Softening, as a global damage index, will be compared
to four traditional measures of seismic damage. The traditional measures of seismic
damage that have been considered are: the maximum interstory drift, the maximum per
manent or final drift, and the maximum ductility ratio for beams and columns.
This comparison has been done by means of series of plots that show the value of the
Maximum Softening as a function of the other damage indicator (See figure 5-3). Each
point in the graphs has been obtained from the nonlinear dynamic analysis of any of the
building frames described in Section 4.1, for the first occurrence of the input ground
motions described in Section 4.2.
5-4

Percentage of damaged structures = (2y - 1)/0.04 (Sozen, 1981)
o 25 50 75 100 (%) .....
0\
[ I I I
0 -
00 0 -
t"-O - •
• \0 •
--- 0 ::: 0 . -
- • • • • • ..... V) CI:S
U 0 . -4-< . -..... - • • I • :::
~ Q) "'l::j 0 ~
-0 0
tI.l
S ("")
B 0 tI.l ;>-.
0
- p 0 0
Cf.) '-"'('l
::s . c,o 0
0
- ocR OJ
0 ...... 0
0
-DDoi
0 A second earthquake was withstood I • A second earthquake produced collapse i
't
I I I I I
o 1 2 3 4 5 6
Max. Interstory Drift (%)
FIGURE 5-3 Maximum Softening vs. Maximum Interstory Drift
5-5

The filled circles represent the cases for which the second occurrence of the same earth
quake produced collapse, according to the definition of collapse in Section 4.3.4. How
ever, the filled circles correspond to the damage indices that were computed for the first
earthquake.
If whether or not the structure collapses in the second earthquake is considered to be an
objective measure of the level of damage in the first earthquake, the best global damage
index would be the one that can predict the collapse of the structure in the second earth
quake. In that case, there should be a cutoff value of that damage index so that a collapse
resulting from the second identical earthquake only occurs for values greater than that
cutoff value.
In the previous work done by DiPasquale and Cakmak [10], the probability of damage
was found as a function of the Maximum Softening. Using 25 seismic simulation exper
iments performed at the University of Illinois at Urbana-Champaign, they found that the
serviceability limit state was related to an average value of the Maximum Softening of
0.43. This criterion was also used for the damage analysis of shaking table experiments
performed at the University of California at Berkeley, and of strong motion records from
the San Fernando (1971) and the Imperial Valley (1979) earthquakes, giving.results con
sistent with the actual damage observed.
This damage model was later extended to the identification of different damage states
[11], using the information contained in the same experiments performed at the Univer
sity of Illinois at Urbana-Champaign.
With the numerical simulations of the seismic response of moment resisting building
frames performed for this study, a larger data base for the calibration of the Maximum
Softening as a global damage index is available. The new information indicates that in
all the cases for which the Maximum Softening is greater than 0.4 the second occurrence
of the same earthquake produced a collapse.
5-6

The correlation of the Maximum Softening with other measures of damage will be ob
tained in the next subsection.
5.2.1 Maximum Interstory Drift
The interstory drift has long been considered to be an indication of seismic damage. A
limitation of the drift has been recommended for the seismic design of buildings to avoid
damage to nonstructural elements and to limit the inelastic deformations. In this study,
the maximum inters tory drift has been compared to the Maximum Softening as a global
damage index.
Figure 5-3 shows the results of this comparison. The definition of the percentage of
damaged structures for a given interstory drift proposed by Sozen [22], has also been
included. According to M. A. Sozen, the acceptability quotient, A, is given by
where,
A = (5 - 2,)/4
A : Fraccion of structures expected to remain safe
, : Maximum story drift in percentage
(5.1)
One can see in figure 5-3 how in all the cases a value of the Maximum Softening larger
than 0.4 implies a collapse in the second identical earthquake according to the definition
of collapse of Section 4.3.4. However, there is not a value of the maximum inters tory drift
that separates the structures that collapse in the second earthquake. A good correlation
is observed between the two definitions of damage in the sense that an interstory drift
of 1 %, with only 25% of damaged structures according to Sozen, corresponds to a small
value of the Maximum Softening (0.1). The average value of the maximum inters tory
drift that implies collapse in the second run is about 2.5%, value that would imply 100%
of damaged structures according to Sozen.
5-7

Yao's defmition of damage (1983)
0\ d
00 d
t""-O
\0 ~ 0 c: • 0 .-.... C':$ Ir)
u d tC .-.... c:
-.::t a) "'0 d ....... 0 o
v.l
S C'() Q) .... 0 v.l ~
0
0
0 0 (I) "-"N
::E . GOO
0
§o DO
0 ..... d
ti o A second earthquake was withstood 0 • A second earthquake produced collapse
o ;-----~-----+----------~r_----------~----------~ o 1 2 3 4
Max. Pennanent Drift (%)
FIGURE 5-4 Maximum Softening vs. Maximum Final Drift
5-8
5.2.2 Maximum Final Drift
The maximum final or penn anent drift is closely related to the plastic defonnations in a
structural system.
Toussi and Yao introduced a qualitative classification of damage, which among other
things included the penn anent drift experienced by building structures [23 and 24].
They defined four level::; of structural damage as follows:
1. Safe
Cracks less than 0.05 mm wide. No new cracks that open. No macroscopic or global
nonlinearities. The structure "stays stiff', the vibration of the upper floors does not
reflect the irregularities of the base motion. The story drift does not exceed 1 % of
the story height.
2. Lightly Damaged
Flexural cracks open, width less than or equal to 0.1 mm. The motion of the upper
floors reflects the irregularities in the base motion. Permanent displacements can be
measured and are approximately 0.5% of the story height.
3. Damaged
Cracking is extensive, crack width of the order of 0.3mm. Possible local spalling.
Penn anent displacements around 1 % of the story height.
4. Critically Damaged
Crack width of 0.4 mm and beyond, crushing, spalling of several elements. Top story
displacement shows some aperiodicity at the end of the record. Poor correlation
between base shear and top level displacement.
In figure 5-4, the Maximum Softening versus the maximum permanent drift has been
plotted. The lines which represent the damaged and lightly damaged structures, accord
ing to the previous classification, have also been included.
5-9

-~------------------------------------------------------,
d - 0 A second earthquake was withstood
~o
t-:_ o
-d-
0
IEJ o 0 0
0
• A second earthquake produced collapse
•
0
o
0 0 0
I I
5 10
•
0
T
15
•
o 0
• 0
I
20
•
Max. Ductility Ratio for Columns
• •
I
25
• • • •
0
0
I
30 35
FIGURE 5-5 Maximum Softening vs. Maximum Ductility Ratio for Columns
5-10

From this figure it can be concluded that the value of the Maximum Softening provides a
better separation between the structures which will collapse with a repetition of the same
earthquake and the structures which will withstand that second earthquake.
It can be observed that all but one of the runs with a Maximum Softening smaller than
0.4 had a maximum permanent drift of less than 0.5%. However, the maximum perma
nent drift of the structures with a Maximum Softening greater than 0.4 have a maximum
permanent drift ranging from less than 0.5% to greater than 3%. A small level of damage
implies a maximum permanent drift less than 0.5%, but not vice versa. This shortcoming
of the maximum permanent drift as a measure of damage seems to ,come from the fact
that even a badly damaged structure may present no permanent drift, even after strong
plastic deformations.
5.2.3 Maximum Ductility Ratio for Beams and Columns
The ductility ratio is frequently used as a measure of seismic damage. This concept is
very useful in the design of earthquake resistant structures when using elastic models.
The ductility ratio, which is the ratio between the maximum deformation and the yield
deformation, can be defined as a displacement, rotation or curvature ductility ratio.
Figure 4-3 shows the relationship between the displacement ductility ratio and the curva
ture ductility ratio for the case of a cantilever beam with a load at the end. The curvature
ductility ratio applies only to the most damaged section along the member and does not
reflect the overall state of damage of the member. H. Banon et ai- [2] compared the
curvature ductility to other damage measures and concluded that it was one of the least
reliable since it does not take into consideration any stiffness or strength degradation.
Reference [2] lists the curvature ductility ratio at failure for 32 specimens tested in lab
oratory. The average curvature ductility ratio at failure was 14.5, but presented a high
variability with values from 2.1 to 35.4.
5-11

.......
0;_ 0 o A second earthquake was withstood
• A second earthquake produced collapse OC?_ 0
r--:_ 0 •
• ~- • -- 0
::: 0 ......
•• • • • ..... "!-~
u 0 !+:: ......
• • • ..... ::: ~-d)
"'0 0 - 0 0 <Zl
S ~-~
<Zl 0 ;>,
0
0
DO ~ '-"N
:::20-c-o
0
°cP 0
0 ....... 0- §
0 0 0
0 I I I I
0 10 20 30 40 50
Max. Ductility Ratio for Beams
FIGURE 5-6 Maximum Softening vs. Maximum Ductility Ratio for Beams
5-12
In figures 5-5 and 5-6 one can see the maximum ductility ratio for columns and beams,
respectively, versus the Maximum Softening.
The correlation between the maximum ductility ratio for the columns and the Maximum
Softening is very poor. The high variability of the curvature ductility ratio mentioned
before can be clearly observed. Structures that collapsed during the second earthquake,
according to the definition of collapse in Section 4.3.4, have maximum ductility ratio
values for columns ranging from 10 to 30.
The correlation between the maximum ductility ratio for beams and the Maximum Soft
ening is much better than that for columns. The Maximum Softening is able to predict
whether or not a second identical earthquake will produce a collapse, since it is possible
to draw a horizontal line that separates the squares and the filled circles. Nevertheless, it
is not possible to draw a vertical straight line that serves the same purpose.
The average value of the curvature ductility ratio which separates the structures that col
lapsed during the second earthquake, is between 15 and 20.
5.3 Maximum Softening vs. Weighted Averages of Local Damage Indices
In this section, two attempts to define a global damage index are compared. The Maxi
mum Softening, which depends on the change that occurs in a structural system's natural
period, is compared to three weighted averages of local damage indices.
Local damage indices are indispensable for the identification of the damage level of indi
vidual elements. In the design process, local damage indices can highlight the elements
that should be modified. However, it is very difficult to get a clear idea of a structural
system's response to a given input ground motion from a long list of elemental damage
indices. Global damage indices are necessary for post-earthquake evaluation of existing
structures, reliability studies and design of new structures.
5-13

0;_ 0 o A second earthquake was withstood
• A second earthquake produced collapse cx::_ 0
t"-:_ 0 •
• '-c:_ •
~ 0 ::: 0 .....
• • • • .... CI:I 'r:_ u 0
t;::: ..... • • • .... e
~-a.> "'Cl 0 - 0 0
1:/1
S ~-a.>
0
0 .... 0 1:/1 ~ DO
r/) '-" ::E~-
c.o 0
0 0 0 De 0 -d- cP
0 [!J
o I I I I I I I I I
0 0.1 0.2 0.3 0.4 0.5 0.6 0.7 0.8 0.9 1 Energy Average of Park's Local Damage
FIGURE 5-7 Maximum Softening vs. Energy Average of Park's Index
5-14

The global damage indices described in Section 2.2.1, were proposed to fill this necessity,
and are based on the computation of a weighted average of the local damage.
Local damage indices for reinforced concrete structures usually have complicated defini
tions because they have to characterize the state of damage of such a complex system as
a reinforced concrete member. The remaining capacity of a reinforced concrete member
depends on the deformation level, the energy dissipated and the number and intensity of
the loading cycles. For a given ground motion, all this information is available when a
computer model of a structure is being used, but in the evaluation of existing structures
many problems arise. The damage analysis of existing structures requires the building
of a computer model of a complex existing structure with many sources of uncertainty
and it is necessary to have a record of the actual ground motion.
The use of the Maximum Softening as a global damage index has the advantage that it
can be computed directly from the acceleration records at the base and at the top of the
building. In evaluating damage in computer models, the procedure for the Maximum
Softening's computation is independent of the definition of the hysteresis loops. There
fore, its computation can be easily implemented in any computer code.
5.3.1 Energy Average of the Modified Park and Ang's Index
Figure 5-7 shows the relationship between the energy average of the modified Park and
Ang's index, defined by Equation (2.6), and the Maximum Softening.
According to Reference [19], a range of Park's damage index of between 0.4 and 1.0 rep
resents severe damage characterized by extensive crashing of the concrete and disclosure
of buckled reinforcement. A damage index just below 0.4 represents moderate damage
with extensive large cracks and spalling of the concrete. For smaller damage indices,
the damage results in minor cracks and partial crushing of the concrete in the columns.
5-15

0':_ 0 A second earthquake was withstood ° • A second earthquake produced collapse
~-
° l":_ • 0
• ~- •
,-.., 0 • • s::: • 0 • . -...... Irl_ ~ • C,) 0 • t;::: . - • ......
s::: ~-Q)
"'0 ° 0 - 0 rn 0 S ~- 0 E 0 rn 0 0 :>.
CZl 0 '-' ::;;r"!_ 0 0 c-0
0 0'21 0
~- o 0 0
0 OIJ
0 I I I I I I I I I
0 0.1 0.2 0.3 0.4 0.5 0.6 0.7 0.8 0.9 1 Energy Average of Chung's Local Damage
FIGURE 5-8 Maximum Softening vs. Energy Average of Chung's Index
5-16

Structures with a damage index below 0.4 have a substantial reserve capacity before total
collapse and some reserve capacity before irreparable damage.
Figure 5-7 indicates that the value of the energy average of the modified Park and Ang's
index is about 70% of the value of the Maximum Softening. The structures that collapse
in the second occurrence of the same earthquake have an energy average of the modified
Park and Ang's index of between 0.25 and 0.55. The correlation between the two indices
is good, considering that they come from completely different definitions. However, the
Maximum Softening provides more information about whether or not a structure will
collapse during a second identical earthquake.
5.3.2 Energy Average of the Chung, Meyer and Shinozuka's Index
Figure 5-8 shows the relationship between the energy average of Chung, Meyer and Shi
nozuka's index, defined by Equation (2.7), and the Maximum Softening. This definition
of the global damage was not proposed by Chung et ai. , but has been used here because
it is similar to the definition of global damage by Park et ai.
One can see in figure 5-8 how the correlation between the energy average of Chung,
Meyer and Shinozuka's index, and the Maximum Softening is very poor.
The value of the energy average of Chung, Meyer and Shinozuka's index is unable to
predict whether the structure would collapse or not during a second identical earthquake.
It is not possible to draw a straight vertical line separating filled circles and squares, but
is clearly possible to draw a horizontal line as shown before.
5-17

0:_ o
00 ci-
t"-:_ o
o
o
o o OJ 0 o
;; _ 0 0
o DO
o
o A second earthquake was withstood • A second earthquake produced collapse
• • • •
o
o 0
o
• • •
•
• •
o ~----r---~-----.----.----'-----.----.----.r----r--~ II I I I I I I I
o 0.2 0.4 0.6 0.8 1 1.2 1.4 1.6 1.8 2 Weighted Average of Chung's Local Damage
FIGURE 5-9 Maximum Softening vs. Chung's Weighted Average
5-18

5.3.3 Weighted Average of Chung, Meyer and Shinozuka's Story Index
Figure 5-9 shows the relationship between the weighted average of Chung, Meyer and
Shinozuka's story index, using the triangular weighting function defined by Equation
(2.8), and the Maximum Softening. This was the original definition of global damage
as proposed by Chung et al. [7]. The correlation with the Maximum Softening is much
better than in the previous case.
The value of the Maximum Softening is about 45% of the value of the weighted average
of Chung, Meyer and Shinozuka's story damage index. Thus, a value of the weighted av
erage of Chung's story index of 1.0 corresponds approximately to a Maximum Softening
ofO.4S.
The Maximum Softening is still a better predictor of the collapse on the second run.
5.4 Maximum Softening vs. Final Softening
The Final Softening has been shown to be approximately equal to a weighted average of
the local damage when the mode shape does not change significantly after damage [11].
It is related to the global stiffness degradation. When the initial natural period is known,
the Final Softening can be computed from the results of post-earthquake vibration testing.
Figure 5-10 suggests that the Final Softening, defined by Equation (2.11) could be used
as a global damage index equivalent to the Maximum Softening. However, it should be
noted that the Final Softening only includes information about the strength degradation,
whereas the Maximum Softening also gives information about the plastic deformations.
In figure 5-10 there are four points with a very similar Final Softening value of between
0.5 and 0.6. For these four earthquake runs, the amount of stiffness degradation was
similar, but the value of the Maximum Softening indicates that two of those cases under
went greater plastic deformations. Precisely these two cases collapsed during the second
5-19

.......
0:_ 0
oq-0
t;_ 0
~---- 0 Q 0 . -...... ~ Irl_ Co) 0 t;::: . -...... Q
'<:t:_ (!) "'0 0 ......
tr.l
S ~-(!) ...... 0 tr.l
;;>., CIJ "-' ::s~-
c.o 0
....... 0-
en 0
0
o A second earthquake was withstood • A second earthquake produced collapse
• • • 0 0
0
0
0 0
0
0 o Bo
0
Do
0
I I I I I I I
0.1 0.2 0.3 0.4 0.5 0.6 0.7 bF (Systems Identification)
• . , • •
I
0.8
• •
FIGURE 5-10 Maximum Softening vs. Final Softening
5-20
I
0.9 1

occurrence of the same earthquake. The Maximum Softening is then a more complete
damage indicator.
The correlation between the Maximum Softening and the Final Softening for the database
analyzed is quite good. For practical purposes it can be said that the the Final Softening
has a value 30% greater than the Maximum Softening. A Maximum Softening value of
0.45 corresponds approximately to a Final Softening value of 0.59.
The evolution of the Final Softening could also be used for the characterization of the
state of aging structures.
5-21


6.1 Conclusions
SECTION 6
CONCLUSIONS
The response of three code-designed building frames subjected to a set of artificially gen
erated and recorded earthquakes has been obtained by using the computer code SARCF
III. Several damage indices and traditional measures of damage have been computed.
The traditional measures of seismic damage and several local and global damage in
dices, have been evaluated and compared. Their relationship and correlation have been
studied.
A new way of computing the global damage indices defined by DiPasquale and Cakmak
[10] from a moving average of the instantaneous natural period is presented. An averag
ing window with a length equal to two or two and a half times the initial natural period has
been found to yield results consistent with the original way of computing those indices.
Two local damage indices have been used: Chung, Meyer and Shinozuka's index and
a modified Park and Ang's index. Two groups of global indices have been considered:
global damage indices based on the vibrational parameters and weighted averages of the
local damage indices. The traditional measures of damage included in this study are the
maximum inters tory drift, the permanent inters tory drift and the maximum ductility ratio
for beams and columns.
The computer program SARCF-III used to simulate the seismic response of the build
ing frames has been improved in order to carry out this research. The computed results
have been compared to the experimental results of tests done on a reinforced concrete
model tested at the University of Illinois at Urbana-Champaign (UIUC) by Sozen and
his associates [5]. SARCF-III has also been compared to a similar program, IDARC,
6-1

developed at State University of New York at Buffalo by Y. J. Park et ai. [18]. Consider
ing the uncertainties that exist in the description of the nonlinear behavior of reinforced
concrete structures, a good approximation to the experimental results was obtained by
using the program SARCF-Ill. The response of structures clearly in the nonlinear range
is predicted with a higher degree of accuracy than that of structures that start to develop
plasticity.
The analysis of the results of the numerical simulations that have been performed yield
the following conclusions:
1. The Maximum and Final Softening can be computed by using the systems identifi
cation program, MUMOID [9], or by computing a moving average of the instanta
neous natural period, thus obtaining results that are equivalent from a practical point
of view.
2. The traditional measures of damage depend on the structural configuration. They
have to be calibrated for each case. For the studied cases, the Maximum Softening
predicts the structural capacity for future earthquakes more consistently than any of
the traditional measures of damage that have herein been considered. The Maximum
Softening presents a better correlation with the maximum interstory drift and with
the maximum ductility ratio for beams, than with the maximum permanent drift and
the maximum ductility ratio for columns.
3. For this set of numerical simulations the Maximum Softening is a more robust global
damage index than the weighted averages of the local damage indices included in this
report. It consistently predicts the structural capacity for future earthquakes. Local
damage indices give important information at the local level, but in order to obtain
a global damage index, an appropriate weighting function has to be defined. The
Maximum Softening avoids the definition of a weighting function.
6-2

4. The correlation of the Maximum Softening with the energy average of the modified
Park's index is good. The correlation of the Maximum Softening with the weighted
average of Chung's index is only good when using a triangular shape with the max
imum at the base as the weighting function for the story damage indices.
5. The Final Softening gives a less reliable indication of the global damage than does the
Maximum Softening, but nevertheless its indication is equivalent to the traditional
measures of damage and to the weighted averages of the local damage indices.
6.2 Suggestions for Future Research
This report provides new information about the correlation between various damage in
dices and the damage level derived from a set of numerical simulations of the seismic
response of reinforced concrete frames. The number of structures and earthquake ground
motions used in this study only allows one to draw qualitative conclusions. Statistically
more meaningful results could be obtained by performing more simulations with new
structural configurations. New definitions of damage indices could also be included in a
more extensive evaluation.
The same procedure could be applied to other aspects of the seismic design of structures
in order to take advantage of the available computer codes to shed more light on the seis
mic behavior of structures. Computer models are more economical than reduced scale
models of a structure and allow for more flexibility. Examples of possible applications
are: the study of the relationship between the type of earthquake, i.e. frequency con
tent, magnitude, distance, etc, and the resulting damage, or the study of the cumulative
damage caused by a series of seismic events during the life of a structure.
In order to pursue this approach, more accurate computer models are necessary. More
research is required in the three-dimensional modeling of reinforced concrete elements.
6-3

The interaction between all the internal forces and the histeretic behavior should be con
sidered and non structural elements should be modeled.
The Maximum Softening has proven to be a robust global damage index for the studied
cases, but it would be useful to check its performance in cases for which the soil-structure
interaction is significant or when three-dimensional effects cannot be neglected. The ap
plicability of the Maximum Softening to steel structures or to other structural configura
tions such as bridges, could also be investigated.
6-4

SECTION 7
REFERENCES
[1] ACI Committee 318-83, "Building Code Requirements for Reinforced Concrete", American Concrete Institute, 1983.
[2] Banon, H. Biggs, J. M. and Irvine, H. M., "Seismic Damage in Reinforced Concrete Frames", Journal of the Structural Division, Proc., ASCE, Vol. 107, No ST9, Sept. 1981, pp 1713-1729.
[3] Bertero, V. v., "Stiffness Degradation of Reinforced Concrete Structures Subjected to Cyclic Flexural Moments", Earthquake Engineering Research Center, Berkeley, California, 1969.
[4] Bertero, V. V., Bendimerad, F. M. and Shah H. C., "Fundamental Period of Reinforced Concrete Moment-Resisting Frame Structures", The J.A. Blume Earthquake Engineering Center, Stanford University, 1988.
[5] Cecen, H., "Response of a Ten Story, Reinforced Concrete Model Frames to Simulated Earthquakes", Ph.D. Thesis, University of Illinois at Urbana-Champaign, 1979.
[6] Chung, Y. S., Meyer, C. and Shinozuka, M., "Seismic Damage Assessment of Reinforced Concrete Buildings", NCEER-87-0022, National Center for Earthquake Engineering Research, State University of New York at Buffalo, 1987.
[7] Chung, Y. S., Shinozuka, M. and Meyer, c., "Automated Seismic Design of Reinforced Concrete Buildings", NCEER-88-0024, National Center for Earthquake Engineering Research, State University of New York at Buffalo, 1988.
[8] Chung, Y. S., Shinozuka, M. and Meyer, C., "SARCF User's Guide Seismic Analysis of Reinforced Concrete Frames", NCEER-88-0044, National Center for Earthquake Engineering Research, State University of New York at Buffalo, 1988.
[9] DiPasquale, E. and Cakmak, A.S., "Detection and Assessment of Seismic Structural Damage", NCEER-87-0015, National Center for Earthquake Engineering Research, State University of New York at Buffalo, 1988.
[10] DiPasquale, E. and Cakrnak, A.S., "Identification of the Serviceability Limit State and Detection of Seismic Structural Damage", NCEER-88-0022, National Center
7-1

for Earthquake Engineering Research, State University of New York at Buffalo, 1988.
[11] DiPasquale, E. and Cakmak, AS., "On the Relation Between Local and Global Damage Indices", NCEER-89-0034, National Center for Earthquake Engineering Research, State University of New York at Buffalo, 1989.
[12] Ellis, G. W. and Cakmak, AS., "Modelling Earthquake Ground Motions in Seismically Active Regions Using Parametric Time Series Methods", NCEER-87-0014, National Center for Earthquake Engineering Research, State University of New York at Buffalo, 1987.
[13] Ellis, G. W. and Cakmak, AS., "Modelling Strong Ground Motions from Multiple Event Earthquakes", NCEER-88-0042, National Center for Earthquake Engineering Research, State University of New York at Buffalo, 1988.
[14] Kustu, 0., "Behavior of Reinforced Concrete Deep Beam-Column Subassemblages Under Cyclic Loads", Earthquake Engineering Research Center, Berkeley, California, 1975.
[15] Park, Y. J. and Ang, A. H.-S., "Mechanistic Seismic Damage Model for Reinforced Concrete", ASCE 1. Struc. Eng., 111 (4) April 1985, pp. 722-739.
[16] Park, Y. J., Ang, A. H.-S., and Wen, Y. K., "Seismic Damage Analysis of Reinforced Concrete Buildings", ASCE J. Struc. Eng., 111 (4) April 1985, pp. 740-757.
[17] Park, Y. J., Ang, A H.-S., and Wen, Y. K., "Damage Limiting Aseismic Design of Buildings", Earthquake Spectra, Vol. 3 No.1, Feb. 1987, pp. 1-26.
[18] Park, Y. J., Reinhorn, A M. and Kunnath, S. K., "IDARC: Inelastic Damage Analysis of Reinforced Concrete Frame - Shear-Wall Structures", NCEER-87-0008, National Center for Earthquake Engineering Research, State University of New York at Buffalo, 1987.
[19] Reinhorn, A M., Seidel, M. J., Kunnath, S. K. and Park, Y. J., "Damage Assessment of Reinforced Concrete Structures in Eastern United States", NCEER-88-0016, National Center for Earthquake Engineering Research, State University of New York at Buffalo, 1988.
[20] Roufaiel, M. S. L. and Meyer, C., "Analysis of Damaged Concrete Frame Buildings", Technical Report No. NSF-CEE-81-21359-1 Department of Civil Engineering and Engineering Mechanics, Columbia University, 1983.
7-2

[21] Shinozuka, M., Chung, Y. S., Hatamoto, H. and Meyer, C., "Seismic Safety Improvement of Damage Optimized Reinforced Concrete Frames", 1989.
[22] Sozen, M. A., "Review of Earthquake Response of Reinforced Concrete Buildings with a View to Drift Control", State of the Art in Earthquake Engineering, Turkish National Committee on Earthquake Engineering, Instanbul, Turkey, 1981.
[23] Stephens, J. E. and Yao, J. P. T., "Damage Assessment Using Response Measurements", ASCE J. Struc. Eng. 113 (4) April 1987, pp. 787-801.
[24] Toussi, S. and Yao, J. P. T., "Hysteresis Identification of Existing Structures", ASCE J. Eng. Mech., Vol. 109, No.5, Oct. 1983, pp. 1189-1203.
[25] Uniform Building Code, "Earthquake Regulations", 1988.
[26] Vanmarcke, E. H., "Random Fields: Analysis and Synthesis", M.LT. Press, Cambridge, Mass., 1983.
7-3


NATIONAL CENTER FOR EARTHQUAKE ENGINEERING RESEARCH LIST OF TECHNICAL REPORTS
The National Center for Earthquake Engineering Research (NCEER) publishes technical reports on a variety of subjects related to earthquake engineering written by authors funded through NCEER. These reports are available from both NCEER's Publications Department and the National Technical Information Service (NTIS). Requests for reports should be directed to the Publications Department, National Center for Earthquake Engineering Research, State University of New York at Buffalo, Red Jacket Quadrangle, Buffalo, New York 14261. Reports can also be requested through NTIS, 5285 Port Royal Road, Springfield, Virginia 22161. NTIS accession numbers are shown in parenthesis, if available.
NCEER-87-0001
NCEER-87-0002
NCEER -87 -0003
NCEER-87-0004
NCEER-87-0005
NCEER-87-0006
NCEER -87 -0007
NCEER-87 -0008
NCEER-87 -0009
NCEER -87 -00 1 0
NCEER-87-0011
NCEER-87-0012
NCEER -87 -00 13
NCEER-87-0014
NCEER-87-0015
NCEER-87-0016
"First-Year Program in Research, Education and Technology Transfer," 3/5/87, (PB88-134275/AS).
"Experimcntal Evaluation of Instantaneous Optimal Algorithms for Structural Control," by R.C. Lin, T.T. Soong and A.M. Reinhorn, 4/20/87, (PB88-134341/AS).
"Experimentation Using the Earthquake Simulation Facilities at University at Buffalo," by A.M. Reinhorn and R.L. Ketter, to be published.
"The System Characteristics and Performance of a Shaking Table," by J.S. Hwang, K.C. Chang and G.C. Lee, 6/1/87, (PB88-134259/AS). This report is available only through NTIS (see address given above).
"A Finite Elcment Formulation for Nonlinear Viscoplastic Matcrial Using a Q Model," by O. Gyebi and G. Dasgupta, 11/2/87, (PB88-213764/AS).
"Symbolic Manipulation Program (SMP) - Algebraic Codes for Two and Three Dimensional Finite Element Formulations," by X. Lee and G. Dasgupta, 11/9/87, (PB88-219522/AS).
"Instantaneous Optimal Control Laws for Tall Buildings Under Seismic Excitations," by IN. Yang, A. Akbarpour and P. Ghaemmaghami, 6/10/87, (PB88-134333/AS).
"IDARC: Inclastic Damage Analysis of Reinforced Concrete Frame - Shear-Wall Structures," by YJ. Park, A.M. Reinhorn and S.K. Kurmath, 7/20/87, (PB88-134325/AS).
"Liquefaction Potential for New York State: A Preliminary Report on Sites in Manhattan and Buffalo," by M. Budhu, V. Vijayakumar, R.F. Giese and L. Baumgras, 8/31/87, (PB88-163704/AS). This report is available only through NTIS (see address given above).
"Vertical and Torsional Vibration of Foundations in Inhomogeneous Media," by A.S. Veletsos and K.W. Dotson, 6/1/87, (PB88-134291/AS).
"Seismic Probabilistic Risk Assessment and Seismic Margins Studies for Nuclear Power Plants," by Howard H.M. Hwang, 6/15/87, (PB88-134267/AS).
"Parametric Studies of Frequency Response of Secondary Systems Under Ground-Acceleration Excitations," by Y. Yong and Y.K. Lin, 6/10/87, (PB88-134309/AS).
"Frequency Response of Secondary Systems Under Seismic Excitation," by lA. HoLung, 1 Cai and Y.K. Lin, 7/31/87, (PB88-134317/AS).
"Modelling Earthquake Ground Motions in Seismically Active Regions Using Parametric Time Series Methods," by G.W. Ellis and A.S. Cakmak, 8/25/87, (PB88-134283/AS).
"Detection and Assessment of Seismic Structural Damage," by E. DiPasquale and A.S. Cakmak, 8/25/87, (PB88-163712/AS).
"Pipeline Experiment at Parkfield, California," by J. Isenberg and E. Richardson, 9/15/87, (PB88-163720/AS). This report is available only through NTIS (see address given above).
A-I

NCEER -87 -00 17
NCEER-87-0018
NCEER-87-0019
NCEER -87 -0020
NCEER-87-0021
NCEER-87 -0022
NCEER-87-0023
NCEER-87-0024
NCEER -87 -0025
NCEER -87 -0026
NCEER -87 -0027
NCEER-87-0028
NCEER-88-0001
NCEER-88-0002
NCEER -88-0003
NCEER-88-0004
NCEER-88-0005
NCEER -88-0006
NCEER-88-0007
"Digital Simulation of Seismic Ground Motion," by M. Shinozuka, G. Deodatis and T. Harada, 8/31/87, (PB88-155197/AS). This report is available only through NTIS (see address given above).
"Practical Considerations for Structural Control: System Uncertainty, System Time Delay and Truncation of Small Control Forces," J.N. Yang and A. Akbarpour, 8/10/87, (PB88-163738/AS).
"Modal Analysis of Nonclassically Damped Structural Systems Using Canonical Transformation," by J.N. Yang, S. Sarkani and F.x. Long, 9/27/87, (PB88-187851/AS).
"A Nonstationary Solution in Random Vibration Theory," by IR. Red-Horse and P.D. Spanos, 11/3/87, (PB88-163746/AS).
"Horizontal Impedances for Radially Inhomogeneous Viscoelastic Soil Layers," by A.S. Veletsos and K.W. Dotson, 10/15/87, (PB88-150859/AS).
"Seismic Damage Assessment of Reinforced Concrete Members," by Y.S. Chung, C. Meyer and M. Shinozuka, 10/9/87, (PB88-150867/AS). This report is available only through NTIS (see address given above).
"Active Structural Control in Civil Engineering," by T.T. Soong, 11/11/87, (PB88-187778/AS).
Vertical and Torsional Impedances for Radially Inhomogeneous Viscoelastic Soil Layers," by K.W. Dotson and A.S. Veletsos, 12/87, (PB88-187786/AS).
"Proceedings from the Symposium on Seismic Hazards, Ground Motions, Soil-Liquefaction and Engineering Practice in Eastern North America," October 20-22, 1987, edited by K.H. Jacob, 12/87, (PB88-188115/AS).
"Report on the Whittier-Narrows, California, Earthquake of October 1, 1987," by J. Pantelic and A. Reinhorn, 11/87, (PB88-187752/AS). This report is available only through NTIS (see address given above).
"Design of a Modular Program for Transient Nonlinear Analysis of Large 3-D Building Structures," by S. Srivastav and J.F. Abel, 12/30/87, (PB88-187950/AS).
"Second-Year Program in Research, Education and Technology Transfer," 3/8/88, (PB88-219480/AS).
"Workshop on Seismic Computer Analysis and Design of Buildings With Interactive Graphics," by W. McGuire, J.F. Abel and C.H. Conley, 1/18/88, (PB88-187760/AS).
"Optimal Control of Nonlinear Flexible Structures," by J.N. Yang, F.x. Long and D. Wong, 1/22/88, (PB88-213772/AS).
"Substructuring Techniques in the Time Domain for Primary-Secondary Structural Systems," by G.D. Manolis and G. Juhn, 2/10/88, (PB88-213780/AS).
"Iterative Seismic Analysis of Primary-Secondary Systems," by A. Singhal, L.D. Lutes and P.D. Spanos, 2/23/88, (PB88-213798/AS).
"Stochastic Finite Element Expansion for Random Media," by P.D. Spanos and R. Ghanem, 3/14/88, (PB88-213806/AS).
"Combining Structural Optimization and Structural Control," by F.Y. Cheng and C.P. Pantelides, 1/10/88, (PB88-213814/AS).
"Seismic Performance Assessment of Code-Designed Structures," by H.H-M. Hwang, J-W. Jaw and H-I Shau, 3/20/88, (PB88-219423/AS).
A-2

NCEER-88-0008
NCEER-88-0009
NCEER-88-0010
NCEER-88-0011
NCEER-88-0012
NCEER-88-0013
NCEER-88-0014
NCEER-88-0015
NCEER-88-0016
NCEER-88-0017
NCEER-88-0018
NCEER-88-0019
NCEER-88-0020
NCEER-88-0021
NCEER-88-0022
NCEER-88-0023
NCEER -88-0024
NCEER-88-0025
NCEER-88-0026
NCEER-88-0027
"Reliability Analysis of Code-Designed Structures Under Natural Hazards," by H.H-M. Hwang, H. Ushiba and M. Shinozuka, 2/29/88, (PB88-229471/AS).
"Seismic Fragility Analysis of Shear Wall Structures," by J-W Jaw and H.H-M. Hwang, 4/30/88, (PB89-102867/AS).
"Base Isolation of a Multi-Story Building Under a Harmonic Ground Motion - A Comparison of Performances of Various Systems," by F-G Fan, G. Ahmadi and 1.G. Tadjbakhsh, 5/18/88, (PB89-122238/AS).
"Seismic Floor Response Spectra for a Combined System by Green's Functions," by F.M. Lavelle, L.A. Bergman and PD. Spanos, 5/1/88, (PB89-102875/AS).
"A New Solution Technique for Randomly Excited Hysteretic Structures," by G.Q. Cai and Y.K. Lin, 5/16/88, (PB89-102883/AS).
"A Study of Radiation Damping and Soil-Structure Interaction Effects in the Centrifuge," by K. Weissman, supervised by lH. Prevost, 5/24/88, (PB89-144703/AS).
"Parameter Identification and Implementation of a Kinematic Plasticity Model for Frictional Soils," by J.H. Prevost and D.V. Griffiths, to be published.
"Two- and Three- Dimensional Dynamic Finite Element Analyses of the Long Valley Dam," by D.V. Griffiths and lH. Prevost, 6/17/88, (PB89-144711/AS).
"Damage Assessment of Reinforced Concrete Structures in Eastern United States," by A.M. Reinhorn, M.J. Seidel, S.K. Kunnath and Y.J. Park, 6/15/88, (PB89-122220IAS).
"Dynamic Compliance of Vertically Loaded Strip Foundations in Multilayered Viscoelastic Soils," by S. Ahmad and A.S.M. Israil, 6/17/88, (PB89-102891/AS).
"An Experimental Study of Seismic Structural Response With Added Viscoelastic Dampers," by R.C. Lin, Z. Liang, T.T. Soong and R.H. Zhang, 6/30/88, (PB89-122212/AS).
"Experimental Investigation of Primary - Secondary System Interaction," by G D. Manolis, G. Juhn and A.M. Reinhom, 5/27/88, (PB89-122204/AS).
"A Response Spectrum Approach For Analysis of Nonc1assically Damped Structures," by J.N. Yang, S. Sarkani and F.x. Long, 4/22/88, (PB89-102909/AS).
"Seismic Interaction of Structures and Soils: Stochastic Approach," by A.S. Veletsos and A.M. Prasad, 7/21/88, (PB89-122196/AS).
''Idcntification of the Serviceability Limit State and Detection of Seismic Structural Damage," by E. DiPasquale and A.S. Cakmak, 6/15/88, (PB89-122188/AS).
"Multi-Hazard Risk Analysis: Case of a Simple Offshore Structure," by B.K. Bhartia and E.H. Vanmarcke, 7/21/88, (PB89-145213/AS).
"Automated Seismic Design of Reinforced Concrete Buildings," by Y.S. Chung, C. Meyer and M. Shinozuka, 7/5/88, (PB89-122170IAS).
"Experimental Study of Active Control of MDOF Structures Under Seismic Excitations," by L.L. Chung, R.C. Lin, T.T. Soong and A.M. Reinhom, 7/10/88, (PB89-122600/AS).
"Earthquake Simulation Tests of a Low-Rise Metal Structure," by lS. Hwang, K.C. Chang, G.C. Lee and R.L. Ketter, 8/1/88, (PB89-102917/AS).
"Systems Study of Urban Response and Reconstruction Due to Catastrophic Earthquakes," by F. Kozin and H.K. Zhou, 9/22/88, (PB90-162348/AS).
A-3

NCEER-88-0028
NCEER -88-0029
NCEER-88-0030
NCEER-88-0031
NCEER-88-0032
NCEER-88-0033
NCEER-88-0034
NCEER-88-0035
NCEER-88-0036
NCEER-88-0037
NCEER-88-0038
NCEER-88-0039
NCEER-88-0040
NCEER-88-0041
NCEER-88-0042
NCEER-88-0043
NCEER-88-0044
NCEER-88-0045
NCEER-88-0046
"Seismic Fragility Analysis of Plane Frame Structures," by H.H-M. Hwang and Y.K. Low, 7(31/88, (PB89-131445/AS).
"Response Analysis of Stochastic Structures," by A. Kardara, C. Bucher and M. Shinozuka, 9/22/88, (PB89-174429/AS).
"Nonnormal Accelerations Due to Yielding in a Primary Structure," by D.C.K. Chen and L.D. Lutes, 9/19/88, (PB89-131437/AS).
"Design Approaches for Soil-Structure Interaction," by A.S. Veletsos, A.M. Prasad and Y. Tang, 12(30/88, (PB89-174437/AS).
"A Re-evaluation of Design Spectra for Seismic Damage Control," by C.J. Turkstra and A.G. Tallin, 11/7/88, (PB89-145221/AS).
"The Behavior and Design of Noncontact Lap Splices Subjected to Repeated Inelastic Tensile Loading," by V.E. Sagan, P. Gergely and R.N. White, 12/8/88, (PB89-163737/AS).
"Seismic Response of Pile Foundations," by S.M. Mamoon, P.K. Banerjee and S. Alunad, 11/1/88, (PB89-145239/AS).
"Modeling of R/C Building Structures With Flexible Floor Diaphragms (IDARC2)," by A.M. Reinhom, S.K. Kunnath and N. Panahshahi, 9/7/88, (PB89-207153/AS).
"Solution of the Dam-Reservoir Interaction Problem Using a Combination of FEM, BEM with Particular Integrals, Modal Analysis, and Substructuring," by C-S. Tsai, G.C. Lee and R.L. Ketter, 12/31/88, (PB89-207146/AS).
"Optimal Placement of Actuators for Structural Control," by F.Y. Cheng and C.P. Pantelides, 8/15/88, (PB89-162846/AS).
"Teflon Bearings in Aseismic Base Isolation: Experimental Studies and Mathematical Modeling," by A. Mokha, M.C. Constantinou and A.M. Reinhom, 12/5/88, (PB89-218457/AS).
"Seismic Behavior of Flat Slab High-Rise Buildings in the New York City Area," by P. Weidlinger and M. Ettouney, 10/15/88, (PB90-145681/AS).
"Evaluation of the Earthquake Resistance of Existing Buildings in New York City," by P. Weidlinger and M. Ettouney, 10/15/88, to be published.
"Small-Scale Modeling Techniques for Reinforced Concrete Structures Subjected to Seismic Loads," by W. Kim, A. El-Attar and R.N. White, 11/22/88, (PB89-189625/AS).
"Modeling Strong Ground Motion from Multiple Event Earthquakes," by G.W. Ellis and A.S. Cakmak, 10/15/88, (PB89-174445/AS).
"Nonstationary Models of Seismic Ground Acceleration," by M. Grigoriu, S.E. Ruiz and E. Rosenblueth, 7/15/88, (PB89-189617/AS).
"SARCF User's Guide: Seismic Analysis of Reinforced Concrete Frames," by Y.S. Chung, C. Meyer and M. Shinozuka, 11/9/88, (PB89-174452/AS).
"First Expert Panel Meeting on Disaster Research and Planning," edited by l Pantelic and l Stoy1e, 9/15/88, (PB89-174460/AS).
"Preliminary Studies of the Effect of Degrading Infill Walls on the Nonlinear Seismic Response of Steel Frames," by C.Z. Chrysostomou, P. Gergely and IF. Abel, 12/19/88, (PB89-208383/AS).
A-4

NCEER -88-004 7
NCEER-89-0001
NCEER -89-0002
NCEER-89-0003
NCEER-89-0004
NCEER-89-0005
NCEER-89-0006
NCEER-89-0007
NCEER-89-0008
NCEER-89-0009
NCEER-89-R010
NCEER-89-0011
NCEER-89-0012
NCEER-89-0013
NCEER-89-0014
NCEER-89-0015
NCEER-89-0016
NCEER-89-P017
NCEER-89-0017
"Reinforced Concrete Frame Component Testing Facility - Design, Construction, Instrumentation and Operation," by S.P. Pessiki, C. Conley, T. Bond, P. Gergely and R.N. White, 12/16/88, (PB89-174478/AS).
"Effects of Protective Cushion and Soil Compliancy on the Response of Equipment Within a Seismically Excited Building," by I.A. HoLung, 2/16/89, (PB89-207179/AS).
"Statistical Evaluation of Response Modification Factors for Reinforced Concrete Structures," by H.H-M. Hwang and I-W. Jaw, 2/17/89, (PB89-207187/AS).
"Hysteretic Columns Under Random Excitation," by G-Q. Cai and Y.K. Lin, 1/9/89, (PB89-196513/ AS).
"Experimental Study of 'Elephant Foot Bulge' Instability of Thin-Waned Metal Tanks," by Z-H. Iia and R.L. Ketter, 2/22/89, (PB89-207195/AS).
"Experiment on Performance of Buried- Pipelines Across San Andreas Fault," by I. Isenberg, E. Richardson and T.D. O'Rourke, 3/10/89, (PB89-218440/AS).
"A Knowledge-Based Approach to Structural Design of Earthquake-'Resistant Buildings," by M. Subramani, P. Gergely, C.H. Conley, J.F. Abel and A.H. Zaghw, 1/15/89, (PB89-218465/AS).
"Liquefaction Hazards and Their Effects on Buried Pipelines," by T.D. O'Rourke and P.A. Lane, 2/1/89, (PB89-218481).
"Fundamentals of System Identification in Structural Dynamics," by H. Imai, C-E. Yun, O. Maruyama and M. Shinozuka, 1/26/89, (PB89-207211/AS).
"Effects of the 1985 Michoacan Earthquake on Water Systems and Other Buried Lifelines in Mexico," by A.G. Ayala and M.l O'Rourke, 3/8/89, (PB89-207229/AS).
"NCEER Bibliography of Earthquake Education Materials," by K.E.K. Ross, Second Revision, 9/1/89, (PB90-125352/AS).
"Inelastic Three-Dimensional Response Analysis of Reinforced Concrete Building Structures (IDARC-3D), Part I - Modeling," by S.K. Kunnath and A.M. Reinhom, 4/17/89, (PB90-114612/AS).
"Recommended Modifications to ATC-14," by C.D. Poland and I.O. Malley, 4/12/89, (PB90-108648/AS).
"Repair and Strengthening of Beam-to-Column Connections Subjected to Earthquake Loading," by M. Corazao and A.I. Durrani, 2/28/89, (PB90-109885/AS).
"Program EXKAL2 for Identification of Structural Dynamic Systems," by O. Maruyama, C-B. Yun, M. Hoshiya and M. Shinozuka, 5/19/89, (PB90-109877/ AS).
"Response of Frames With Bolted Semi-Rigid Connections, Part I - Experimental Study and Analytical Predictions," by PJ. DiCorso, A.M. Reinhom, I.R. Dickerson, I.E. Radziminski and W.L. Harper, 6/1/89, to be published.
"ARMA Monte Carlo Simulation in Probabilistic Structural Analysis," by P.D. Spanos and M.P. Mignolet, 7/10/89, (PB90-109893/AS).
"Preliminary Proceedings from the Conference on Disaster Preparedness - The Place of Earthquake Education in Our Schools," Edited by K.E.K. Ross, 6/23/89.
"Proceedings from the Conference on Disaster Preparedness - The Place of Earthquake Education in Our Schools," Edited by K.E.K. Ross, 12/31/89, (PB90-207895).
A-5

NCEER-89-0018
NCEER-89-0019
NCEER-89-0020
NCEER-89-0021
NCEER -89-0022
NCEER-89-0023
NCEER-89-0024
NCEER-89-0025
NCEER -89-0026
NCEER-89-0027
NCEER -89-0028
NCEER-89-0029
NCEER-89-0030
NCEER-89-0031
NCEER-89-0032
NCEER-89-0033
NCEER-89-0034
NCEER-89-0035
NCEER-89-0036
"Multidimensional Models of Hysteretic Material Behavior for Vibration Analysis of Shape Memory Energy Absorbing Devices, by E.1 Graesser and F.A. Cozzarelli, 6n189, (PB90-164146/AS).
"Nonlinear Dynamic Analysis of Three-Dimensional Base Isolated Structures (3D-BASIS)," by S. Nagarajaiah, A.M. Reinhom and M.C. Constantinou, 8/3/89, (PB90-161936/AS).
"Structural Control Considering Time-Rate of Control Forces and Control Rate Constraints," by F.Y. Cheng and C.P. Pantelides, 8/3/89, (PB90-120445/AS).
"Subsurface Conditions of Memphis and Shelby County," by K.W. Ng, T-S. Chang and H-H.M. Hwang, 7/26/89, (PB90-120437/AS).
"Seismic Wave Propagation Effects on Straight Jointed Buried Pipelines," by K. Elhmadi and M.J. O'Rourke, 8/24/89, (PB90-162322/AS).
"Workshop on Serviceability Analysis of Water Delivery Systems," edited by M. Grigoriu, 3/6/89, (PB90-127424/AS).
"Shaking Table Study of a 1/5 Scale Steel Frame Composed of Tapered Members," by K.C. Chang, 1S. Hwang and G.C. Lee, 9/18/89, (PB90-160169/AS).
"DYNA1D: A Computer Program for Nonlinear Seismic Site Response Analysis - Technical Documentation," by Jean H. Prevost, 9/~4/89, (PB90-161944/AS).
"1:4 Scale Model Studies of Active Tendon Systems and Active Mass Dampers for Aseismic Protection," by A.M. Reinhom, T.T. Soong, R.C. Lin, Y.P. Yang, Y. Fukao, H. Abe and M. Nakai, 9/15/89, (PB90-173246/AS).
"Scattering of Waves by Inclusions in a Nonhomogeneous Elastic Half Space Solved by Boundary Element Methods," by P.K. Hadley, A. Askar and A.S. Cakmak, 6/15/89, (PB90-145699/AS).
"Statistical Evaluation of Deflection Amplification Factors for Reinforced Concrete Structures," by H.H.M. Hwang, J-W. Jaw and A.L. Ch'ng, 8/31/89, (PB90-164633/AS).
"Bedrock Accelerations in Memphis Area Due to Large New Madrid Earthquakes," by H.H.M. Hwang, C.H.S. Chen and O. Yu, llnJ89, (PB90-162330/AS).
"Seismic Behavior and Response Sensitivity of Secondary Structural Systems," by Y.Q. Chen and T.T. Soong, 10/23/89, (PB90-164658/AS).
"Random Vibration and Reliability Analysis of Primary-Secondary Structural Systems," by Y. Ibrahim, M. Grigoriu and T.T. Soong, 11/10/89, (PB90-161951/AS).
"Proceedings from the Second U.S. - Japan Workshop on Liquefaction, Large Ground Deformation and Their Effects on Lifelines, September 26-29,1989," Edited by T.D. O'Rourke and M. Hamada, 12/1/89, (PB90-209388/AS).
"Deterministic Model for Seismic Damage Evaluation of Reinforced Concrete Structures," by J.M. Bracci, A.M. Reinhom, J.B. Mander and S.K. Kunnath, 9/27/89.
"On the Relation Between Local and Global Damage Indices," by E. DiPasquale and A.S. Cakmak, 8/15/89, (PB90-173865).
"Cyclic Undrained Behavior of Nonplastic and Low Plasticity Silts," by A.J. Walker and H.E. Stewart, 7/26/89, (PB90-183518/AS).
"Liquefaction Potential of Surficial Deposits in the City of Buffalo, New York," by M. Budhu, R. Giese and L. Baumgrass, 1/17/89, (PB90-208455/AS).
A-6

NCEER-89-0037
NCEER-89-0038
NCEER-89-0039
NCEER-89-0040
NCEER-89-0041
NCEER -90-000 1
NCEER-90-0002
NCEER -90-0003
NCEER -90-0004
NCEER-90-0005
NCEER-90-0006
NCEER-90-0007
NCEER-90-0008
NCEER -90-0009
NCEER-90-0010
NCEER-90-0011
NCEER-90-0012
NCEER-90-0013
NCEER-90-0014
NCEER-90-0015
"A Determinstic Assessment of Effects of Ground Motion Incoherence," by A.S. Ve1etsos and Y. Tang, 7/15/89, (PB90-164294/AS).
"Workshop on Ground Motion Parameters for Seismic Hazard Mapping," July 17-18, 1989, edited by R.V. Whitman, 12/1/89, (PB90-173923/AS).
"Seismic Effects on Elevated Transit Lines of the New York City Transit Authority," by C.J. Costantino, C.A. Miller and E. Heymsfield, 12/26/89, (PB90-207887/AS).
"Centrifugal Modeling of Dynamic Soil-Structure Interaction," by K. Weissman, Supervised by J.H. Prevost, 5/10/89, (PB90-207879/AS).
"Linearized Identification of Buildings With Cores for Seismic Vulnerability Assessment," by I-K. Ho and A.E. Aktan, 11/1/89.
"Geotechnical and Lifeline Aspects of the October 17, 1989 Lorna Prieta Earthquake in San Francisco," by T.D. O'Rourke, H.E. Stewart, F.T. Blackburn and T.S. Dickerman, 1/90, (PB90-208596/AS).
"Nonnormal Secondary Response Due to Yielding in a Primary Structure," by D.C.K. Chen and L.D. Lutes, 2/28/90.
"Earthquake Education Materials for Grades K-12," by K.E.K. Ross, 4/16/90.
"Catalog of Strong Motion Stations in Eastern North America," by R.W. Busby, 4/3/90.
"NCEER Strong-Motion Data Base: A User Manuel for the GeoBase Release (Version 1.0 for the Sun3)," by P. Friberg and K. Jacob, 3/31/90.
"Seismic Hazard Along a Crude Oil Pipeline in the Event of an 1811-1812 Type New Madrid Earthquake," by H.H.M. Hwang and C-H.S. Chen, 4/16/90.
"Site-Specific Response Spectra for Memphis Sheahan Pumping Station," by H.H.M. Hwang and C.S. Lee, 5/15/90.
"Pilot Study on Seismic Vulnerability of Crude Oil Transmission Systems," by T. Ariman, R. Dobry, M. Grigoriu, F. Kozin, M. O'Rourke, T. O'Rourke and M. Shinozuka, 5/25/90.
"A Program to Generate Site Dependent Time Histories: EQGEN," by G.W. Ellis, M. Srinivasan and A.S. Cakmak, 1/30/90.
"Active Isolation for Seismic Protection of Operating Rooms," by M.E. Talbott, Supervised by M. Shinozuka, 6/8/9.
"Program UNEARID for Identification of Linear Structural Dynamic Systems," by C-B. Yun and M. Shinozuka, 6/25/90.
"Two-Dimensional Two-Phase Elasto-Plastic Seismic Response of Earth Dams," by A.N. Yiagos, Supervised by J.H. Prevost, 6/20/90.
"Secondary Systems in Base-Isolated Structures: Experimental Investigation, Stochastic Response and Stochastic Sensitivity," by G.D. Manolis, G. Juhn, M.C. Constantinou and A.M. Reinhorn, 7/1/90.
"Seismic Behavior of Lightly-Reinforced Concrete Column and Beam-Column Joint Details," by S.P. Pessiki, C.H. Conley, P. Gergely and R.N. White, 8/22/90.
"Two Hybrid Control Systems for Building Structures Under Strong Earthquakes," by J.N. Yang and A. Danielians, 6/29/90.
A-7

NCEER-90-0016
NCEER-90-0017
NCEER-90-0018
NCEER-90-0019
NCEER-90-0020
NCEER-90-0021
NCEER-90-0022
"Instantaneous Optimal Control with Acceleration and Velocity Feedback," by J.N. Yang and Z. Li, 6/29/90.
"Reconnaissance Report on the Northern Iran Earthquake of June 21,1990," by M. Mehrain, 10/4/90.
"Evaluation of Liquefaction Potential in Memphis and Shelby County," by T.S. Chang, P.S. Tang, C.S. Lee and H. Hwang, 8/10/90.
"Experimental and Analytical Study of a Combined Sliding Disc Bearing and Helical Steel Spring Isolation System," by M.C. Constantinou, AS. Mokha and AM. Reinhorn, 10/4/90.
"Experimental Study and Analytical Prediction of Earthquake Response of a Sliding Isolation System with a Spherical Surface," by AS. Mokha, M.C. Constantinou and A.M. Reinhorn, 10/11/90.
"Dynamic Interaction Factors for Floating Pile Groups," by G. Gazetas, K. Fan, A. Kaynia and E. Kausel, 9/10/90.
"Evaluation of Seismic Damage Indices for Reinforced Concrete Structures," by S. Rodriguez-Gtinez and AS. Cakmak, 9/30/90.
A-8